 XiaoLi Song1†Hui Liu2†Jian Zhu4
 Wei Zhou3,5
 Tao Wang3,5
 Chao Yu3,5
 Lingjuan Zhu3,5
 Xiaoshu Cheng1,3,5
 Huihui Bao1,3,5*
- 1Department of Cardiovascular Medicine, The Second Affifiliated Hospital of Nanchang University, Nanchang, Jiangxi, China
- 2Central Hospital of Huanggang, Huanggang, Hubei, China
- 3Jiangxi Provincial Cardiovascular Disease Clinical Medical Research Center, Nanchang, Jiangxi, China
- 4Qiu Kou Town Central Health Center, Wuyuan, Jiangxi, China
- 5Center for Prevention and Treatment of Cardiovascular Diseases, The Second Affiliated Hospital of Nanchang University, Nanchang, Jiangxi, China
Background: Uncertainty still remained about the relationship between visceral adiposity index (VAI) and hyperuricemia. The aim of this study was to investigate whether VAI was an independent risk factor for hyperuricemia in hypertensive Chinese patients.
Methods: A cross-sectional study including 13176 hypertensive participants (6478 males) recruited from Wuyuan County, Jiangxi province, was conducted. All patients received anthropometric measurements, completed questionnaires and provided blood samples for biochemical testing. VAI was calculated by waist circumference, BMI, triglyceride and high-density lipoprotein cholesterol. Hyperuricemia was defined as serum uric acid ≥ 7 mg/dL in men and ≥ 6 mg/dL in women.
Results: Overall, the average level of uric acid was 7.8 ± 2.0 mg/dL in males and 6.34 ± 1.78 in females and prevalence of hyperuricemia was 61.4% and 51.30%, respectively. In multivariate logistic regression analysis, the risk of hyperuricemia increased 1.77 times and 1.88 times with the increase of ln VAI in males (OR:1.77, 95% CI: 1.62, 1.94) and females (OR:1.88, 95% CI: 1.73, 2.04). For males, compared to quartile 1, the risk of hyperuricemia in the second, third and the forth quartile of visceral adiposity index were 1.34 (95% CI: 1.14, 1.57),1.82(95% CI: 1.54, 2.14) and 2.97 (95% CI: 2.48, 3.57). For females, compared to quartile 1, the risk of hyperuricemia in the second, third and the forth quartile of visceral adiposity index were 1.48 (95% CI: 1.28, 1.72), 1.99 (95% CI: 1.71, 2.32) and 2.92 (95% CI: 2.50, 3.42).
Conclusions: This study found that VAI was an independent risk factor for hyperuricemia among hypertensive patients, which may provide some strategies for reducing the level of uric acid.
Introduction
The improvement of living standards, changes in diet and living habits have gradually increased the incidence of hyperuricemia (1). Hyperuricemia, a critical public health issue, is not only a direct cause of gout, but also a risk factor for many cardiovascular diseases and their risk factors. Accumulated studies have demonstrate that high uric acid was associated with hypertension (2), heart failure (3, 4), diabetes (5), kidney disease (6), stroke (7) and coronary heart disease (8, 9). Moreover, increased uric acid was also an independent predictor of all-cause (10) and cardiovascular death (11). Consequently, it is critical to identify hyperuricemia timely and take measures to prevent disease in clinical practice.
Obesity is regarded as a common risk factor for hyperuricemia. Previous studies reported that some traditional obesity index, such as body mass index (BMI) (12), waist circumference (13), waist height ratio (WHtR) (14) and neck circumference (15) had a impact on serum uric acid metabolism. However, they does not have enough ability to distinguish between muscle and fat accumulation (16), as well as visceral fat and subcutaneous fat (17). In contrast to some traditional adiposity indices, such as body mass index (BMI), waist circumference(WC), in which VAI can take into account the effects of sex, triglycerides, and HDL cholesterol levels on body fat distribution and function, VAI has greatly improved the accuracy of visceral fat and its functional assessment, and is currently a valid index for evaluating metabolic diseases (18). Xiaolin Huang et al. demonstrated that VAI increased the risk of hyperuricemia among middle-aged and elderly Chinese adults (19). Another study consisting of 7632 adult subjects from the China Health and Nutrition Survey 2009 suggested that VAI was closely related to hyperuricemia (20). It has also been confirmed that VAI can predict the risk of hypertension (21). However, there are limited reports to explore the relationship between VAI and hyperuricemia in a population prone to adverse events such as hypertension, and we think it is necessary to clarify the exact association between VAI and hyperuricemia in hypertensive patients.
Methods
Study design and participants
This study was a sub-study of the China H-type Hypertension Registry Study (registration number: CHiCTR1800017274) carried out in Wuyuan County, Jiangxi Province. It was a real world and observational study with the aim of setting up a national H-type hypertension cohort study, investigating the incidence and treatment rate of H-type hypertension in China and evaluating the related risk factors. Those who met the following criteria were considered as qualified: 1) Aged 18 years or older; 2) Diagnosed with hypertension which defined as Systolic blood pressure (SBP)≥140mmHg and/or diastolic blood pressure (DBP) ≥90mmHg; or self-reported history of hypertension; or taking anti-hypertensive drugs); 3) Signing informed consent. From March 2018 to August 2018, our team recruited 14,268 participants altogether in Wuyuan County, Shangrao City, Jiangxi Province, China. Since VAI was calculated on triglycerides and HDL, we excluded patients taking blood lipid-lowering drugs (n=506) in order to avoid the influence of blood lipids itself. In addition, individuals with data missing (n=12) were excluded. 13, 176 participants included in final data analysis (Supplementary Figure 1).
Data collection and measurement
At baseline, participants described the the information about sociodemographic characteristics (marital status, education, occupation), their living habits (smoking, drinking, physical exercise), medical history (hypertension, diabetes, chronic kidney disease, etc.) and medication through questionnaires. Weight, Height, circumference (WC) and hip circumference (HC) were measured by trained staff. Body mass index (BMI) was calculated by dividing body weight (kg) by the square of height (m). Blood pressure measurements for all patients would be performed three times with an electronic sphygmomanometer (Omron; Dalian, China) after 10 minutes of rest. The blood pressure in this study was the average of three blood pressure values. All individuals were informed to keep an empty stomach for more than 10 hours in order to collect their blood samples in the next morning and store them in the Biaojia Biotechnology Laboratory (Shenzhen). Biochemical indicators, including fasting blood glucose (FBG), total cholesterol (TC), triglycerides (TG), low-density lipoprotein cholesterol (LDL-C), high-density lipoprotein cholesterol (HDL-C), serum uric acid (SUA), homocysteine (Hcy) and creatinine were detected in the core laboratory of national kidney disease clinical research center (Guangzhou, China). The newly developed Chronic Kidney Disease-Epidemiology Collaboration equation was used to estimate glomerular filtration rate (22).
Definitions
Hyperuricemia was defined as uric acid ≥ 7 mg/dL in men and ≥ 6 mg/ml in women (23). VAI was calculated according to the following formula (24):
Statistical analysis
All data analysis used R software version 4.0.3 (https://www.R-project.org) and Empower (R) version 3.0 (www.empowerstats.com). A two-sided P < 0.05 was defined as significant differences. In the current study, continuous variables were showed in mean ± standard deviation (SD), while categorical variables were presented as percentage. T-test was used to compare continuous variables and Chi-square for categorical variables. The association between visceral adiposity index and hyperuricemia was assessed by logistic regression model. In detail, the current study constructed three models: unadjusted, partially adjusted (age), and fully adjusted (age, smoking, drinking, SBP, DBP, FBG, TC, LDL-C, eGFR, Hcy, anti-hypertensive drugs, glucose-lowering drugs). Generalized additive model (GAM) and smooth curve fitting (penalized spline method) were preformed to characterize the shape of the association between VAI and hyperuricemia clearly. Due to gender differences in serum uric acid levels, multiple regression and subgroup analysis were performed separately in men and women.
Results
Characteristics of participants
Table 1 listed the baseline characteristics of males according to quartile of VAI. In general, the mean age was 63.79 ± 9.84 years old, and and the prevalence of hyperuricemia was 61.49%. The prevalence of hyperuricemia in first, second, third and fourth quartile was 49.88%, 57.75%, 64.48% and 73.83%, respectively. Patients with higher VAI values seemed to be younger, have higher level of WC, BMI, DBP, FBG, TC, TG, LDL, Hcy, and eGFR, but lower level of SBP, HDL-C. No difference was detected in history of CKD and number of people taking antihypertensive drugs. Table 2 listed the baseline characteristics of females according to quartile of VAI. The mean age was 63.78 ± 8.99 years old, and and the prevalence of hyperuricemia was 51.30%. The prevalence of hyperuricemia in first, second, third and fourth quartile was 36.91%, 48.59%%, 55.56% and 64.14%, respectively. Significant differences were observed in age, drinking, WC, BMI, DBP, FPG, TC, TG, HDL-C, LDL-C and eGFR (all P values < 0.05). No difference was detected in the status of smoking, SBP, history of CKD and stroke.
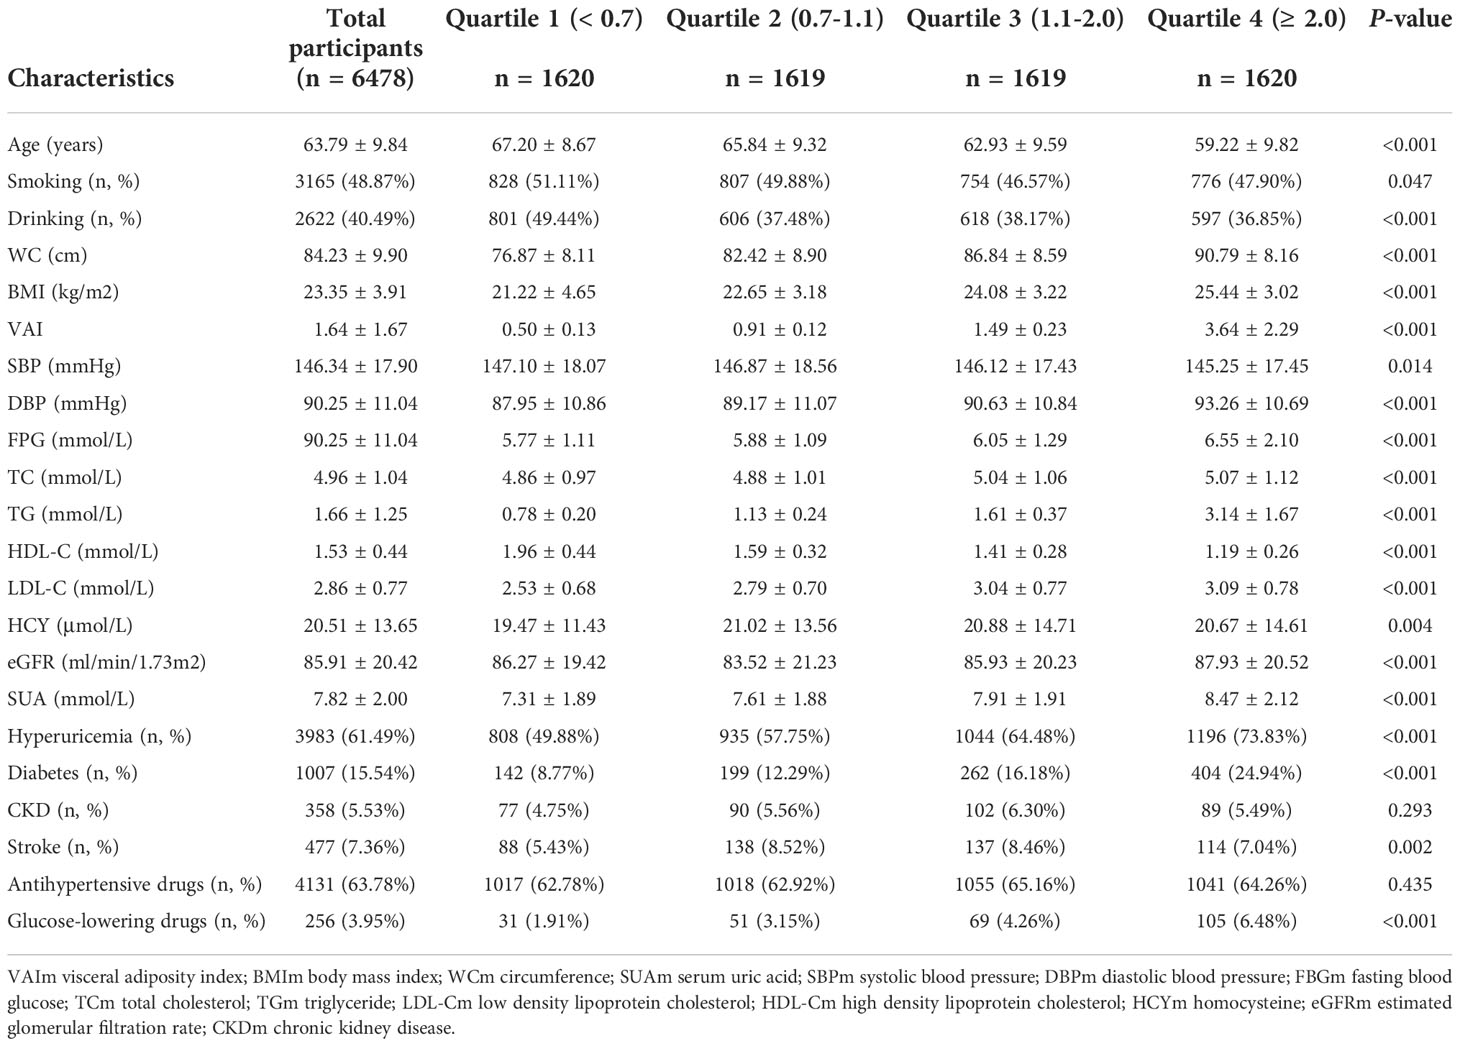
Table 1 Baseline characteristics of study participants across visceral adiposity index (VAI) quartiles in males.
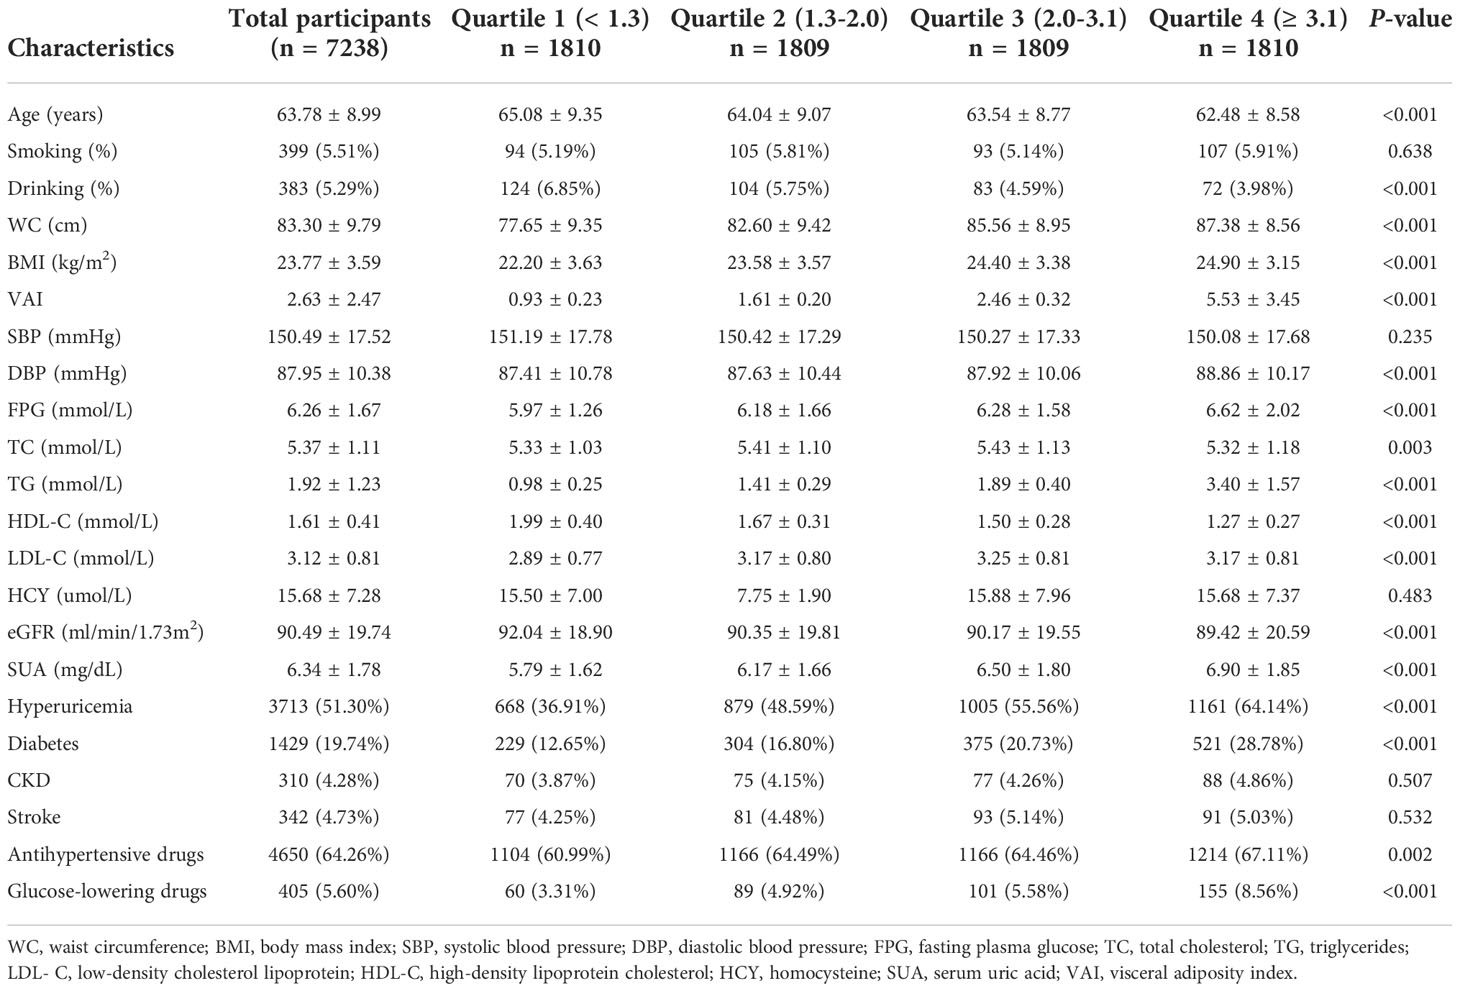
Table 2 Baseline characteristics of study participants across visceral adiposity index (VAI) quartiles in females.
The association between VAI and hyperuricemia
Because of the non normal distribution of VAI, it was transformed by logarithmic function. Table 3 displayed the association between ln VAI and hyperuricemia. For males, the risk of hyperuricemia increased by 70% (95% CI: 1.59, 1.83) for each unit of ln VAI in the unadjusted model. In partially and fully adjusted models, ln VAI was independently associated with hyperuricemia, with adjusted ORs of 1.77 (95% CI: 1.65, 1.91) and 1.77 (95% CI: 1.62, 1.94), respectively (P for trend <0.001). When ln VAI was converted from a continuous variable to a categorical variable, the relative risk of hyperuricemia in the second, the third, the fourth quartiles were 1.34 (95% CI:1.14, 1.57), 1.82 (95% CI: 1.54, 2.14) and 2.97 (95% CI: 2.48, 3.57) compared to first quartile. For females, the risk of hyperuricemia in the unadjusted model, partially adjusted model and fully adjusted model increased by 1.89times, 1.98 times and 1.88 times, respectively. The relative risk of hyperuricemia in the second, the third, the fourth quartiles were 1.48 (95% CI:1.28, 1.72), 1.99 (95% CI: 1.71, 2.32) and 2.92 (95%CI: 2.50, 3.42) compared to those in first quartile (P for trend <0.001). Figures 1, 2 showed the association between ln VAI and hyperuricemia clearly using smooth curves in males and females. In addition, we also found that WC and BMI were positively associated with hyperuricemia in hypertensive patients regardless of men and women in the logistic regression model between WC and BMI with hyperuricemia, and the prevalence of hyperuricemia increased with increasing WC and BMI (Supplementary Tables 1, 2). Subsequently, we found that the area under curve(AUC) of these three obesity measures for the presence of hyperuricemia were 0.615, 0.588, 0.576 in men (Supplementary Figure 2) and 0.620, 0.606, 0.588 in female (Supplementary Figure 3), it shows that the correlation between VAI and hyperuricemia is strongest in both female and male.
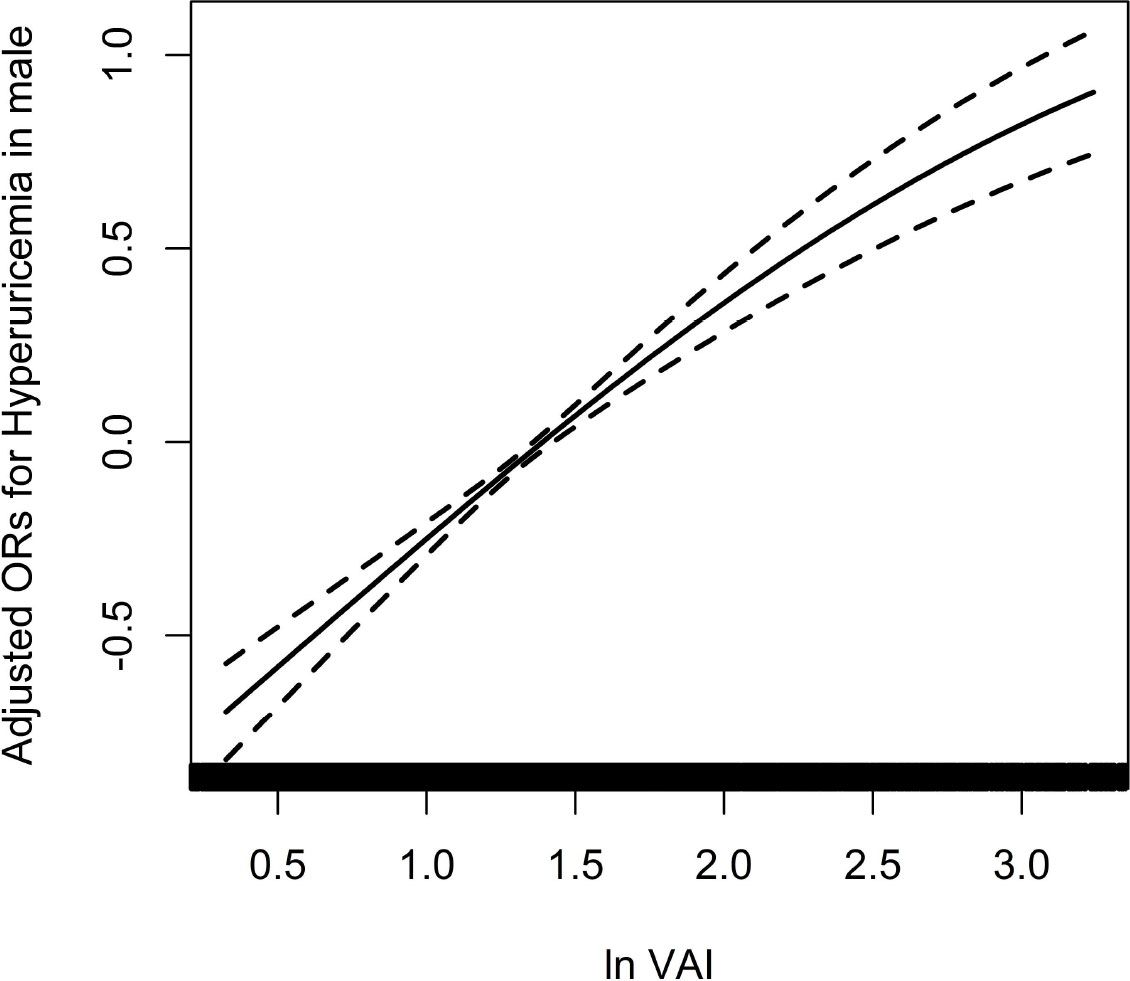
Figure 1 Association between ln VAI and hyperuricemia in males adjusted for age, smoking, drinking, BMI, SBP, DBP, TC, LDL-C, Hcy, eGFR, anti-hypertensive drugs, glucose-lowering drugs.
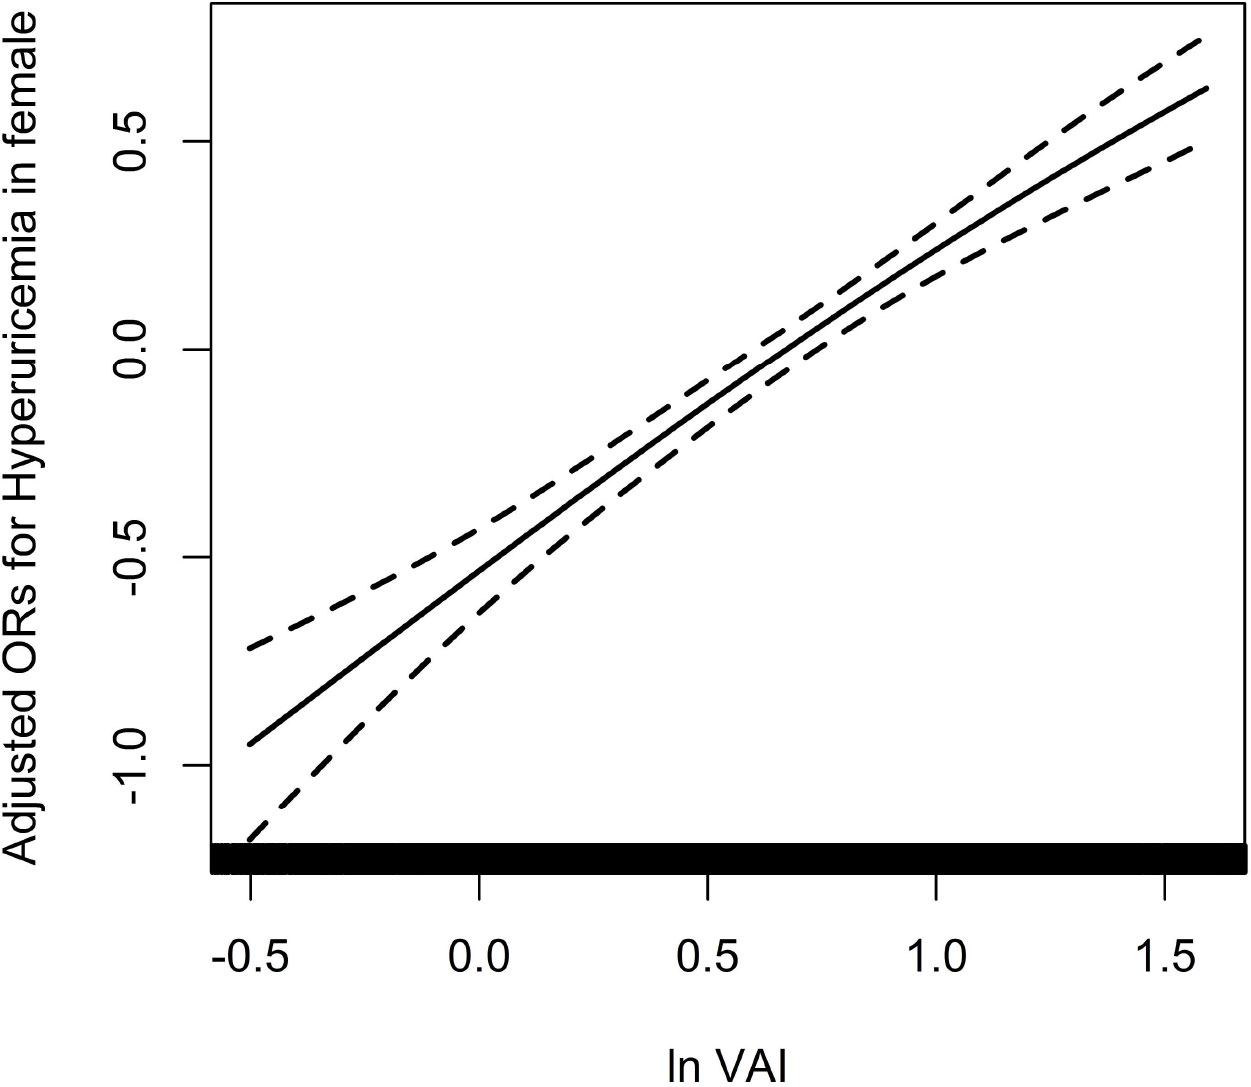
Figure 2 Association between ln VAI and hyperuricemia in females adjusted for age, smoking, drinking, BMI, SBP, DBP, TC, LDL-C, Hcy, eGFR, anti-hypertensive drugs, glucose-lowering drugs.
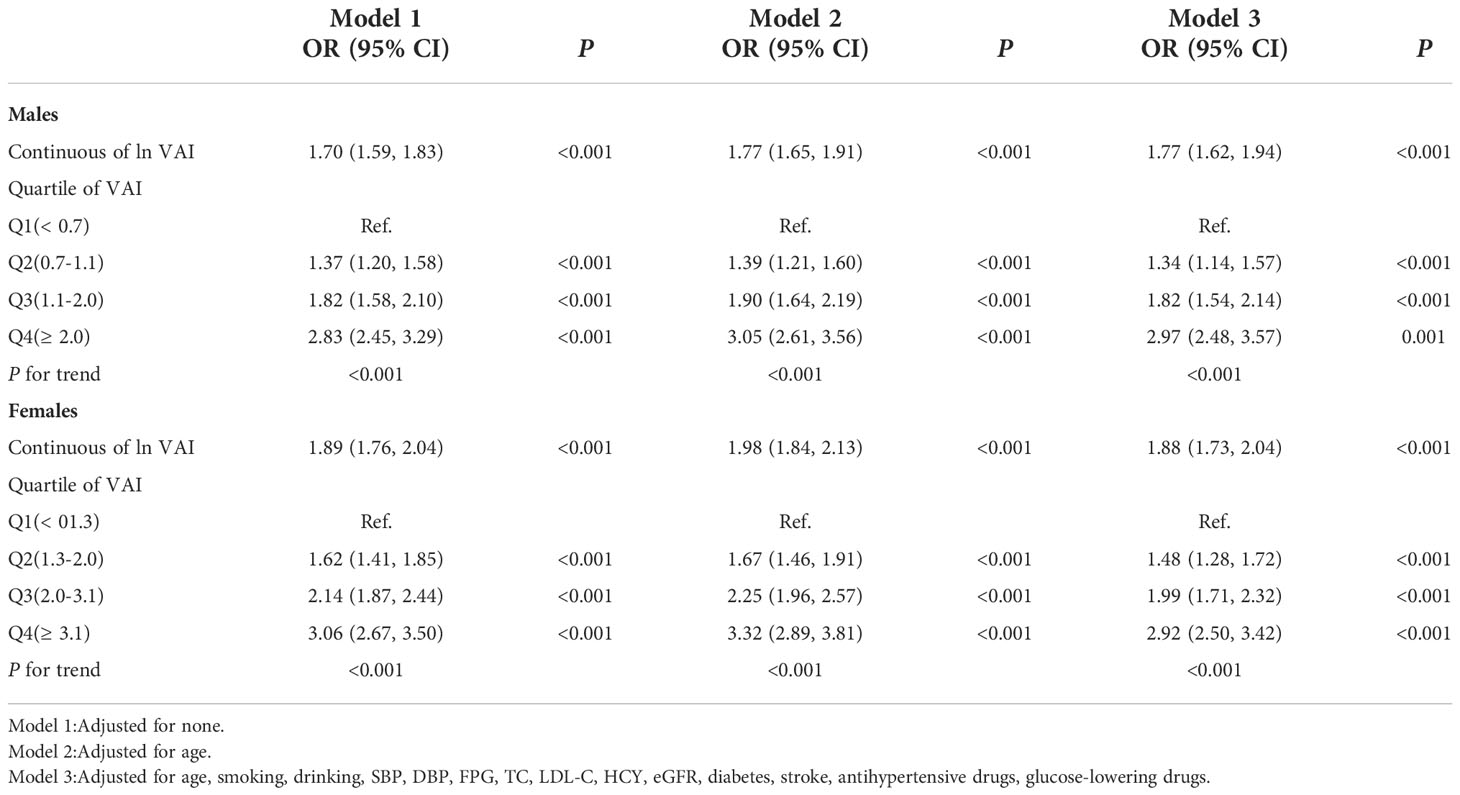
Table 3 Odds ratios and 95% CIs for hyperuricemia according to VAI as continuous variables and quartiles.
Subgroup analysis
For the stability of the results, subgroup analysis Figures 3, 4 were conducted. Selected subgroups were as follows: age (<65, ≥ 65 years), smoking (no, yes), drinking (no, yes), SBP (<140, ≥ 140mmHg), DBP (<90, ≥ 90 mmHg), Hcy (low, high), eGFR (<60, ≥ 60 ml/min/1.73m2) and antihypertensive drugs (no, yes) (all P for interaction > 0.05).
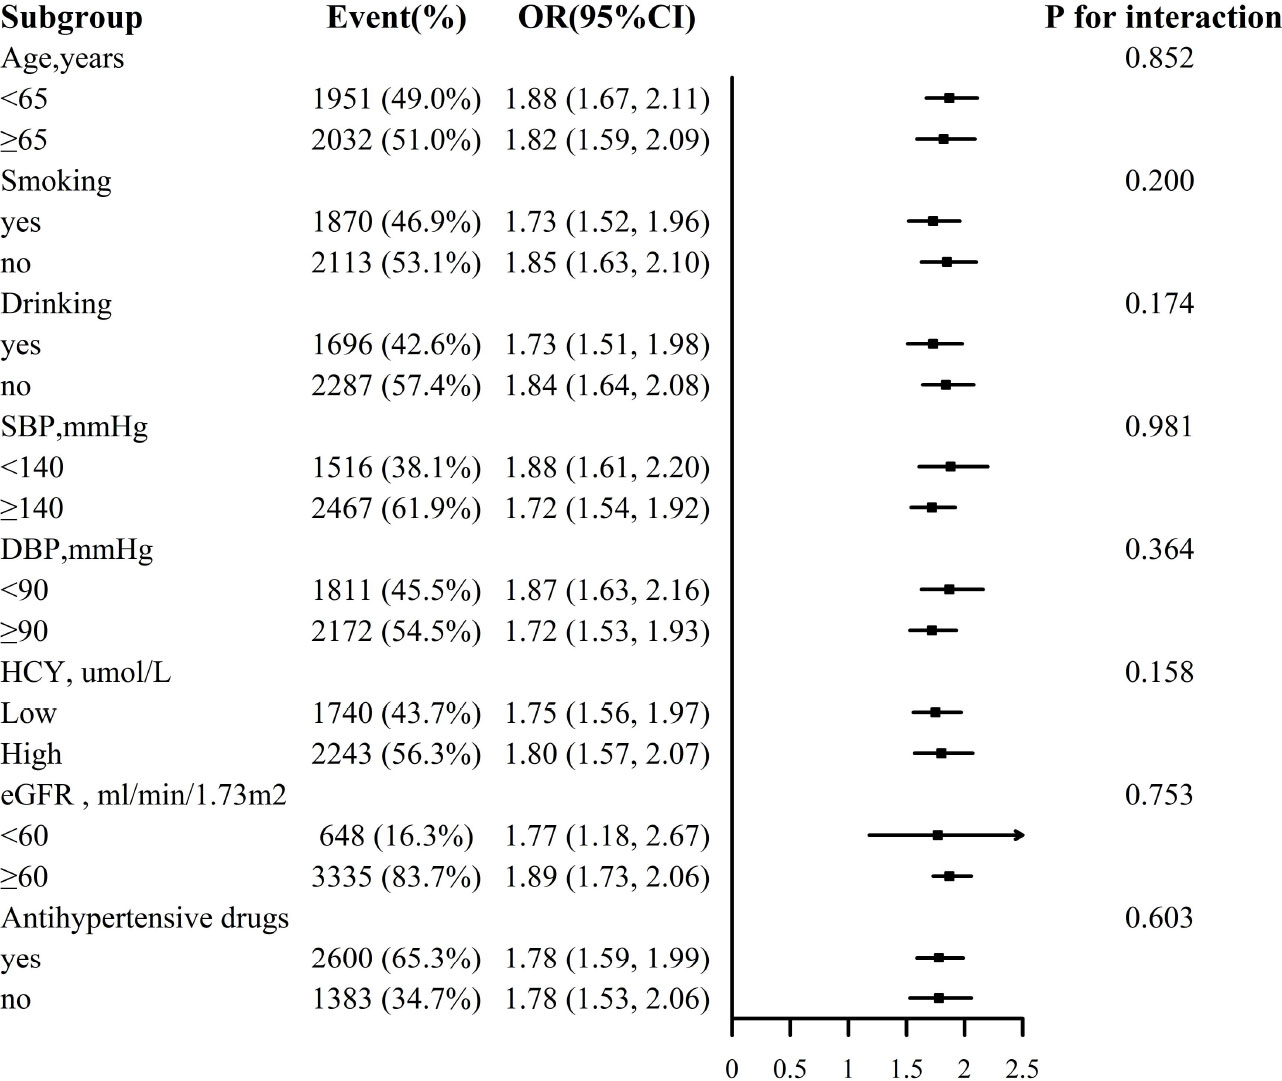
Figure 3 Association between ln VAI and hyperuricemia in males in various subgroups. The models adjusted for age, smoking, drinking, BMI, SBP, DBP, TC, LDL-C, HDL, HCY, eGFR, anti-hypertensive drugs, glucose-lowering drugs except for the stratify.
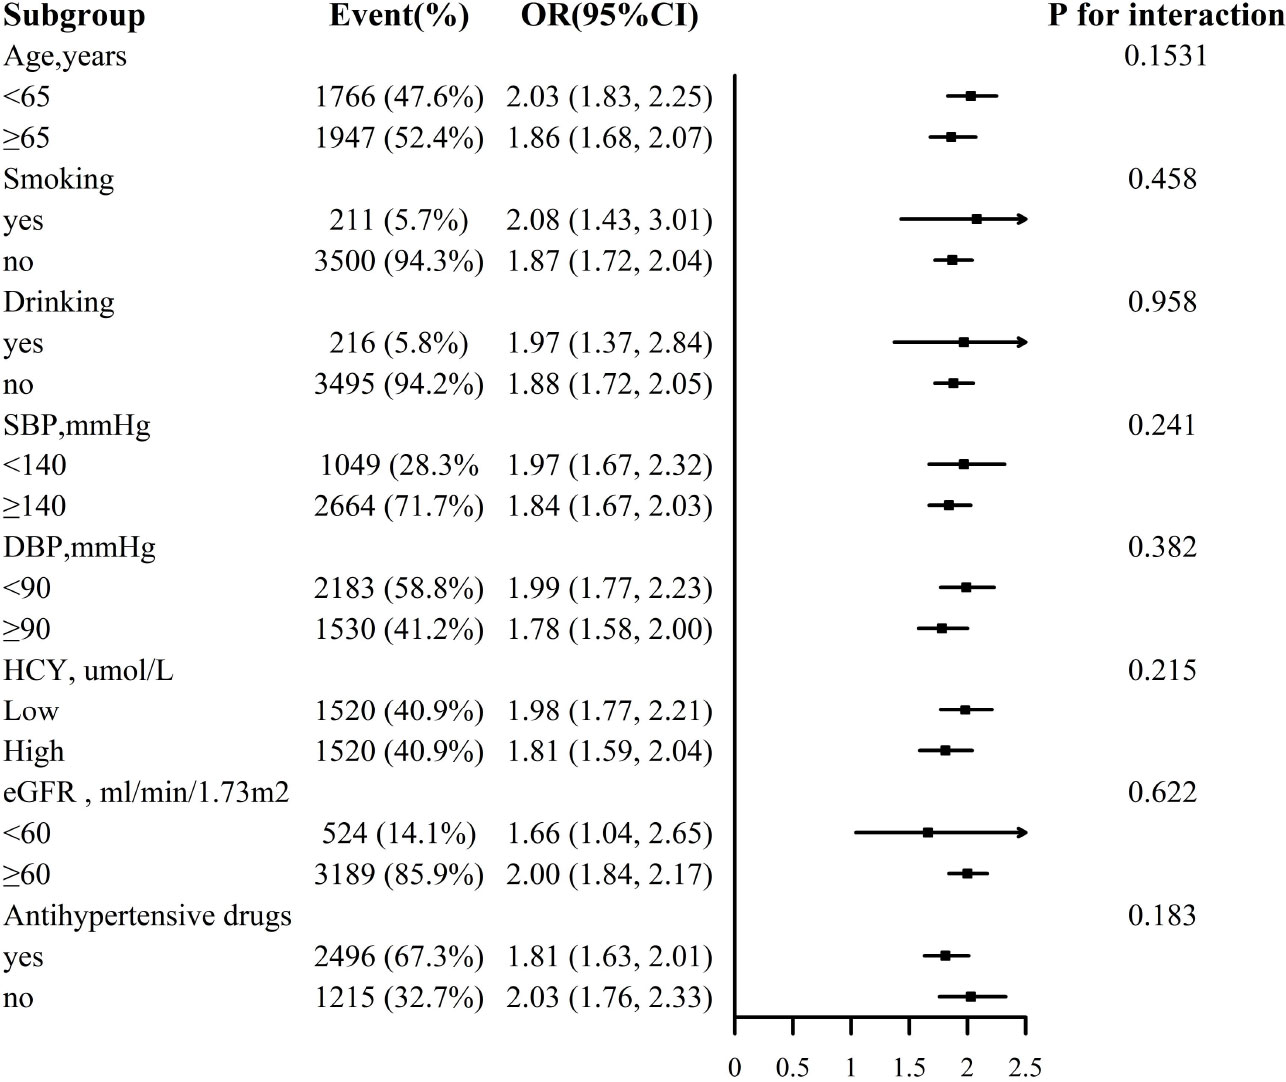
Figure 4 Association between ln VAI and hyperuricemia in females in various subgroups. The models adjusted for age, smoking, drinking, BMI, SBP, DBP, TC, LDL-C, HDL, HCY, eGFR, anti-hypertensive drugs, glucose-lowering drugs except for the stratify.
Discussion
In this large-scale cross-sectional study, we found that VAI was positively associated with hyperuricemia in hypertensive patients. The prevalence of hyperuricemia increased with the increase of VAI. This result might provide a strategy for individuals to reduce uric acid.
According to an epidemiological study in the coastal areas of southeast China, the prevalence of hyperuricemia was 32.4% (25), meanwhile the prevalence of hyperuricemia in the current study was more than 50% in both men and women, which indicating the increasing trend of hyperuricemia.
Previous studies had reported that some obesity traditional indices, such as BMI, WC and waist to height ratio, were associated with hyperuricemia (12, 14, 26). Even earlier, studies had reported the effect of visceral fat accumulation on hyperuricemia and demonstrated that visceral fat was a stronger factor than BMI (27). In recent years, study began to focus on the association between adiposity indices and hyperuricemia. A cross-sectional research involving 633 individuals of health check-up demonstrated that VAI was a better indicator of hyperuricemia than waist circumference. The area under receiver operating characteristic curve of VAI and WC were 0.618 and 0.556, respectively (28, 29). Huimin Dong et al. recruited 7632 adult subjects from the China Health and Nutrition Survey 2009 to investigate whether VAI was independent of hyperuricemia. It turned out that VAI was significantly associated with hyperuricemia, independent of metabolic health and obesity phenotypes (20). In addition, VAI was reported to modify the relationship between urinary albumin/creatinine ratio and serum uric acid. In this study of patients with hypertensive but normal renal function, the risk of hyperuricemia increased with the increase of VAI. However, not all research results were consistent. A study of 174698 adults analyzed the relationship between multiple nontraditional adiposity indices and hyperuricemia, and found a negative correlation between VAI and hyperuricemia (30). The reasons for the discrepancy in results may be attributed to the study population, sample size, statistical analysis, and adjustment factors.
In the current study of hypertensive patients, we found that VAI, an obesity index, was associated with hyperuricemia. The possible mechanisms of hyperuricemia were as follows. First of all, as a hypertensive population, renal microvascular damage and renal ischemia caused by hypertension itself can lead to decreased uric acid excretion and increased production (9). Then, the possible mechanisms of increased risk of hyperuricemia caused by VAI include the following aspects. (1) poor dietary habits and changes in dietary components can lead to obesity. As shown in Table 1, patients with high VAI had higher level of BMI and fasting glucose, and higher prevalence of dyslipidemia and hyperuricemia. This suggested that the increase of visceral fat was often accompanied by the metabolic disorder of blood glucose, blood lipid and uric acid. Second, obesity patients tended to be excessive of energy intake, resulting in increased purine synthesis and uric acid production. (2) Fatty acid metabolites could inhibit the excretion of uric acid and promote the increase of serum uric acid level indirectly. (3) Obesity was often associated with insulin resistance, which acted on the kidney and increased uric acid reabsorption and decrease excretion of uric acid, leading to hyperuricemia finally (31, 32). (4) Some obesity-related adipocytokines, such as adiponectin and leptin, have been reported to be associated with hyperuricemia (33, 34). However, the specific physiological mechanism still needs to be confirmed.
Our highlight was the first study to explore the relationship between VAI and hyperuricemia in Chinese hypertensive patients. In addition, large sample size, accurate statistical methods and strict adjustment of confusion factors ensured the reliability of the results. Certainly, some limitations of this study could not be ignored. First, it was not cautious to established causal inference because of the cross-sectional nature of our study and further prospective studies are needed to explain the exact role of visceral fat accumulation in metabolism of serum uric acid and progression of hyperuricemia. Secondly, present study only evaluated the relationship between VAI and hyperuricemia in Chinese hypertensive patients, whose results might not be extrapolated to other populations. Finally, we did not consider the effect of diet and drugs on serum uric acid level due to the limitation of data.
To sum up, this study demonstrated that VAI was closely related to hyperuricemia in hypertensive patients, which might provide a strategy for reducing uric acid in for obesity patients in clinical practices.
Data availability statement
The datasets presented in this article are not readily available because data access is obtained according to individual contributions to the study. Requests to access the datasets should be directed to the corresponding authors. Requests to access these datasets should be directed to XC, eGlhb3NodW1lbmZhbjEyNkAxNjMuY29t.
Ethics statement
The study was conducted in accordance with the Declaration of Helsinki and was approved by the Ethics Committee of the Anhui Medical University Biomedical Institute. The patients/participants provided their written informed consent to participate in this study.
Author contributions
All authors contributed to: (1) substantial contributions to conception and design, or acquisition of data, or analysis and interpretation of data, (2) drafting the article or revising it critically for important intellectual content, and, (3) final approval of the version to be published. All authors contributed to the article and approved the submitted version.
Funding
This work was supported by the Jiangxi Science and Technology Innovation Platform Project (20165BCD41005), Jiangxi Provincial Natural Science Foundation (20212ACB206019), Science and Technology Innovation Base Construction Project (20221ZDG02010), Key R&D Projects, Jiangxi (20203BBGL73173), Jiangxi Provincial Health Commission Science and Technology Project (20204241,202130440,202210495,202310528), Jiangxi Provincial Drug Administration Science and Technology Project (2022JS41), Fund project of the Second Affiliated Hospital of Nanchang University (2016YNQN12034, 2019YNLZ12010, 2021efyA01, 2021YNFY2024.
Acknowledgments
The authors thank all the participating authors for their contributions to this article.
Conflict of interest
The authors declare that the research was conducted in the absence of any commercial or financial relationships that could be construed as a potential conflict of interest.
Publisher’s note
All claims expressed in this article are solely those of the authors and do not necessarily represent those of their affiliated organizations, or those of the publisher, the editors and the reviewers. Any product that may be evaluated in this article, or claim that may be made by its manufacturer, is not guaranteed or endorsed by the publisher.
Supplementary material
The Supplementary Material for this article can be found online at: https://www.frontiersin.org/articles/10.3389/fendo.2022.1038971/full#supplementary-material
Supplementary Figure 1 | Flow charts of participants.
Supplementary Figure 2 | ROC curves for incident hyperuricemia comparing VAI, BMI, and WC in female.
Supplementary Figure 3 | ROC curves for incident hyperuricemia comparing VAI, BMI, and WC in male.
Supplementary Table 1 | Odds ratios and 95% CIs for hyperuricemia according to WC as continuous variables and quartiles
Supplementary Table 2 | Odds ratios and 95% CIs for hyperuricemia according to BMI as continuous variables and quartiles.
Abbreviations
VAI, visceral adiposity index; BMI, body mass index; WC, circumference; SUA, serum uric acid; SBP, systolic blood pressure; DBP, diastolic blood pressure; FBG, fasting blood glucose; TC, total cholesterol; TG, triglyceride; LDL-C, low density lipoprotein cholesterol; HDL-C, high density lipoprotein cholesterol; HCY, homocysteine; eGFR, estimated glomerular filtration rate; CKD, chronic kidney disease.
References
1. Liu H, Zhang XM, Wang YL, Liu BC. Prevalence of hyperuricemia among Chinese adults: a national cross-sectional survey using multistage, stratified sampling. J Nephrol (2014) 27(6):653–8. doi: 10.1007/s40620-014-0082-z
2. Krishnan E. Interaction of inflammation, hyperuricemia, and the prevalence of hypertension among adults free of metabolic syndrome: NHANES 2009-2010. J Am Heart Assoc (2014) 3(2):e000157. doi: 10.1161/JAHA.113.000157
3. Mackenzie IS, Ford I, Walker A, Hawkey C, Begg A, Avery A. Multicentre, prospective, randomised, open-label, blinded end point trial of the efficacy of allopurinol therapy in improving cardiovascular outcomes in patients with ischaemic heart disease: protocol of the ALL-HEART study. BMJ Open (2016) 6(9):e013774. doi: 10.1136/bmjopen-2016-013774
4. Palazzuoli A, Ruocco G, De Vivo O, Nuti R, McCullough PA. Prevalence of hyperuricemia in patients with acute heart failure with either reduced or preserved ejection fraction. Am J Cardiol (2017) 120(7):1146–50. doi: 10.1016/j.amjcard.2017.06.057
5. Juraschek SP, McAdams-Demarco M, Miller ER, Gelber AC, Maynard JW, Pankow JS, et al. Temporal relationship between uric acid concentration and risk of diabetes in a community-based study population. Am J Epidemiol (2014) 179(6):684–91. doi: 10.1093/aje/kwt320
6. Rodenbach KE, Schneider MF, Furth SL, Moxey-Mims MM, Mitsnefes MM, Weaver DJ, et al. Hyperuricemia and progression of CKD in children and adolescents: The chronic kidney disease in children (CKiD) cohort study. Am J Kidney Dis (2015) 66(6):984–92. doi: 10.1053/j.ajkd.2015.06.015
7. Zhong C, Zhong X, Xu T, Xu T, Zhang Y. Sex-specific relationship between serum uric acid and risk of stroke: A dose-response meta-analysis of prospective studies. J Am Heart Assoc (2017) 6(4). doi: 10.1161/JAHA.116.005042
8. Tikal K. [Discussion of the article by m. vichnar: Experience with the administration of group b vitamins to children with hyperkinetic syndrome]. Cesk Psychiatr (1989) 85(3):204–6.
9. Li Q, Zhang Y, Cao J, Zhang J, Nie J, Liang M, et al. Degree of blood pressure control and the risk of new-onset hyperuricemia in treated hypertensive patients. Ann Transl Med (2020) 8(21):1434. doi: 10.21037/atm-20-3017
10. Cho SK, Chang Y, Kim I, Ryu S. U-Shaped association between serum uric acid level and risk of mortality: A cohort study. Arthritis Rheumatol (2018) 70(7):1122–32. doi: 10.1002/art.40472
11. Kleber ME, Delgado G, Grammer TB, Silbernagel G, Huang J, Krämer BK, et al. Uric acid and cardiovascular events: A mendelian randomization study. J Am Soc Nephrol (2015) 26(11):2831–8. doi: 10.1681/ASN.2014070660
12. Zhang N, Chang Y, Guo X, Chen Y, Ye N, Sun Y, et al. A body shape index and body roundness index: Two new body indices for detecting association between obesity and hyperuricemia in rural area of China. Eur J Intern Med (2016) 29:32–6. doi: 10.1016/j.ejim.2016.01.019
13. Zhang ZQ, Deng J, He LP, Ling WH, Su YX, Chen YM, et al. Comparison of various anthropometric and body fat indices in identifying cardiometabolic disturbances in Chinese men and women. PloS One (2013) 8(8):e70893. doi: 10.1371/journal.pone.0070893
14. Huang ZP, Huang BX, Zhang H, Zhu MF, Zhu HL, et al. Waist-to-Height ratio is a better predictor of hyperuricemia than body mass index and waist circumference in Chinese. Ann Nutr Metab (2019) 75(3):187–94. doi: 10.1159/000504282
15. Jiang J, Cui J, Yang X, Wang A, Mu Y, Dong L, et al. Neck circumference, a novel indicator for hyperuricemia. Front Physiol (2017) 8:965. doi: 10.3389/fphys.2017.00965
16. Nevill AM, Stewart AD, Olds T, Holder R. Relationship between adiposity and body size reveals limitations of BMI. Am J Phys Anthropol (2006) 129(1):151–6. doi: 10.1002/ajpa.20262
17. Burton JO, Gray LJ, Webb DR, Davies MJ, Khunti K, Crasto W, et al. Association of anthropometric obesity measures with chronic kidney disease risk in a non-diabetic patient population. Nephrol Dial Transplant (2012) 27(5):1860–6. doi: 10.1093/ndt/gfr574
18. Yamada A, Sato KK, Kinuhata S, Uehara S, Endo G, Hikita Y, et al. Association of visceral fat and liver fat with hyperuricemia. Arthritis Care Res (Hoboken) (2016) 68(4):553–61. doi: 10.1002/acr.22729
19. Cai W, Cai B, Zhou J, Chen Y, Zhang J, Huang Y, et al. Comparison of efficacy and safety among axitinib, sunitinib, and sorafenib as neoadjuvant therapy for renal cell carcinoma: a retrospective study. Cancer Commun (Lond) (2019) 39(1):56. doi: 10.1186/s40880-019-0405-5
20. Dong H, Xu Y, Zhang X, Tian S. Visceral adiposity index is strongly associated with hyperuricemia independently of metabolic health and obesity phenotypes. Sci Rep (2017) 7(1):8822. doi: 10.1038/s41598-017-09455-z
21. Fan Y, He D, Liu S, Qiao Y, Gao H, Xin L, et al. Association between visceral adipose index and risk of hypertension in a middle-aged and elderly Chinese population. Nutr Metab Cardiovasc Dis (2021) 31(8):2358–65. doi: 10.1016/j.numecd.2021.04.024
22. Levey AS, Stevens LA, Schmid CH, Zhang YL, Castro AF 3rd, Feldman HI, et al. A new equation to estimate glomerular filtration rate. Ann Intern Med (2009) 150(9):604–12. doi: 10.7326/0003-4819-150-9-200905050-00006
23. Feig DI, Kang DH, Johnson RJ. Uric acid and cardiovascular risk. N Engl J Med (2008) 359(17):1811–21. doi: 10.1056/NEJMra0800885
24. Chen C, Xu Y, Guo ZR, Yang J, Wu M, Hu XS, et al. The application of visceral adiposity index in identifying type 2 diabetes risks based on a prospective cohort in China. Lipids Health Dis (2014) 13:108. doi: 10.1186/1476-511X-13-108
25. Yang X, Xiao Y, Liu K, Jiao X, Lin X, Wang Y, et al. Prevalence of hyperuricemia among the Chinese population of the southeast coastal region and association with single nucleotide polymorphisms in urateanion exchanger genes: SLC22A12, ABCG2 and SLC2A9. Mol Med Rep (2018) 18(3):3050–8. doi: 10.3892/mmr.2018.9290
26. Lee MF, Liou TH, Wang W, Pan WH, Lee WJ, Hsu CT, et al. Gender, body mass index, and PPARgamma polymorphism are good indicators in hyperuricemia prediction for han Chinese. Genet Test Mol Biomarkers (2013) 17(1):40–6. doi: 10.1089/gtmb.2012.0231
27. Matsuura F, Yamashita S, Nakamura T, Nishida M, Nozaki S, Funahashi T, et al. Effect of visceral fat accumulation on uric acid metabolism in male obese subjects: visceral fat obesity is linked more closely to overproduction of uric acid than subcutaneous fat obesity. Metabolism (1998) 47(8):929–33. doi: 10.1016/S0026-0495(98)90346-8
28. Takahashi S, Yamamoto T, Tsutsumi Z, Moriwaki Y, Yamakita J, Higashino K, et al. Close correlation between visceral fat accumulation and uric acid metabolism in healthy men. Metabolism (1997) 46(10):1162–5. doi: 10.1016/S0026-0495(97)90210-9
29. Gu D, Ding Y, Zhao Y, Miao S, Qu Q. Positively increased visceral adiposity index in hyperuricemia free of metabolic syndrome. Lipids Health Dis (2018) 17(1):101. doi: 10.1186/s12944-018-0761-1
30. Liu XZ, Li HH, Huang S, Zhao DB. Association between hyperuricemia and nontraditional adiposity indices. Clin Rheumatol (2019) 38(4):1055–62. doi: 10.1007/s10067-018-4374-x
31. Adnan E, Rahman IA, Faridin HP. Relationship between insulin resistance, metabolic syndrome components and serum uric acid. Diabetes Metab Syndr (2019) 13(3):2158–62. doi: 10.1016/j.dsx.2019.04.001
32. Miao Z, Yan S, Wang J, Wang B, Li Y, Xing X. Insulin resistance acts as an independent risk factor exacerbating high-purine diet induced renal injury and knee joint gouty lesions. Inflammation Res (2009) 58(10):659–68. doi: 10.1007/s00011-009-0031-9
33. Tamba S, Nishizawa H, Funahashi T, Okauchi Y, Ogawa T, Noguchi M, et al. Relationship between the serum uric acid level, visceral fat accumulation and serum adiponectin concentration in Japanese men. Intern Med (2008) 47(13):1175–80. doi: 10.2169/internalmedicine.47.0603
Keywords: visceral adiposity index, uric acid, hyperuricemia, hypertension, obesity
Citation: Song X, Liu H, Zhu J, Zhou W, Wang T, Yu C, Zhu L, Cheng X and Bao H (2022) The elevated visceral adiposity index increases the risk of hyperuricemia in Chinese hypertensive patients: A cross-sectional study. Front. Endocrinol. 13:1038971. doi: 10.3389/fendo.2022.1038971
Received: 07 September 2022; Accepted: 24 November 2022;
Published: 15 December 2022.
Edited by:
Yun Kyung Cho, Asan Medical Center, South KoreaReviewed by:
Gu Dongfeng, Zhengzhou People’s Hospital, ChinaLuis Rodrigo Macias Kauffer, Hospital Regional de Alta Especialidad de Ixtapaluca, Mexico
Copyright © 2022 Song, Liu, Zhu, Zhou, Wang, Yu, Zhu, Cheng and Bao. This is an open-access article distributed under the terms of the Creative Commons Attribution License (CC BY). The use, distribution or reproduction in other forums is permitted, provided the original author(s) and the copyright owner(s) are credited and that the original publication in this journal is cited, in accordance with accepted academic practice. No use, distribution or reproduction is permitted which does not comply with these terms.
*Correspondence: Huihui Bao, aHVpaHVpX2Jhbzc3QDEyNi5jb20=
†These authors have contributed equally to this work and share first authorship