 Ting-ting Zhang1†
 Jing Zeng1†
 Yan Yang1†
 Jin-jing Wang1Yao-jie Kang1Dong-he Zhang2
 Xiao-zhu Liu3Kang Chen4*
 Xuan Wang1*Yi Fang1*
- 1Department of Endocrinology, The Fifth Medical Center of Chinese PLA General Hospital, Beijing, China
- 2Department of Day Clinic, The Fifth Medical Center of Chinese People's Liberation Army (PLA) General Hospital, Beijing, China
- 3Department of Cardiology, The Second Affiliated Hospital of Chongqing Medical University, Chongqing, China
- 4Department of Endocrinology, The First Medical Center of Chinese People's Liberation Army (PLA) General Hospital, Beijing, China
Objective: Thyroid cancer (TC) is a common malignancy with a poor prognosis with aging. However, no accurate predictive survival model exists for patients with geriatric TC.We aimed to establish prediction models of prognosis in elderly TC.
Methods: We retrospectively reviewed the clinicopathology characteristics of patients with geriatric TC in the Surveillance, Epidemiology, and End Results database (SEER) from 2004 to 2018. The risk predictors used to build the nomograms were derived from the Cox proportional risk regression. These nomograms were used to predict 1-, 3-, and 5-year overall survival and cancer-specific survival in elderly patients with TC. The accuracy and discriminability of the new model were evaluated by the consistency index (C-index) and calibration curve. The clinical applicability value of the model was assessed using the decision curve analysis.
Results: We used the SEER database to include 16475 patients with geriatric TC diagnosed from 2004 to 2018. The patients from 2004 to 2015 were randomly sorted out on a scale of 7:3. They were classified into a training group (n = 8623) and a validation group (n = 3669). Patients with TC diagnosed in 2016–2018 were classified into external validation groups (n = 4183). The overall survival nomogram consisted of 10 variables (age, gender, marital status, histologic type, grade, TNM stage, surgery status, and tumor size). A cancer-specific survival nomogram consisted of eight factors (age, tumor size, grade, histologic type, surgery, and TNM stage). The C-index values for the training, validation, and external validation groups were 0.775 (95% confidence interval [CI] 0.785–0.765), 0.776 (95% CI 0.792–0.760), and 0.895(95% CI 0.873–0.917), respectively. The overall survival was consistent with a nomogram based on the calibration curve. Besides, the decision curve analysis showed excellent clinical application value of the nomogram. Additionally, we found that surgery could improve the prognosis of patients with geriatric at high-risk (P < 0.001) but not those at low-risk (P = 0.069).
Conclusion: This was the first study to construct predictive survival nomograms for patients with geriatric TC. The well-established nomograms and the actual results could guide follow-up management strategies.
Introduction
Undoubtedly one of the most common endocrine cancers is thyroid carcinoma (TC) (1). Despite its steady disease-specific mortality (0.5/100,000) (2), the TC incidence rate over the past 20 years has increased by approximately 2.5 times (5.57/100,000-13.98/100,000) (3). By 2030, TC is anticipated to be the fourth most prevalent cancer in the USA (4). However, the South Korean experience indicates that they will need to discourage early thyroid cancer discovery if they wish to stop their own “epidemic”.Vital statistics and cancer registry data for South Korea illustrate the effect of thyroid-cancer screening since 1999. Thyroid-cancer incidence increased rapidly after the turn of the century In 2011, the rate of thyroid-cancer diagnoses was 15 times that observed in 1993. This entire increase can be attributed to the detection of papillary thyroid cancer. Furthermore, despite the dramatic increase in incidence, mortality from thyroid cancer remains stable — a combination that is pathognomonic for over diagnosis (5).
With the continuously improved cancer prevention and treatment, the population aged ≥65 years will rise from 15% to 21% by 2030 in USA (6). In 2000, Americans aged ≥80 years represented approximately 3.3% of the population, which is expected to show a 2-fold increase by 2050 (7). Given the advanced age of patients with TC, we must consider the challenges that may arise as a direct result. In the 2015 Korean Central Cancer Registry, thyroid cancer was reported to be the fourth most common cancer in women aged 65 years or older (8).Recent literature shows that particularly poor prognosis is associated with age greater than 60 years (9, 10).Additionally, older individuals typically have more advanced-stage, aggressive, and widespread TC (11). Elderly individuals with TC often have follicular histology, vascular invasion, and extrathyroidal extension (12).In fact, Anaplastic thyroid cancer (ATC) is relatively more common with advanced age (13–16).. In several studies, older patients have had large volume tumor, lymph node metastasis, and distant metastasis at diagnosis and recurrence (17, 18). The survival rate was independently associated with a poorer prognosis starting at 60 years; elderly patients >70 years had the worst prognosis (12)..
TC has a satisfying good prognosis, with an average survival rate of 10 years for 90% of patients (19, 20). The median age of death for patients with TC is 73 years, and >70% of the deaths occur when patients are aged ≥65 years (21). A risk stratification technique that can enhance outcomes is required to predict overall survival (OS) for older patients with TC due to the limits of available treatment choices. Within this context, TNM staging can be used to determine the clinical staging of patients with cancer. However, the TNM classification is still insufficient in covering tumor biology and predicting all TC outcomes and treatment decisions made by elderly patients.
Nomograms have proved superior to the TNM staging system in different cancer studies (22, 23). A nomogram is a simple, user-friendly statistical prediction tool used to predict and quantify individual patient outcomes (24, 25). Population-based statistics show that, nevertheless, no study has created a nomogram of elderly TC persons. With the support of the Surveillance, Epidemiology, and End Results database (SEER) (26), we aimed to construct and verify a web-based survival prediction model for geriatric patients with TC. This model may be useful for individualized therapy, prognostic prediction, and follow-up strategy.
Materials and methods
Patient and screening criteria
The data of geriatric patients with TC were obtained using the SEER∗ Stat software (version 8.3.8). The timeframe for data collection was from 2004 to 2018.
The inclusion criteria were as follows: (1) patients aged ≥65 years; (2) positive histological diagnosis of TC by the 3rd Edition of the International Classification of Diseases for Oncology (ICD-O-3) without an autopsy or death certificate; (3) AJCC stage I–III with a histological grade I–III; (4) a positive follow-up.
The following exclusion criteria were used: (1) patients who had a second primary malignancy, (2) patients who missed follow-ups, and (3) patients who had non-complete clinical data (marital status, cause of death, survival month, tumor size, staging, and follow-up months). Patients were randomly distributed to a training or internal validation group and an external validation group. The study required no local ethical approvals or statements, as all data in the research were selected out of the SEER database.
Variables and outcomes
Based on 14 clinical variables, we examined the age at diagnosis, race (Black, White and other, which including American Indian/Alaska Native and Asian/Pacific Islander), sex (female and male), marital status, years of diagnosis (2004–2009, 2009–2015, and 2016–2018), grade (I–III), histological subtype (papillary, follicular, medullary, or anaplastic), T stage (T1–T4), M stage (M0 or M1), N stage (N0–N1), tumor size, surgery, radiotherapy, and chemotherapy conditions. Patients who were widowed, divorced, separated, or bachelor (with a domestic partner or unmarried) were classified as unmarried. Regarding grading, grade I represented a highly differentiated cancer, grade II represented a moderately differentiated cancer, and grade III represented a poorly differentiated cancer. grade IV represented Undifferentiated cancer. Tumor diameters (0–10, 11–20, 21–40, and >40 mm) were translated into classification variables to test the linear hypothesis. There was no detailed information about radiotherapy regimens and chemotherapy drugs in the SEER database; therefore, these variables could not be further evaluated and controlled in this study. Finally, these TC’s variables (radiotherapy and chemotherapy) are used as dichotomous variables. The primary outcomes were OS and cancer-specific survival (CSS).The total survival time from TC diagnosis to TC-related or other causes of death as OS, whereas diagnosis to death or censoring as a result of TC was defined as CSS. For TNM staging, the 6-8th edition of the AJCC clinical staging guidelines was used for the study, which used the data from 2004-2018.
Statistical analysis
The training cohort was used to construct the nomograms and develop the predictive model and risk stratification system. In contrast, the validation cohort was used to test the predictive model and risk stratification system. All eligible cases were randomized into the training and internal validation cohort (split 7:3) from 2004 to 2015. All eligible patients from 2016 to 2018 were used as the external validation group.
Cox Proportional Hazards Regression Models for each putative prognostic variable were used to calculate the associated 95% CIs and hazard ratios (HRs). Multivariate analysis included the relevant factors from a univariate analysis (P < 0.05). Besides, the statistical studies contributed to using the program SPSS 24 (SPSS, Chicago, IL). Based on the results of the multivariable analysis, the well-constructed nomogram may provide graphical risk predictions using the RMS and survival packages of R 4.0.2. The nomograms were validated both internally and externally. Nomograms were built as an intuitive scoring plot based on the traditional Cox proportional risk regression model. We combined the predictive power of conventional regression models with user-friendly and easy-to-use performance to construct a nomogram to predict patient survival. The TNM stage system and the net clinical advantages of the prediction model were further evaluated using a decision curve analysis (DCA).
Meanwhile, a risk categorization system was established based on each patient’s total nomogram score. The X-Tile program determined the best cut-off value for each patient’s total score (Robert L. Camp, Yale University, New Haven, Connecticut, USA). The patients were then divided into two prognostic categories based on the best cut-off value: the low-risk and high-risk groups. The Kaplan–Meier curves and log-rank test were also used to depict and compare the OS and CSS of patients with geriatric in various risk groups.
Results
General clinicopathological features
Between 2004 and 2018, 16475 registered geriatric patients with TC were included from the SEER database according to the eligibility criteria. Figure 1 illustrates the flowchart of the patient selection process. There were no significant differences in demographic information, tumor type, or treatment between the training and validation groups (Table 1), including the training group (n = 8623, diagnosed between 2004 and 2015), and the validation sample comprised 3,669 patients (n = 3669, diagnosed between 2004 and 2015). Table S1 demonstrates the patients (n = 4183, diagnosed between 2016 and 2018) in the external validation group.
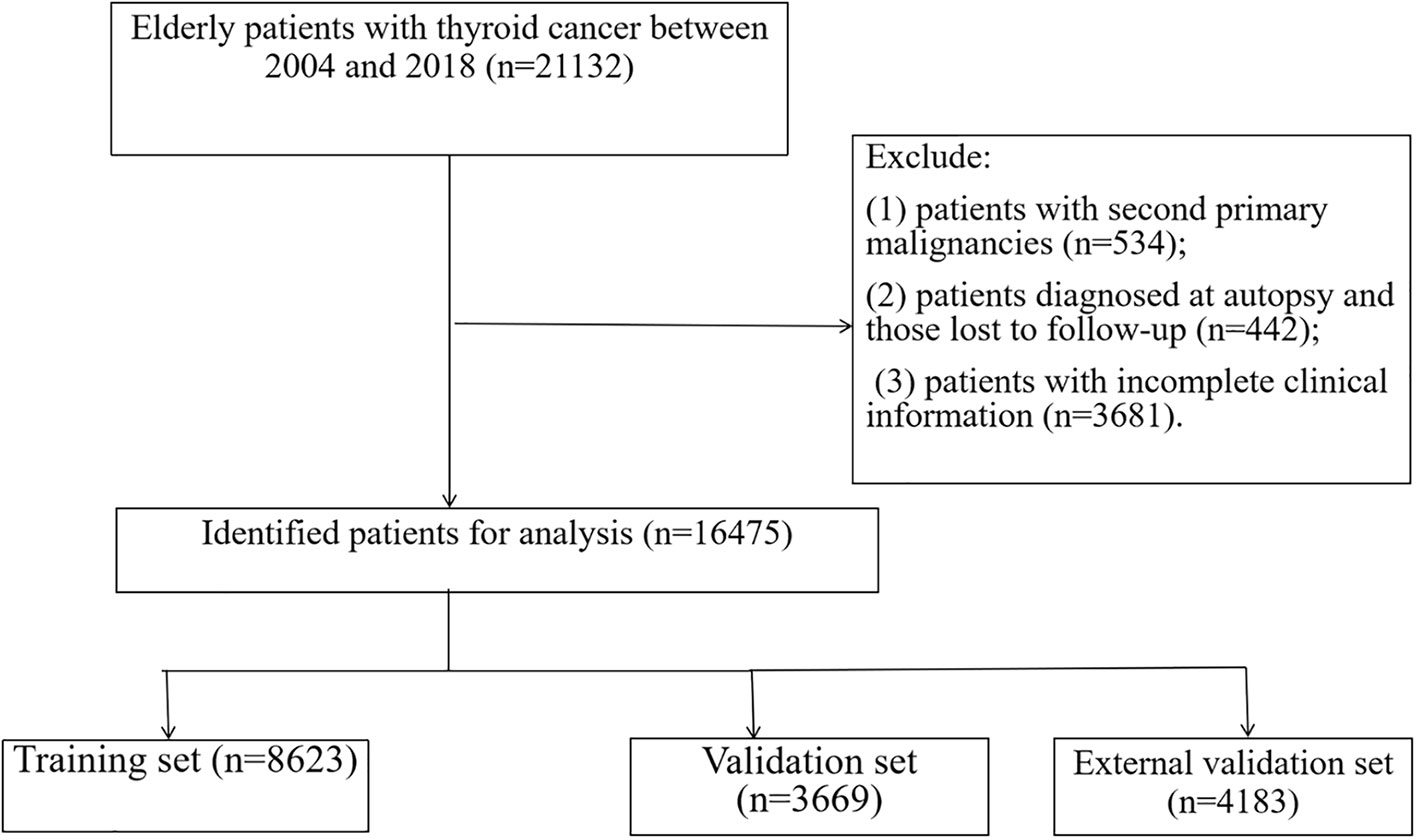
Figure 1 The flowchart of including and dividing patients.

Table 1 Clinicopathological characteristics of elderly patients with thyroid cancer.
In the whole study cohort, the average age was 72.6 (SD: 6.32) years; 8262 (67.2%) patients were female, and 4030 (32.8%) were male. Among all patients, the average age was 72.6 (SD: 6.34) in the training group and 72.6 (SD: 6.27) in the internal validation group. Most tumors (62.8%) were ≥1.0 cm in size. A total of 76.4% of patients received thyroidectomy, and 44.1% of patients received radioactive iodine. Additionally, 53.1% (6,524 out of 12,292), 13.8% (1,695 out of 12,292), 22.3% (2,741 out of 12,292), and 10.8% (1,332 out of 12,292) of patients had T1, T2, T3, and T4 tumors, respectively. Furthermore, 78.8% (9,684 of 12,292) of the patients were in the negative N stage, and 21.2% (4,129 of 12,292) were in the positive N stage. The average follow-up duration in the study cohort was 76.5 months (SD: 42.9). Moreover, 85.6% (83.8%–87.4%), 80.6% (79.1%–82.1%), and 78.7% (77.4%–80.1%) represented the 1-, 3-, and 5-year OS rates in the training group, respectively. The 1-, 3-, and 5-year OS rates in the validation group were 87.8% (85.4%–90.2%), 81.5% (79.3%–83.7%), and 78.8% (76.8%–80.8%), respectively.
Univariate and multivariate analyses
In the training group, age, race, sex, marital status, years of diagnosis, histologic type, pathological grade, TNM stage, tumor size, surgery, radiation, and chemotherapy were all determined using the univariate Cox regression analysis with P < 0.05. Next, these characteristics were then examined in a multivariate Cox regression model (Table 2), which showed that the clinical features associated with survival included age (HR 1.076, 95% CI 1.07–1.082), sex (HR 0.685, 95% CI 0.63–0.745), marital status (HR 0.779, 95% CI 0.718–0.845), histologic type (papillary as a reference; medullary: HR 1.361, 95% CI 1.167–1.589; anaplastic: HR 1.671, 95% CI 1.243–2.245), tumor grade (grade I as a reference; grade III: HR 1.566, 95% CI 1.234–1.989; grade IV: HR 3.223, 95% CI 2.392–4.344), T stage (T1 as a reference; T4: HR 1.53, 95% CI 1.28–1.83), N stage (N0 as a reference; N1a: HR 1.174, 95% CI 1.032–1.335; N1b: HR 1.469, 95% CI 1.311–1.646), M stage (M0 as a reference; M1: HR 2.848, 95% CI 2.488–3.26), tumor size (0–10 mm as a reference; 21–40 mm: HR 1.481, 95% CI 1.143–1.669; >40 mm: HR1.639, 95% CI 1.369–1.963), and surgery procedure (no surgery as a reference; lobectomy. HR 0.441, 95% CI 0.378–0.516; subtotal or near total thyroidectomy: HR 0.524, 95% CI 0.42–0.653; total thyroidectomy: HR 0.403, 95% CI 0.354–0.459). These clinical prognostic variables were included in the constructed OS nomogram for further analysis. We also performed a competitive risk multiple analysis on patients who died from cancer (Table 3).
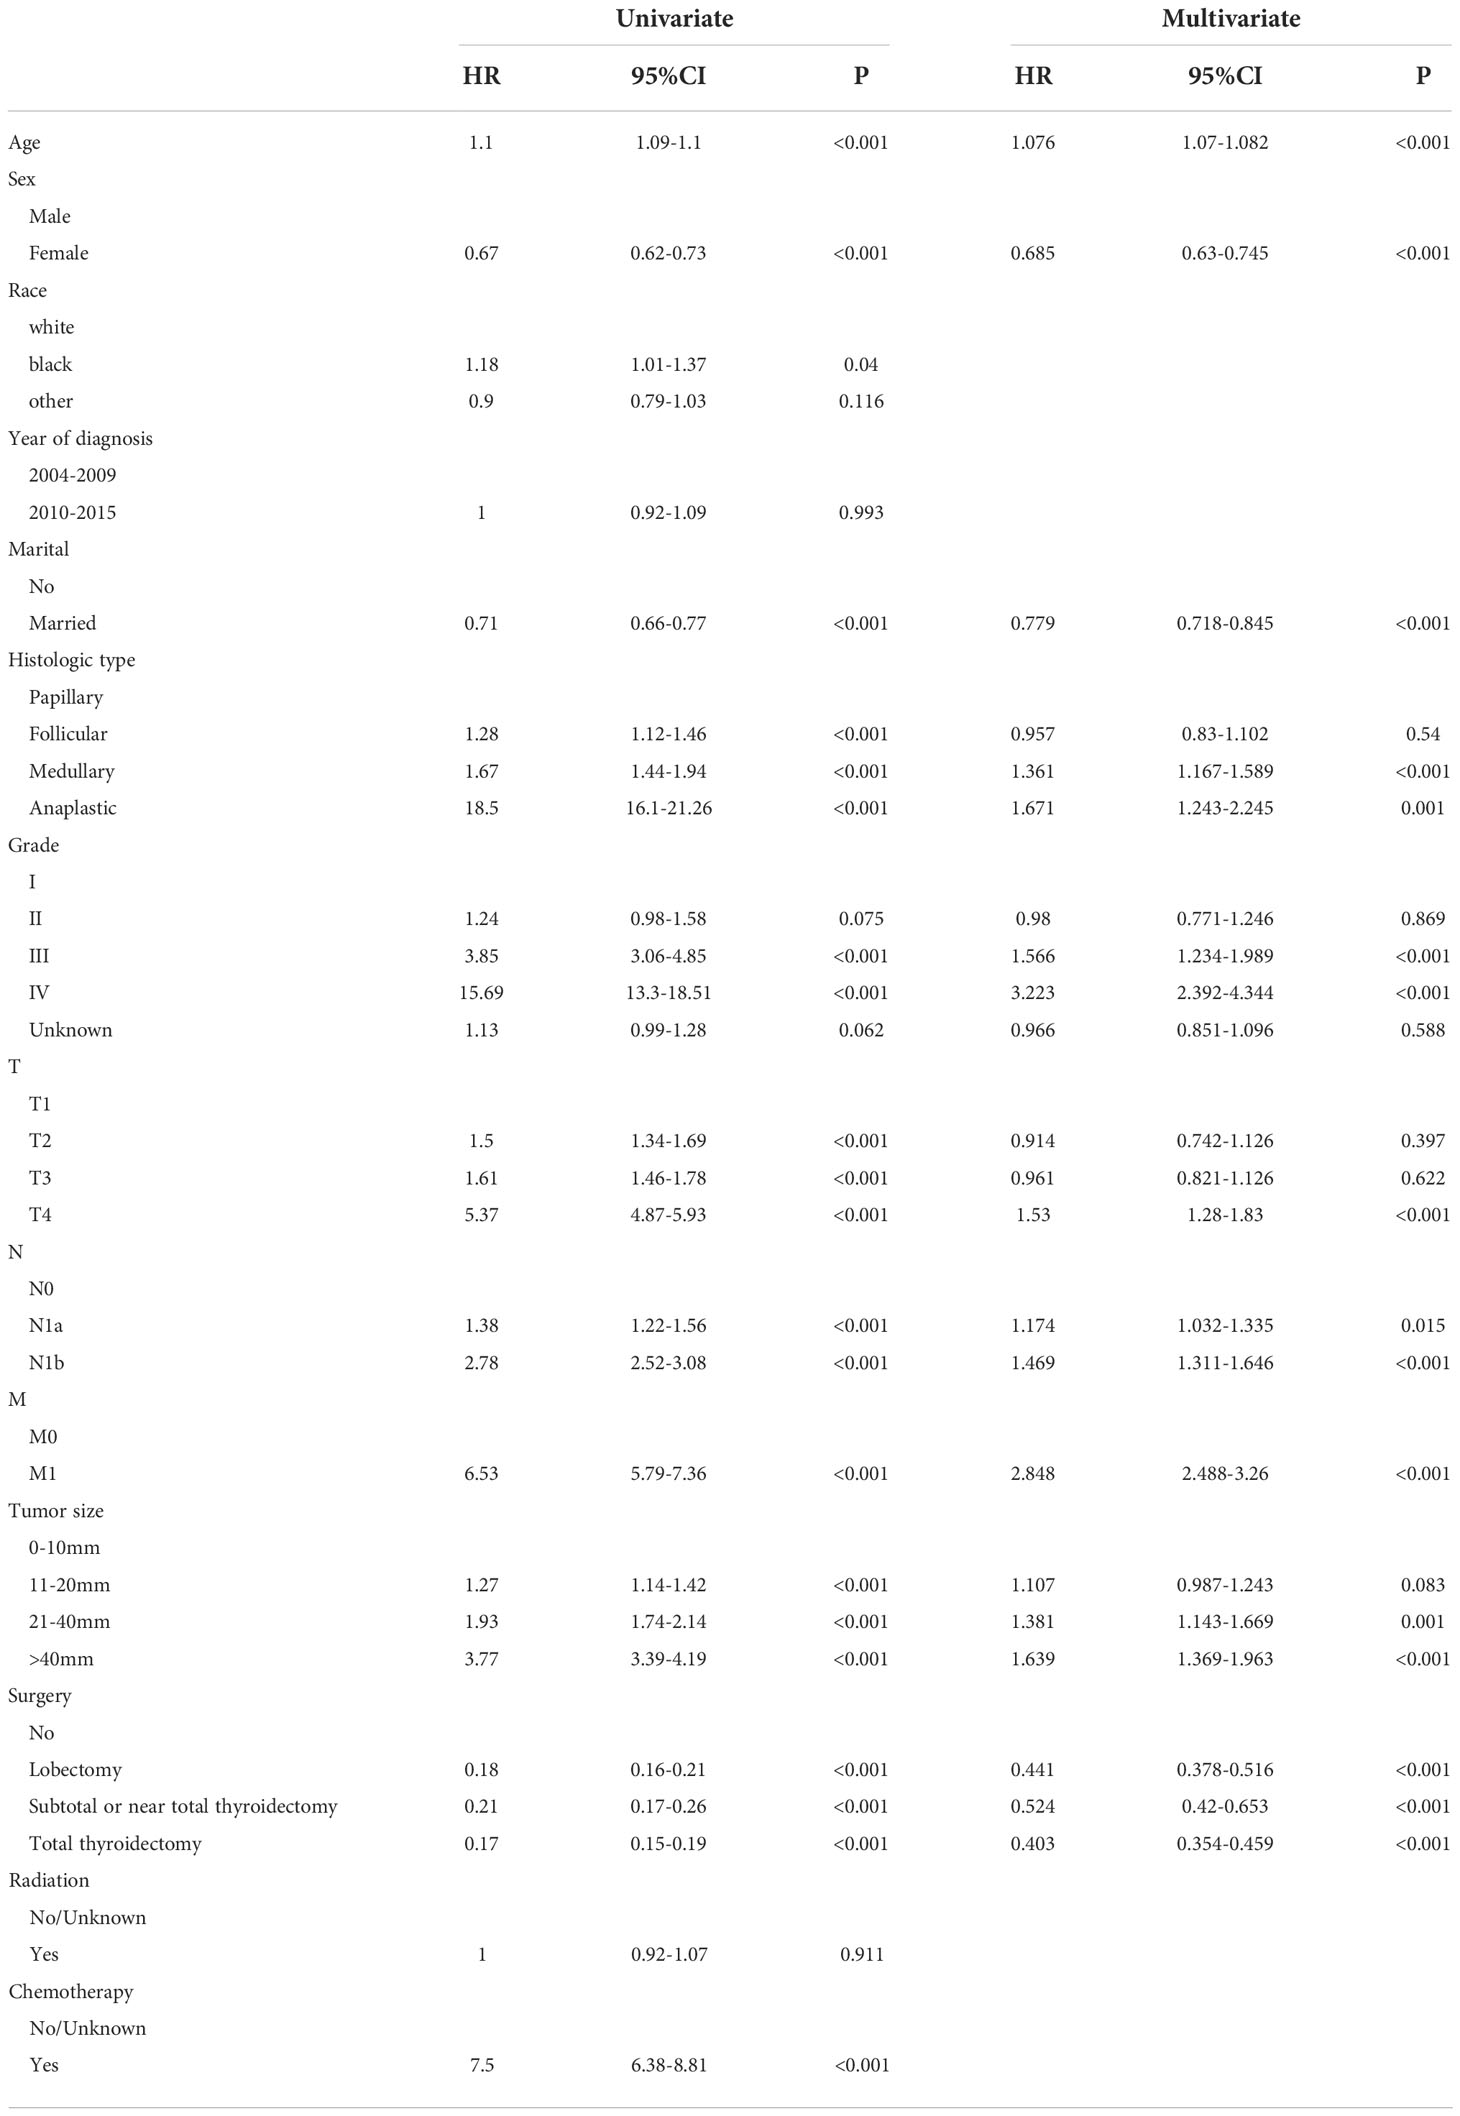
Table 2 Univariate and multivariate analyses of OS in training set.
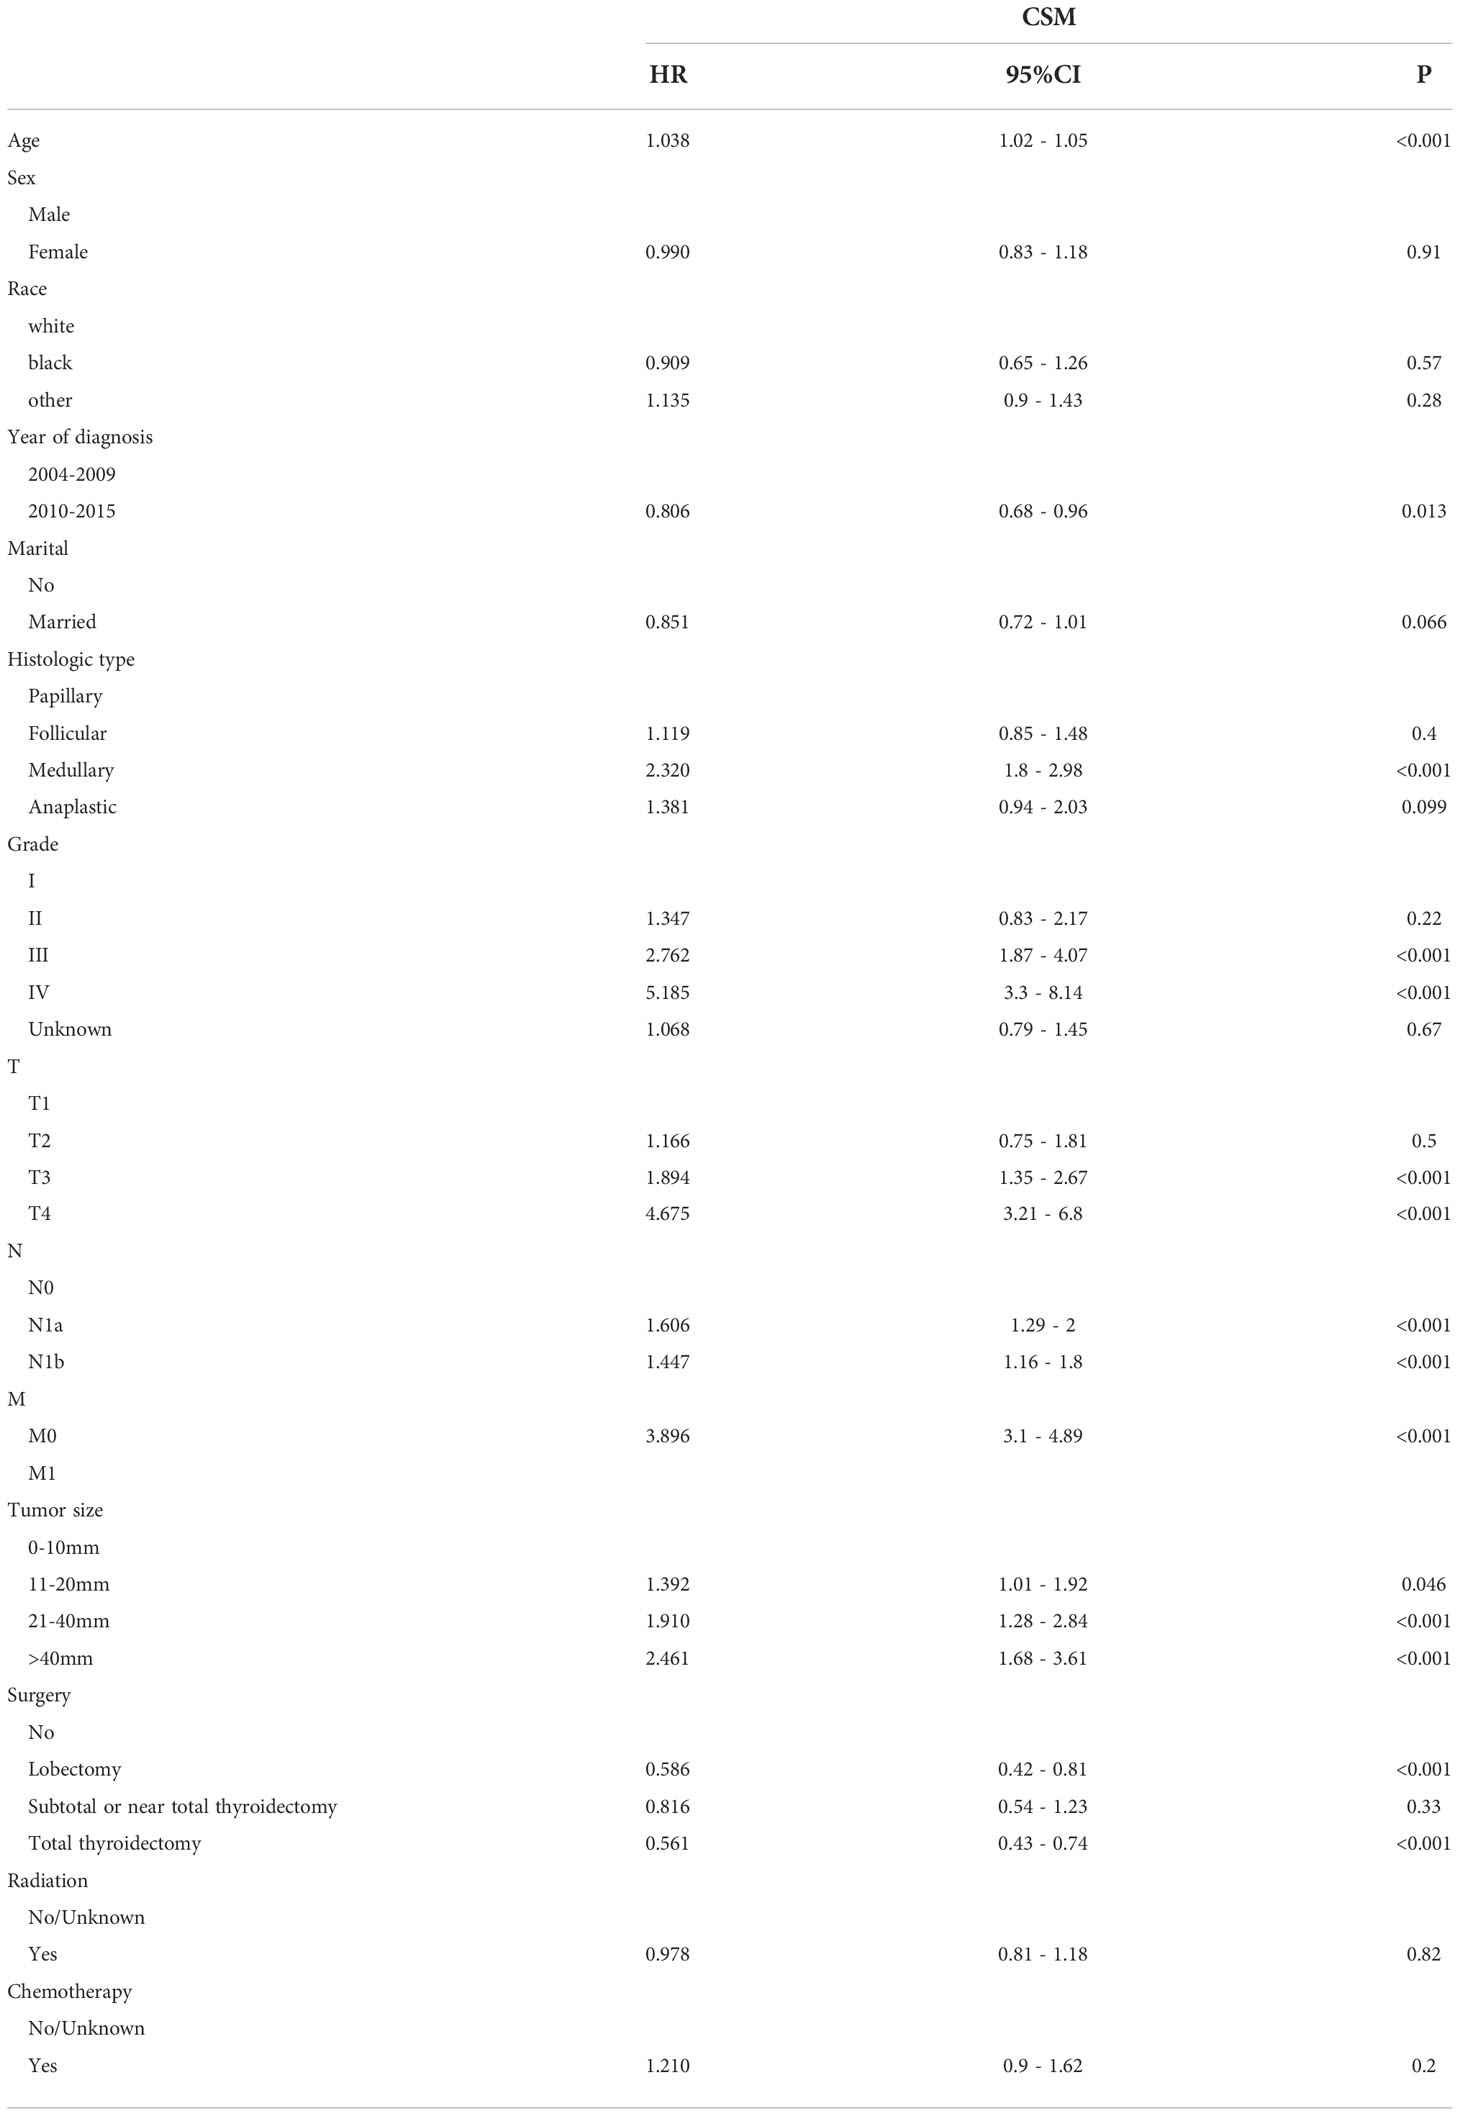
Table 3 Multivariate Cox regression models predict cancer-specific mortality in elderly patients with thyroid cancer.
Nomogram development and validation
This study discovered 10 independent predictive factors based on the multivariate Cox regression results and generated a predictive OS nomogram. Age, sex, marital status, histologic type, tumor grade, T stage, N stage, M stage, tumor size, and operation are all shown in Figure 2A. Each clinical feature was assigned a score. The estimated 1-, 3-, and 5-year OS probabilities were easily calculated by adding the scores for all 10 clinical features and drawing a vertical line between the total score and the survival probability axis. Tumor grade and M stage were found to substantially impact prognosis, followed by surgical type, histologic type, T stage, tumor size, N stage, sex, race, and marital status on the nomogram. The training and validation groups had C-indices of 0.775 (95% CI: 0.785–0.765) and 0.776 (95% CI: 0.792–0.760), respectively.
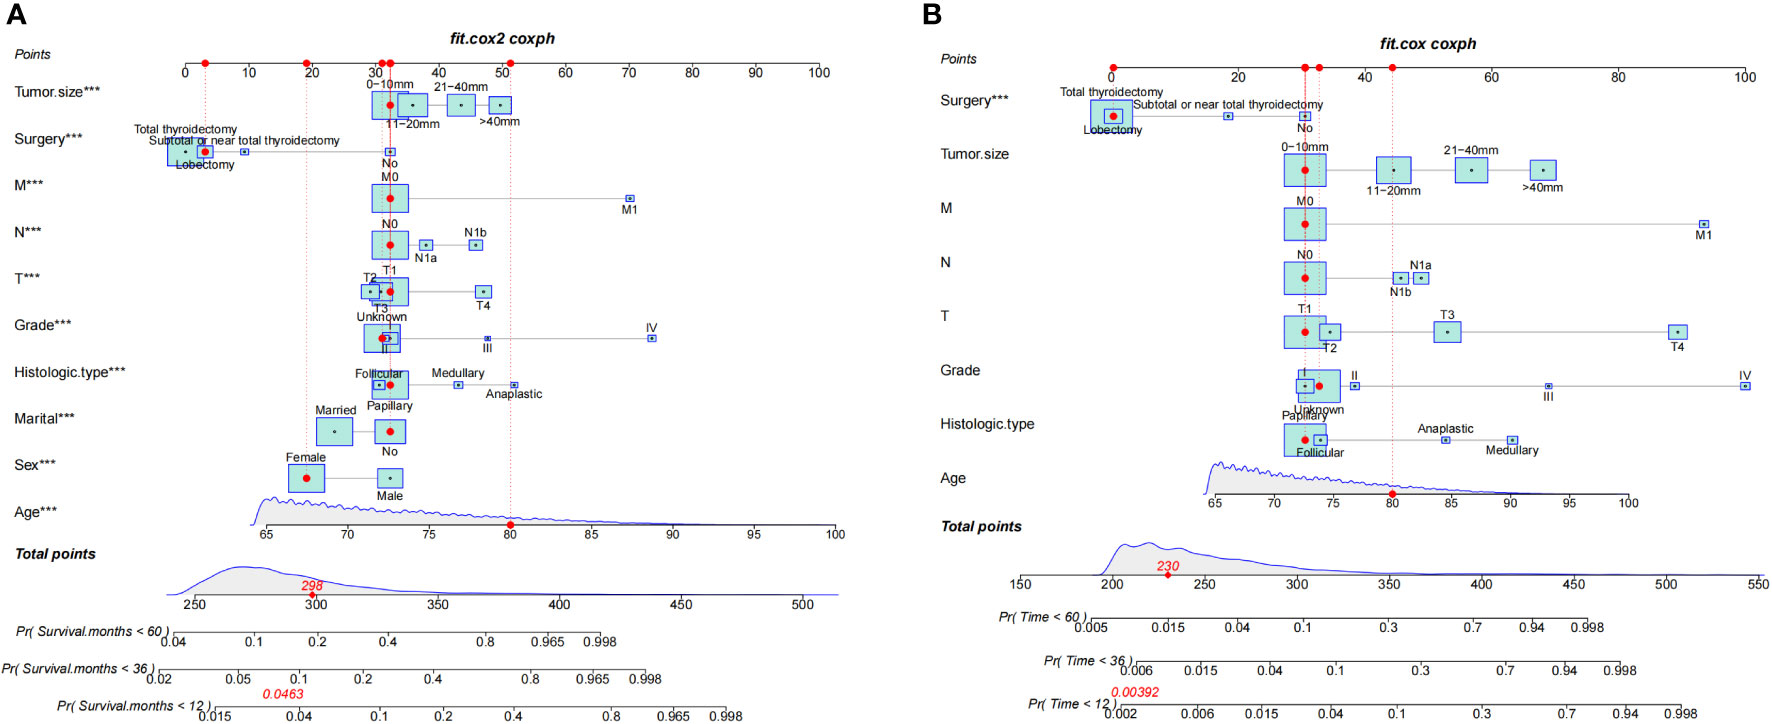
Figure 2 Nomograms for 1-, 3-, and 5-year OS (A) and CSS (B) of patients with TC. ***, a highly significant variable.
According to Figure 3, the training group’s 1-, 3-, and 5-year areas under the curve (AUCs) were 0.856, 0.806, and 0.787, respectively. On the other hand, the validation group’s 1-, 3-, and 5-year AUCs were, respectively, 0.878, 0.815, and 0.787. These findings demonstrated that the model prediction accuracy was high. Calibration curves of the training and validation groups used 1,000 bootstraps, suggesting high agreement between anticipated and actual outcomes (Figure 4). TNM staging was compared with the DCA curve of the training group to assess the clinical viability of the nomogram. According to the results, the nomogram was more vital in predicting 1-, 3-, and 5-year OS in patients with geriatric TC compared to TNM staging (Figure 5).
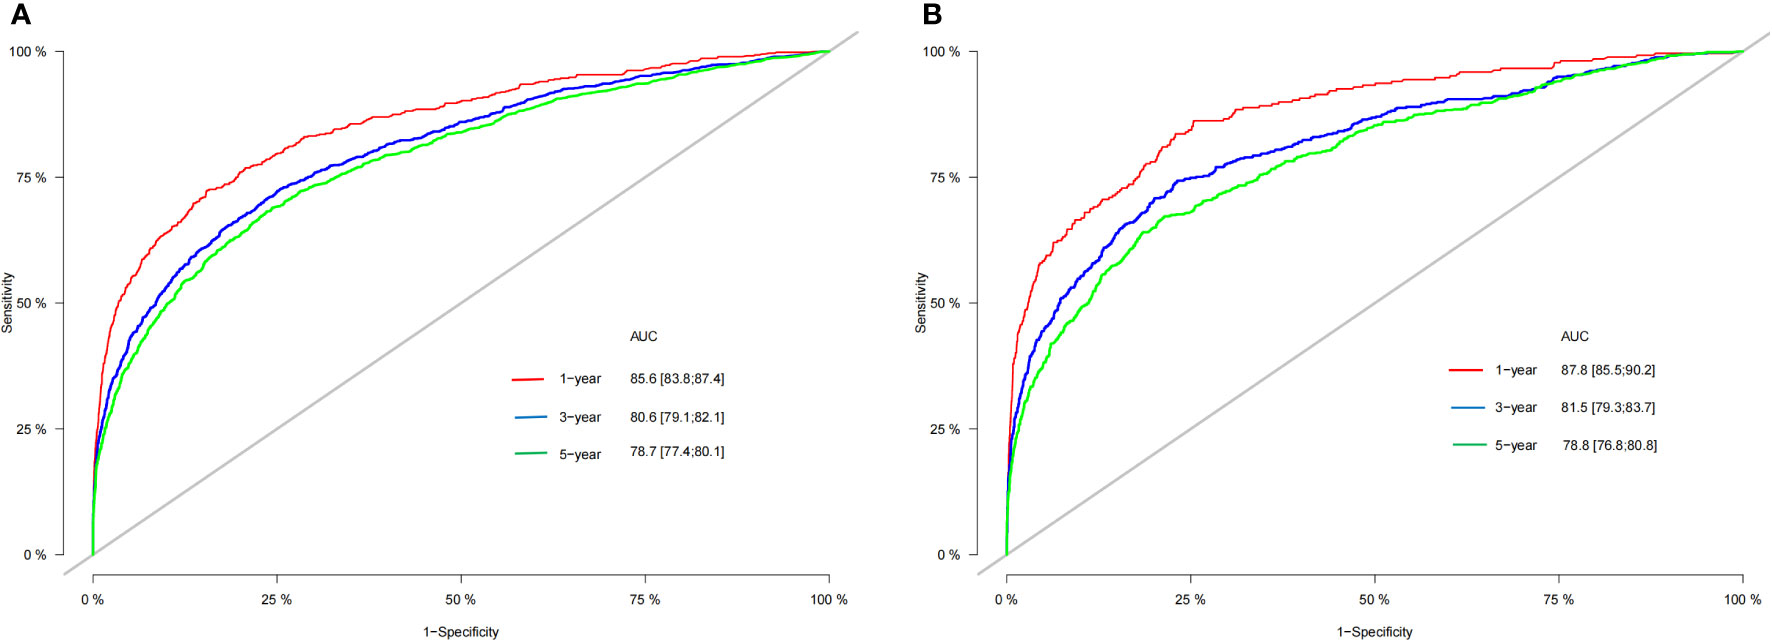
Figure 3 The AUC for OS of 1-, 3- and 5-year of training cohort (A) and validation cohort (B).
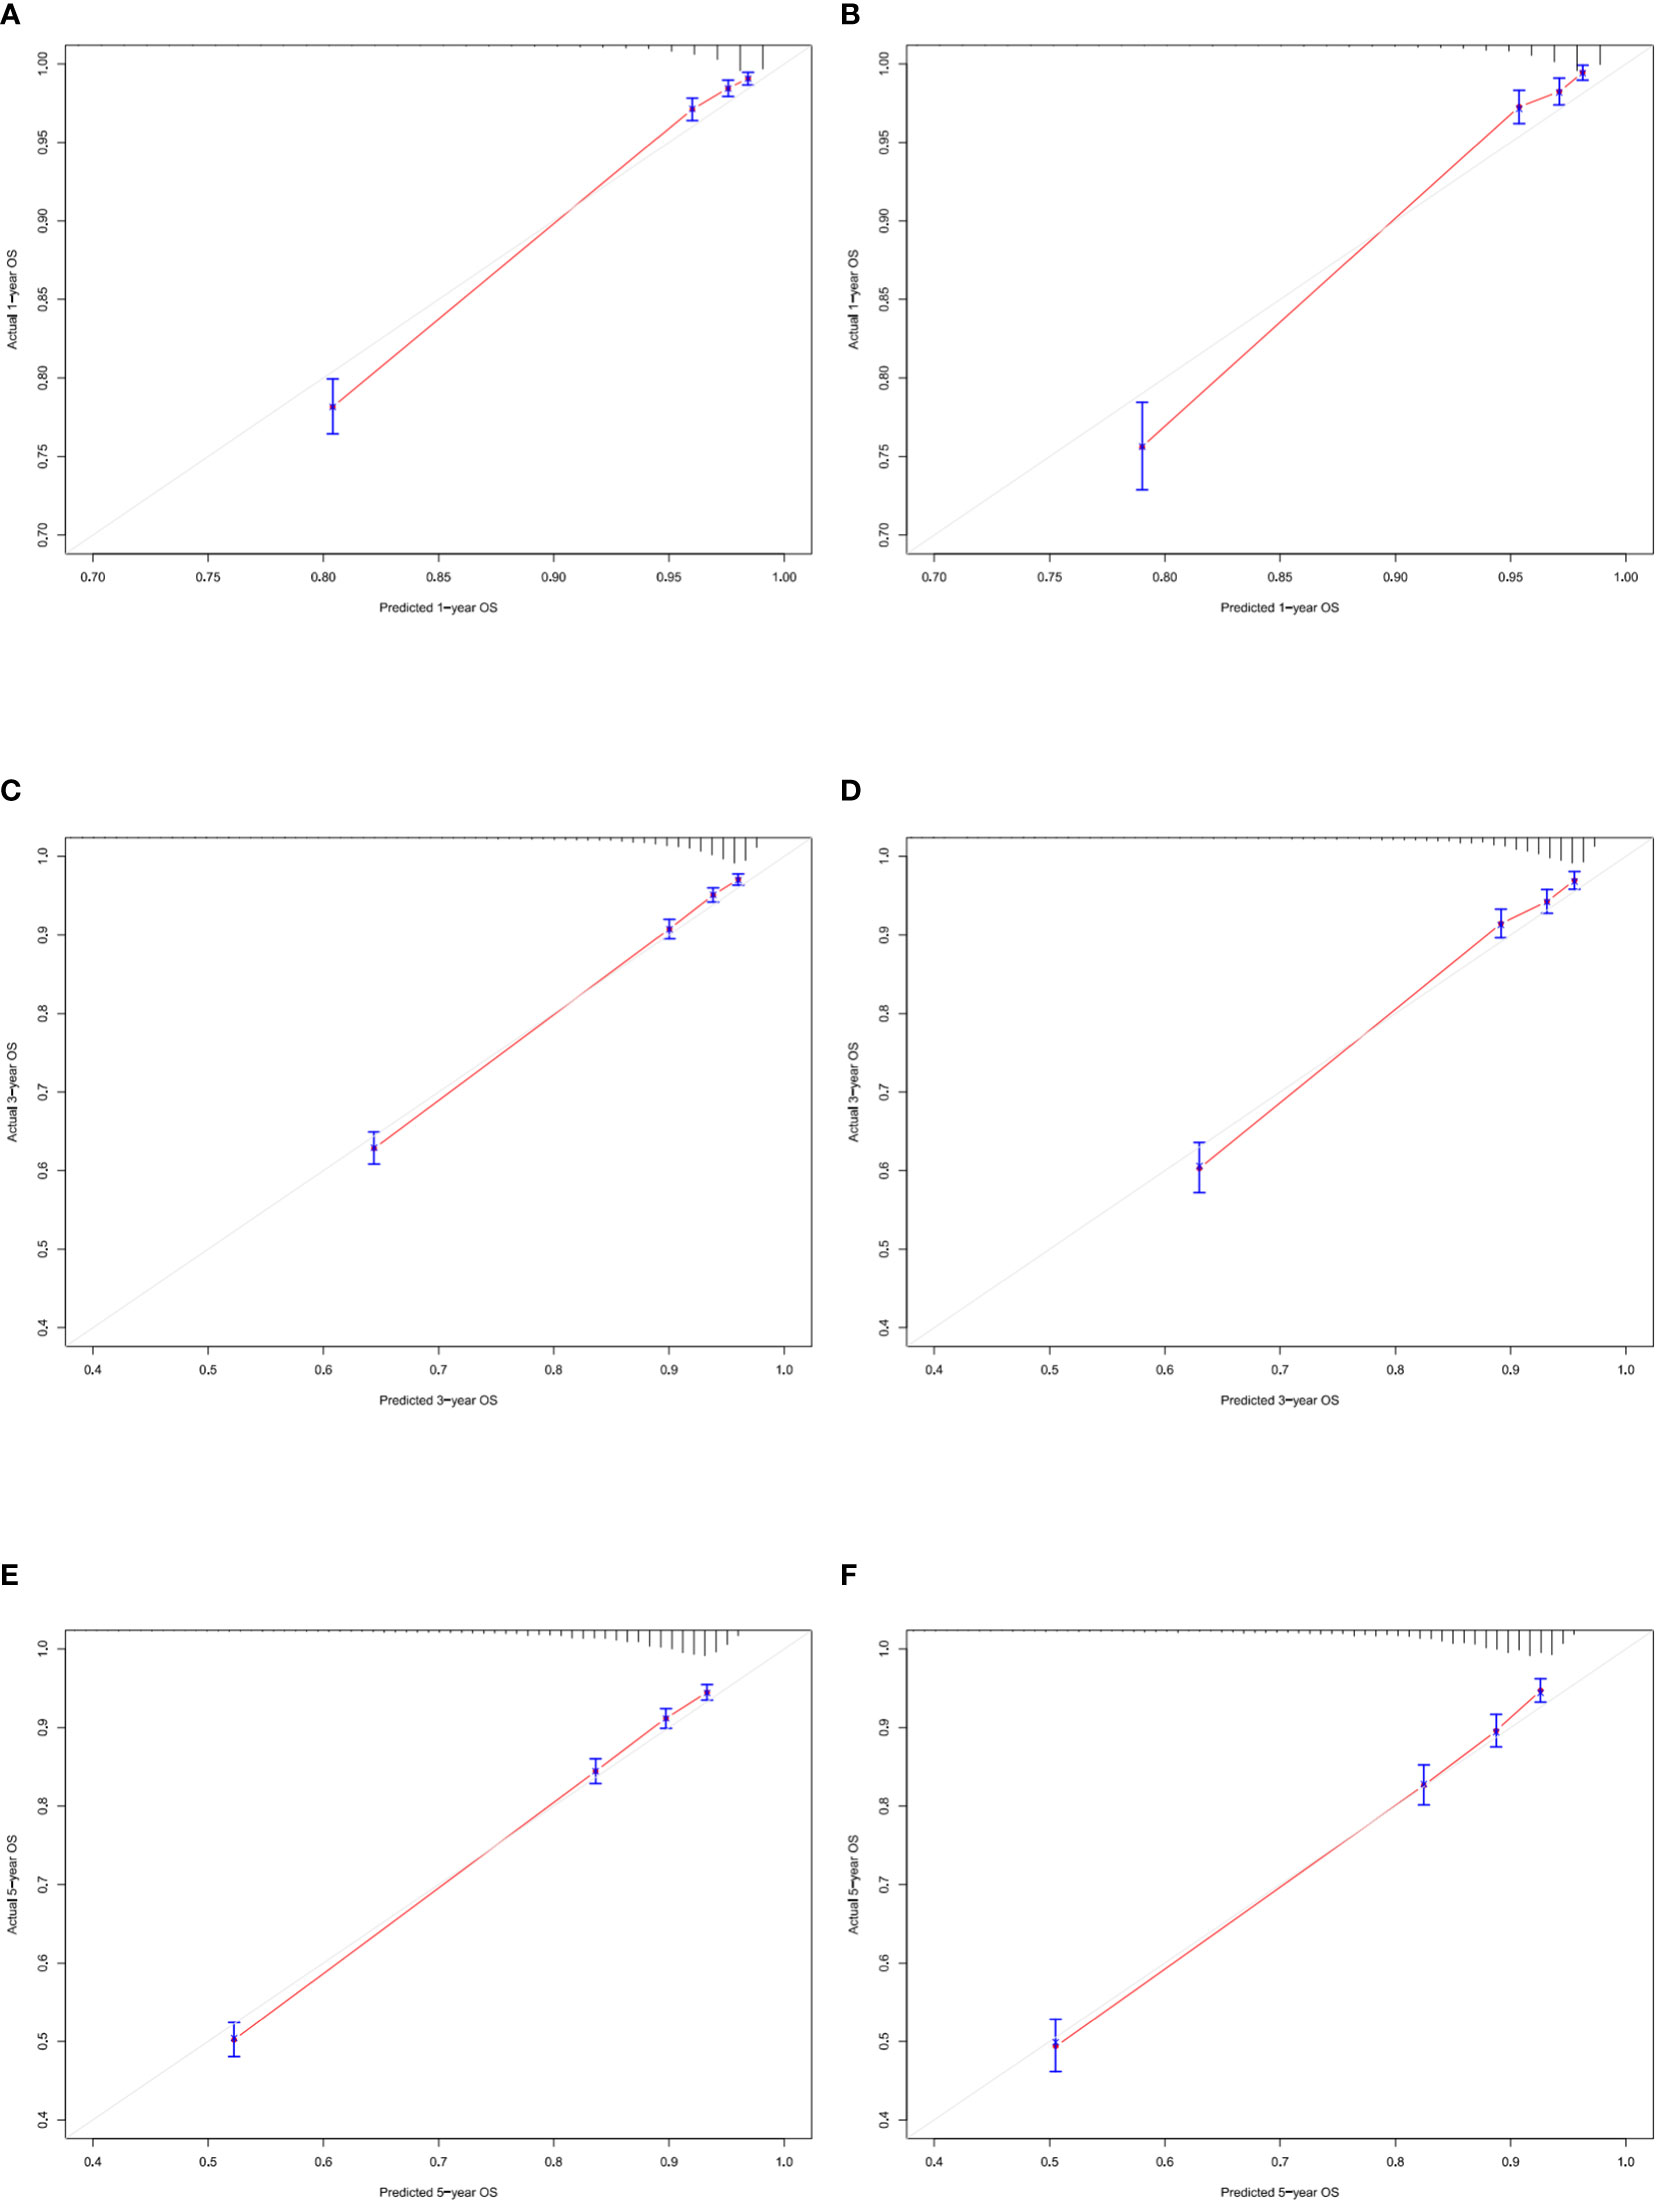
Figure 4 Calibration curves of nomogram. (A–C) For 1-, 3-, and 5-year OS in training cohort; (D–F) For 1-, 3-, and 5-year OS in validation cohort.
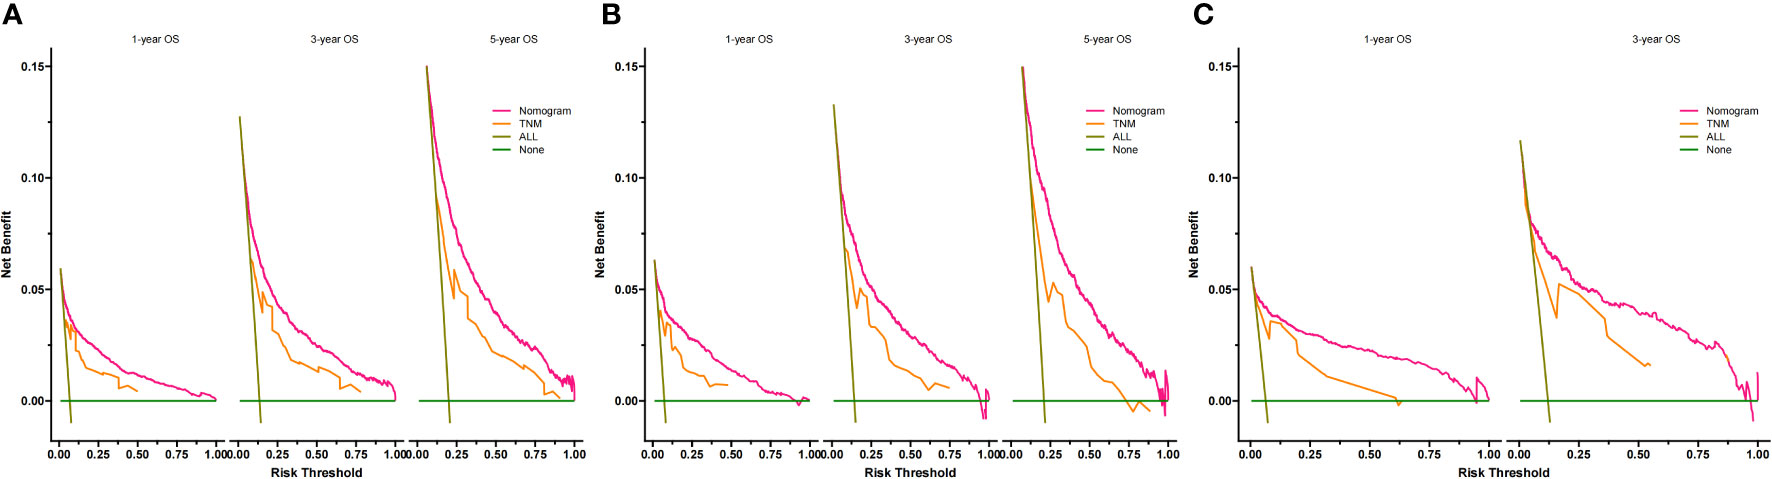
Figure 5 Decision curves of the nomogram predicting OS in training cohort (A), validation cohort (B) and external validation cohort (C). The y-axis represents the net benefit, and the x-axis represents the threshold probability. When the threshold probability is between 20% and 60%, the net benefit of the model exceeds all deaths or no deaths.
Additionally, we constructed a competitive risk model to predict patients’ CSS (Figure 2B). The 1-, 3-, and 5-year C-indexes of the training group were 93.9, 92.1, and 90.5, respectively. The 1-, 3-, and 5-year C-indexes of the validation group were 95.5, 93.9, and 91.2, respectively. The 1- and 3-year C-indexes of the external validation group were 95.1 and 95.2, respectively. The calibration curve of the competitive risk model also showed that the predicted value is highly consistent with the actual observed value, suggesting that the model has good accuracy (Figures 6A, B). The calibration curve of external validation also showed that the model has good accuracy (Figure 6C).
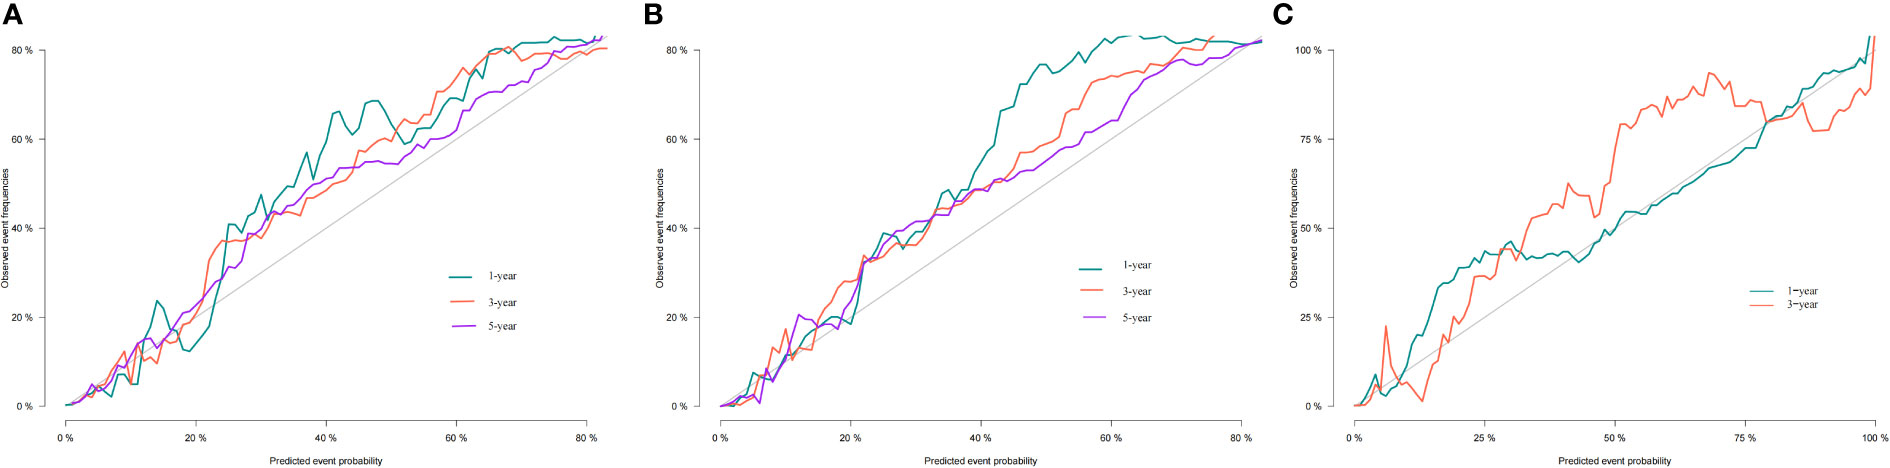
Figure 6 Calibration curves of nomogram. (A) For 1-, 3-, and 5-year CSS in training cohort; (B) For 1-, 3-, and 5-year CSS in validation cohort; (C) For 1-, 3-year CSS in external validation cohort.
Risk stratification analysis
Following the optimal cut-off value, patients were divided into two prognostic groups: the low-risk group (total score ≤ 24.9) and the high-risk group (total score > 24.9) (Figures 7A, B). According to the Kaplan–Meier curve, the risk stratification system could accurately recognize the training and validation cohorts from the OS. The high-risk patients had 1-, 3-, and 5-year OS rates of 91.8%, 84.1%, and 76.9%, respectively. On the other hand, the low-risk patients had 1-, 3-, and 5-year OS rates of 99.3%, 97.2%, and 79.50%, respectively.
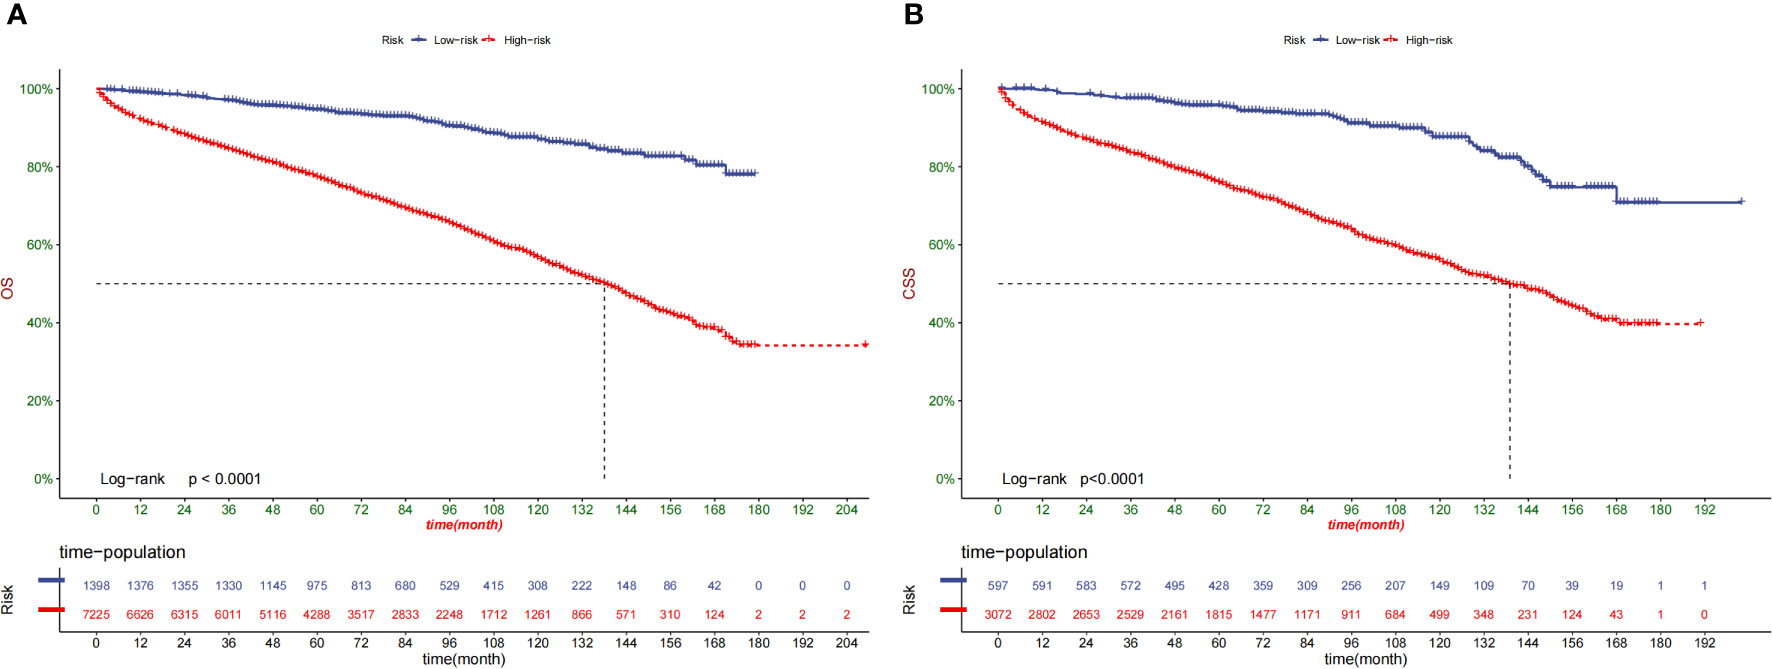
Figure 7 Kaplan–Meier curves of OS for patients in the low-, and high-risk groups in the training Cohort (A) and validation Cohort (B).
Effects of surgery on survival in different stratifications
Kaplan–Meier curves were created for the low-risk and high-risk groups to further analyze the benefit of surgery in terms of survival (Figures 8A, B).In addition, the impact of different surgical methods on the survival probability of patients in the low-, and high-risk groups was summarized. In the low-risk group, almost everyone has undergone surgery (Figure 8A). A subset of patients in the high-risk group did not undergo surgery; that group had the lowest survival probability (Figure 8B).
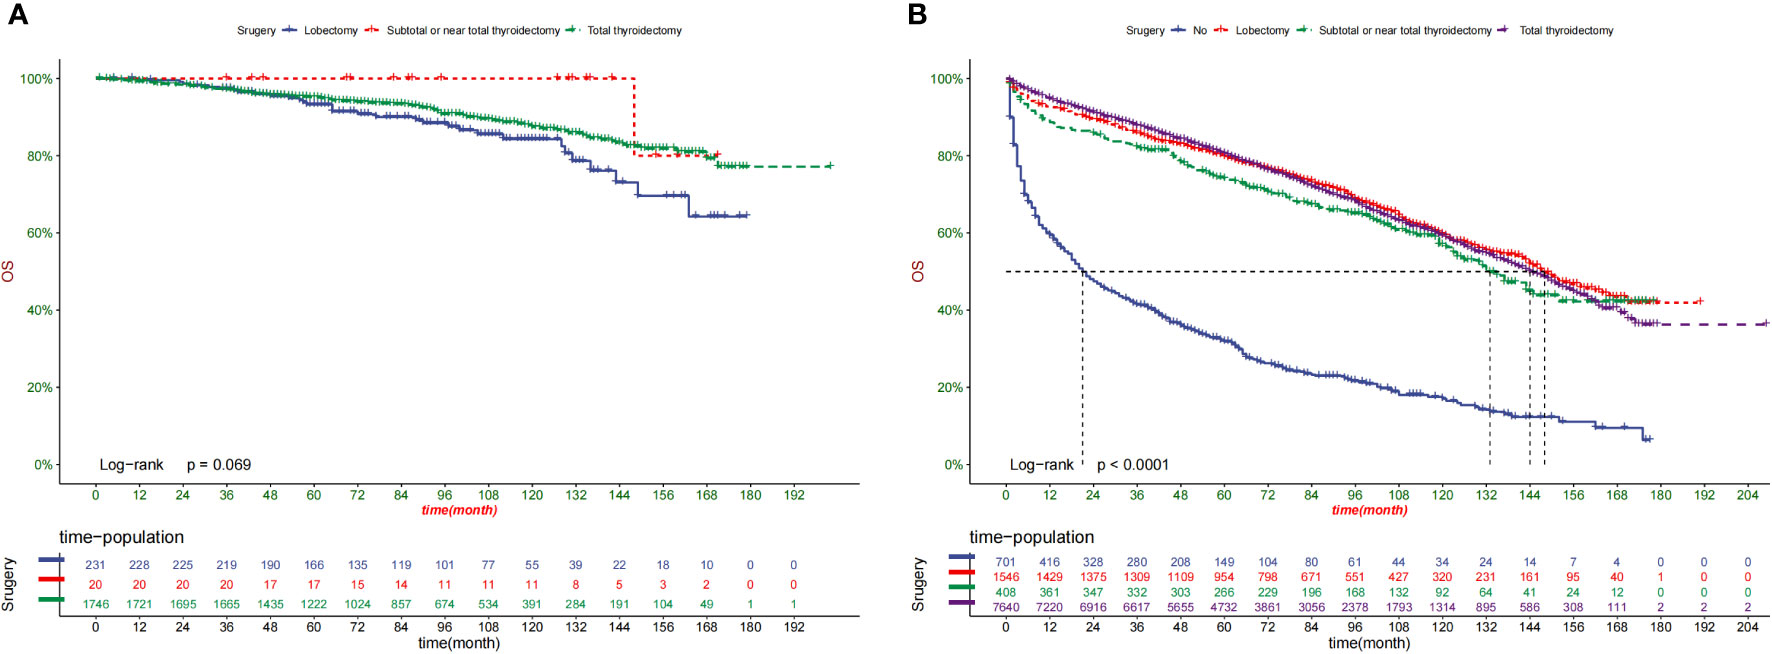
Figure 8 OS prediction of patients with different surgery in low- (A) and high-risk (B) group.
Construction of a web app for easy nomogram access
The online app may be found at https://zhangtingting.shinyapps.io/DynNomapp/ and is designed to help researchers and physicians determine patient survival probabilities.
Discussion
In this study, 16475 individuals with geriatric TC were included. The histologic type, tumor grade, TNM stage, tumor size, and surgery were determined by the univariate and multivariate Cox analyses. The C-index and calibration charts were used to test the model and revealed good differentiation and calibration. According to DCA, our OS nomogram had a superior clinical net and a more excellent threshold probability range in predicting 1-, 3-, and 5-year OS in the training and validation groups than the usual TNM stage system. Meanwhile, the CSS nomogram was constructed using eight independent parameters: age, tumor size, grade, histologic type, surgery, T stage, N stage, and M stage. Although the prognosis of thyroid cancer varies considerably by histological type, inspired by previous studies (27), we included elderly patients with thyroid cancer of various tissue types and included tissue type as a variable in the regression analysis. Histologic type was included as an important variable in the prediction model’s construction with poorer survival for more aggressive histologic subtypes compared to papillary (Table 2, medullary: HR 1.361, 95%CI 1.167–1.589 and anaplastic: HR 1.671, 95% CI 1.243–2.245). In the online APP based on the model construction, clinicians can enter the patient’s tissue type. The survival prediction of patients with thyroid cancer including MTC is obtained.
Many scoring systems are used for predictive purposes. Despite a more simplified utilization in the clinic, only a stratified population risk assessment could be conducted for each patient (28). Nomograms are helpful tools for evaluating patient survival outcomes. Statistical modeling and risk quantification are used to handle the difficulty of balancing multiple factors. Their methodical methodology also eliminates the influence of individual physicians’ biases or aberrant clinical factors. Nomograms are more accurate than typical stage score methods (29–31). They may also be the most beneficial when the prospective advantages of additional therapy are unknown (32, 33). They are also great for personalized risk assessment and assisting clinicians with clinical care management when there are no definite guidelines.
To the best of our knowledge, this is the first study to describe the development and validation of a nomogram to forecast 5-year OS and CSS in TC-affected elderly individuals. Our nomograms exhibited good calibration and discrimination. The nomograms surpassed the accuracy of the TNM staging mechanism, as seen by the receiver operating characteristic curve. Our nomogram models are straightforward therapeutic aids that can support patient counseling and treatment individualization.
Our nomograms found several independent variables potentially impacting the outcome in elderly patients with TC. First, age is a significant factor for CSS in patients with TC (34). As a separate risk factor, patients with geriatric thyroid cancer have a reduced chance of surviving (35–37). Patients with geriatric TC have unique psychological features compared to younger patients including more comorbidities and shorter life expectancy. Less life expectancy, more comorbidities, and a shorter life expectancy are among these factors. The previous version of the AJCC staging system divided people by 45 years, but the 8th version utilizes 55 years for the same purpose. Age is recognized as a significant prognostic factor independent of the cut-off number.
The gender disparity in TC prevalence has also been thoroughly documented (38). Women are more likely to develop TC than men, although men have worse clinical outcomes (39). The findings of our patients with geriatric were similar to those in prior investigations. In addition to the above-mentioned characteristics, marital status, histologic type, tumor grade, T stage, N stage, M stage, tumor size, and surgery were significant prognostic indicators. However, we discovered that neither gender nor marital status was a risk factor for the 1-, 3-, or 5-year CSS.
The association of marital status and survival was explored in many tumors, including breast cancer, rectal cancer, and non-small cell lung cancer (40–42).We identified that marital status was an independent prognostic factor in the univariate analysis, with married patients having a decreased chance of mortality (43). After adjusting for demographic and clinical characteristics, married patients were shown to have a lower mortality risk than unmarried patients. In a prior study concentrating on differentiated patients with TC, Shi et al. have discovered that single individuals had a higher risk of tumor death (44). In a study of breast cancer patients aged ≥70 years, marriage has been found to provide higher protection from poorer prognosis (45). According to a study that analyzed more than a million patients diagnosed with various diseases, unmarried individuals have had a greater chance of metastatic cancer and death from cancer (46). Consistent with the findings of the above researches, our results found that marriage was a factor associated with superior survival. There are two possibilities that could explain why married patients live longer than unmarried patients. On the one hand, these married patients were overseen by their spouses for frequent physical checkups before being diagnosed, which helps detect TC early. Meanwhile spouses may also provide more economic support for subsequent treatments. On the other hand, cancer patients are more than four times more likely to suffer from psychological disorders (47). After being diagnosed with cancer, married persons had reduced despair and psychological suffering, which may be attributed to the encouragement and support from their spouses (43, 48).
Our prediction model may be used in clinical practice to estimate patient survival by alerting doctors about the predicted advantages of various therapies. In this study, we found that for elderly patients with TC, almost all patients in the low-risk group undergo thyroidectomy. Regardless of surgical method, patients undergoing surgery have better overall survival. Most high-risk patients did not undergo surgery.
Patients with TC have a variety of risk variables, including age, grade, TNM stage, and tumor size. Elderly patients are more likely to have comorbidities and therefore surgery could reduce the OS rate of patients. However, for the first time, our study found that surgery is advantageous to cancer-specific higher-risk senior individuals with TC (P < 0.0001) but not to low-risk groups (P = 0.069), providing doctors with suggestions for extending their patients’ lives.
This study had some limitations. First, the nomograms were created using historical data. As a result, there was a possibility of selection bias. Second, the SEER does not cover all factors; hence, only 14 variables were included in our analysis. Some critical factors were not included, such as the degree of surgery, radioiodine dose, thyrotropin suppression, etc. Third, as a retrospective cohort research, selection bias might have existed because only patients with comprehensive information on essential characteristics were included. Fourth, the majority of the participants in this study were Americans. As a result, prospective clinical pilot studies are needed to see if the findings can be generalized to different groups.
Conclusion
Based on this study, the first applicable nomograms were created, along with an online application that predicts the personalized long-term OS and CSS of geriatric TC patients. The nomogram performed effectively and had great accuracy and dependability. It is the first nomogram based on a large number of patients with external validation.
Data availability statement
The original contributions presented in the study are included in the article/Supplementary Material. Further inquiries can be directed to the corresponding authors.
Author contributions
T-TZ, YY, and JZ all helped with the idea and design. The data were analyzed by T-TZ, YY, and Y-JK. The manuscript was written by T-TZ. A critical revision of the manuscript was contributed by XW and YF. The final version of the work has been reviewed and approved by all authors.
Funding
This study was supported by The Innovation Fund Youth Cultivation Project (QNPY 2015008).
Acknowledgments
The authors thank the Surveillance, Epidemiology, and End Results program for providing data.
Conflict of interest
The authors declare that the research was conducted in the absence of any commercial or financial relationships that could be construed as a potential conflict of interest.
Publisher’s note
All claims expressed in this article are solely those of the authors and do not necessarily represent those of their affiliated organizations, or those of the publisher, the editors and the reviewers. Any product that may be evaluated in this article, or claim that may be made by its manufacturer, is not guaranteed or endorsed by the publisher.
Supplementary material
The Supplementary Material for this article can be found online at: https://www.frontiersin.org/articles/10.3389/fendo.2022.1038041/full#supplementary-material
References
1. Siegel RL, Miller KD, Jemal A. Cancer statistics, 2018. CA Cancer J Clin (2018) 68(1):7–30. doi: 10.3322/caac.21442
2. Davies L, Welch HG. Increasing incidence of thyroid cancer in the united states, 1973-2002. JAMA (2006) 295(18):2164–7. doi: 10.1001/jama.295.18.2164
3. Mao Y, Xing M. Recent incidences and differential trends of thyroid cancer in the USA. Endocr Relat Cancer. (2016) 23(4):313–22. doi: 10.1530/ERC-15-0445
4. Deng Y, Li H, Wang M, Li N, Tian T, Wu Y, et al. Global burden of thyroid cancer from 1990 to 2017. JAMA Netw Open (2020) 3(6):e208759. doi: 10.1001/jamanetworkopen.2020.8759
5. Ahn HS. And coll: Korea's thyroid-cancer "epidemic"–screening and over diagnosis. N Engl J Med (2014) 371(19):1765–7. doi: 10.1056/NEJMp1409841
6. Rahib L, Smith BD, Aizenberg R, Rosenzweig AB, Fleshman JM, Matrisian LM. Projecting cancer incidence and deaths to 2030: the unexpected burden of thyroid, liver, and pancreas cancers in the united states. Cancer Res (2014) 74(11):2913–21. doi: 10.1158/0008-5472.CAN-14-0155
7. Colby SL, Ortman JM. Projections of the size and composition of the US population: 2014 to 2060. In: Population estimates and projections. Washington, DC: US Census Bureau (2015). p. 1–13.
8. Sosa JA, Mehta PJ, Wang TS, Boudourakis L, Roman SA. A population-based study of outcomes from thyroidectomy in aging americans: at what cost? J Am Coll Surg (2008) 206(6):1097–105. doi: 10.1016/j.jamcollsurg.2007.11.023
9. Jung KW, Won YJ, Oh CM, Kong HJ, Cho H, Lee DH, et al. Prediction of cancer incidence and mortality in Korea, 2015. Cancer Res Treat (2015) 47:142–8. doi: 10.4143/crt.2015.066
10. Grogan RH, Kaplan SP, Cao H, Weiss RE, DeGroot LJ, Simon CA, et al. A study of recurrence and death from papillary thyroid cancer with 27 years of median follow-up. Surgery (2013) 154:1436–47. doi: 10.1016/j.surg.2013.07.008
11. Durante C, Haddy N, Baudin E, Leboulleux S, Hartl D, Travagli JP, et al. Long-term outcome of 444 patients with distant metastases from papillary and follicular thyroid carcinoma: benefits and limits of radioiodine therapy. J Clin Endocrinol Metab (2006) 91:2892–9. doi: 10.1210/jc.2005-2838
12. Park HS, Roman SA, Sosa JA. Treatment patterns of aging americans with differentiated thyroid cancer. Cancer (2010) 116(1):20–30. doi: 10.1002/cncr.24717
13. Shi RL, Qu N, Liao T, Wei WJ, Wang YL, Ji QH. The trend of age-group effect on prognosis in differentiated thyroid cancer. Sci Rep (2016) 6:27086. doi: 10.1038/srep27086
14. Zivaljevic V, Vlajinac H, Jankovic R, Marinkovic J, Diklic A, Paunovic I. Case-control study of anaplastic thyroid cancer. Tumori (2004) 90(1):9–12. doi: 10.1177/030089160409000103
15. Zivaljevic VR, Vlajinac HD, Marinkovic JM, Kalezic NK, Paunovic IR, Diklic AD. Case-control study of anaplastic thyroid cancer: goiter patients as controls. Eur J Cancer Prev (2008) 17(2):111–5. doi: 10.1097/CEJ.0b013e3281108036
16. Sorrenti S, Baldini E, Pironi D, Lauro A, D'Orazi V, Tartaglia F, et al. Iodine: Its role in thyroid hormone biosynthesis and beyond. Nutrients (2021) 13(12):4469. doi: 10.3390/nu13124469
17. Graceffa G, Salamone G, Contino S, Saputo F, Corigliano A, Melfa G, et al. Risk factors for anaplastic thyroid carcinoma: A case series from a tertiary referral center for thyroid surgery and literature analysis. Front Oncol (2022) 12:948033. doi: 10.3389/fonc.2022.948033
18. Amato B, Sivero L, Vigliotti G, Rispoli C, Rocco N, Iannone L, et al. Surgery for cancer in the elderly: state of the art. Chirurgia (2013) 26(4):313–5.
19. Vini L, Hyer SL, Marshall J, A'Hern R, Harmer C. Long-term results in elderly patients with differentiated thyroid carcinoma. Cancer (2003) 97(11):2736–42. doi: 10.1002/cncr.11410
20. Yang L, Shen W, Sakamoto N. Population-based study evaluating and predicting the probability of death resulting from thyroid cancer and other causes among patients with thyroid cancer. J Clin Oncol (2013) 31(4):468–74. doi: 10.1200/JCO.2012.42.4457
21. Liu M, Ruan M, Chen L. Update on the molecular diagnosis and targeted therapy of thyroid cancer. Med Oncol (2014) 31(6):973. doi: 10.1007/s12032-014-0973-9
22. NIH National Cancer Institute. Surveillance, epidemiology, and end results program. cancer stat facts: Thyroid cancer . Available at: https://seer.cancer.gov/statfacts/html/thyro.html (Accessed October 13, 2020).
23. Balachandran VP, Gonen M, Smith JJ, DeMatteo RP. Nomograms in oncology: more than meets the eye. Lancet Oncol (2015) 16:e173–80. doi: 10.1016/S1470-2045(14)71116-7
24. Sternberg CN. Are nomograms better than currently available stage groupings for bladder cancer? J Clin Oncol (2006) 24(24):3819–20. doi: 10.1200/JCO.2006.07.1290
25. Karakiewicz PI, Briganti A, Chun FK, Trinh QD, Perrotte P, Ficarra V, et al. Multi-institutional validation of a new renal cancer-specific survival nomogram. J Clin Oncol (2007) 25:1316–22. doi: 10.1200/JCO.2006.06.1218
26. Liang W, Zhang L, Jiang G, Wang Q, Liu L, Liu D, et al. Development and validation of a nomogram for predicting survival in patients with resected non-small-cell lung cancer. J Clin Oncol (2015) 33(8):861–9. doi: 10.1200/JCO.2014.56.6661
27. Yang T, Hu T, Zhao M, He Q. Nomogram predicts overall survival in patients with stage IV thyroid cancer (TC): A population-based analysis from the SEER database. Front Oncol (2022) 12:919740. doi: 10.3389/fonc.2022.919740
28. Yang J, Li Y, Liu Q, Li L, Feng A, Wang T, et al. Brief introduction of medical database and data mining technology in big data era. J Evid Based Med (2020) 13(1):57–69. doi: 10.1111/jebm.12373
29. Amin MB, Greene FL, Edge SB, Compton CC, Gershenwald JE, Brookland RK, et al. The eighth edition AJCC cancer staging manual: Continuing to build a bridge from a population-based to a more "personalized" approach to cancer staging. CA Cancer J Clin (2017) 67(2):93–9. doi: 10.3322/caac.21388
30. Roberto M, Botticelli A, Strigari L, Ghidini M, Onesti CE, Ratti M, et al. Prognosis of elderly gastric cancer patients after surgery: a nomogram to predict survival. Med Oncol (2018) 35(7):111. doi: 10.1007/s12032-018-1166-8
31. Fang C, Wang W, Feng X, Sun J, Zhang Y, Zeng Y, et al. Nomogram individually predicts the overall survival of patients with gastroenteropancreatic neuroendocrine neoplasms. Br J Cancer. (2017) 117(10):1544–50. doi: 10.1038/bjc.2017.315
32. Wan G, Gao F, Chen J, Li Y, Geng M, Sun L, et al. Nomogram prediction of individual prognosis of patients with hepatocellular carcinoma. BMC Cancer. (2017) 17(1):91. doi: 10.1186/s12885-017-3062-6
33. Rudloff U, Jacks LM, Goldberg JI, Wynveen CA, Brogi E, Patil S, et al. Nomogram for predicting the risk of local recurrence after breast-conserving surgery for ductal carcinoma in situ. J Clin Oncol (2010) 28(23):3762–9. doi: 10.1200/JCO.2009.26.8847
34. Weiser MR, Landmann RG, Kattan MW, Gonen M, Shia J, Chou J, et al. Individualized prediction of colon cancer recurrence using a nomogram. J Clin Oncol (2008) 26(3):380–5. doi: 10.1200/JCO.2007.14.1291
35. Shah S, Boucai L. Effect of age on response to therapy and mortality in patients with thyroid cancer at high risk of recurrence. J Clin Endocrinol Metab (2018) 103(2):689–97. doi: 10.1210/jc.2017-02255
36. Shen W, Sakamoto N, Yang L. Cancer-specific mortality and competing mortality in patients with head and neck squamous cell carcinoma: a competing risk analysis. Ann Surg Oncol (2015) 22(1):264–71. doi: 10.1245/s10434-014-3951-8
37. Skillington SA, Kallogjeri D, Lewis JS Jr, Piccirillo JF. Prognostic importance of comorbidity and the association between comorbidity and p16 in oropharyngeal squamous cell carcinoma. JAMA Otolaryngol Head Neck Surg (2016) 142(6):568–75. doi: 10.1001/jamaoto.2016.0347
38. Wray CJ, Phatak UR, Robinson EK, Wiatek RL, Rieber AG, Gonzalez A, et al. The effect of age on race-related breast cancer survival disparities. Ann Surg Oncol (2013) 20(8):2541–7. doi: 10.1245/s10434-013-2913-x
39. Rahbari R, Zhang L, Kebebew E. Thyroid cancer gender disparity. Future Oncol (2010) 6(11):1771–9. doi: 10.2217/fon.10.127
40. Zhang D, Tang J, Kong D, Cui Q, Wang K, Gong Y, et al. Impact of gender and age on the prognosis of differentiated thyroid carcinoma: a retrospective analysis based on SEER. Horm Cancer. (2018) 9(5):361–70. doi: 10.1007/s12672-018-0340-y
41. Chen Z, Yin K, Zheng D, Gu J, Luo J, Wang S, et al. Marital status independently predicts non-small cell lung cancer survival: a propensity-adjusted SEER database analysis. J Cancer Res Clin Oncol (2020) 146(1):67–74. doi: 10.1007/s00432-019-03084-x
42. Jin JJ, Wang W, Dai FX, Long ZW, Cai H, Liu XW, et al. Marital status and survival in patients with gastric cancer. Cancer Med (2016) 5(8):1821–9. doi: 10.1002/cam4.758
43. Wang X, Cao W, Zheng C, Hu W, Liu C. Marital status and survival in patients with rectal cancer: An analysis of the surveillance, epidemiology and end results (SEER) database. Cancer Epidemiol. (2018) 54:119–24. doi: 10.1016/j.canep.2018.04.007
44. Shi RL, Qu N, Lu ZW, Liao T, Gao Y, Ji QH. The impact of marital status at diagnosis on cancer survival in patients with differentiated thyroid cancer. Cancer Med (2016) 5(8):2145–54. doi: 10.1002/cam4.778
45. Zhai Z, Zhang F, Zheng Y, Zhou L, Tian T, Lin S, et al. Effects of marital status on breast cancer survival by age, race, and hormone receptor status: A population-based study. Cancer Med (2019) 8(10):4906–17. doi: 10.1002/cam4.2352
46. Aizer AA, Chen MH, McCarthy EP, Mendu ML, Koo S, Wilhite TJ, et al. Marital status and survival in patients with cancer. J Clin Oncol (2013) 31(31):3869–76. doi: 10.1200/JCO.2013.49.6489
47. Bortolato B, Hyphantis TN, Valpione S, Perini G, Maes M, Morris G, et al. Depression in cancer: The many biobehavioral pathways driving tumor progression. Cancer Treat Rev (2017) 52:58–70. doi: 10.1016/j.ctrv.2016.11.004
Keywords: thyroid cancer, geriatric patient, nomogram, prediction model, SEER
Citation: Zhang T-t, Zeng J, Yang Y, Wang J-j, Kang Y-j, Zhang D-h, Liu X-z, Chen K, Wang X and Fang Y (2022) A visualized dynamic prediction model for survival of patients with geriatric thyroid cancer: A population-based study. Front. Endocrinol. 13:1038041. doi: 10.3389/fendo.2022.1038041
Received: 06 September 2022; Accepted: 28 November 2022;
Published: 09 December 2022.
Edited by:
Erivelto Martinho Volpi, Centro de referencia no ensino do diagnóstico por imagem (CETRUS), BrazilReviewed by:
Lingyu Bao, National Institutes of Health (NIH), United StatesLilah Morris-Wiseman, Johns Hopkins Medicine, United States
Gregorio Scerrino, University of Palermo, Italy
Copyright © 2022 Zhang, Zeng, Yang, Wang, Kang, Zhang, Liu, Chen, Wang and Fang. This is an open-access article distributed under the terms of the Creative Commons Attribution License (CC BY). The use, distribution or reproduction in other forums is permitted, provided the original author(s) and the copyright owner(s) are credited and that the original publication in this journal is cited, in accordance with accepted academic practice. No use, distribution or reproduction is permitted which does not comply with these terms.
*Correspondence: Kang Chen, Y3ljb25fY2tAeWVhaC5uZXQ=; Xuan Wang, ZW5kb2NyaW5lQDE2My5jb20=; Yi Fang, ZmFuZ3lpNXpob25neGluQDE2My5jb20=
†These authors contributed equally to the work