 Yingjie Su
 Ning Ding
 Yang Zhou
 Guifang Yang
 Xiangping Chai
- 1Department of Emergency Medicine, The Second Xiangya Hospital, Central South University, Changsha, Hunan, China
- 2Emergency Medicine and Difficult Diseases Institute, Central South University, Changsha, Hunan, China
- 3Trauma Center, Changsha, Hunan, China
Objective: This study aimed to explore the association between uric acid (UA) and total femur bone mineral density (BMD) in hypertensive and non-hypertensive groups.
Methods: We conducted a cross-sectional study of 13,108 participants in the NHANES database, including 4,679 hypertensive and 8,429 non-hypertensive subjects. A weighted multiple linear regression analysis was conducted to explore the association between UA and total femur BMD.
Results: In the hypertensive group, the relationship between UA and total femur BMD was positive [β, 3.02 (95% CI, -0.44 to 6.48), p = 0.0962). In the non-hypertensive group, the association was significantly positive [β, 5.64 (95% CI, 2.06–9.22), p = 0.0038]. In gender-stratified analysis, UA was analyzed as a continuous variable and a categorical variable (quartile). The significantly positive association was present in both the hypertensive male group [β, 5.10 (95% CI, 0.98–9.21), p for trend = 0.0042] and non-hypertensive male group [β, 10.63 (95% CI, 6.32–14.94), p for trend = 0.0001]. A smooth curve fitting showed that in the hypertensive male group, the relationship between UA and total femur BMD was an inverted U-shaped curve. In the hypertensive female group, the relationship was basically negative. In the non-hypertensive population, the relationship between UA and total femur BMD was an inverted U curve in both men and women.
Conclusion: In the hypertensive male group, the association between UA and total femur BMD was an inverted U-shaped curve. As to women, the relationship was basically negative. In the non-hypertensive group, the association between UA and total femur BMD was an inverted U-shaped curve in different genders.
Introduction
Hyperuricemia has been proven to be associated with a variety of clinical diseases, such as hypertension, heart failure, insulin resistance, diabetes, osteoporosis, and chronic renal disease (1–7). Previous studies have shown that both blood pressure and hypertension tend to increase with elevated uric acid (UA) levels (8–10). According to NHANES 2015–2016 data, in the US population, the prevalence of hyperuricemia in women was 20.2%, and that in women was 20.0% (11). In recent years, the relationship between UA and bone mineral density (BMD) or osteoporosis has also been discussed a lot. A meta-analysis of 55,859 subjects showed that UA levels were positively associated with BMD and negatively associated with new fractures (12). A meta-analysis of five prospective studies including 29,110 participants showed that UA levels were inversely associated with fracture risk, with an overall hazard ratio of 0.79 (95% CI, 0.69–0.89) in the highest group compared to the lowest group after tertiary grouping of UA levels (13). High oxidative stress levels and weak antioxidant capacity may be the underlying mechanisms leading to osteoporosis (14, 15). The antioxidant effect of UA may be used to explain the protective effect on BMD (16).
Inversely, few studies have investigated the relationship between UA and BMD in hypertensive and non-hypertensive populations. In this population, especially the hypertensive population, whether there is a correlation between low UA levels and decreased BMD is a question that deserves the attention of clinicians. As consequence, a cross-sectional study of 13,108 participants was used to investigate the relationship between UA and total femur BMD. The data on these participants were derived from the NHANES database.
Methods
Study population
NHANES was a research program to investigate the health and nutritional status of the US population. It was counted on a 2-year cycle. A certain number of people are included in each cycle, and their sociology, lifestyle, diet, disease, blood testing, and other relevant indicators were collected. In our research, we collected data from four cycles of 2007–2008, 2009–2010, 2013–2014, and 2017–2018 for analysis (2011–2012, 2015–2016 without femoral BMD examinations). A total of 18,893 subjects completed femoral BMD scans during these four cycles, and we excluded 5,785 participants for the following reasons: 1) missing UA data (n = 2362); 2) missing data on the diagnosis of hypertension; 3) bilateral oophorectomy or hysterectomy or malignancy or thyroid disease (n = 3211); and 4) taking prednisone or cortisone or estrogen or progesterone. Finally, 13,108 participants were included in the study, including 4,679 in the hypertensive group and 8,429 in the non-hypertensive group (Figure 1).
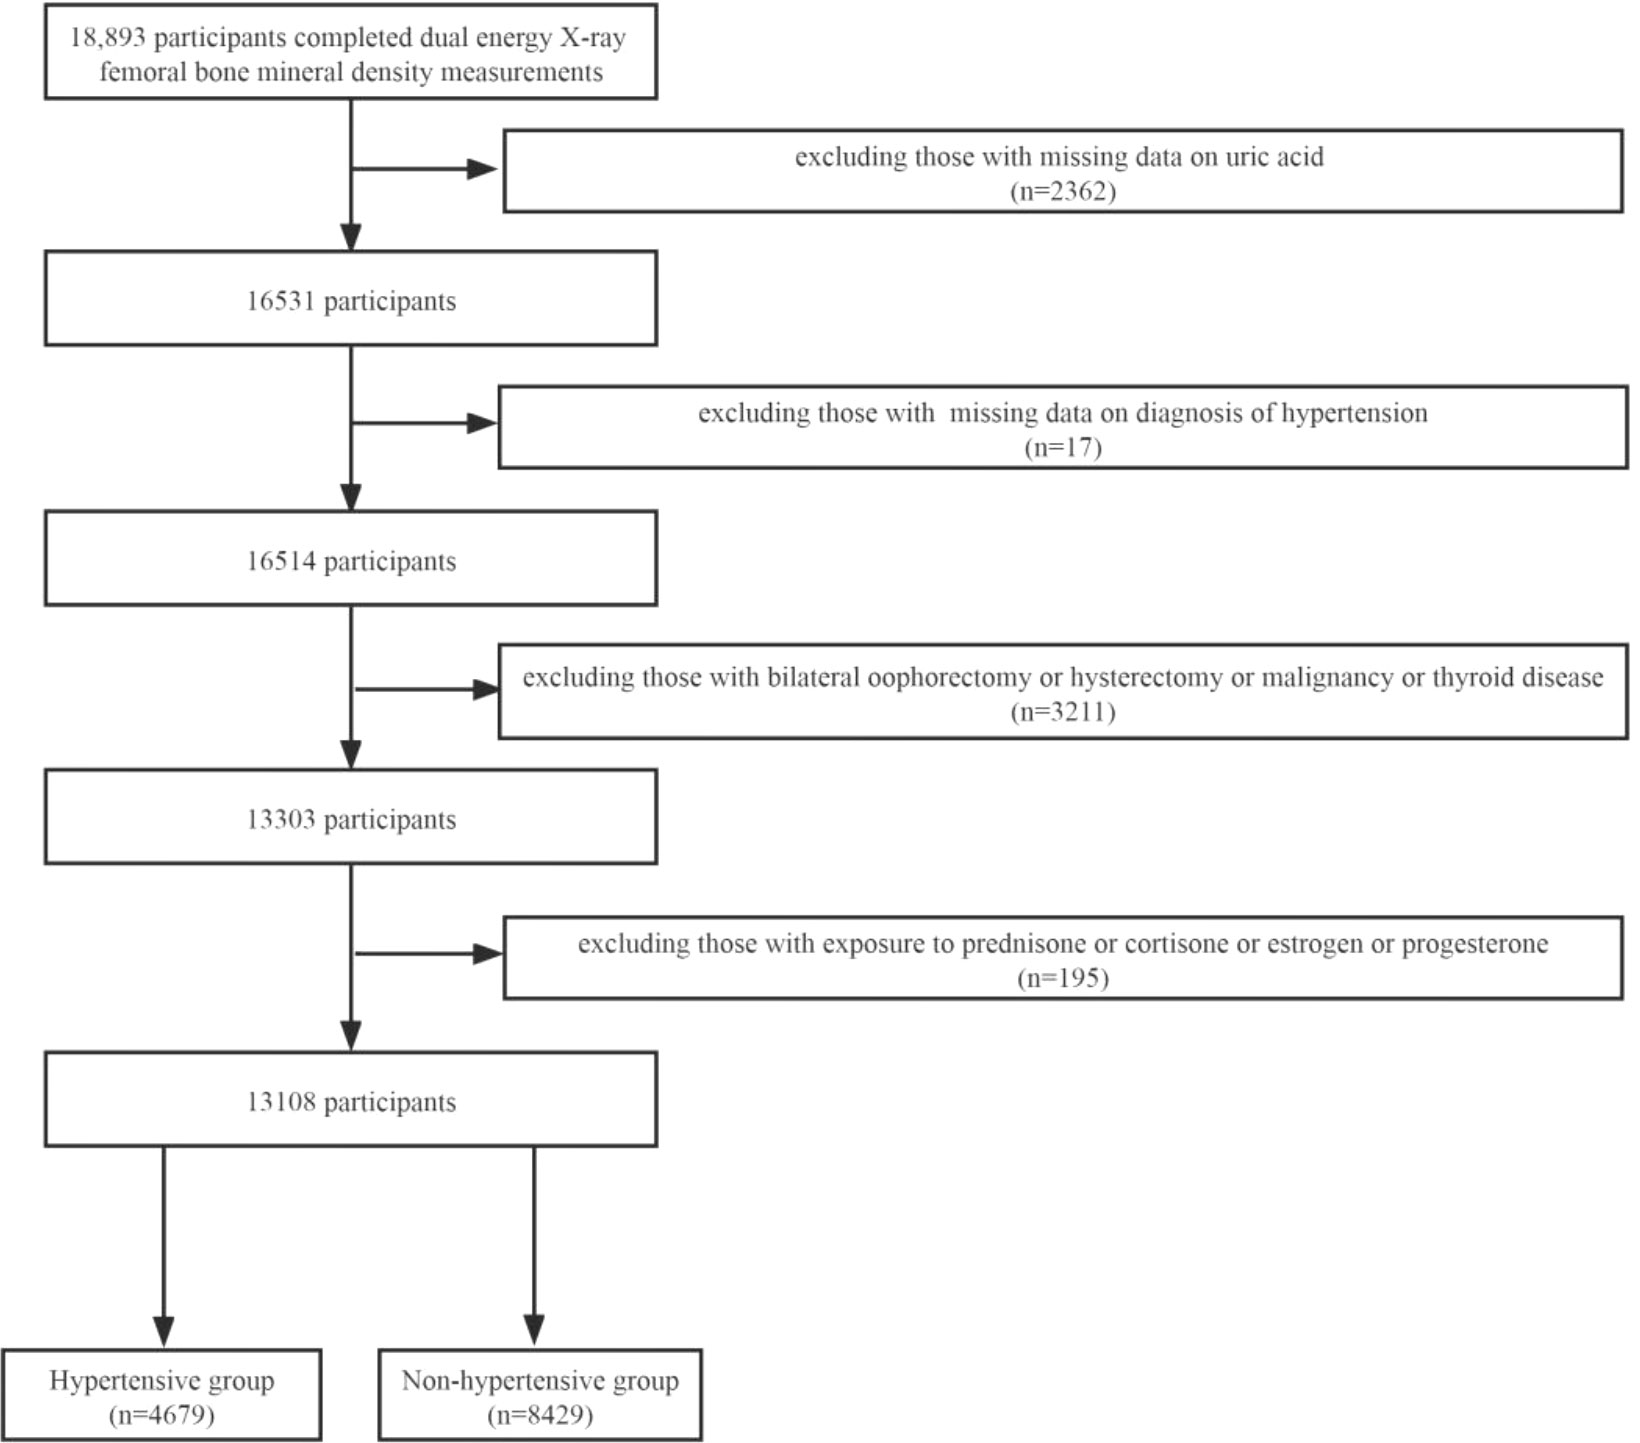
Figure 1 Flowchart of the study design and participants excluded from the study.
Bone mineral density and hypertension
In our study, total femur BMD was obtained by measuring the femur by dual energy X-ray absorptiometry (DXA). DXA was widely used in the measurement of BMD and has the advantages of fast speed, convenience, and low radiation (17). Three Hologic QDR-4500A fan-beam densitometers were used for total femur BMD scans, which were performed by trained and certified radiologic technicians. Longitudinal monitoring of the instrument by weekly scanning of the Hologic Femur Phantom was conducted according to the manufacturer’s requirements. Participants meeting one of the following four criteria will be defined as having hypertension: 1) systolic blood pressure (SBP) ≥140 mmHg, 2) diastolic blood pressure (DBP) ≥90 mmHg, 3) having been told by a doctor to have high blood pressure, and 4) taking antihypertensive medication. The SBP and DBP were obtained by the following method: All participants had their blood pressure measured by trained and certified personnel after a 5-min rest in a seated position. Three consecutive blood pressure readings were obtained by auscultation, and if blood pressure measurement was not completed successfully, a fourth measurement was taken. SBP and DBP are averages of all available measurements.
Sociodemographic and lifestyle factors
We included three demographic variables: gender, age, and race. Lifestyle included smoking status, alcohol consumption, and total physical activity (TPA). Smoking status was classified according to multiple questions in the smoking questionnaire: current smoking, former smoking, non-smoking, and unrecorded. Lifetime smoking of less than 100 cigarettes was defined as non-smoking. Alcohol consumption was classified as drinking, non-drinking, and unrecorded according to questions on the drinking questionnaire. Among them, drinking more than or equal to 12 times per year was defined as drinking. TPA data were based on the Global Physical Activity Questionnaire, which includes three types of physical activity: recreational, occupational, and transportation, and were divided into vigorous and moderate categories according to the intensity of each physical activity. TPA is the sum of the three types of physical activity (multiplied by two if the physical activity was vigorous) (18, 19). According to the 2018 Physical Activity Guidelines for Americans, subjects were defined as active participants if their TPA minutes were ≥150 min (20).
Metabolic factors, clinical laboratory indicators, and dietary factors
Metabolic factors and clinical laboratory indicators include diabetes, body mass index (BMI), total cholesterol, glomerular filtration rate (GFR), serum vitamin D2 + D3, and UA. Participants meeting one of the following four criteria will be defined as having diabetes:1) taking hypoglycemic agent or insulin, 2) fasting blood sugar ≥126 mg/dl, 3) 2-h Oral Glucose Tolerance Test blood sugar ≥200 mg/dl, and 4) glycohemoglobin ≥6.5%. BMI was calculated as weight in kilograms divided by height in meters squared. The Modification of Diet in Renal Disease (MDRD) equation was used to calculate GFR: 186 × SC−1.154 × Age−0.203 × (0.742 if female) (21). Dietary variables incorporate daily total protein and total calcium intake. Two 24-h dietary recall recordings were conducted by trained dietary interviewers. Total protein and total calcium intakes were the mean of protein and calcium intakes recorded from two dietary recalls. In the hypertensive group, whether antihypertensive treatment was administered was also included in the data analysis.
Statistical analysis
Appropriate weights, stratification, and clustering were used in the data analysis in order for the findings to be representative of the US population. In hypertensive and non-hypertensive groups, the correlation between UA and total femur BMD was determined by the Pearson correlation test. We use a weighted mean [95% confidence intervals (CI)] representation for continuous variables and weighted percentage (95% CI) representation for categorical variables. Continuous and categorical clinical characteristics were compared using survey-weighted linear regression and survey-weighted chi-square tests, respectively. The independent relationship between UA and total femur BMD in the hypertensive and non-hypertensive groups was conducted by applying the multiple linear regression model. At the same time, the linear trend test was performed after grouping the UA into quartiles. To discover the nonlinear relationship between UA and total femur BMD, we performed smooth curve fittings. All variables were incorporated into the model to adjust for potential confounding, and analyses were stratified by gender. Data analysis was performed using the statistical packages R (http://www.R-project.org) and EmpowerStats (http://www.empowerstats.com). Differences were considered statistically significant when p-value <0.05.
Results
Subjects characteristics
The baseline characteristics of participants were illuminated in Table 1. In the hypertensive group (n = 4679), there was a significantly positive correlation between UA and total femur BMD (r = 0.2081, p < 0.0001). The ratios of men and women were 59.62% and 40.38%, respectively; 66.56% were non-Hispanic white. The proportions of smoking, drinking, active participants, and diabetes were 18.70%, 49.21%, 58.44%, and 24.38% respectively; 11.33% people have a GFR <60 ml/min/1.73 m2. The mean value for age, total cholesterol, BMI, serum vitamin D2 + D3, protein intake, calcium intake, total femur BMD, and UA were 56.54 years, 5.09 mmol/L, 29.93 kg/m2, 68.95 nmol/L, 82.52 g/day, 938.74 mg/day, 976.56 mg/cm2, and 5.83 mg/dl, respectively; 59.12% of the population received antihypertensive therapy. In the non-hypertensive group (n = 8429), there was a significantly positive correlation between UA and total femur BMD (r = 0.2735, p < 0.0001). The ratios of men and women were 54.00% and 46.00%, respectively; 65.48% were non-Hispanic white. The proportions of smoking, drinking, active participants, and diabetes were 18.56%, 47.89%, 72.72%, and 5.82% respectively; 1.74% people have a GFR <60 ml/min/1.73 m2. The mean value for age, total cholesterol, BMI, serum vitamin D2 + D3, protein intake, calcium intake, total femur BMD, and UA were 38.95 years, 4.89 mmol/L, 26.60 kg/m2, 68.87 nmol/L, 84.43 g/day, 1010.29 mg/day, 981.54 mg/cm2, and 5.25 mg/dl, respectively.
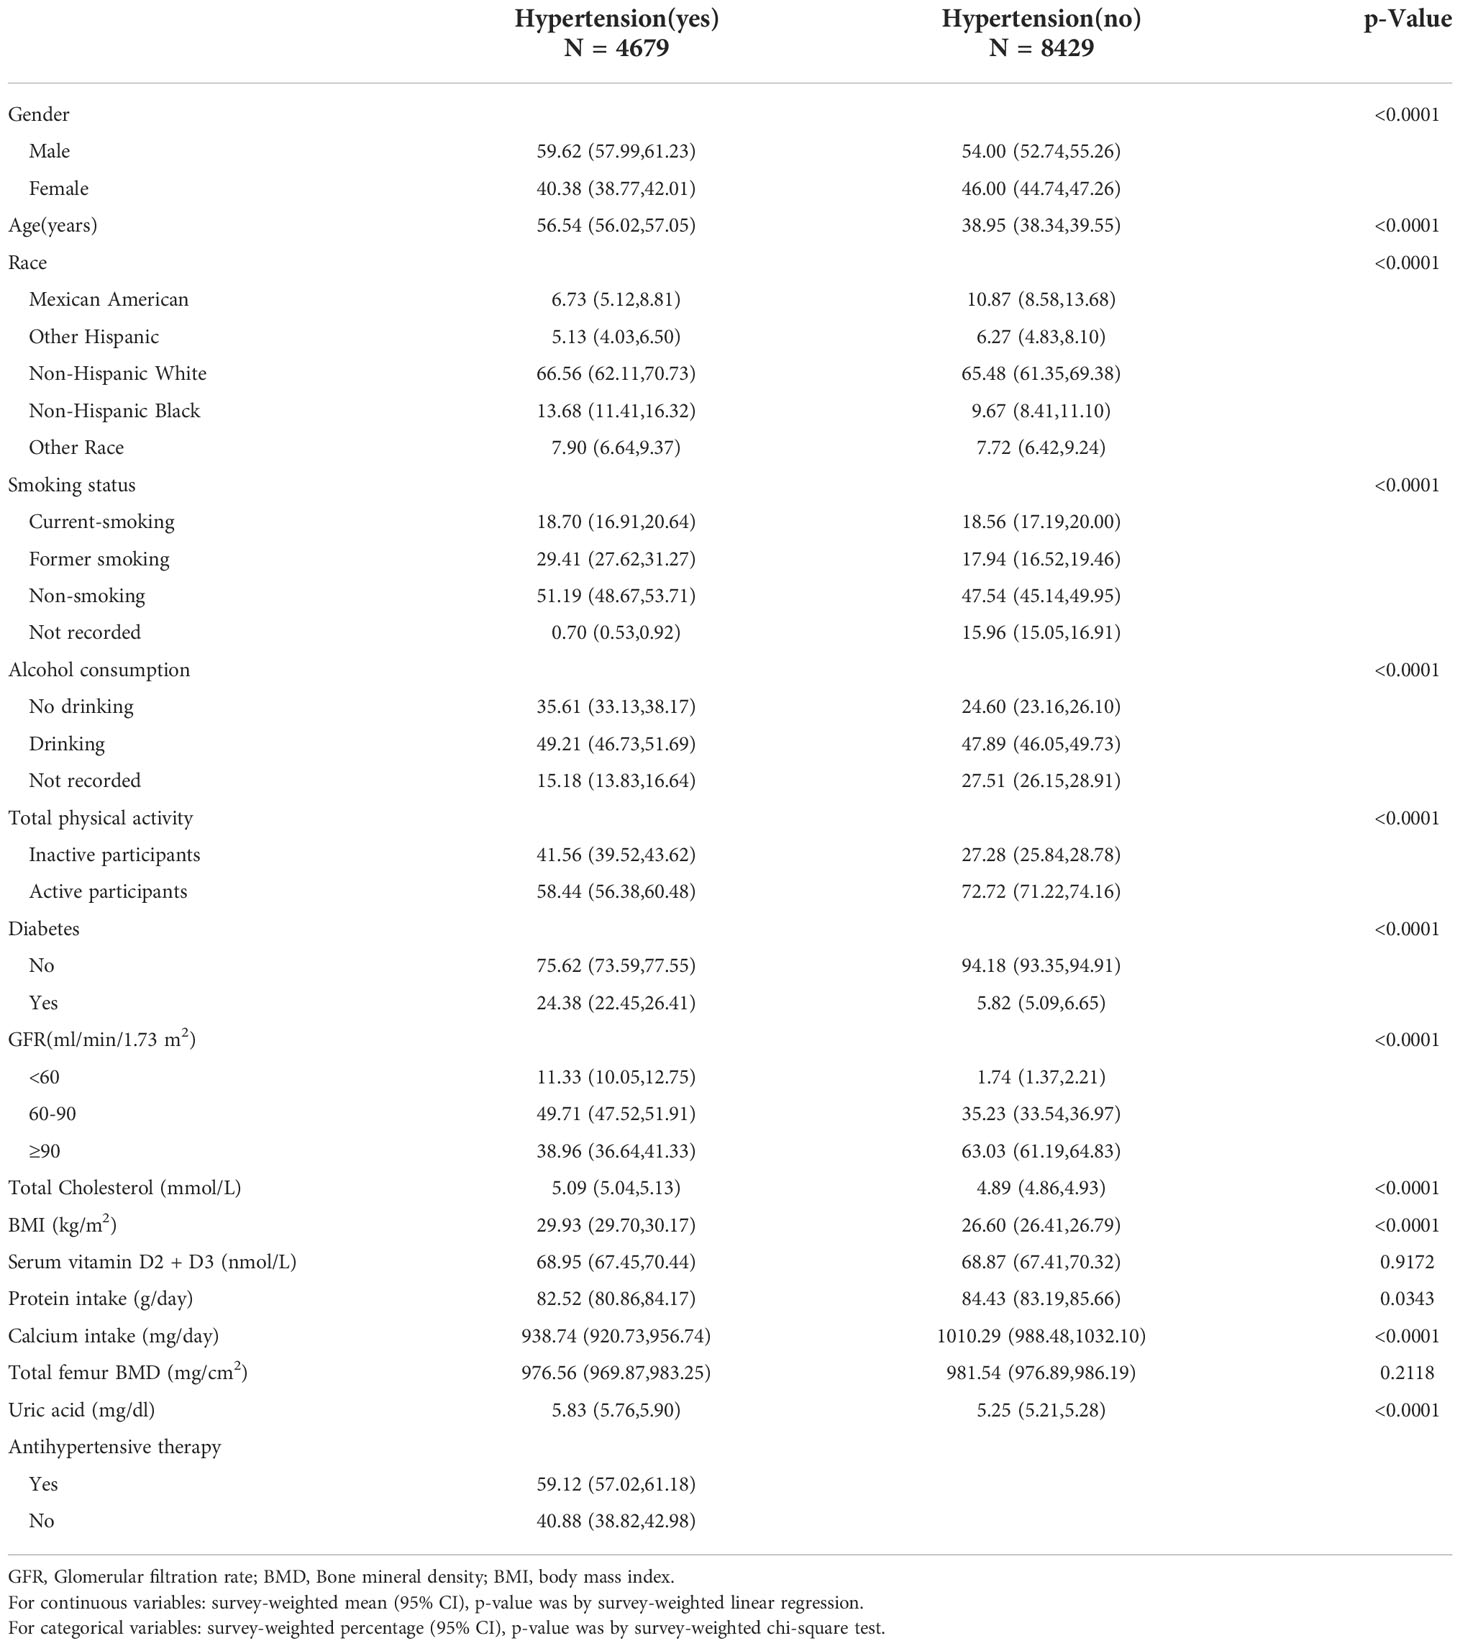
Table 1 Description of participants based on the presence or absence of hypertension.
Association between UA and total femur BMD
Table 2 shows the results of weighted multiple linear regression analyses between UA and total femur BMD in different models. In model I, sociodemographic factors (gender, age, race) were adjusted. The significantly positive association can be found in the hypertensive [β, 11.06 (95% CI, 7.04–15.07)] and non-hypertensive group (β, 23.83 (95% CI, 20.25–27.40)]. In model II, lifestyle factors (smoking status, alcohol consumption, TPA) were adjusted and added into model I. The significantly positive association still presented in the hypertensive [β, 10.73 (95% CI, 6.69–14.77)] and non-hypertensive group [β, 22.68 (95% CI, 19.17–26.20)]. In model III, metabolic, clinical laboratory indicators, and dietary factors (BMI, GFR, total cholesterol, diabetes, serum vitamin D2 + D3, protein intake, calcium intake) were adjusted and added into model II. In the hypertensive group, whether or not to receive antihypertensive therapy was also included in the model to adjust. Although the positive association still presented [β, 3.02 (95% CI, -0.44 to 6.48)], the p-value was >0.05. In the non-hypertensive group, a significantly positive association still existed [β, 5.64 (95% CI, 2.06–9.22)].
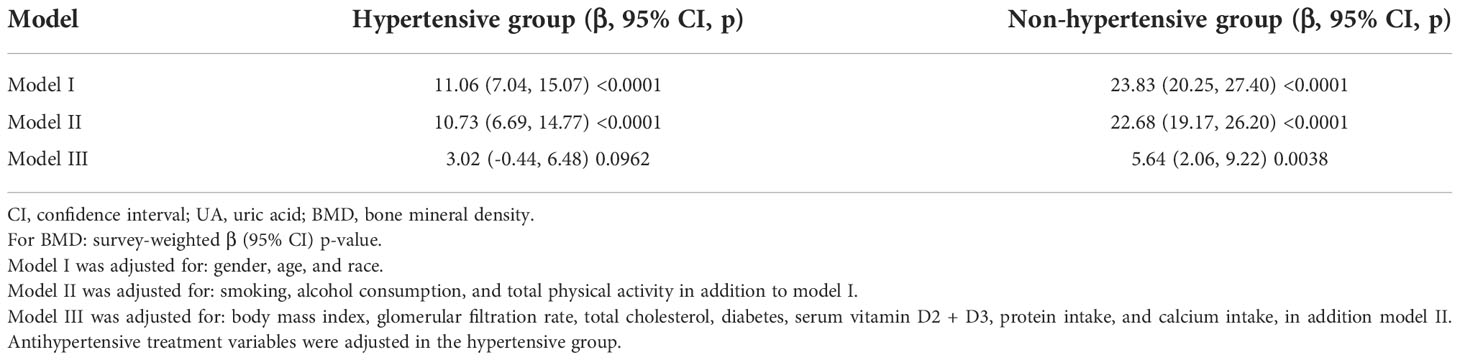
Table 2 Result of multiple linear regression analysis between UA and total femur BMD in hypertensive and non-hypertensive group.
Subgroup analysis stratified by gender
In different subgroup analyses, we analyzed UA with continuous and categorical variables (quartile). In the hypertensive group (Figure 2), as to men, the relationship between UA and total femur BMD was significantly positive [β, 5.10 (95% CI, 0.98, 9.21)], and the trend test was significant (p = 0.0042). Paradoxically, this linear relationship and trend test were not significant in women. In the non-hypertensive group (Figure 3), the significantly positive association [β, 10.63 (95% CI, 6.32–14.94)] and trend test (p = 0.0001) still existed in men. In women, this linear relationship and trend test were also not significant. So to explore the nonlinear relationship, we performed a smooth curve fitting. In hypertensive male and female groups (Figure 4), the relationships were an inverted U-shaped curve and negative, respectively. In the non-hypertensive population (Figure 5), the relationship between UA and total femur BMD was an inverted U curve in both men and women.
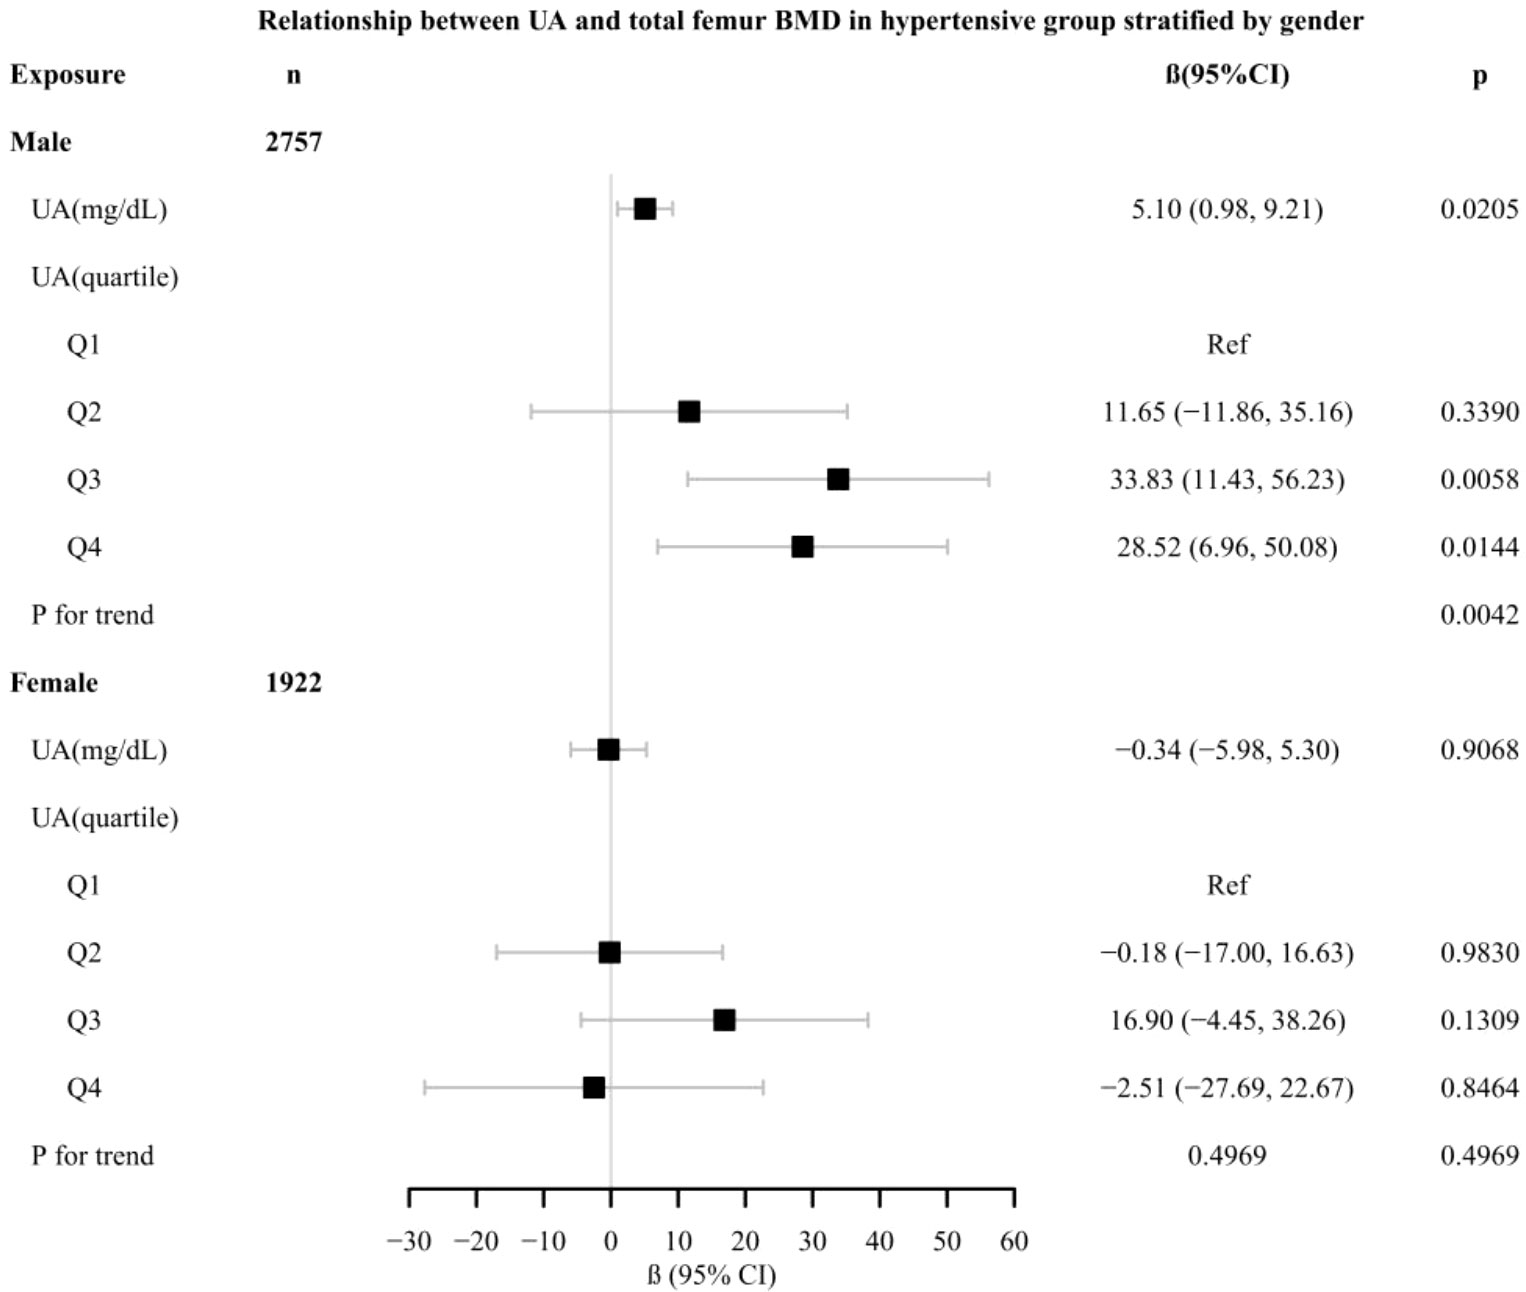
Figure 2 Relationship between UA and total femur BMD in the hypertensive group, stratified by gender. Adjusted for: race, age, alcohol consumption, smoke, total physical activity, body mass index, glomerular filtration rate, total cholesterol, diabetes, serum vitamin D2 + D3, protein intake, calcium intake, antihypertensive treatment.
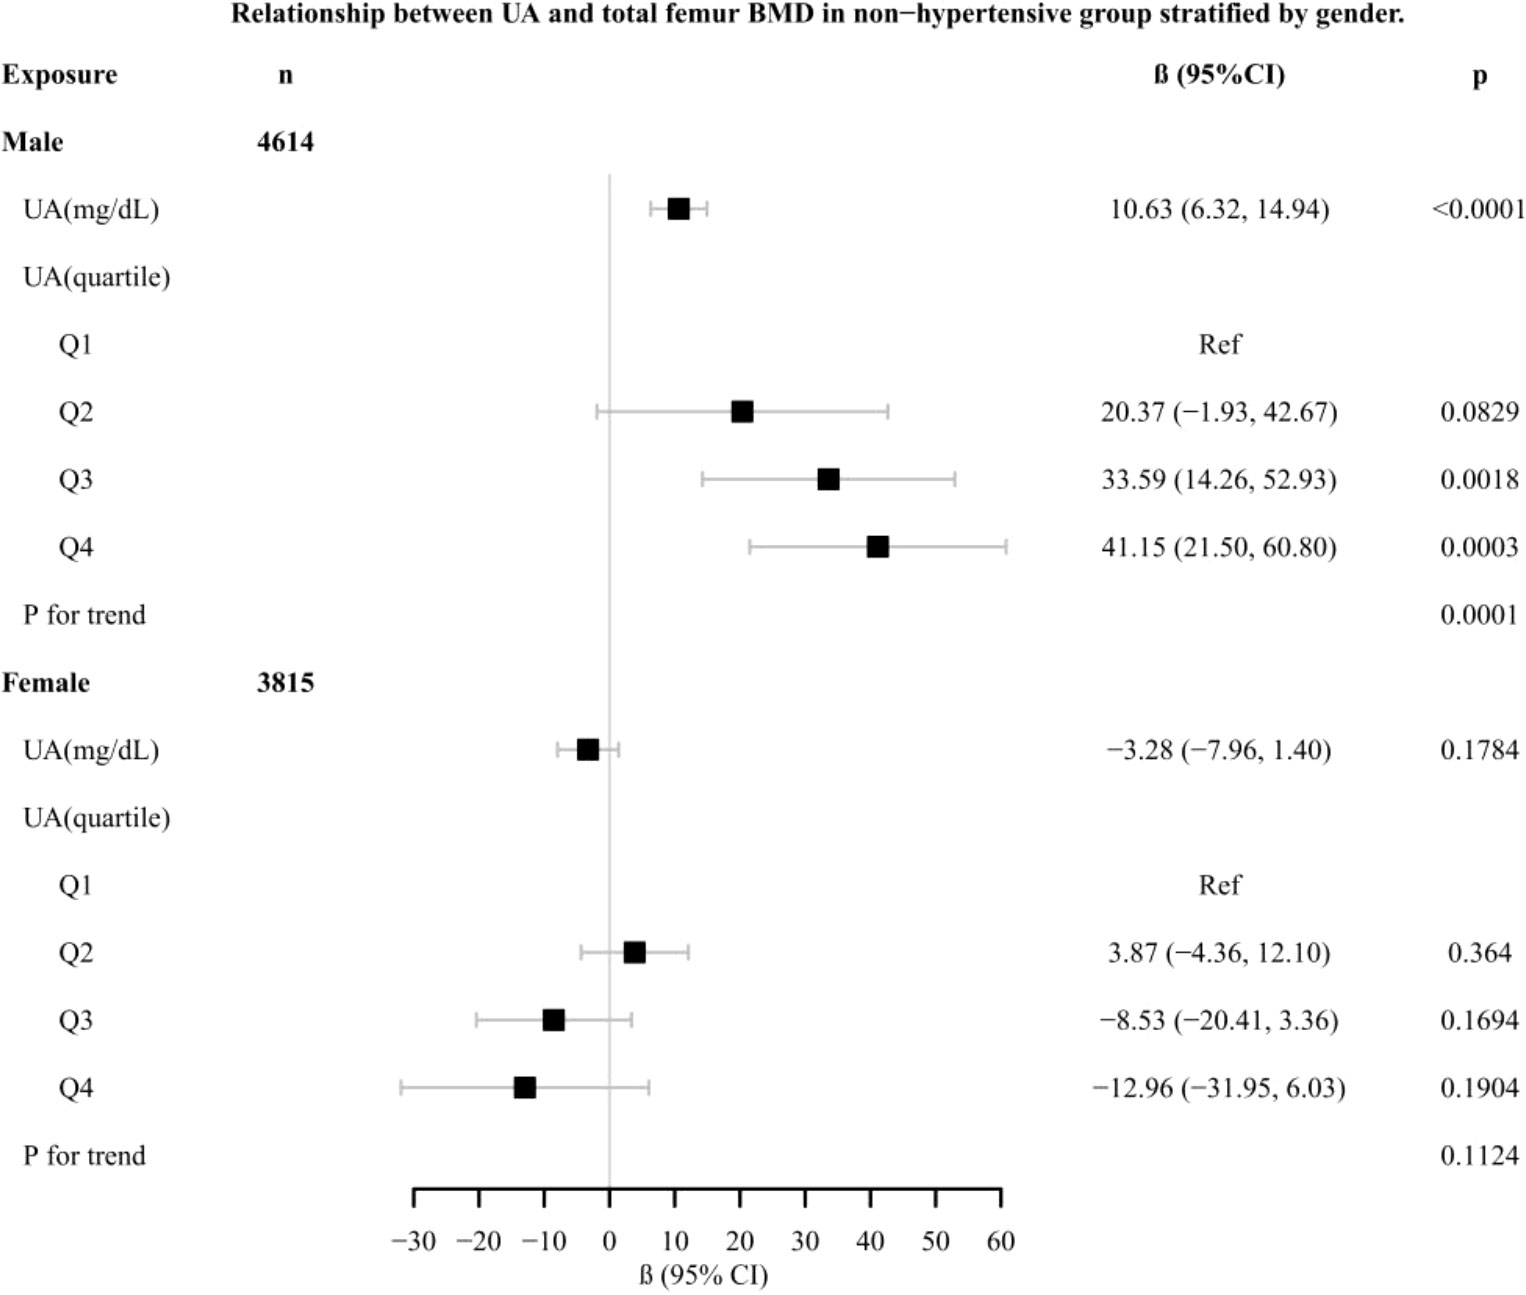
Figure 3 Relationship between UA and total femur BMD in the non-hypertensive group, stratified by gender. Adjusted for: race, age, alcohol consumption, smoke, total physical activity, body mass index, glomerular filtration rate, total cholesterol, diabetes, serum vitamin D2 + D3, protein intake, calcium intake.
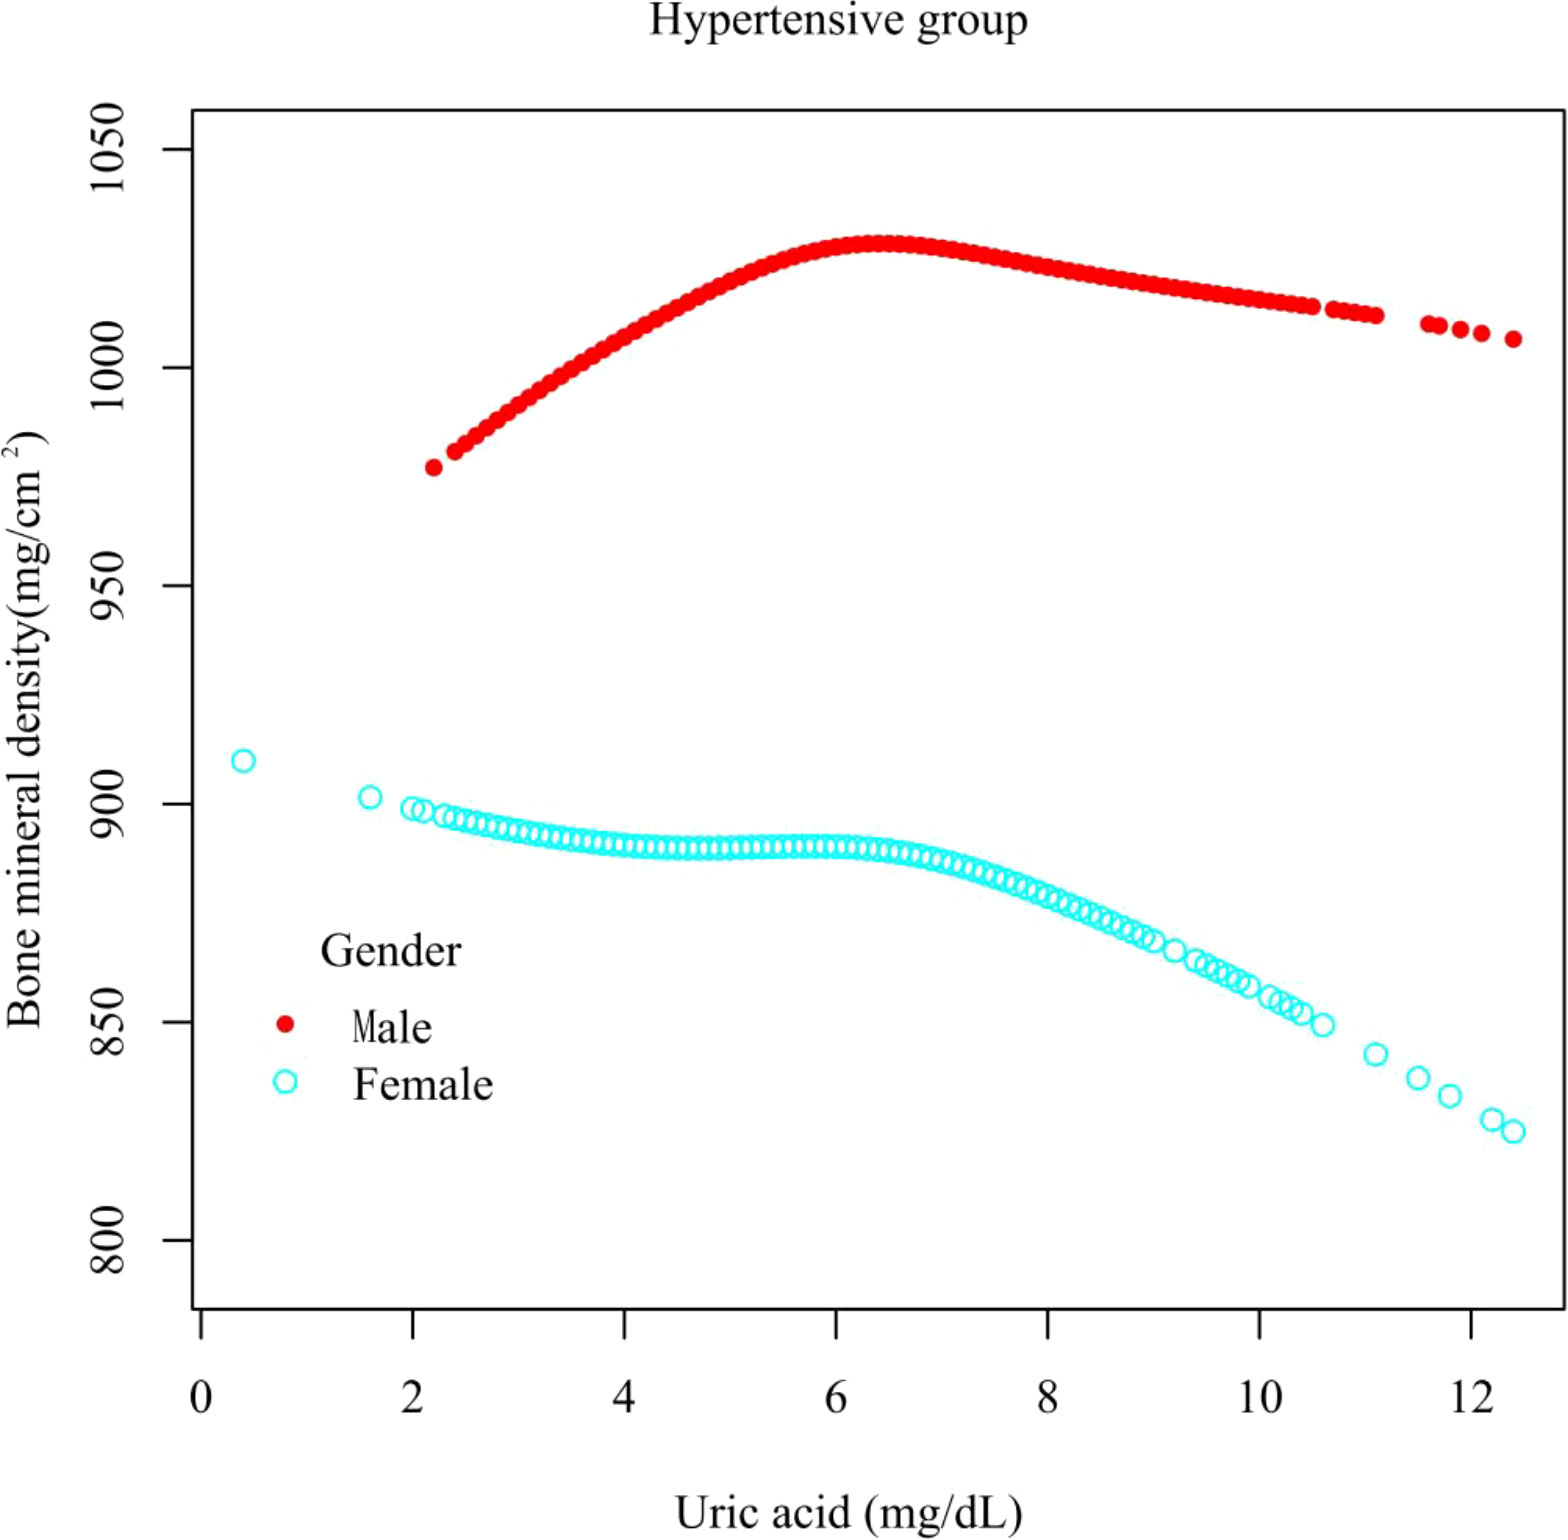
Figure 4 A smooth curve fitting for the relationship between UA and total femur BMD in the hypertensive group, stratified by gender. Adjusted for: race, age, alcohol consumption, smoke, total physical activity, body mass index, glomerular filtration rate, total cholesterol, diabetes, serum vitamin D2 + D3, protein intake, calcium intake, antihypertensive treatment.
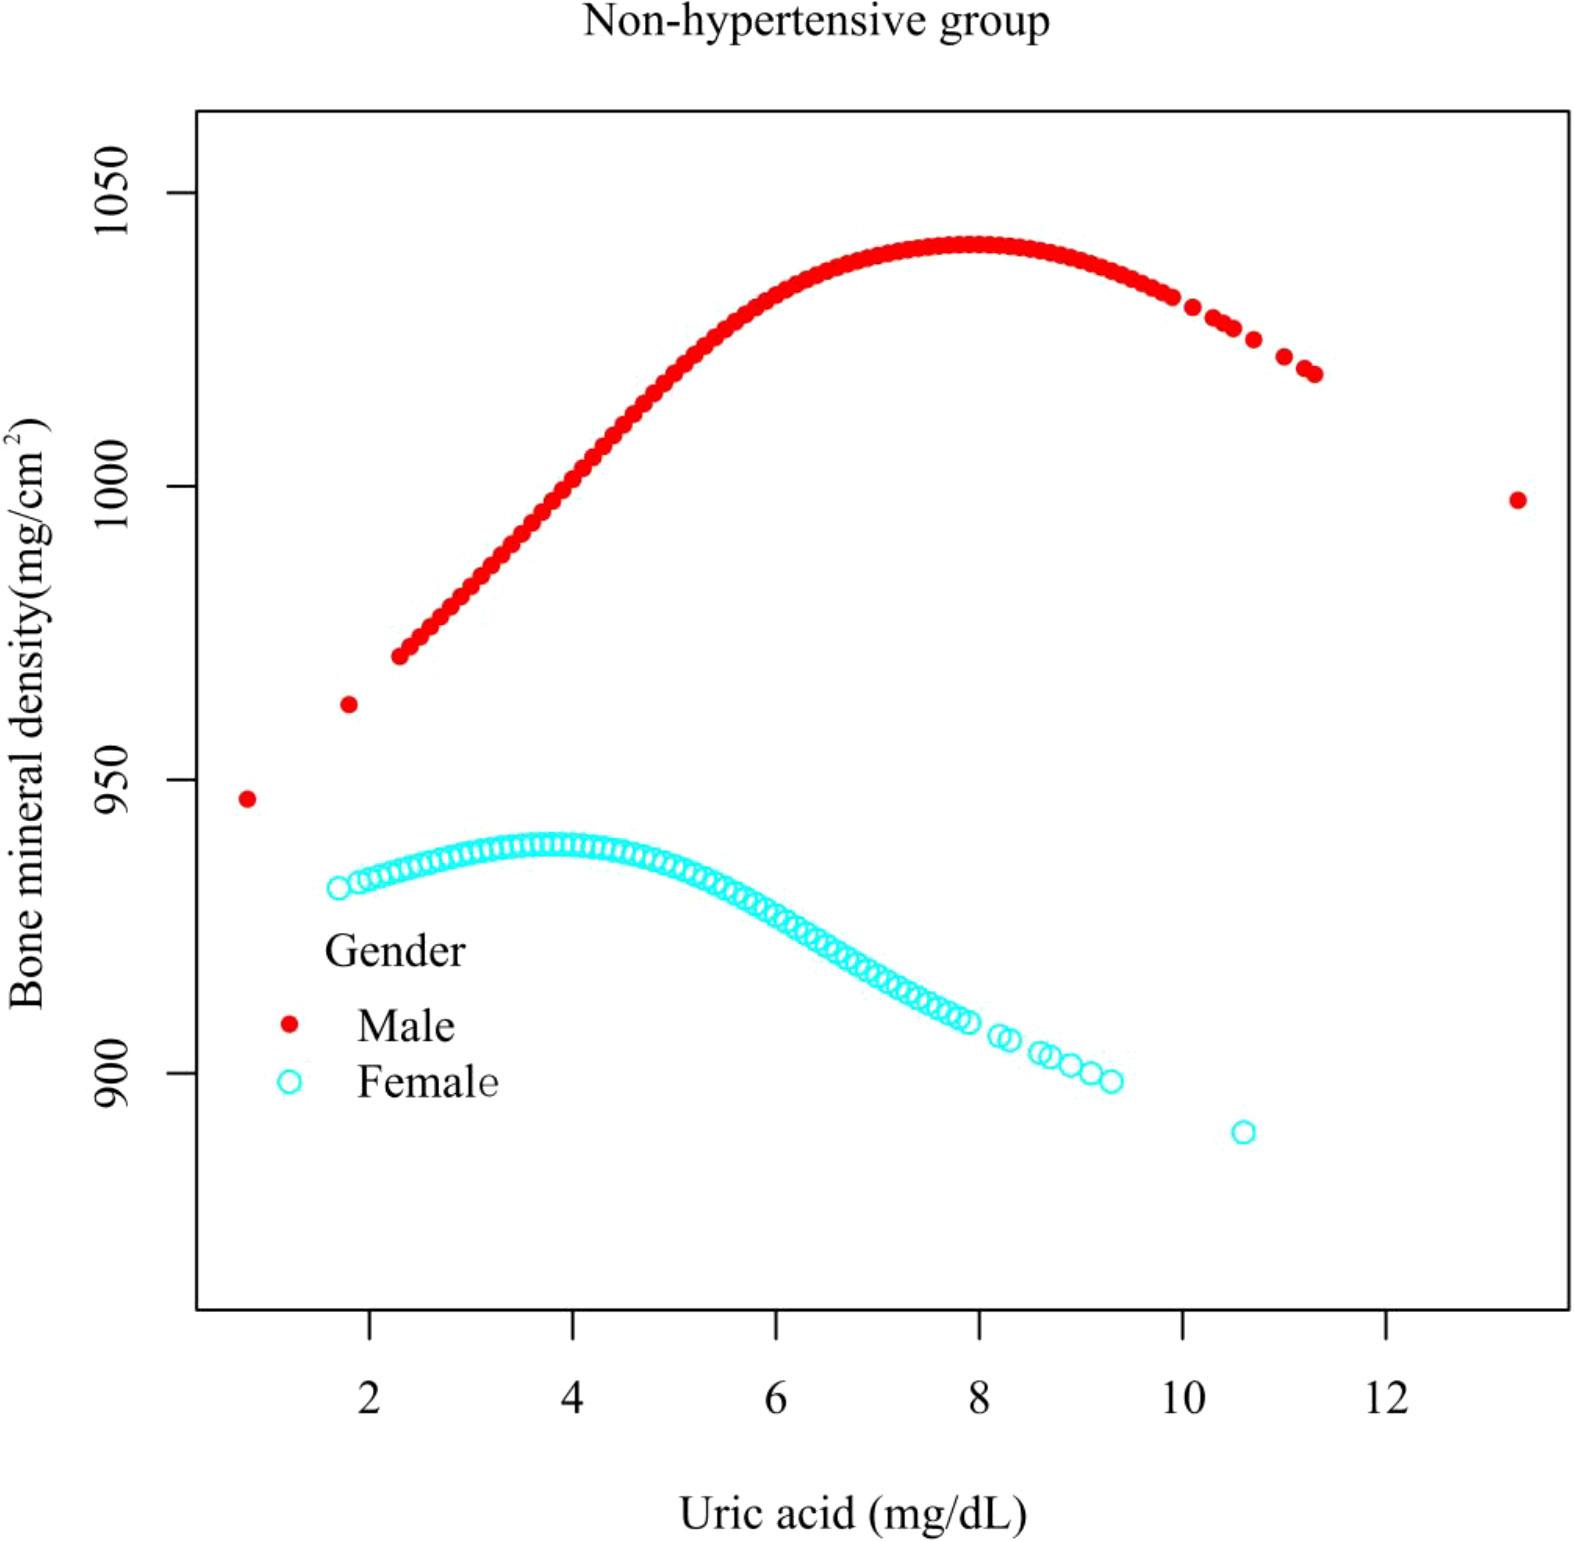
Figure 5 A smooth curve fitting for the relationship between UA and total femur BMD in the non-hypertensive group, stratified by gender. Adjusted for: race, age, alcohol consumption, smoke, total physical activity, body mass index, glomerular filtration rate, total cholesterol, diabetes, serum vitamin D2 + D3, protein intake, calcium intake.
Discussion
In this study, the association of UA with total femur BMD in hypertensive and non-hypertensive populations was investigated in a large population (n = 13108). In the hypertensive male group, the association between UA and total femur BMD was an inverted U-shaped curve. As for the female, the relationship between the two was basically negative. In the non-hypertensive group, the association between UA and total femur BMD was an inverted U-shaped curve between different genders.
Many studies have reported the relationship between UA and BMD. However, there are some differences in the findings due to the different study groups. A cross-sectional study including 1705 men over 70 years of age suggested that men with serum UA levels above the group median had significantly higher BMD at all sites than men with UA levels below the median (22). Paradoxically, in a prospective cohort study of 1963 older men (age ≥65), high UA levels (≥6.88 mg/dl) were associated with an increased risk of hip fracture (23). In terms of women, in a study including 615 perimenopausal and postmenopausal Japanese women, higher UA levels were linearly associated with higher lumbar spine BMD (24). Inversely, in another recent study of 103,799 women, those with a history of gout had a 38% higher risk of hip fracture than those without a history of gout after 22 years of follow-up (25).
When we explored the relationship between UA and total femur BMD in both hypertensive and non-hypertensive male subgroups, the trend test was significant, and the smooth curve fitting showed an inverted U-shaped curve. The reason for this result was that, according to the quartiles of UA levels, women have lower UA levels than men, resulting in fewer men in the low group and a majority of men in the high group. Although the antioxidant effect of UA can prevent the loss of bone mass (16), studies have also shown that the higher the UA level, the lower the testosterone level (26, 27), and the lack of testosterone can lead to osteoporosis (28). This mechanism may be applied to explain the inverted U relationship between UA and total femur BMD in men. There were gender differences in the relationship between UA and BMD in the hypertensive group. Although the prevalence of chronic kidney disease (CKD) was higher among women than men, the rate of functional deterioration is faster in men than in women (29). Animal studies have shown that estrogen has a protective effect on the kidney (30) and that testosterone worsens kidney function (31), while kidney oxidative stress levels are lower in women (32). CKD causes hyperparathyroidism, increased UA levels, and decreased vitamin D activity, while UA decreased vitamin D levels and the parathyroid hormone decreased UA excretion. The interaction of multiple factors eventually leads to a decrease in bone mass (33) and gender differences in the hypertensive population. In hypertensive and non-hypertensive women, the relationship between UA and total femur BMD was negative and inverted U-shaped, respectively, which could be partly explained by the different levels of sex hormones. The mean ages of the hypertensive and non-hypertensive women in our study were 57.52 and 39.00 years, respectively; so most of the hypertensive women in our study were in menopause. After menopause, the lack of sex hormones can lead to decreased bone mass and osteoporosis (34). Nevertheless, the lack of estrogen and progesterone will reduce the function of the kidneys to excrete UA, resulting in an increase in the level of UA (35). Homoplastically, research has also shown that in postmenopausal women, higher levels of UA were associated with lower levels of vitamin D (36).
The significance of our study is to provide clinicians with some hints that appropriate UA-lowering therapy does not necessarily lead to bone loss in both hypertensive and non-hypertensive populations. Prospective studies are needed in the future to verify the effect of UA-lowering therapy on BMD in hypertensive and non-hypertensive populations. Of course, our study also has certain limitations. First, due to the limitations of cross-sectional study, the causal effect of UA on BMD has not been determined. Future prospective studies will be needed to clarify the relationship between them. Second, some variables in the study were based on self-report and may have subjective recall bias. Third, some participants in the hypertensive group were diagnosed based on the measurement of blood pressure multiple times in a short period of time, which may not necessarily reflect the state of blood pressure.
Conclusions
In the hypertensive male group, the association between UA and total femur BMD was an inverted U-shaped curve. As to women, the relationship was basically negative. In the non-hypertensive group, the association between UA and total femur BMD was an inverted U-shaped curve between different genders.
Data availability statement
The raw data supporting the conclusions of this article will be made available by the authors, without undue reservation.
Ethics statement
The studies involving human participants were reviewed and approved by National Center for Health Statistics. The patients/participants provided their written informed consent to participate in this study. Written informed consent was obtained from the individual(s) for the publication of any potentially identifiable images or data included in this article.
Author contributions
Conception and design: YS and ND; Administrative support: XC; Provision of study materials or patients: XC; Collection and assembly of data: YS, YZ, and GY; Data analysis and interpretation: YS and ND. All authors contributed to the article and approved the submitted version.
Funding
Key Research and Development Program of Hunan Province (2019SK2022). Degree and Postgraduate Education Reform Project of Central South University (2022JGB008).
Conflict of interest
The authors declare that the research was conducted in the absence of any commercial or financial relationships that could be construed as a potential conflict of interest.
Publisher’s note
All claims expressed in this article are solely those of the authors and do not necessarily represent those of their affiliated organizations, or those of the publisher, the editors and the reviewers. Any product that may be evaluated in this article, or claim that may be made by its manufacturer, is not guaranteed or endorsed by the publisher.
References
1. Feig DI, Kang DH, Johnson RJ. Uric acid and cardiovascular risk. N Engl J Med (2008) 359(17):1811–21. doi: 10.1056/NEJMra0800885
2. Kodama S, Saito K, Yachi Y, Asumi M, Sugawara A, Totsuka K, et al. Association between serum uric acid and development of type 2 diabetes. Diabetes Care (2009) 32(9):1737–42. doi: 10.2337/dc09-0288
3. Huang H, Huang B, Li Y, Huang Y, Li J, Yao H, et al. Uric acid and risk of heart failure: a systematic review and meta-analysis. Eur J Heart Fail (2014) 16(1):15–24. doi: 10.1093/eurjhf/hft132
4. Sharaf El Din U, Salem MM, Abdulazim DO. Uric acid in the pathogenesis of metabolic, renal, and cardiovascular diseases: A review. J Adv Res (2017) 8(5):537–48. doi: 10.1016/j.jare.2016.11.004
5. Nashar K, Fried LF. Hyperuricemia and the progression of chronic kidney disease: is uric acid a marker or an independent risk factor. Adv Chronic Kidney Dis (2012) 19(6):386–91. doi: 10.1053/j.ackd.2012.05.004
6. Iki M, Yura A, Fujita Y, Kouda K, Tachiki T, Tamaki J, et al. Relationships between serum uric acid concentrations, uric acid lowering medications, and vertebral fracture in community-dwelling elderly Japanese men: Fujiwara-kyo osteoporosis risk in men (FORMEN) cohort study. Bone (2020) 139:115519. doi: 10.1016/j.bone.2020.115519
7. Han W, Bai X, Han L, Sun X, Chen X. Association between higher serum uric acid levels within the normal physiological range and changes of lumbar spine bone mineral density in healthy Chinese postmenopausal women: a longitudinal follow-up study. Menopause (2021) 28(10):1157–65. doi: 10.1097/GME.0000000000001821
8. Feig DI, Kang DH, Nakagawa T, Mazzali M, Johnson RJ. Uric acid and hypertension. Curr Hypertens Rep (2006) 8(2):111–5. doi: 10.1007/s11906-006-0005-z
9. Perlstein TS, Gumieniak O, Williams GH, Sparrow D, Vokonas PS, Gaziano M, et al. Uric acid and the development of hypertension: the normative aging study. Hypertension (2006) 48(6):1031–6. doi: 10.1161/01.HYP.0000248752.08807.4c
10. Grayson PC, Kim SY, LaValley M, Choi HK. Hyperuricemia and incident hypertension: a systematic review and meta-analysis. Arthritis Care Res (Hoboken). (2011) 63(1):102–10. doi: 10.1002/acr.20344
11. Chen-Xu M, Yokose C, Rai SK, Pillinger MH, Choi HK. Contemporary prevalence of gout and hyperuricemia in the united states and decadal trends: The national health and nutrition examination survey, 2007-2016. Arthritis Rheumatol (2019) 71(6):991–9. doi: 10.1002/art.40807
12. Veronese N, Carraro S, Bano G, Trevisan C, Solmi M, Luchini C, et al. Hyperuricemia protects against low bone mineral density, osteoporosis and fractures: a systematic review and meta-analysis. Eur J Clin Invest. (2016) 46(11):920–30. doi: 10.1111/eci.12677
13. Yin P, Lv H, Li Y, Meng Y, Zhang L, Tang P. The association between serum uric acid level and the risk of fractures: a systematic review and meta-analysis. Osteoporos Int (2017) 28(8):2299–307. doi: 10.1007/s00198-017-4059-3
14. Sendur OF, Turan Y, Tastaban E, Serter M. Antioxidant status in patients with osteoporosis: a controlled study. Joint Bone Spine. (2009) 76(5):514–8. doi: 10.1016/j.jbspin.2009.02.005
15. Wauquier F, Leotoing L, Coxam V, Guicheux J, Wittrant Y. Oxidative stress in bone remodelling and disease. Trends Mol Med (2009) 15(10):468–77. doi: 10.1016/j.molmed.2009.08.004
16. Glantzounis GK, Tsimoyiannis EC, Kappas AM, Galaris DA. Uric acid and oxidative stress. Curr Pharm Des (2005) 11(32):4145–51. doi: 10.2174/138161205774913255
17. Njeh CF, Fuerst T, Hans D, Blake GM, Genant HK. Radiation exposure in bone mineral density assessment. Appl Radiat Isot. (1999) 50(1):215–36. doi: 10.1016/S0969-8043(98)00026-8
18. Divney AA, Murillo R, Rodriguez F, Mirzayi CA, Tsui EK, Echeverria SE. Diabetes prevalence by leisure-, transportation-, and occupation-based physical activity among Racially/Ethnically diverse U.S. adults. Diabetes Care (2019) 42(7):1241–7. doi: 10.2337/dc18-2432
19. Kim D, Konyn P, Cholankeril G, Ahmed A. Physical activity is associated with nonalcoholic fatty liver disease and significant fibrosis measured by FibroScan. Clin Gastroenterol Hepatol (2022) 20(6):e1438–55. doi: 10.1016/j.cgh.2021.06.029
20. Piercy KL, Troiano RP, Ballard RM, Carlson SA, Fulton JE, Galuska DA, et al. The physical activity guidelines for americans. JAMA (2018) 320(19):2020–8. doi: 10.1001/jama.2018.14854
21. Levey AS, Coresh J, Greene T, Marsh J, Stevens LA, Kusek JW, et al. Expressing the modification of diet in renal disease study equation for estimating glomerular filtration rate with standardized serum creatinine values. Clin Chem (2007) 53(4):766–72. doi: 10.1373/clinchem.2006.077180
22. Nabipour I, Sambrook PN, Blyth FM, Janu MR, Waite LM, Naganathan V, et al. Serum uric acid is associated with bone health in older men: a cross-sectional population-based study. J Bone Miner Res (2011) 26(5):955–64. doi: 10.1002/jbmr.286
23. Mehta T, Bůžková P, Sarnak MJ, Chonchol M, Cauley JA, Wallace E, et al. Serum urate levels and the risk of hip fractures: data from the cardiovascular health study. Metabolism (2015) 64(3):438–46. doi: 10.1016/j.metabol.2014.11.006
24. Ishii S, Miyao M, Mizuno Y, Tanaka-Ishikawa M, Akishita M, Ouchi Y. Association between serum uric acid and lumbar spine bone mineral density in peri- and postmenopausal Japanese women. Osteoporos Int (2014) 25(3):1099–105. doi: 10.1007/s00198-013-2571-7
25. Paik JM, Kim SC, Feskanich D, Choi HK, Solomon DH, Curhan GC. Gout and risk of fracture in women: A prospective cohort study. Arthritis Rheumatol (2017) 69(2):422–8. doi: 10.1002/art.39852
26. Han Y, Zhang Y, Cao Y, Yin Y, Han X, Di H, et al. Exploration of the association between serum uric acid and testosterone in adult males: NHANES 2011-2016. Transl Androl Urol. (2021) 10(1):272–82. doi: 10.21037/tau-20-1114
27. Wan H, Zhang K, Wang Y, Chen Y, Zhang W, Xia F, et al. The associations between gonadal hormones and serum uric acid levels in men and postmenopausal women with diabetes. Front Endocrinol (Lausanne) (2020) 11:55. doi: 10.3389/fendo.2020.00055
28. Perlstein TS, Gumieniak O, Williams GH, Sparrow D, Vokonas PS, Gaziano M, et al. Association of testosterone and estradiol deficiency with osteoporosis and rapid bone loss in older men. J Clin Endocrinol Metab (2006) 91(10):3908–15. doi: 10.1210/jc.2006-0173
29. Carrero JJ, Hecking M, Chesnaye NC, Jager KJ. Sex and gender disparities in the epidemiology and outcomes of chronic kidney disease. Nat Rev Nephrol. (2018) 14(3):151–64. doi: 10.1038/nrneph.2017.181
30. Maric C, Sandberg K, Hinojosa-Laborde C. Glomerulosclerosis and tubulointerstitial fibrosis are attenuated with 17beta-estradiol in the aging Dahl salt sensitive rat. J Am Soc Nephrol. (2004) 15(6):1546–56. doi: 10.1097/01.ASN.0000128219.65330.EA
31. Metcalfe PD, Leslie JA, Campbell MT, Meldrum DR, Hile KL, Meldrum KK. Testosterone exacerbates obstructive renal injury by stimulating TNF-alpha production and increasing proapoptotic and profibrotic signaling. Am J Physiol Endocrinol Metab (2008) 294(2):E435–43. doi: 10.1152/ajpendo.00704.2006
32. Ji H, Zheng W, Menini S, Pesce C, Kim J, Wu X, et al. Female protection in progressive renal disease is associated with estradiol attenuation of superoxide production. Gend Med (2007) 4(1):56–71. doi: 10.1016/S1550-8579(07)80009-X
33. Afsar B, Sag AA, Oztosun C, Kuwabara M, Cozzolino M, Covic A, et al. The role of uric acid in mineral bone disorders in chronic kidney disease. J Nephrol. (2019) 32(5):709–17. doi: 10.1007/s40620-019-00615-0
34. Management of osteoporosis in postmenopausal women: the 2021 position statement of the north American menopause society. Menopause (2021) 28(9):973–97. doi: 10.1097/GME.0000000000001831
35. Adamopoulos D, Vlassopoulos C, Seitanides B, Contoyiannis P, Vassilopoulos P. The relationship of sex steroids to uric acid levels in plasma and urine. Acta Endocrinol (Copenh). (1977) 85(1):198–208. doi: 10.1530/acta.0.0850198
Keywords: uric acid, bone mineral density, hypertension, NHANES, epidemiology
Citation: Su Y, Ding N, Zhou Y, Yang G and Chai X (2022) The relationship between uric acid and total femur bone mineral density in hypertensive and non-hypertensive populations. Front. Endocrinol. 13:1022031. doi: 10.3389/fendo.2022.1022031
Received: 18 August 2022; Accepted: 23 November 2022;
Published: 19 December 2022.
Edited by:
Arrigo Francesco Giuseppe Cicero, University of Bologna, ItalyReviewed by:
Elettra Mancuso, University of Magna Graecia, ItalyWisam Nabeel Ibrahim, Qatar University, Qatar
Copyright © 2022 Su, Ding, Zhou, Yang and Chai. This is an open-access article distributed under the terms of the Creative Commons Attribution License (CC BY). The use, distribution or reproduction in other forums is permitted, provided the original author(s) and the copyright owner(s) are credited and that the original publication in this journal is cited, in accordance with accepted academic practice. No use, distribution or reproduction is permitted which does not comply with these terms.
*Correspondence: Xiangping Chai, Y2hhaXhpYW5ncGluZ0Bjc3UuZWR1LmNu
†These authors have contributed equally to this work
‡ORCID: Xiangping Chai, orcid.org/0000-0002-3575-2646