
95% of researchers rate our articles as excellent or good
Learn more about the work of our research integrity team to safeguard the quality of each article we publish.
Find out more
ORIGINAL RESEARCH article
Front. Endocrinol. , 18 November 2022
Sec. Obesity
Volume 13 - 2022 | https://doi.org/10.3389/fendo.2022.1016581
This article is part of the Research Topic Association of Novel Anthropometric Indexes with Metabolic Syndrome and Beyond, volume II View all 16 articles
 Yuting Duan1,2†
 Weiguang Zhang2†Zhe Li1,2Yue Niu2Yizhi Chen3Xiaomin Liu2Zheyi Dong2Ying Zheng2Xizhao Chen2Zhe Feng2Yong Wang2Delong Zhao2Qiu Liu2Hangtian Li2Huifang Peng1Xuefeng Sun2Guangyan Cai2Hongwei Jiang1*Xiangmei Chen2*
Background and objective: Metabolic syndrome (MetS) is an important risk factor for cardiovascular complications and kidney damage. Obesity- and lipid-related indices are closely related to MetS, and different indices have different predictive abilities for MetS. This study aimed to evaluate the predictive value of eight obesity- and lipid-related indicators, namely, body mass index (BMI), lipid accumulation product (LAP), body roundness index (BRI), Chinese visceral adiposity index (CVAI), body adiposity index (BAI), abdominal volume index (AVI), triglyceride glucose index (TYG), and visceral adiposity index (VAI), for MetS.
Methods: A total of 1,452 relatively healthy people in Beijing were enrolled in 2016, and the correlation between the eight indicators and MetS was analyzed by multivariate logistic regression. The receiver operating characteristic (ROC) curve and the area under the curve (AUC) were used to analyze the predictive ability of the eight indicators for MetS. The Delong test was used to compare the AUC values of the eight indicators. MetS was defined according to the Chinese Guidelines for the Prevention and Treatment of Type 2 Diabetes (2020 edition), the revised National Cholesterol Education Program Adult Treatment Group (NCEP-ATPIII), and the International Diabetes Federation (IDF).
Results: Using these three sets of criteria, LAP, TYG, CVAI, and VAI, which are based on blood lipids, had higher AUC values for MetS prediction than BMI, BRI, AVI, and BAI, which are based on anthropometry. LAP had the highest AUC values of 0.893 (0.874–0.912), 0.886 (0.869–0.903), and 0.882 (0.864–0.899), separately, based on the three sets of criteria.
Conclusion: The eight obesity- and lipid-related indicators had screening value for MetS in relatively healthy people, and of the eight indicators, LAP performed the best.
Metabolic syndrome (MetS) is a group of conditions characterized by cardiometabolic risk, including obesity (especially central obesity), elevated blood pressure, elevated blood glucose, elevated triglyceride (TG), and decreased high-density lipoprotein cholesterol (HDL-c) levels (1). These are important risk factors for atherosclerotic cardiovascular disease (CVD) and type 2 diabetes (T2DM), which can lead to severe complications, such as arteriosclerosis, decreased renal function, myocardial infarction, and cerebral infarction (2–4). Therefore, screening for MetS in relatively healthy people is of great significance in understanding their disease status or predisease status in advance, preventing related diseases caused by MetS in advance, and reducing the waste of public health resources and the medical burden.
Visceral fat accumulation is an important feature of MetS. However, the gold standards for assessing visceral fat, such as magnetic resonance imaging (MRI) and computed tomography (CT), involve exposure to radiation or are expensive and time-consuming. People are starting to use simple measures to assess visceral fat. Body mass index (BMI) is the most common anthropometric index used in epidemiological and clinical studies to classify overweight and obesity but is affected by differences in age, sex, and race and does not distinguish between fat and muscle mass (5, 6). Therefore, a variety of obesity- and lipid-related indicators have gradually been developed to assess visceral fat and predict MetS.
The body roundness index (BRI), body adiposity index (BAI), and abdominal volume index (AVI) are all new anthropometric indicators that can be used to effectively evaluate visceral obesity and make up for the deficiencies of BMI (7–9). The BRI has shown a superior ability to predict atherosclerosis in overweight/obese people (10), and it also does well in predicting MetS (11). The BAI has been shown to predict hypertensive events and screen for coronary heart disease risk (12, 13). The AVI reflects visceral fat content by assessing total abdominal volume, which is associated with impaired glucose tolerance (IGT) and diabetes mellitus (DM) (9, 14) and has strong predictive power for MetS in adolescents (15). The lipid accumulation product (LAP), visceral adiposity index (VAI), Chinese visceral adiposity index (CVAI), and triglyceride glucose index (TYG) are recently developed indices for estimating visceral fat based on a combination of abdominal obesity index [waist circumference (WC), BMI], blood glucose, and circulating lipids (HDL-C, TG) (6, 16–18). The LAP and TYG play an important role in identifying DM and prediabetes mellitus (19) and have a good ability to predict MetS (20–22). Both the VAI and CVAI can be used as markers of cardiometabolic risk (16, 23). All of these indicators show certain predictive power for MetS, but the best indicator to evaluate MetS is still controversial. The purpose of our study was to evaluate the performance of eight obesity- and lipid-related indicators (BMI, LAP, BRI, CVAI, BAI, AVI, TYG, and VAI) in predicting MetS in a relatively healthy population in China under three sets of criteria. Meanwhile, we were in search of the best sole indicator among the eight indicators to predict MetS.
The study was conducted at the Chinese PLA General Hospital in 2016 and recruited volunteers from Beijing, China. In this study, 2,217 volunteers aged ≥18 years were initially recruited. A total of 765 subjects were excluded according to the following exclusion criteria (Supplementary Figure 1): a) those with respiratory diseases, such as chronic obstructive pulmonary disease, asthma, bronchiectasis, etc.; b) those with musculoskeletal disease or rheumatologic disease, such as sarcopenia, fracture, rheumatoid arthritis, etc.; c) those with one of the following diseases in the previous 6-month period: liver cirrhosis, stroke, myocardial infarction, and malignant tumor; d) those unable to cooperate with the tests and sample collection; and e) those lacking the required data. Ultimately, 1,452 people were included in the study. This study was performed in accordance with the Declaration of Helsinki and approved by the Ethics Committee of the Chinese People’s Liberation Army General Hospital. All the participants provided signed informed consent and agreed to participate in this survey.
The information collected in this study included sociodemographic characteristics, medical history, family history, laboratory tests, etc. Anthropometric data, including weight, height, WC, hip circumference, and blood pressure, were measured by professional researchers according to standard protocols. The participants wore light clothing and were barefoot when their weight and height were measured. WC was measured using a flexible plastic tape measure at the navel level after the patient exhaled, and hip circumference was measured at the widest part of the hip. Blood pressure was measured in the participant’s non-dominant arm using automated electronic equipment; after a 5-min rest, blood pressure was measured in a 1-min interval thrice. The mean systolic and diastolic blood pressures of the three readings were recorded using a questionnaire.
Participants fasted for at least 8 h for the collection of venous blood to measure fasting blood glucose (FBG), creatinine (Cr), total cholesterol (TC), TG, HDL-C, low-density lipoprotein cholesterol (LDL-C), and other biochemical indicators. The estimated glomerular filtration rate (eGFR) was calculated using the Chronic Kidney Disease Epidemiology Collaboration (CKD-EPI) equation. The formulas for calculating BMI, LAP (24), BRI (7), CVAI (17), BAI (8), AVI (9), TYG (18), and VAI (16) are shown in Supplementary Table 1.
MetS was defined according to the Chinese Guidelines for the Prevention and Treatment of Type 2 Diabetes (2020 edition) (25), the revised National Cholesterol Education Program Adult Treatment Group (NCEP-ATPIII) (26), and the International Diabetes Federation (IDF) (27) (Supplementary Table 2).
The normal distribution of variables was assessed by the Kolmogorov–Smirnov test. The homogeneity of variance was assessed by the Levene test or one-way ANOVA. Categorical variables are presented as percentages, and continuous variables are described as the mean ± standard deviation (SD) for normally distributed data or the median (interquartile range) for skewed data. Comparisons between groups were performed using the Student’s t-test, the chi-square test, or the Mann‐Whitney U test. Binary logistic regression analysis was used to assess the relationship between obesity- and lipid-related indices and the incidence of MetS. Data were summarized as odds ratios (ORs) and regression coefficients [95% confidence intervals (CIs)]. The ORs indicated the change in the odds per unit increase in the anthropometric measures. When performing binary logistic regression, adjustments were made for the participants’ age, systolic blood pressure, diastolic blood pressure, TC, and eGFR. Adjusted variables were diagnosed by collinearity according to the following criteria: variance inflation factor (VIF) >10 or tolerance of approximately 0.1, condition index >30, and variance ratio >50%. Selected variables were not collinear. Receiver operating characteristic (ROC) analysis was used to compare the diagnostic performance of logistic models. Internal ten-fold cross-validation and penalty regression for validation. The tuning of the hyperparameters lambda and alpha was done through grid search, and the best models were reported in different groups with the highest mean validation AUC. The source codes were posted on github (https://github.com/yotasama/cv.elasticnet.r).
The ROC of the sole index analysis was used to compare the diagnostic performance of obesity- and lipid-related indices for MetS. Youden’s index (sensitivity + specificity − 1) was used to determine the optimal cutoff point of each indicator. All statistical analyses were performed using R.4.2.0 with package glmnet v4.1-4 and IBM SPSS statistical software, version 25 (IBM Corporation, Armonk, New York, NY, USA). The AUC values of all indicators were compared using the DeLong test and calculated using MedCalc Version 19.0 software (Ostend, Belgium). Differences were considered statistically significant at P-values of <0.05.
The demographic characteristics, anthropometric measurements, and obesity- and lipid-related indices are presented in Table 1. A total of 1,425 subjects were enrolled, consisting of 615 men with an average age of 58.07 ± 13.57 years and 837 women with an average age of 58.26 ± 13.25 years.
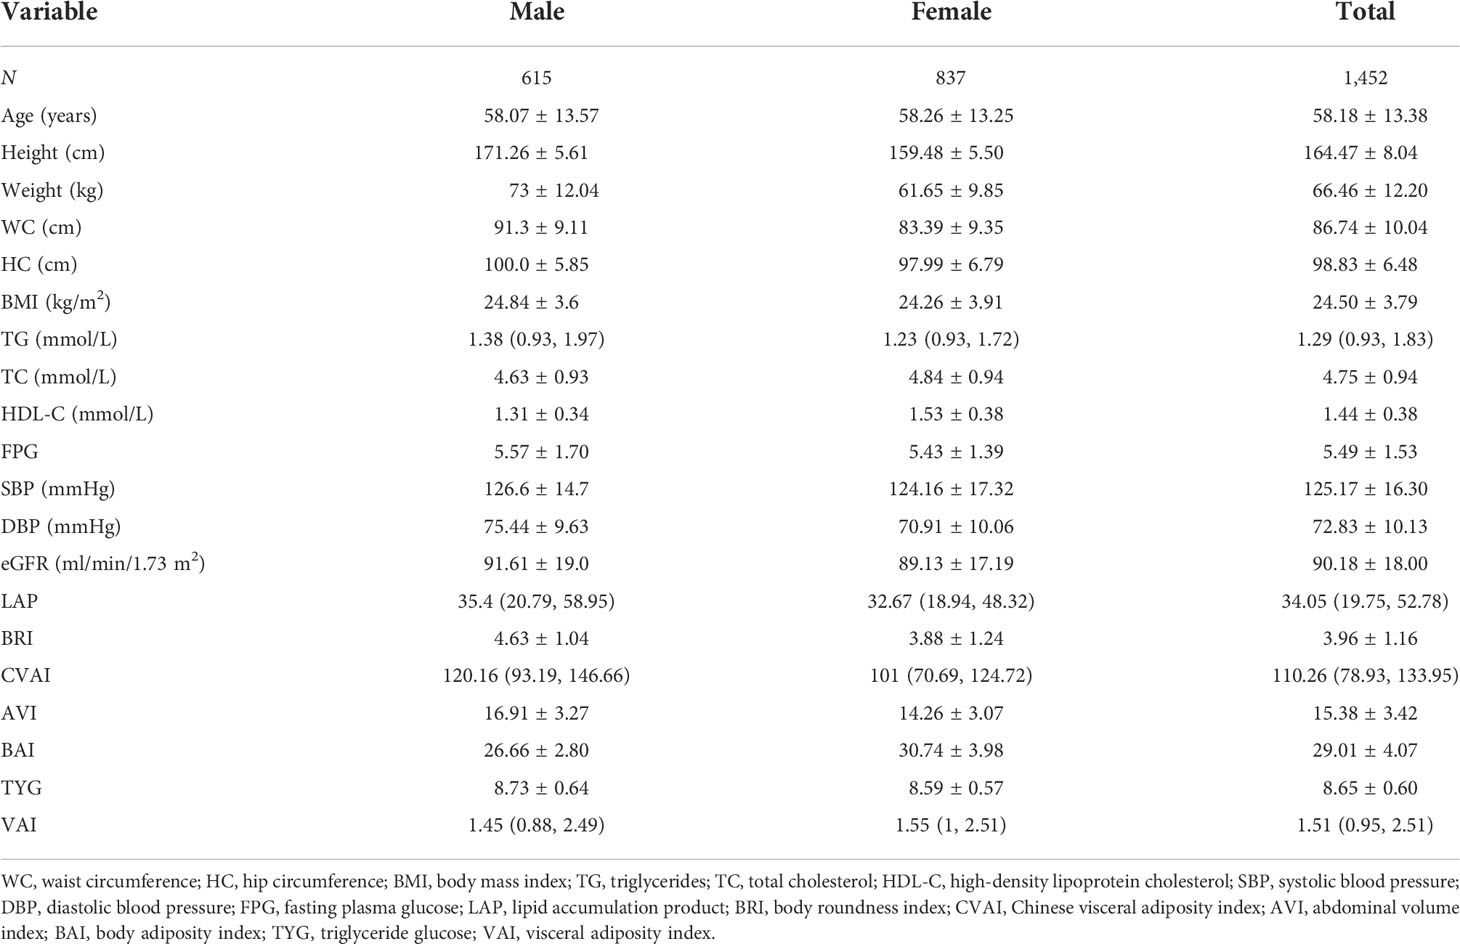
Table 1 Basic characteristics of the participants.
Participants were divided into groups based on sex and whether they had MetS according to the Chinese criteria (2020) (Table 2). In men with MetS, the values of the eight obesity- and lipid-related indicators and clinical indicators (SBP, DBP, TG, HDL-C) were significantly increased compared with those of men without MetS (P < 0.001). No significant differences in age, height, TC, or eGFR (P > 0.05) were noted. In women with MetS, the values of the eight obesity- and lipid-related indicators and clinical indicators (SBP, DBP, TG, HDL-C) were significantly increased compared with those of women without MetS (P < 0.001); however, height and TC were not statistically significant (P > 0.05). Overall, the values of the eight obesity- and lipid-related indicators and clinical indicators (SBP, DBP, TG, and HDL-C) were significantly increased in participants with MetS compared with those without MetS (P < 0.001). TC and eGFR were not significantly different (P > 0.05).
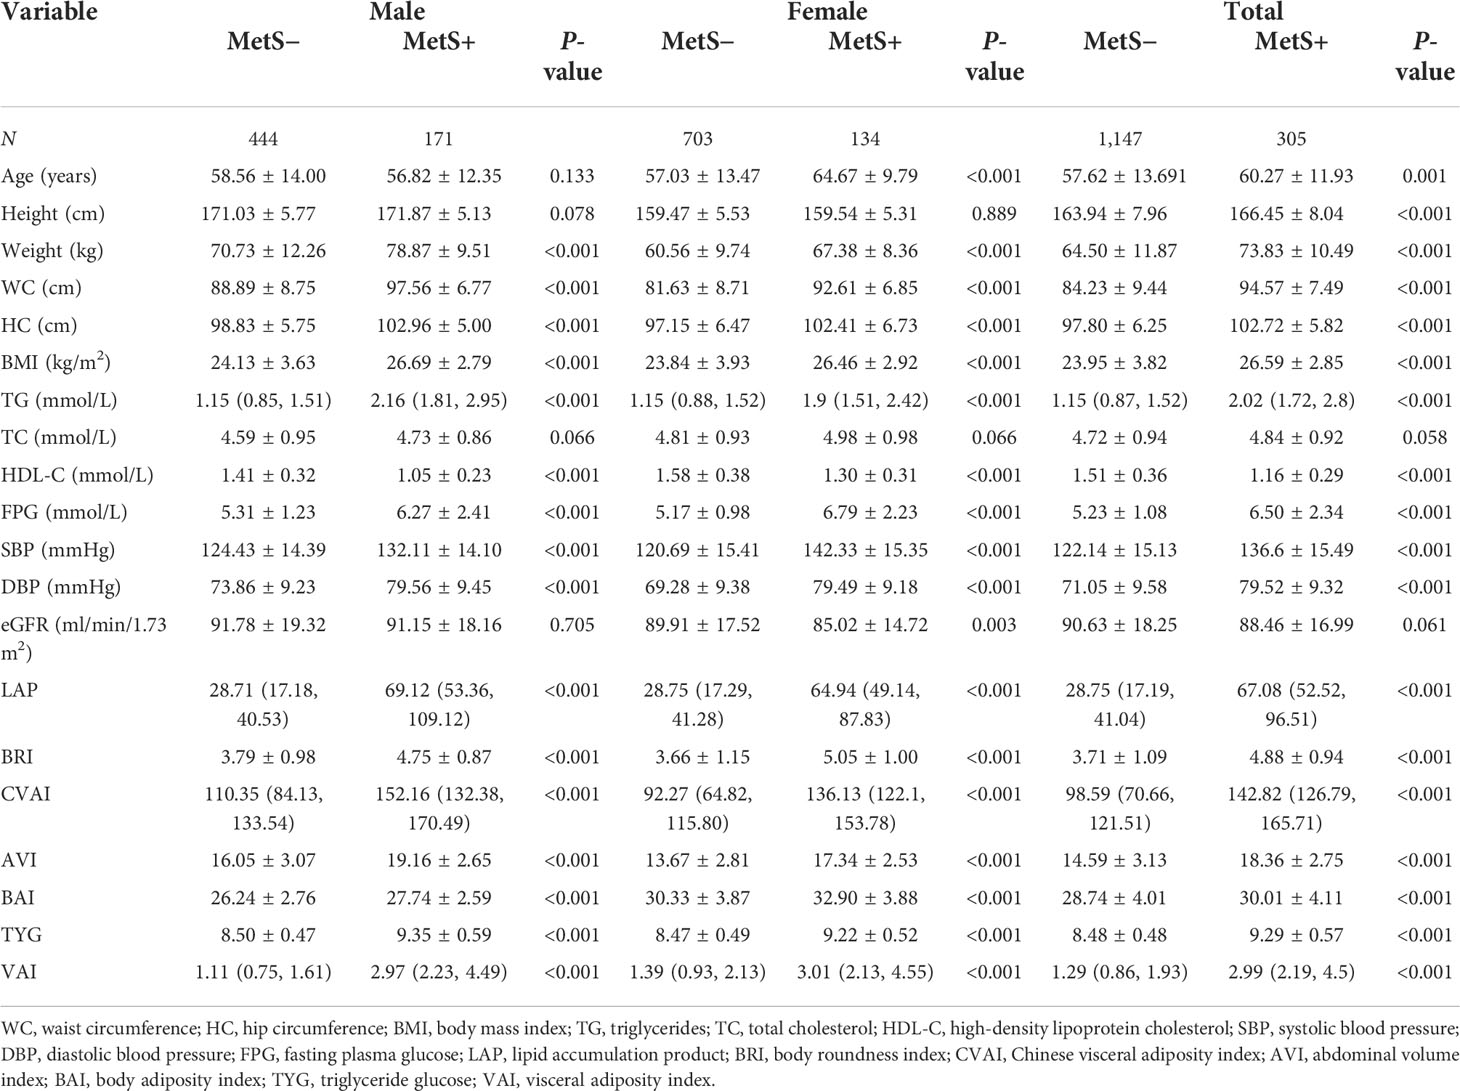
Table 2 Characteristics of participants with or without MetS (China 2020).
We compared the diagnostic efficacy of MetS with different diagnostic criteria in this population. Under the different criteria, the prevalence of MetS ranged from 21% [China (2020 edition) criteria] to 31.3% (NCEP-ATPIII criteria). We found statistically significant differences in the prevalence of MetS between the China (2020 edition) criteria and the NCEP-ATPIII and IDF criteria, whereas no statistically significant differences were noted between the NCEP-ATPIII and IDF criteria (Table 3). Using the China (2020 edition) criteria, the prevalence of MetS among men was significantly greater than that among women (χ2 = 29.725, P < 0.001), but there was no significant difference in the prevalence of MetS among men and women using the NCEP-ATPIII and IDF standards (P > 0.05). In addition, according to multivariate logistic regression analysis, BMI, LAP, BRI, CVAI, AVI, BAI, TYG, and VAI were significantly associated with MetS among all three criteria (P < 0.001). After adjusting for age, systolic blood pressure, diastolic blood pressure, TC, and eGFR, the OR value of TYG was 35.069 (22.057–55.757, P < 0.001) based on the China (2020 edition) criteria. Using the NCEP-ATPIII criteria, the OR value of TYG was 53.435 (33.535–85.145, P < 0.001), and using the IDF criteria, the OR value of TYG was 21.464 (14.726–31.286, P < 0.001). Among the three criteria, the LAP group model had the best overall AUC values: China (2020 edition) AUC = 0.925, NCEP-ATPIII criteria AUC = 0.909, and IDF criteria AUC = 0.903 (Table 4). The multivariate logistic regression analysis results for the NCEP-ATPIII and IDF standards are shown in Supplementary Tables 3, 4. The internal 10-fold cross-validation and penalty regression for validation are shown in Supplementary Tables 5–13.
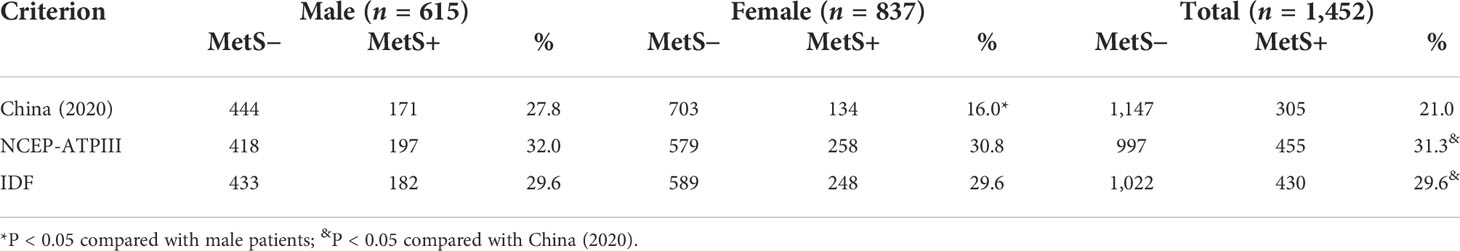
Table 3 Prevalence of MetS by different criteria.

Table 4 Predictive value of the eight obesity- and lipid-related indices in the China (2020) criteria and multivariate logistic regression analysis.
The abilities of BMI, LAP, BRI, CVAI, AVI, BAI, VAI, and TYG to predict MetS were analyzed by ROC curves based on the different criteria (Table 5). We found that LAP had the highest AUC values of 0.893 (0.874–0.912), 0.886 (0.869–0.903), and 0.882 (0.864–0.899) for the three diagnostic criteria. Second, the AUC values of CVAI, TYG, and VAI were all greater than 0.8. The subgroup analysis based on sex found that LAP had the highest AUC value for all three diagnostic criteria followed by CVAI, TYG, and VAI (Figure 1). Using the Guidelines for the Prevention and Treatment of Type 2 Diabetes in China (2020 edition) as the diagnostic criteria for MetS, in men, the AUC of LAP was the greatest at 0.90 (0.874–0.926) followed by VAI (AUC = 0.896). In women, LAP exhibited the greatest AUC of 0.882 (0.853–0.911) followed by CVAI (AUC = 0.870). Using NCEP-ATPIII as the diagnostic criteria, LAP exhibited the greatest AUC of 0.889 (0.863–0.915) followed by VAI (AUC = 0.875) in men. In women, LAP exhibited the greatest AUC of 0.885 (0.862 to 0.908) followed by TYG (AUC = 0.883). Using IDF as the diagnostic criteria, in men, LAP exhibited the greatest AUC of 0.884 (0.857 to 0.911) followed by CVAI (AUC = 0.868). In women, LAP exhibited the greatest AUC of 0.883 (0.860–0.906) followed by TYG (AUC = 0.866). A pairwise comparison of the AUC values for predicting MetS using the eight indicators based on the three criteria found that the AUC values for LAP were higher than those of the other seven indices, and the difference was statistically significant (P < 0.05). However, no statistically significant differences were noted between LAP and TYG using the NCEP-ATPIII criteria. Moreover, we found that BRI had the best forecasting ability for MetS among the four anthropometric indicators (BMI, BRI, AVI, and BAI), and the difference was statistically significant (P < 0.05) (Supplementary Tables 16–18). The optimal cutoff values of the eight obesity- and lipid-related indicators for predicting MetS in the three sets of criteria are displayed in Table 6 and Supplementary Tables 14, 15.
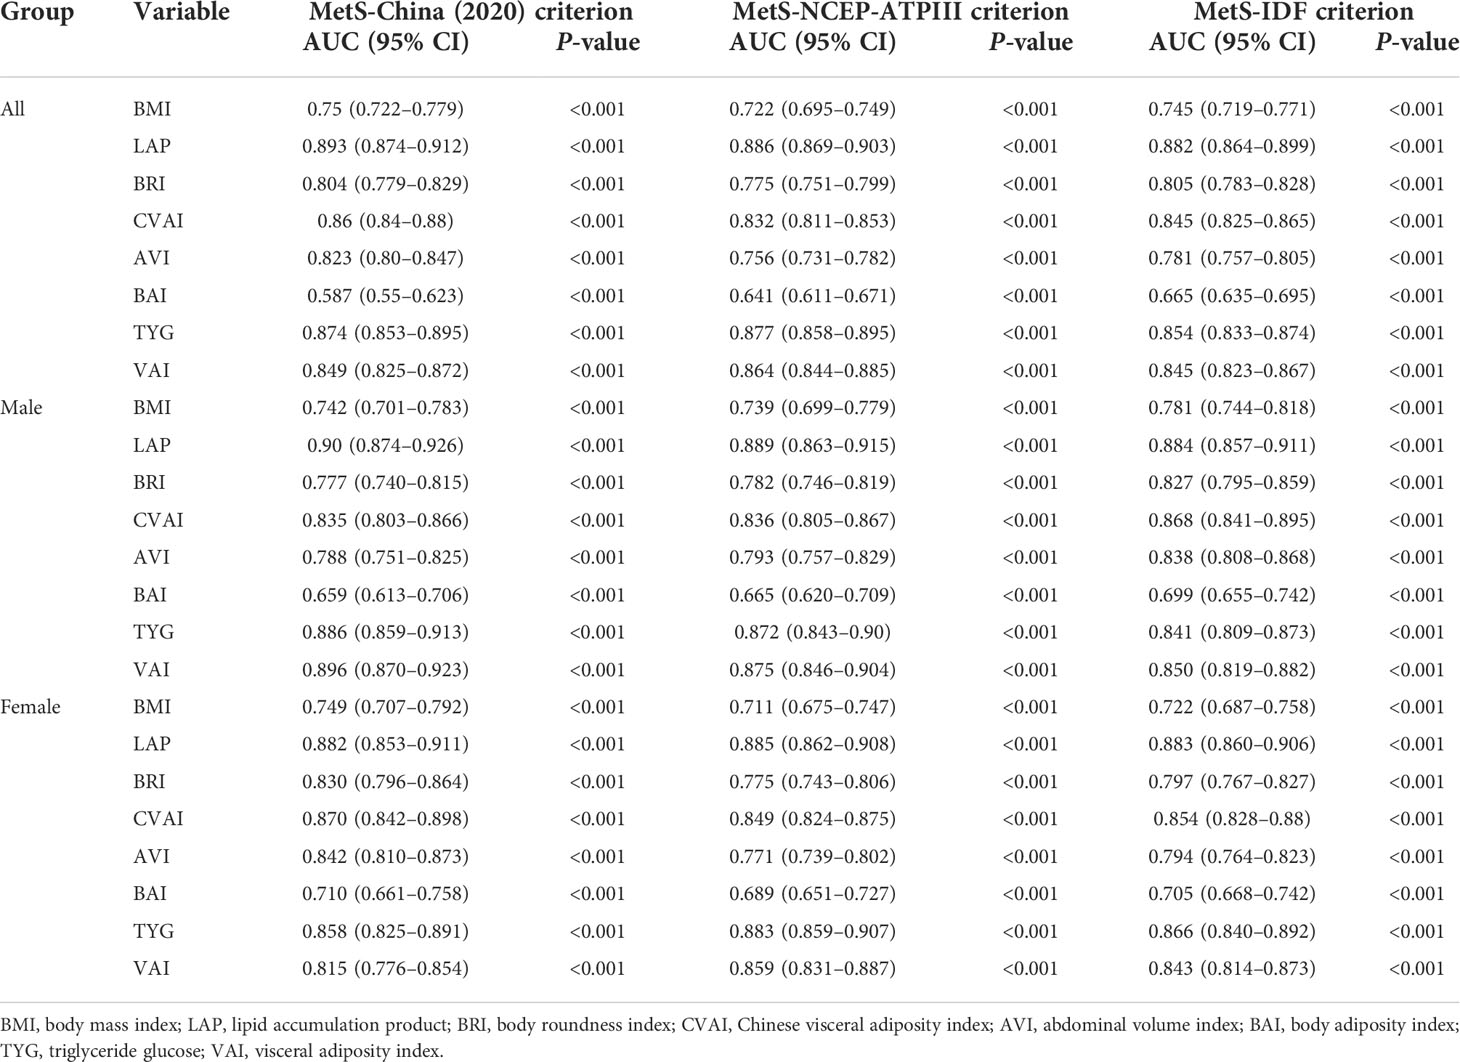
Table 5 Area under the curve of seven obesity- and lipid-related indices with the different metabolic syndrome criteria.
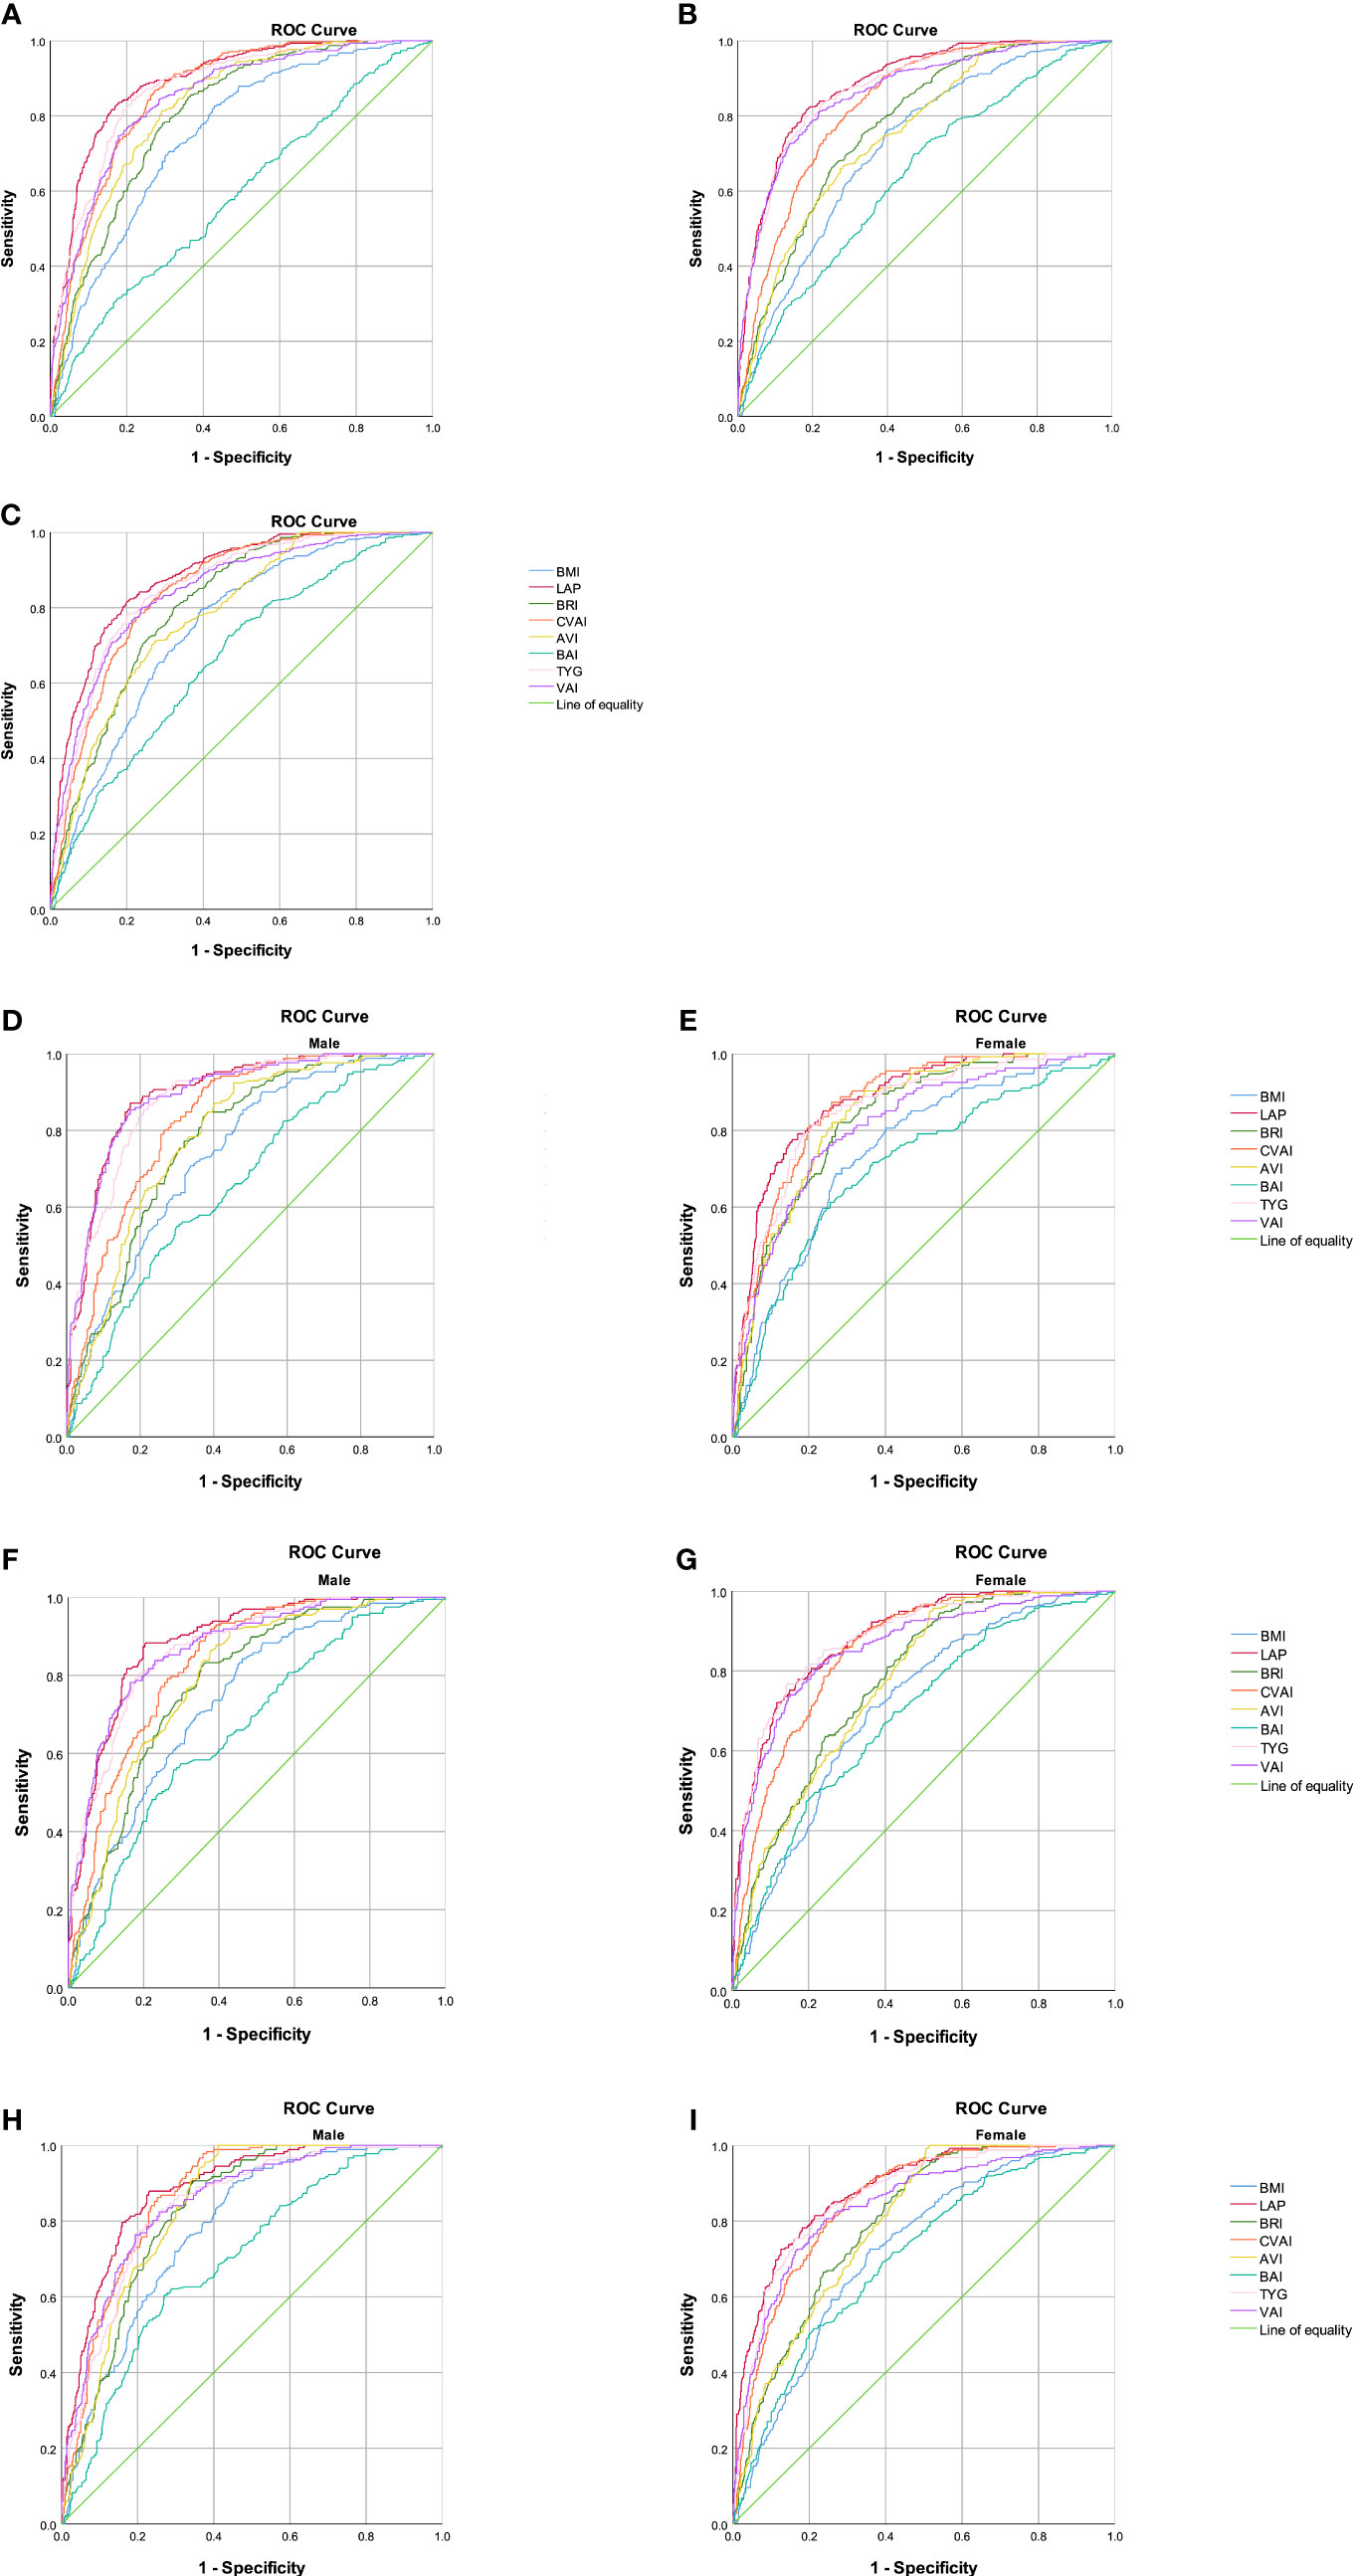
Figure 1 Comparison of the diagnostic values of BMI, LAP, BRI, CVAI, BAI, AVI, TYG, and VAI in predicting metabolic syndrome using three criteria in a relatively healthy Chinese population. (A) Chinese (2020 edition) criteria; (B) NCEP-ATPIII criteria; (C) IDF criteria. Chinese (2020) criteria: (D) obesity- and lipid-related indices for a relatively healthy Chinese population, men; (E) obesity- and lipid-related indices for a relatively healthy Chinese population, women. NCEP-ATPIII criteria: (F) obesity- and lipid-related indices for a relatively healthy Chinese population, men; (G) obesity- and lipid-related indices for a relatively healthy Chinese population, women. IDF criteria: (H) obesity- and lipid-related indices for a relatively healthy Chinese population, men; (I) obesity- and lipid-related indices for a relatively healthy Chinese population, women.
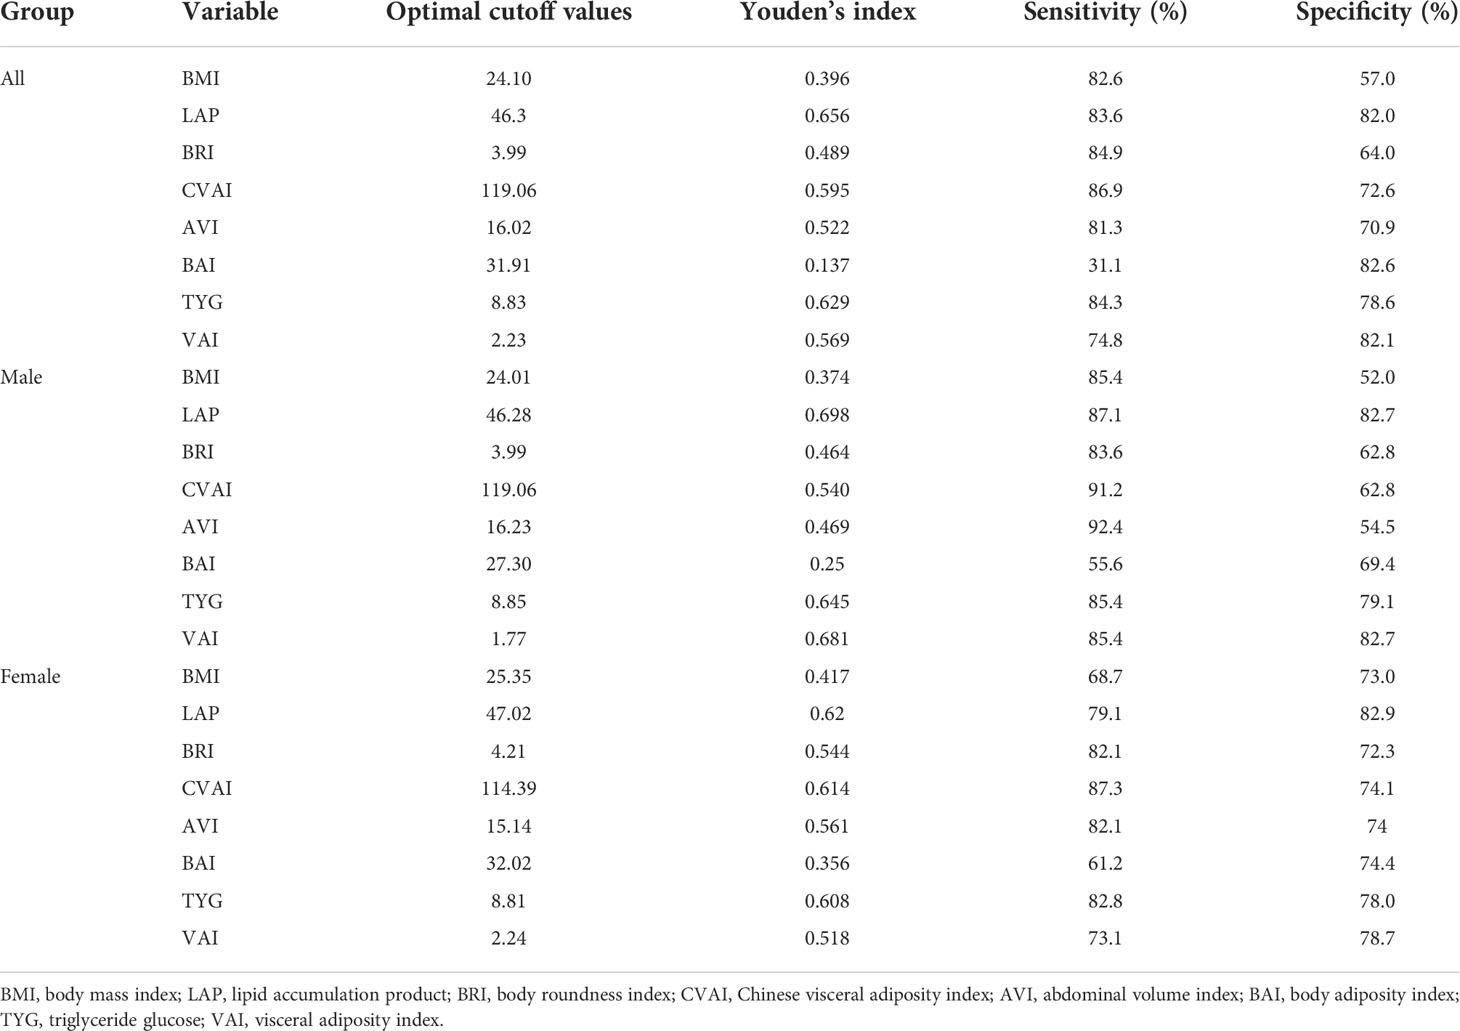
Table 6 The cutoff, sensitivities, specificities, and Youden’s index of each variable for the screening of metabolic syndrome in the China (2020) criteria.
Given the economic development and lifestyle changes, the prevalence of MetS is increasing worldwide and has become an important public health issue (28). In developed countries, such as the United States, the prevalence rate of MetS is 34.7% according to the National Health and Nutrition Examination Survey (2011–2016) (29). In China, the largest developing country, the prevalence of MetS has shown an increasing tendency. Analysis of China Nutrition and Health Surveillance data (2015–2017) found that the prevalence of metabolic syndrome among residents aged 20 years and older was 31.1% (30). The MetS diagnostic criteria are also being modified and improved, and the IDF and NECP-ATPIII criteria are the most widely used worldwide. Due to differences among ethnic groups, China has developed criteria for the diagnosis of MetS. In the MetS diagnostic criteria of the Chinese Guidelines for the Prevention and Treatment of Type 2 Diabetes (2020 edition), the cutoff points of WC, HDL-C, and FPG are different from those of the IDF and NECP-ATPIII criteria. This difference may explain why the prevalence of MetS found in this study with the China (2020 edition) criteria is lower than that with the NCEP-ATPIII and IDF criteria.
In this study, we investigated the ability of the eight obesity- and lipid-related indicators, namely, BMI, LAP, BRI, CVAI, BAI, AVI, TYG, and VAI, to predict MetS in relatively healthy people under different diagnostic criteria. We found that these eight obesity- and lipid-related indicators had reliable predictive value for MetS. Furthermore, LAP outperformed the other seven parameters in predicting MetS. Following the model design, it was discovered that the best logistic models were those using LAP, age, SBP, DBP, TC, and eGFR, which is consistent with our practice of utilizing a sole indicator to forecast MetS. Therefore, we conclude that LAP is superior for predicting MetS in relatively healthy Chinese adults. These results demonstrate that LAP is a simple and powerful tool for clinical use. This is the first study to assess the ability of these eight obesity- and lipid-related indicators to predict MetS in a relatively healthy population under different diagnostic criteria.
BMI, BRI, AVI, and BAI are all calculated based on anthropometric measurements, and our results show that these indicators are closely related to MetS. BMI has been shown to be a risk factor for various cardiovascular and metabolic diseases and mortality (31), but it cannot distinguish between subcutaneous and visceral fat (6, 32). BRI is a novel obesity-related index that uses WC and height to estimate body fat and visceral adipose tissue (7). Rico-Martin et al. (11) found that BRI was a better predictor of MetS among different ethnic and racial groups than BMI. This finding is consistent with our study, where we found that BRI has better predictive power for MetS than the other three anthropometric constructs (BMI, AVI, BAI). The AUC of BRI for women with MetS can be as high as 0.83 using the China (2020 edition) standards. In addition, AVI is calculated using the total abdominal volume assessment from the symphysis pubis to the xiphoid process to reflect visceral fat content. Perona et al. (15) found that WC and AVI had a strong ability to predict MetS in adolescents when using the IDF criteria. Wu et al. (33) found that AVI had good performance in identifying MetS in non-overweight/obese Chinese adults (men, 0.743; women, 0.819), which is similar to our results with the Chinese (2020 edition) criteria (men, 0.775; women, 0.831). The BAI also showed some predictive ability for MetS in a Colombian population and among Chinese postmenopausal women (34, 35). In our study, BAI was relatively weak in predicting MetS with an AUC less than 0.8, which may be due to different ethnic groups and population characteristics. Although BMI, BRI, AVI, and BAI can all predict MetS, the combination of anthropometric values and lipid-related indicators exhibited a better ability to predict MetS in our study.
LAP, CVAI, VAI, and TYG are new proxies for central obesity and lipid accumulation and can be used to assess visceral fat distribution and reflect visceral fat dysfunction by combining anthropometric markers with lipid or glucose markers. In this study, we found that the AUC values of LAP, CVAI, VAI, and TYG for the three sets of criteria were all greater than 0.8, showing good predictive performance. Since Kahn (24) proposed the LAP, several studies have found that LAP has a good ability to predict MetS (36–38), and it is calculated based on sex to better reflect the relationships between fat accumulation and lipid toxicity and cardiac metabolic disease (39). Guo et al. (40) compared the ability of LAP, VAI, BAI, and WHtR to predict MetS in low-income rural adults in Xinjiang, China, and found that LAP was a better indicator to predict MetS than the other three factors. In a Brazilian population free of cardiovascular disease and type 2 diabetes, LAP had a reliable diagnostic value for MetS compared with classic anthropometric measures (BMI, WC, waist-to-height ratio, waist-to-hip ratio) when using the American Heart Association (AHA)/National Heart, Lung and Blood Institute (NHLBI), IDF, and harmonized AHA/NHLBI and IDF standards (41). In a cross-sectional study of 552 healthy Argentine men, the AUC for LAP in predicting MetS was 0.91 (42). Our study also showed that LAP had the strongest predictive ability for MetS with a maximum AUC of 0.90. These results underscore the importance of LAP in predicting MetS in clinical practice. Xia et al. (17) believe that CVAI is a reliable and applicable indicator for evaluating visceral fat dysfunction in Chinese people and even for evaluating the metabolic health status of Asian people. Our study shows that CVAI also has a good ability to predict MetS with AUC values greater than 0.8 for all three criteria. In addition, VAI reflects abdominal fat distribution and dyslipidemia and is associated with insulin resistance (IR), abnormal glucose balance, and an increased risk of cardiovascular disease in adults (43, 44). Our previous study in patients with chronic kidney disease found that VAI had a good ability to predict MetS (45), which is consistent with the findings of this study. TYG, a product of TG and FPG, is a new visceral fat assessment tool that is associated with IR (46, 47). A Chinese study also confirmed the ability of the TYG index to identify metabolically unhealthy Chinese adults and those at high risk of cardiovascular and metabolic diseases (48). Lee et al. (49) found that TYG was a good predictor of MetS in metabolically obese but normal-weight individuals in Korea with an AUC between 0.855 and 0.868. In our study, TYG also had excellent predictive ability with an AUC between 0.841 and 0.886. The occurrence of MetS in central obesity may be closely related to the increase in visceral adipose tissue, the decrease in subcutaneous tissue expansion, and the metabolic changes in triglycerides stored in different organs, which may explain the better predictive ability of the four indicators for MetS (50).
The study had several limitations. First, this study was a cross-sectional study with a limited sample size, and we could not determine the causal relationships. Second, the survey included only individuals belonging to the relatively healthy population in China, so caution should be taken when generalizing the results to other races and groups. Third, the study did not document details about long-term medication use, education, or health status, which may have influenced the results. Finally, this is a cross-sectional study of the relatively healthy population in a community with an imbalanced proportion of controls and patients.
Our study shows that using different criteria, LAP, TYG, CVAI, and VAI have significant predictive efficacy for MetS in a relatively healthy population in China. LAP exhibits the best predictive efficacy, regardless of sex.
The original contributions presented in the study are included in the article/Supplementary Material. Further inquiries can be directed to the corresponding authors.
The studies involving human participants were reviewed and approved by the Ethics Committee of the Chinese People’s Liberation Army General Hospital. The patients/participants provided their written informed consent to participate in this study.
HJ and XmC, conceptualization. YD and WZ, visualization. YC, XL, ZD and YZ, funding acquisition. YD and WZ, formal analysis. ZF, YW, DZ, XS, XzC, and GC, resources. YD and WZ, writing—original draft preparation. ZL, YN and YZ, writing–review and editing. QL, HP and HL, supervision. All authors contributed to the article and approved the submitted version.
Part of this research was funded by the National Key Research and Development Program of China (2022YFC3602900), the Innovation Platform for Academicians of Hainan Province (Academician Chen Xiangmei of Hainan Province Kidney Diseases Team Innovation Center), the Specialized Scientific Program of the Innovation Platform for Academicians of Hainan Province (YSPTZX202026), the Specialized Scientific Research Project of Military Health Care (21BJZ37), the National Natural Science Foundation of China (82030025), and the Clinical Research Support Fund, Young Talent Project, Chinese PLA General Hospital (2019XXMBD-005, 2019XXJSYX01), Construction Project of Improving Medical Service Capacity of Provincial Medical Institutions in Henan Province (2017), Medical and Health Research Project in Luoyang (2001027A).
We wish to thank the study participants for their cooperation and participation.
The authors declare that the research was conducted in the absence of any commercial or financial relationships that could be construed as a potential conflict of interest.
All claims expressed in this article are solely those of the authors and do not necessarily represent those of their affiliated organizations, or those of the publisher, the editors and the reviewers. Any product that may be evaluated in this article, or claim that may be made by its manufacturer, is not guaranteed or endorsed by the publisher.
The Supplementary Material for this article can be found online at: https://www.frontiersin.org/articles/10.3389/fendo.2022.1016581/full#supplementary-material
LAP, lipid accumulation product; BRI, body roundness index; CVAI: Chinese visceral adiposity index; AVI, abdominal volume index; BAI, body adiposity index; TYG, triglyceride glucose; VAI, visceral adiposity index.
1. Alberti KG, Eckel RH, Grundy SM, Zimmet PZ, Cleeman JI, Donato KA, et al. Harmonizing the metabolic syndrome: A joint interim statement of the international diabetes federation task force on epidemiology and prevention; national heart, lung, and blood institute; American heart association; world heart federation; international atherosclerosis society; and international association for the study of obesity. Circulation (2009) 120(16):1640–5. doi: 10.1161/CIRCULATIONAHA.109.192644
2. Angela J, Scott M, Diane B, Luther T, Richard S, Margo A, et al. National cholesterol education program expert panel on detection, evaluation treatment of high blood cholesterol in adults. third report of the national cholesterol education program (Ncep) expert panel on detection, evaluation, and treatment of high blood cholesterol in adults (Adult treatment panel iii) final report. Circulation (2002) 106(25):3143–421.
3. Eckel RH, Grundy SM, Zimmet PZ. The metabolic syndrome. Lancet (2005) 365(9468):1415–28. doi: 10.1016/s0140-6736(05)66378-7
4. Li Y, Xie D, Qin X, Tang G, Xing H, Li Z, et al. Metabolic syndrome, but not insulin resistance, is associated with an increased risk of renal function decline. Clin Nutr (2015) 34(2):269–75. doi: 10.1016/j.clnu.2014.04.002
5. Nevill AM, Stewart AD, Olds T, Holder R. Relationship between adiposity and body size reveals limitations of bmi. Am J Phys anthropology (2006) 129(1):151–6. doi: 10.1002/ajpa.20262
6. Yusuf S, Hawken S, Ounpuu S, Bautista L, Franzosi MG, Commerford P, et al. Obesity and the risk of myocardial infarction in 27,000 participants from 52 countries: A case-control study. Lancet (London England) (2005) 366(9497):1640–9. doi: 10.1016/S0140-6736(05)67663-5
7. Thomas DM, Bredlau C, Bosy-Westphal A, Mueller M, Shen W, Gallagher D, et al. Relationships between body roundness with body fat and visceral adipose tissue emerging from a new geometrical model. Obes (Silver Spring Md) (2013) 21(11):2264–71. doi: 10.1002/oby.20408
8. Bergman RN, Stefanovski D, Buchanan TA, Sumner AE, Reynolds JC, Sebring NG, et al. A better index of body adiposity. Obes (Silver Spring) (2011) 19(5):1083–9. doi: 10.1038/oby.2011.38
9. Guerrero-Romero F, Rodríguez-Morán M. Abdominal volume index. an anthropometry-based index for estimation of obesity is strongly related to impaired glucose tolerance and type 2 diabetes mellitus. Arch Med Res (2003) 34(5):428–32. doi: 10.1016/s0188-4409(03)00073-0
10. Li G, Yao T, Wu XW, Cao Z, Tu YC, Ma Y, et al. Novel and traditional anthropometric indices for identifying arterial stiffness in overweight and obese adults. Clin Nutr (Edinburgh Scotland) (2020) 39(3):893–900. doi: 10.1016/j.clnu.2019.03.029
11. Rico-Martin S, Calderon-Garcia JF, Sanchez-Rey P, Franco-Antonio C, Martinez Alvarez M, Munoz-Torrero JFS. Effectiveness of body roundness index in predicting metabolic syndrome: A systematic review and meta-analysis. Obes Rev an Off J Int Assoc Study Obes (2020) 21(7):e13023. doi: 10.1111/obr.13023
12. Moliner-Urdiales D, Artero EG, Sui X, España-Romero V, Lee D, Blair SN. Body adiposity index and incident hypertension: The aerobics center longitudinal study. Nutrition metabolism Cardiovasc Dis NMCD (2014) 24(9):969–75. doi: 10.1016/j.numecd.2014.03.004
13. Almeida RT, Pereira ADC, Fonseca M, Matos SMA, Aquino EML. Association between body adiposity index and coronary risk in the Brazilian longitudinal study of adult health (Elsa-brasil). Clin Nutr (Edinburgh Scotland) (2020) 39(5):1423–31. doi: 10.1016/j.clnu.2019.06.001
14. Hu X, Appleton AA, Ou Y, Zhang Y, Cai A, Zhou Y, et al. Abdominal volume index trajectories and risk of diabetes mellitus: Results from the China health and nutrition survey. J Diabetes Investig (2022) 13(5):868–77. doi: 10.1111/jdi.13733
15. Perona JS, Schmidt-RioValle J, Fernandez-Aparicio A, Correa-Rodriguez M, Ramirez-Velez R, Gonzalez-Jimenez E. Waist circumference and abdominal volume index can predict metabolic syndrome in adolescents, but only when the criteria of the international diabetes federation are employed for the diagnosis. Nutrients (2019) 11(6):1370. doi: 10.3390/nu11061370
16. Amato MC, Giordano C, Galia M, Criscimanna A, Vitabile S, Midiri M, et al. Visceral adiposity index: A reliable indicator of visceral fat function associated with cardiometabolic risk. Diabetes Care (2010) 33(4):920–2. doi: 10.2337/dc09-1825
17. Xia MF, Chen Y, Lin HD, Ma H, Li XM, Aleteng Q, et al. A indicator of visceral adipose dysfunction to evaluate metabolic health in adult Chinese. Sci Rep (2016) 6:38214. doi: 10.1038/srep38214
18. Guerrero-Romero F, Simental-Mendía LE, González-Ortiz M, Martínez-Abundis E, Ramos-Zavala MG, Hernández-González SO, et al. The product of triglycerides and glucose, a simple measure of insulin sensitivity. Comparison Euglycemic-Hyperinsulinemic Clamp. J Clin Endocrinol Metab (2010) 95(7):3347–51. doi: 10.1210/jc.2010-0288
19. Ahn N, Baumeister SE, Amann U, Rathmann W, Peters A, Huth C, et al. Visceral adiposity index (Vai), lipid accumulation product (Lap), and product of triglycerides and glucose (Tyg) to discriminate prediabetes and diabetes. Sci Rep (2019) 9(1):9693. doi: 10.1038/s41598-019-46187-8
20. Banik SD, Pacheco-Pantoja E, Lugo R, Gomez-de-Regil L, Chim Ake R, Gonzalez RMM, et al. Evaluation of anthropometric indices and lipid parameters to predict metabolic syndrome among adults in Mexico. Diabetes Metab syndrome Obes Targets Ther (2021) 14:691–701. doi: 10.2147/DMSO.S281894
21. Gu Z, Zhu P, Wang Q, He H, Xu J, Zhang L, et al. Obesity and lipid-related parameters for predicting metabolic syndrome in Chinese elderly population. Lipids Health Dis (2018) 17(1):289. doi: 10.1186/s12944-018-0927-x
22. Raimi TH, Dele-Ojo BF, Dada SA, Fadare JO, Ajayi DD, Ajayi EA, et al. Triglyceride-glucose index and related parameters predicted metabolic syndrome in nigerians. Metab syndrome related Disord (2021) 19(2):76–82. doi: 10.1089/met.2020.0092
23. Xie X, Li Q, Zhang L, Ren W. Lipid accumulation product, visceral adiposity index, and Chinese visceral adiposity index as markers of cardiometabolic risk in adult growth hormone deficiency patients: A cross-sectional study. Endocr Pract (2018) 24(1):33–9. doi: 10.4158/ep-2017-0007
24. Kahn HS. The "Lipid accumulation product" performs better than the body mass index for recognizing cardiovascular risk: A population-based comparison. BMC Cardiovasc Disord (2005) 5:26. doi: 10.1186/1471-2261-5-26
25. Diabetes Society of Chinese Medical Association. Guideline for the prevention and treatment of type 2 diabetes mellitus in China (2020 edition). Chin J Diabetes (2021) 13(4):315–409.
26. Expert panel on detection, evaluation, treatment of high blood cholesterol in adults. executive summary of the third report of the national cholesterol education program (Ncep) expert panel on detection, evaluation, and treatment of high blood cholesterol in adults (Adult treatment panel iii). Jama (2001) 285(19):2486–97. doi: 10.3760/cma.j.cn115791-20210221-00095
27. Alberti KG, Zimmet P, Shaw JIDF. Epidemiology task force consensus group. the metabolic syndrome–a new worldwide definition. Lancet (London England) (2005) 366(9491):1059–62. doi: 10.1016/S0140-6736(05)67402-8
28. Saklayen MG. The global epidemic of the metabolic syndrome. Curr hypertension Rep (2018) 20(2):12. doi: 10.1007/s11906-018-0812-z
29. Hirode G, Wong RJ. Trends in the prevalence of metabolic syndrome in the united states, 2011-2016. Jama (2020) 323(24):2526–8. doi: 10.1001/jama.2020.4501
30. Yao F, Bo Y, Zhao L, Li Y, Ju L, Fang H, et al. Prevalence and influencing factors of metabolic syndrome among adults in China from 2015 to 2017. Nutrients (2021) 13(12):4475. doi: 10.3390/nu13124475
31. Aune D, Sen A, Norat T, Janszky I, Romundstad P, Tonstad S, et al. Body mass index, abdominal fatness, and heart failure incidence and mortality: A systematic review and dose-response meta-analysis of prospective studies. Circulation (2016) 133(7):639–49. doi: 10.1161/circulationaha.115.016801
32. Grundy SM, Cleeman JI, Daniels SR, Donato KA, Eckel RH, Franklin BA, et al. Diagnosis and management of the metabolic syndrome: An American heart Association/National heart, lung, and blood institute scientific statement. Circulation (2005) 112(17):2735–52. doi: 10.1161/CIRCULATIONAHA.105.169404
33. Wu L, Zhu W, Qiao Q, Huang L, Li Y, Chen L. Novel and traditional anthropometric indices for identifying metabolic syndrome in non-Overweight/Obese adults. Nutr Metab (2021) 18(1):3. doi: 10.1186/s12986-020-00536-x
34. Gonzalez-Ruiz K, Correa-Bautista JE, Ramirez-Velez R. Body adiposity and its relationship of metabolic syndrome components in Colombian adults. Nutricion hospitalaria (2015) 32(4):1468–75. doi: 10.3305/nh.2015.32.4.9164
35. Liu PJ, Ma F, Lou HP, Zhu YN. Body roundness index and body adiposity index: Two new anthropometric indices to identify metabolic syndrome among Chinese postmenopausal women. Climacteric J Int Menopause Soc (2016) 19(5):433–9. doi: 10.1080/13697137.2016.1202229
36. Taverna MJ, Martínez-Larrad MT, Frechtel GD, Serrano-Ríos M. Lipid accumulation product: A powerful marker of metabolic syndrome in healthy population. Eur J Endocrinol (2011) 164(4):559–67. doi: 10.1530/eje-10-1039
37. Motamed N, Razmjou S, Hemmasi G, Maadi M, Zamani F. Lipid accumulation product and metabolic syndrome: A population-based study in northern Iran, amol. J Endocrinol Invest (2016) 39(4):375–82. doi: 10.1007/s40618-015-0369-5
38. Li R, Li Q, Cui M, Yin Z, Li L, Zhong T, et al. Clinical surrogate markers for predicting metabolic syndrome in middle-aged and elderly Chinese. J Diabetes Invest (2018) 9(2):411–8. doi: 10.1111/jdi.12708
39. Kahn HS. The lipid accumulation product is better than bmi for identifying diabetes: A population-based comparison. Diabetes Care (2006) 29(1):151–3. doi: 10.2337/diacare.29.1.151
40. Guo SX, Zhang XH, Zhang JY, He J, Yan YZ, Ma JL, et al. Visceral adiposity and anthropometric indicators as screening tools of metabolic syndrome among low income rural adults in xinjiang. Sci Rep (2016) 6:36091. doi: 10.1038/srep36091
41. Nascimento-Ferreira MV, Rendo-Urteaga T, Vilanova-Campelo RC, Carvalho HB, Oliveira GDP, Landim MBP, et al. The lipid accumulation product is a powerful tool to predict metabolic syndrome in undiagnosed Brazilian adults. Clin Nutr (2017) 36(6):1693–700. doi: 10.1016/j.clnu.2016.12.020
42. Tellechea ML, Aranguren F, Martínez-Larrad MT, Serrano-Ríos M, Taverna MJ, Frechtel GD. Ability of lipid accumulation product to identify metabolic syndrome in healthy men from Buenos Aires. Diabetes Care (2009) 32(7):e85. doi: 10.2337/dc08-2284
43. Mohammadreza B, Farzad H, Davoud K, Prof AFF. Prognostic significance of the complex "Visceral adiposity index" vs. simple anthropometric measures: Tehran lipid and glucose study. Cardiovasc Diabetol (2012) 11:20. doi: 10.1186/1475-2840-11-20
44. Al-Daghri NM, Al-Attas OS, Alokail MS, Alkharfy KM, Charalampidis P, Livadas S, et al. Visceral adiposity index is highly associated with adiponectin values and glycaemic disturbances. Eur J Clin Invest (2013) 43(2):183–9. doi: 10.1111/eci.12030
45. Li H, Wang Q, Ke J, Lin W, Luo Y, Yao J, et al. Optimal obesity- and lipid-related indices for predicting metabolic syndrome in chronic kidney disease patients with and without type 2 diabetes mellitus in China. Nutrients (2022) 14(7):1334. doi: 10.3390/nu14071334
46. Du T, Yuan G, Zhang M, Zhou X, Sun X, Yu X. Clinical usefulness of lipid ratios, visceral adiposity indicators, and the triglycerides and glucose index as risk markers of insulin resistance. Cardiovasc Diabetol (2014) 13:146. doi: 10.1186/s12933-014-0146-3
47. Abbasi F, Reaven GM. Comparison of two methods using plasma triglyceride concentration as a surrogate estimate of insulin action in nondiabetic subjects: Triglycerides X glucose versus Triglyceride/High-density lipoprotein cholesterol. Metabolism: Clin Exp (2011) 60(12):1673–6. doi: 10.1016/j.metabol.2011.04.006
48. Yu X, Wang L, Zhang W, Ming J, Jia A, Xu S, et al. Fasting triglycerides and glucose index is more suitable for the identification of metabolically unhealthy individuals in the Chinese adult population: A nationwide study. J Diabetes Invest (2019) 10(4):1050–8. doi: 10.1111/jdi.12975
49. Lee SH, Han K, Yang HK, Kim HS, Cho JH, Kwon HS, et al. A novel criterion for identifying metabolically obese but normal weight individuals using the product of triglycerides and glucose. Nutr Diabetes (2015) 5(4):e149. doi: 10.1038/nutd.2014.46
Keywords: metabolic syndrome, lipid accumulation product, obesity, lipid, adults, healthy
Citation: Duan Y, Zhang W, Li Z, Niu Y, Chen Y, Liu X, Dong Z, Zheng Y, Chen X, Feng Z, Wang Y, Zhao D, Liu Q, Li H, Peng H, Sun X, Cai G, Jiang H and Chen X (2022) Predictive ability of obesity- and lipid-related indicators for metabolic syndrome in relatively healthy Chinese adults. Front. Endocrinol. 13:1016581. doi: 10.3389/fendo.2022.1016581
Received: 11 August 2022; Accepted: 31 October 2022;
Published: 18 November 2022.
Edited by:
Mostafa Qorbani, Alborz University of Medical Sciences, IranReviewed by:
Majid Mardaniyan Ghahfarrokhi, Shahrekord University, IranCopyright © 2022 Duan, Zhang, Li, Niu, Chen, Liu, Dong, Zheng, Chen, Feng, Wang, Zhao, Liu, Li, Peng, Sun, Cai, Jiang and Chen. This is an open-access article distributed under the terms of the Creative Commons Attribution License (CC BY). The use, distribution or reproduction in other forums is permitted, provided the original author(s) and the copyright owner(s) are credited and that the original publication in this journal is cited, in accordance with accepted academic practice. No use, distribution or reproduction is permitted which does not comply with these terms.
*Correspondence: Hongwei Jiang, amlhbmdod0BoYXVzdC5lZHUuY24=; Xiangmei Chen, eG1jaGVuMzAxQDEyNi5jb20=
†These authors have contributed equally to this work
Disclaimer: All claims expressed in this article are solely those of the authors and do not necessarily represent those of their affiliated organizations, or those of the publisher, the editors and the reviewers. Any product that may be evaluated in this article or claim that may be made by its manufacturer is not guaranteed or endorsed by the publisher.
Research integrity at Frontiers
Learn more about the work of our research integrity team to safeguard the quality of each article we publish.