
95% of researchers rate our articles as excellent or good
Learn more about the work of our research integrity team to safeguard the quality of each article we publish.
Find out more
ORIGINAL RESEARCH article
Front. Endocrinol. , 17 November 2022
Sec. Bone Research
Volume 13 - 2022 | https://doi.org/10.3389/fendo.2022.1013771
This article is part of the Research Topic Assessment of Osteoporotic Fractures and Risk Prediction, Volume II View all 20 articles
 Chaoyu Wang1,2†Zhiping Zhang3†
 Zhenzhen Zheng1†Xiaojuan Chen4†
 Yu Zhang5†Chunhe Li6Huimin Chen7Huizhao Liao5Jinru Zhu1
 Junyan Lin5Hongwei Liang3Qiuying Yu2*
 Riken Chen5*Jinhua Liang8*
Objective: This study is undertaken to explore the relationship between obstructive sleep apnea-hypopnea syndrome (OSAHS) and osteoporosis, including the relationship between OSAHS and osteoporosis incidence, lumbar spine bone mineral density (BMD), and lumbar spine T-score.
Method: Cochrane Library, PubMed, Embase, Web of Science, and other databases are searched from their establishment to April 2022. Literature published in 4 databases on the correlation between OSAHS and osteoporosis,lumbar spine BMD,lumbar spine T-score is collected. Review Manager 5.4 software is used for meta-analysis.
Results: A total of 15 articles are selected, including 113082 subjects. Compared with the control group, the OSAHS group has a higher incidence of osteoporosis (OR = 2.03, 95% CI: 1.26~3.27, Z = 2.90, P = 0.004), the lumbar spine BMD is significantly lower (MD = -0.05, 95% CI: -0.08~-0.02, Z = 3.07, P = 0.002), and the lumbar spine T-score is significantly decreased (MD = -0.47, 95% CI: -0.79~-0.14, Z = 2.83, P = 0. 005).
Conclusion: Compared with the control group, the OSAHS group has a higher incidence of osteoporosis and decreased lumbar spine BMD and T-score. In order to reduce the risk of osteoporosis, attention should be paid to the treatment and management of adult OSAHS, and active sleep intervention should be carried out.
Obstructive sleep apnea-hypopnea syndrome (OSAHS) is a sleep disorder characterized by recurrent episodes of apnea that lead to hypoxia, hypercapnia, and sleep disruption (1). Osteoporosis is a bone metabolism disorder characterized by decreased bone mass, destruction of bone microstructure, and susceptibility to fractures (2). It is generally believed that OSAHS is associated with a higher incidence of osteoporosis (3–5), and spinal deformity is one of its main clinical manifestations, as well as kyphosis, limited spinal extension, etc., causing great distress to the affected population and warranting further research. Several studies have explored the relationship between OSAHS and lumbar osteoporosis. Studies by Liguori, Chen et al. (4, 6) suggest that OSA may be a risk factor in bone mineral density (BMD), leading to osteopenia and osteoporosis. The reason may be that hypoxia slows down the growth of osteoblasts, it promotes the activation of osteoclasts. Sforza et al. (7) showed that the protective effects of intermittent hypoxia on bone metabolism, after taking into account the age-related decrease in BMD, reduced the risk of osteopenia and osteoporosis in elderly people with OSAHS. The results of these studies are inconsistent, which has not only caused great trouble for clinicians, but also affected the prevention and treatment of lumbar osteoporosis in patients with OSAHS. The purpose of this study is to conduct a meta-analysis of existing clinical studies so as to explore the relationship between OSAHS and the occurrence of lumbar osteoporosis and BMD changes, thereby providing evidence-based prevention and intervention for lumbar osteoporosis in patients with medical evidence of OSAHS.
According to the Meta-analysis of Observational Studies in Epidemiology (MOOSE) statement (8) and the Systematic Review and Meta-analysis report (Preferred Reporting Items for Systematic) Reviews and Meta-Analyses, PRISMA) standard (9). Cochrane Library, PubMed, Embase, and Web of Science databases were searched from their establishment to April 2022. English search terms included Sleep apnea, obstructive, Obstructive Sleep Apnea, Sleep Apnea Hypopnea syndrome, Sleep-related breathing disorder, Osteoporosis, Bone density, Bone mass, Bone loss and Osteo. The protocol was registered in the Prospective Register of Systematic Reviews(Prospero CRD42022339017).
Inclusion criteria (1): the subjects of the study were adults over 18 years of age (2); the article types were cohort studies, case-control studies, and cross-sectional studies, observing BMD and T-score in patients with sleep apnea or obstructive sleep apnea, evaluating the incidence or prevalence of osteoporosis, and comparing them with the control group (3); OSAHS was diagnosed by polysomnography or portable sleep monitor, and the severity was evaluated by the apnea hypopnea index (AHI), which is the sum of the average number of apnea and hypopnea events per hour (10) (4); lumbar spine BMD (measured in g/cm2) and/or T-score were measured by dual energy X-ray densitometer, and osteoporosis was defined as BMD and T-score < -2.5 SD (11) (5); based on different reports from the same research population, the articles with the largest sample sizes were included.
Exclusion criteria (1): languages other than English (2); studies without a control group (3); studies where the effect size cannot be extracted or calculated (4); studies for which the authors did not respond to contact or could not provide meta-analysis data (5); application of glucocorticoids or other drugs that affect BMD.
Two researchers independently searched, extracted and screened the literature, checked each other’s work, and provided literature with differences to the third researcher for analysis to decide whether or not it should be included. The methodological quality of the included literature was assessed. The quality of the included studies was assessed using the Newcastle-Ottawa Scale (NOS) (12). Only high-quality articles rated higher than 6 stars were included.The extracted data included the first author, study area, publication time, study type, sample size, age, AHI, OSAHS assessment method, BMD, T-score, outcome measures, and adjustment for confounders. After data extraction, the data was checked, and inconsistent data was extracted again. After checking, the data was analyzed.
The lumbar spine BMD (measured in g/cm2) and/or T-score of the subjects were obtained by dual-energy X-ray densitometry, and OSAHS was diagnosed by polysomnography or portable sleep monitor. The incidence of osteoporosis, BMD, and lumbar spine T-score in the OSAHS group and control group were used as outcome indicators. The difference in the incidence of osteoporosis between the OSAHS group and control group indicated the correlation between OSAHS and osteoporosis; the difference in BMD between the OSAHS group and control group indicated the effect of OSAHS on BMD; when the OSAHS group was compared with the control group, the level of lumbar spine T-score was different, indicating the influence of OSAHS.
Statistical analysis was performed using Review Manager 5.4 software. MD and OR values were used for effect evaluation, and 95% CI was calculated. The heterogeneity of the studies was analyzed using the I2 statistic test and Q test. I2 < 50% and P > 0.1 indicated no significant heterogeneity among the studies, while I2 > 50% and P < 0.1 indicated statistical heterogeneity. If there is obvious heterogeneity, the random effect model is used for analysis. Sensitivity analysis can also be conducted to eliminate articles with obvious heterogeneity, and then fixed effect model meta-analysis can be conducted. The presence of publication bias was estimated by funnel plot and Egger’s test. For the analysis results with heterogeneity, the included studies will be stratified according to differences in countries and regions, population age differences, gender, and OSAHS severity for subgroup analysis.
A total of 887 articles were retrieved, 603 were obtained after deduplication, 248 were excluded by reading the titles and abstracts, and 15 were finally included after reading the full text (Figure 1). The study populations were from China; Taiwan, China; Turkey; Croatia; Italy; and France. The basic characteristics of the literature included in the study are shown in Table 1.
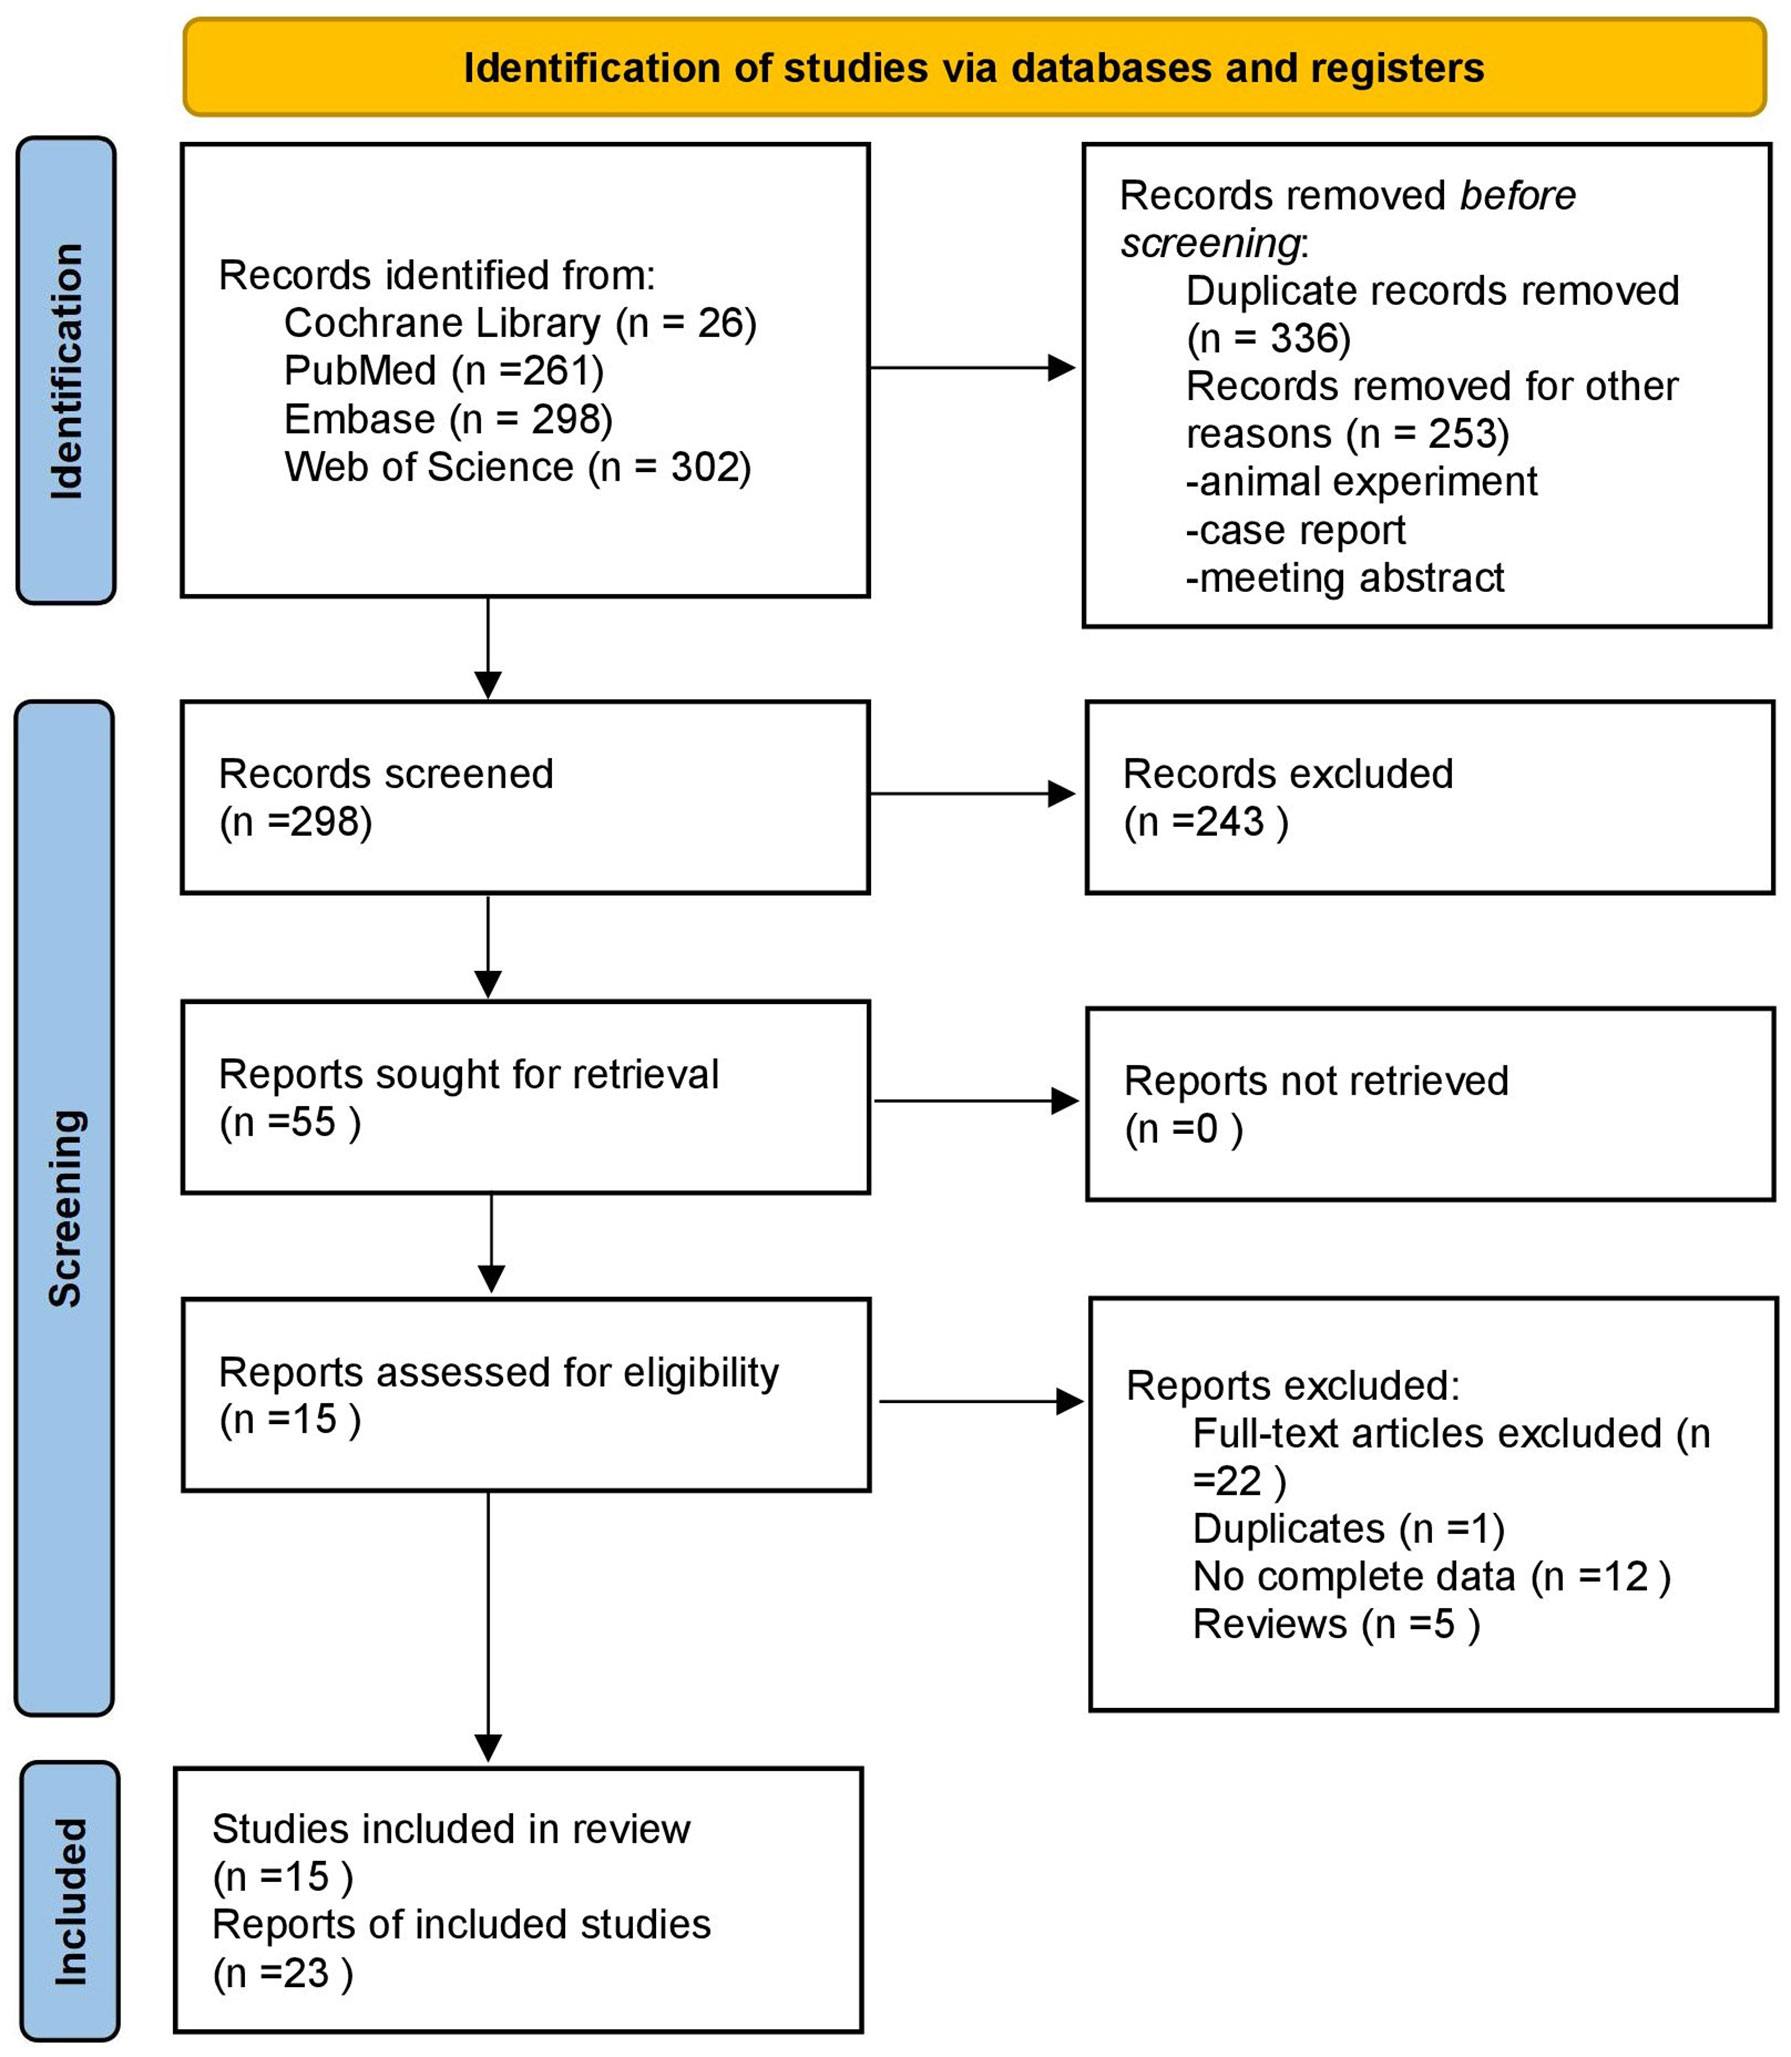
Figure 1 Flow diagram of literature screening.
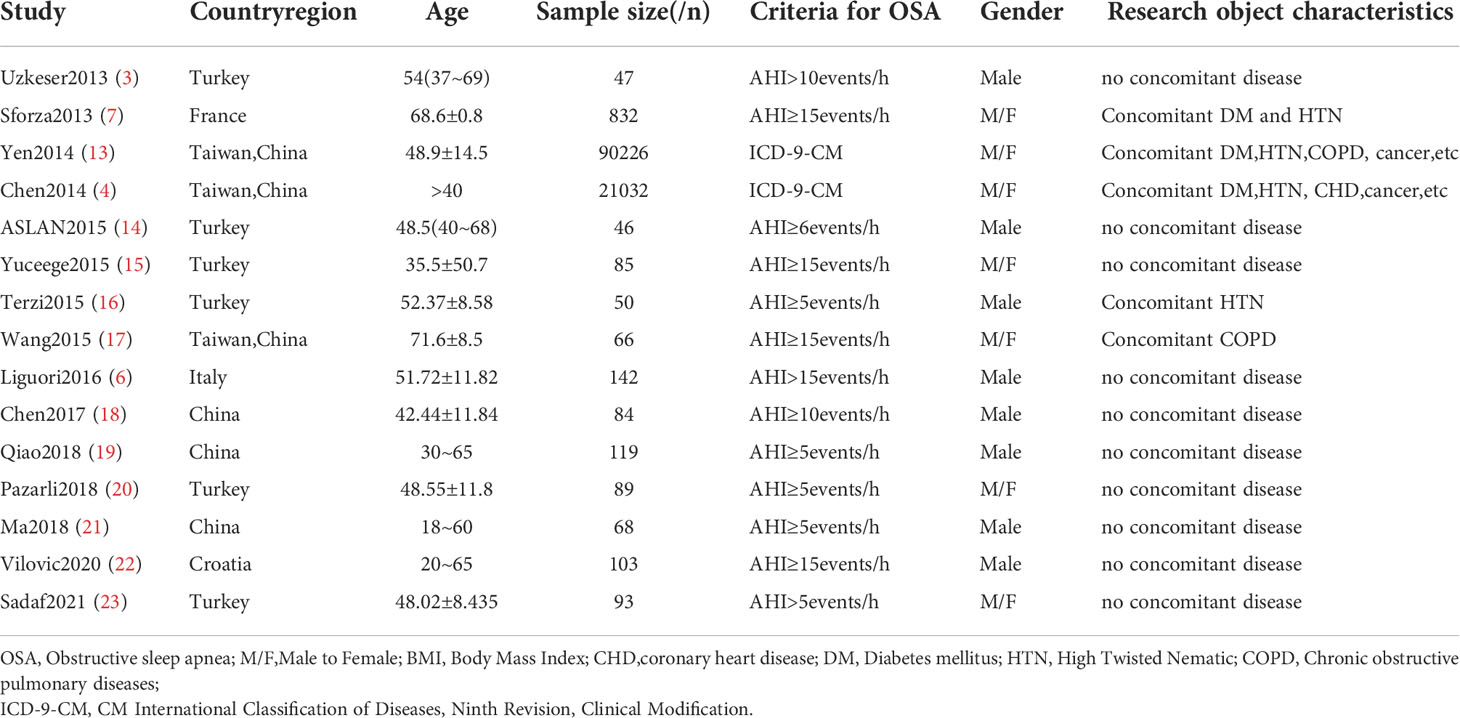
Table 1 Basic features of the included studies.
The quality of the included observational studies was assessed using the NOS scale, which is shown in Table 2. The lowest overall rating was 6★ and the highest was 7★, all moderate to high quality, with low to moderate risk of bias, and no studies were excluded for poor quality (< 5★).
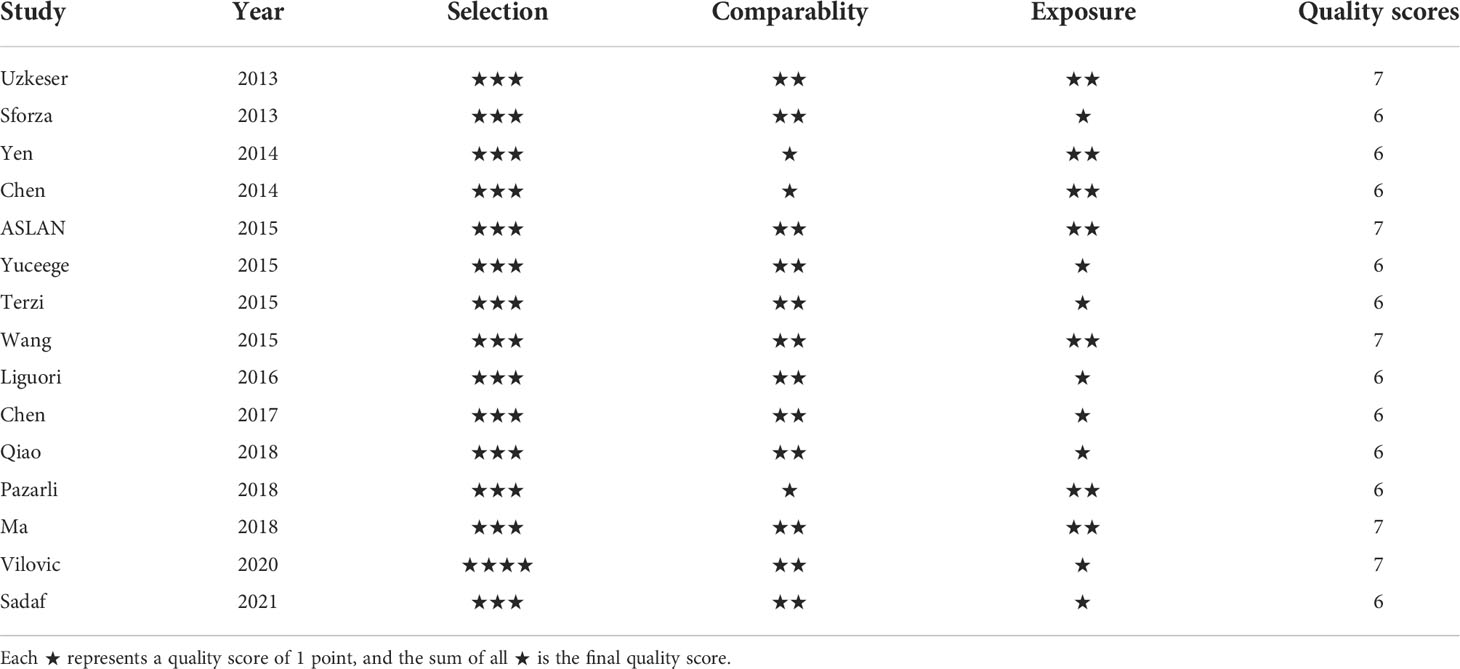
Table 2 Newcastle–Ottawa Scale of the included studies.
Our results include: ① the relationship between OSAHS and the incidence rate of osteoporosis; ② The relationship between OSAHS and lumbar bone mineral density; ③ The relationship between OSAHS and lumbar T-score. We describe the corresponding statistical results in detail below and we have summarized the effect size value for the mean difference of each study, as shown in Table 3.
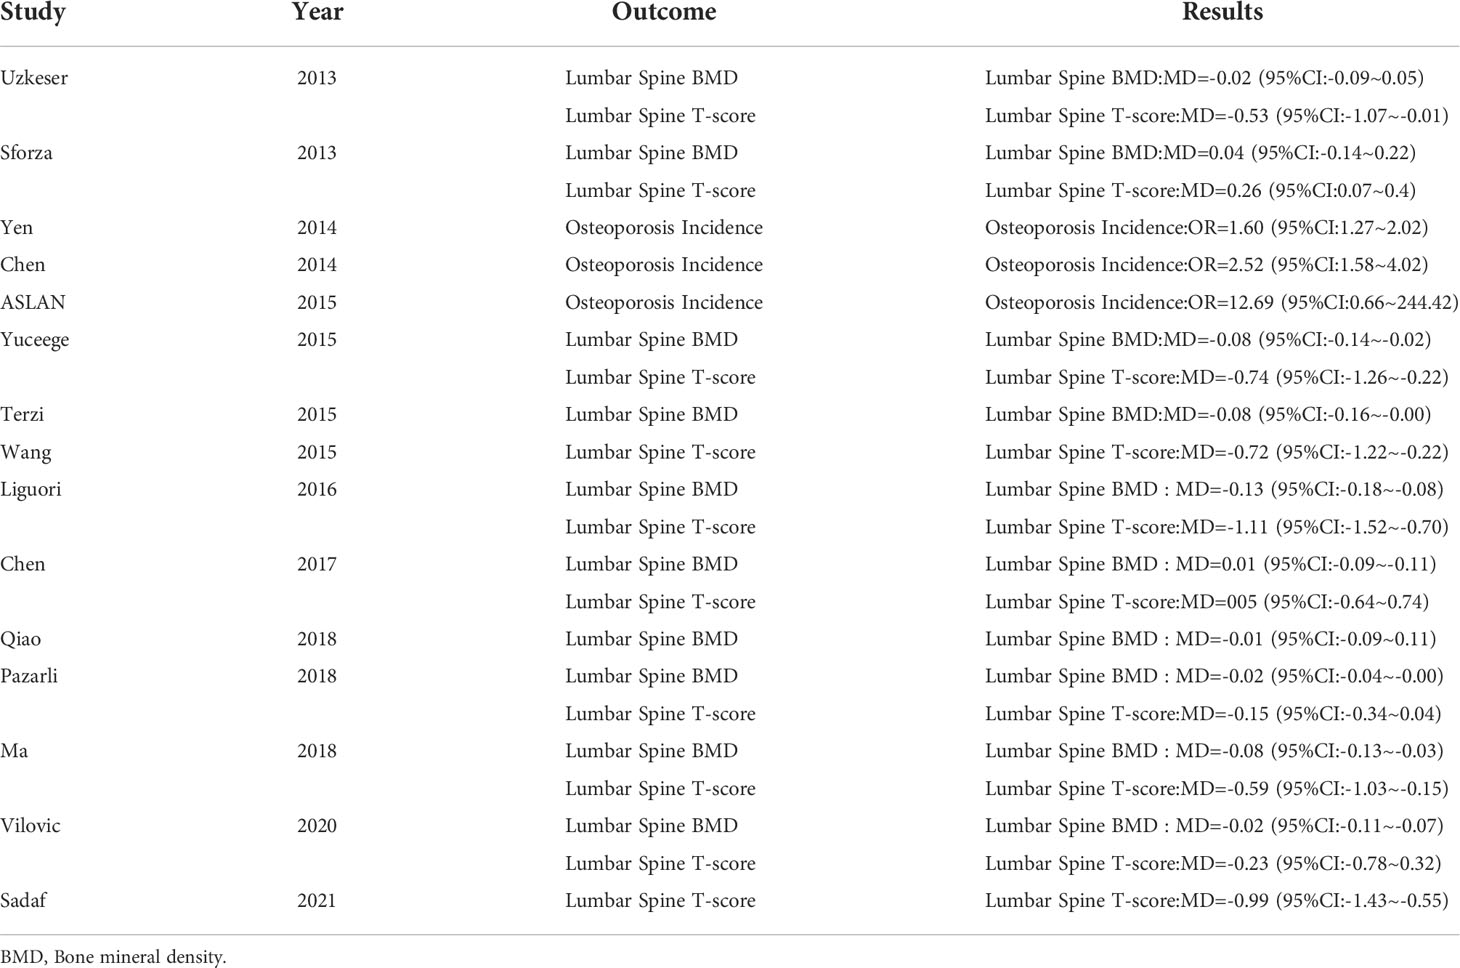
Table 3 The effect size value for mean differences of the included studies.
Three studies (4, 13, 14) provided specific numbers of patients with osteoporosis among their study subjects. All three studies were included in the analysis (Figure 2). The results of the heterogeneity test indicated that there was statistical heterogeneity among the studies (P = 0.1, I2 = 57%), so a random effect model was used. The results showed that compared with the control group, the OSAHS group had a higher incidence of osteoporosis (OR = 2.03, 95% CI: 1.26~3.27, Z = 2.90, P = 0.004).
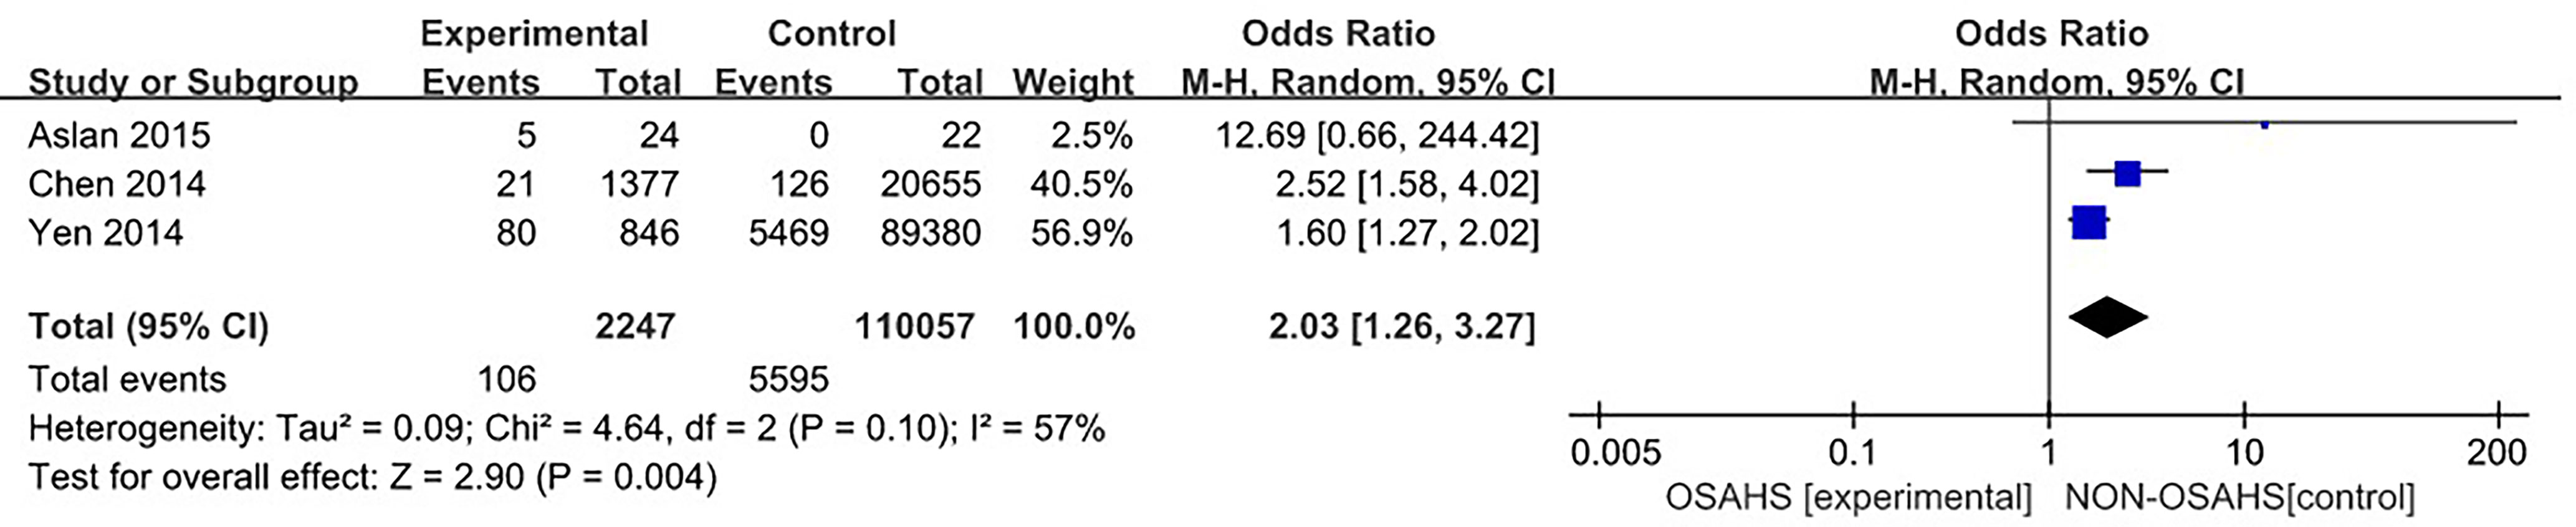
Figure 2 Forest plot of the incidence of osteoporosis in OSAHS group and control group.
Two studies (4, 13) provided specific numbers of osteoporosis in men, women, elderly people (> 65 years), and middle-aged people (40~65 years). To reduce the clinical heterogeneity of the study subjects, subgroup analyses were performed by gender (Figure 3) and age (Figure 4). The results showed that, compared with the control group, in the gender subgroup analysis of the OSAHS group, the combined heterogeneity of the two groups was (P = 0.36, I2 = 7%), and there was no statistically significant heterogeneity among the male group (P = 0.36, I2 = 7%) = 0.2, I2 = 38%), female group (P = 0.76, I2 = 0%), so a fixed effect model was used. After gender subgroup analysis, the heterogeneity of the osteoporosis studies was significantly reduced, male (OR = 1.90, 95% CI: 1.33-2.72, Z = 3.53, P < 0.001), female (OR = 2.56, 95% CI: 1.96-3.34, Z = 6.95, P < 0.001), The incidence of osteoporosis in OSAHS group was higher and statistically significant; the combined final effect size of the gender subgroup analysis was (OR = 2.29, 95% CI: 1.86-2.83, Z = 7.68, P < 0.001); The incidence of osteoporosis in OSAHS group is high and statistically significant. In the subgroup analysis of age, the combined heterogeneity of the two groups was (P = 0.19, I2 = 38%), and there was slight heterogeneity in the statistics. The elderly (> 65 years old) group was (P = 0.69, I2 = 0%) and the middle-aged (40~65 years old) group was (P = 0.25, I2 = 24%), so a fixed effect model was used. After age subgroup analysis, the heterogeneity of the osteoporosis studies was significantly reduced. The elderly (> 65 years old) group was (OR = 2.62, 95% CI: 1.86~3.71, Z = 0.89, P < 0.001) and the middle-aged (40~65 years old) group was (OR = 1.73, 95% CI: 1.31~2.28, Z = 3.31, P < 0.001), so the OSAHS group had a higher incidence of osteoporosis, which was statistically significant. The combined final effect size of the age subgroup analysis was (OR = 2.02, 95% CI: 1.63~2.51, Z = 6.42, P < 0.001); the OSAHS group had a higher incidence of osteoporosis, which was statistically significant.
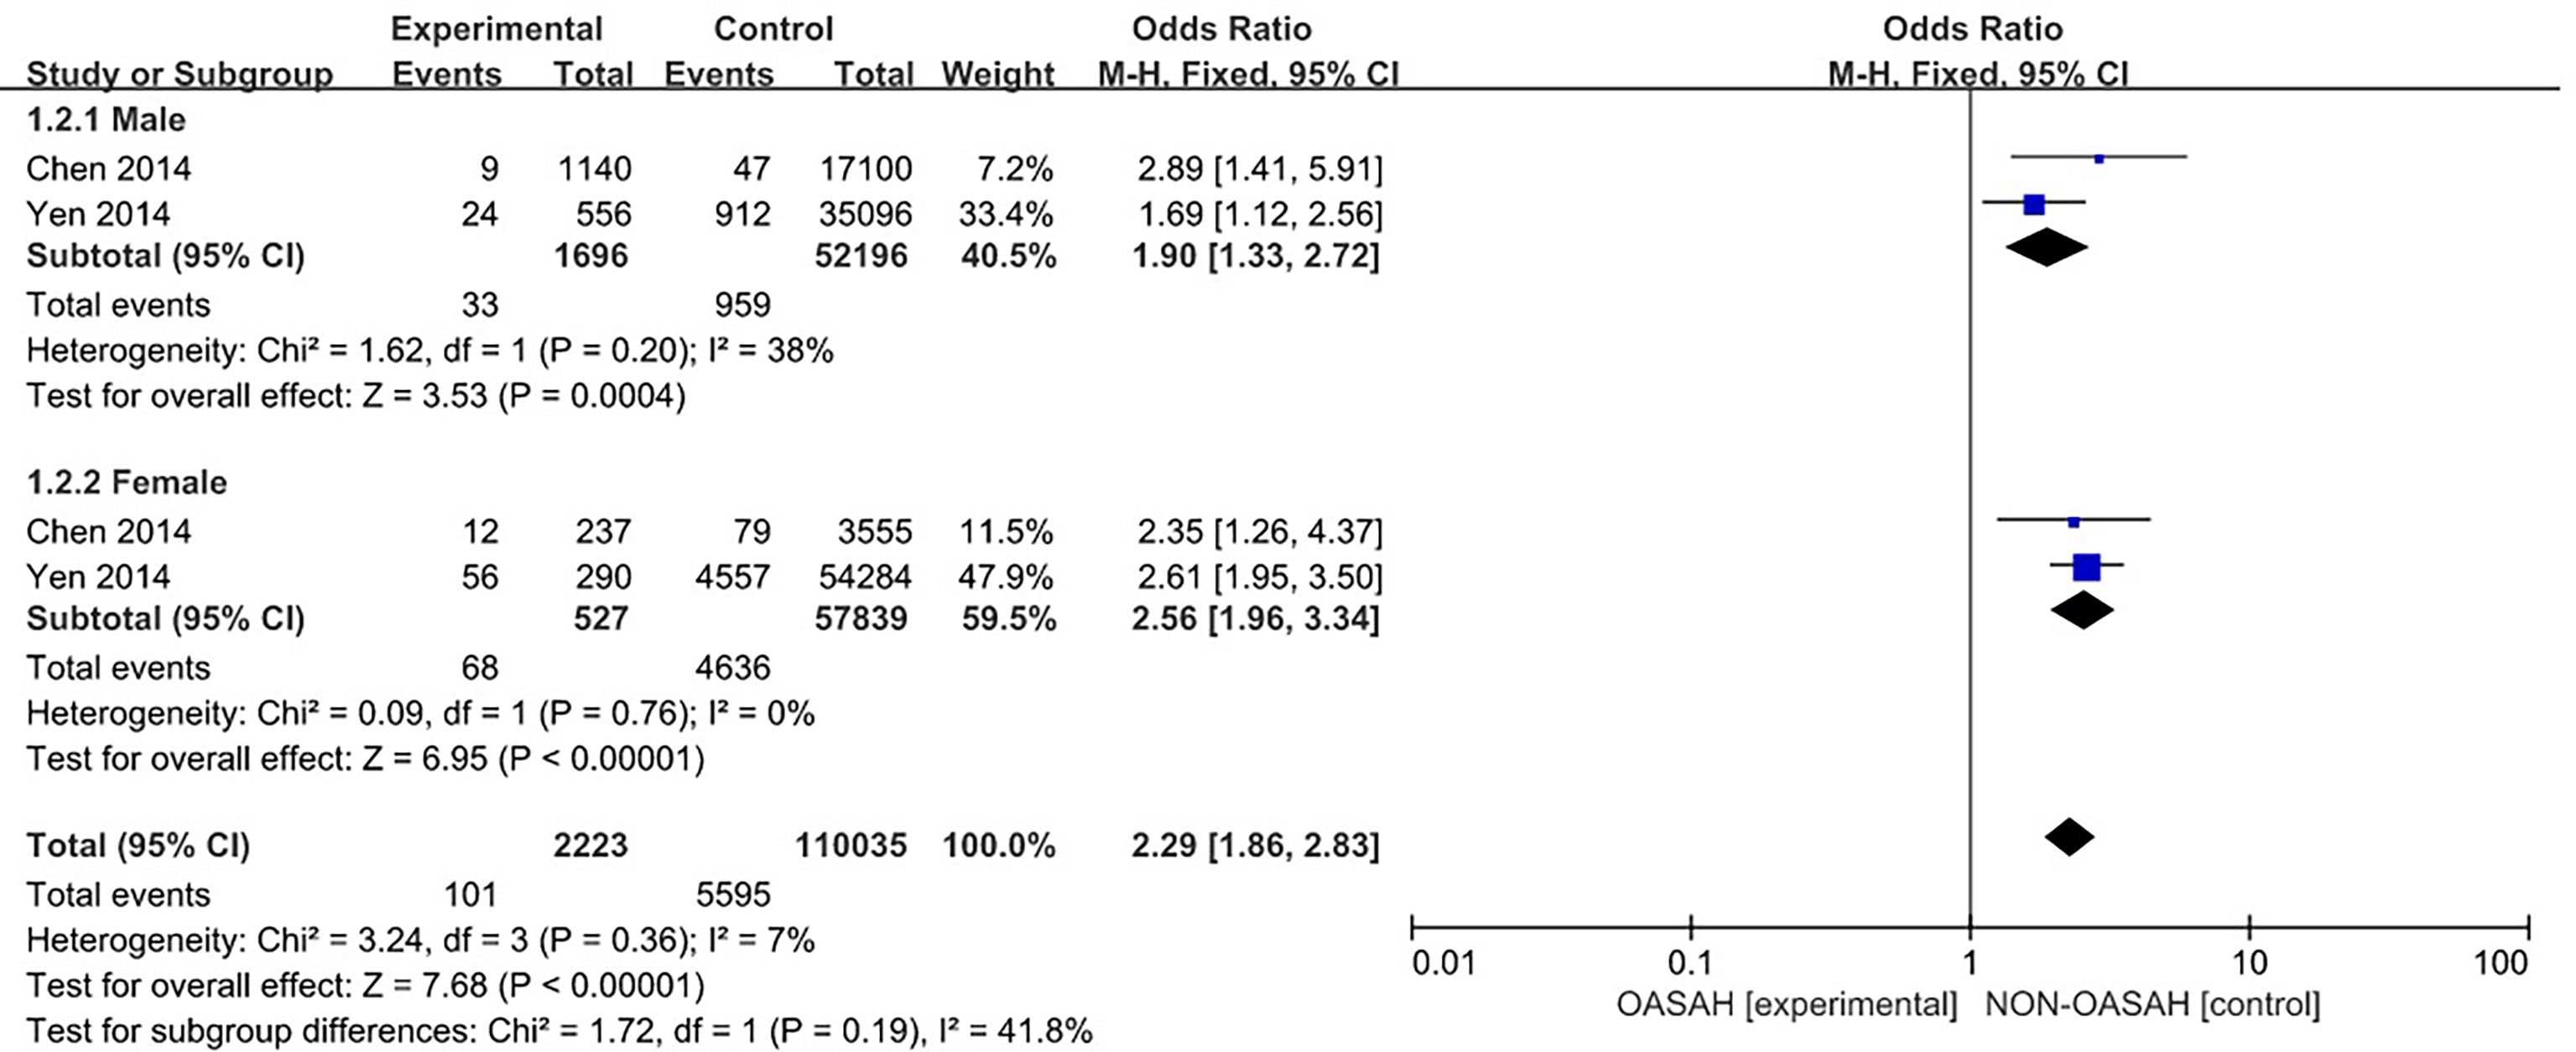
Figure 3 Forest plot of incidence of osteoporosis in male and female subgroups.
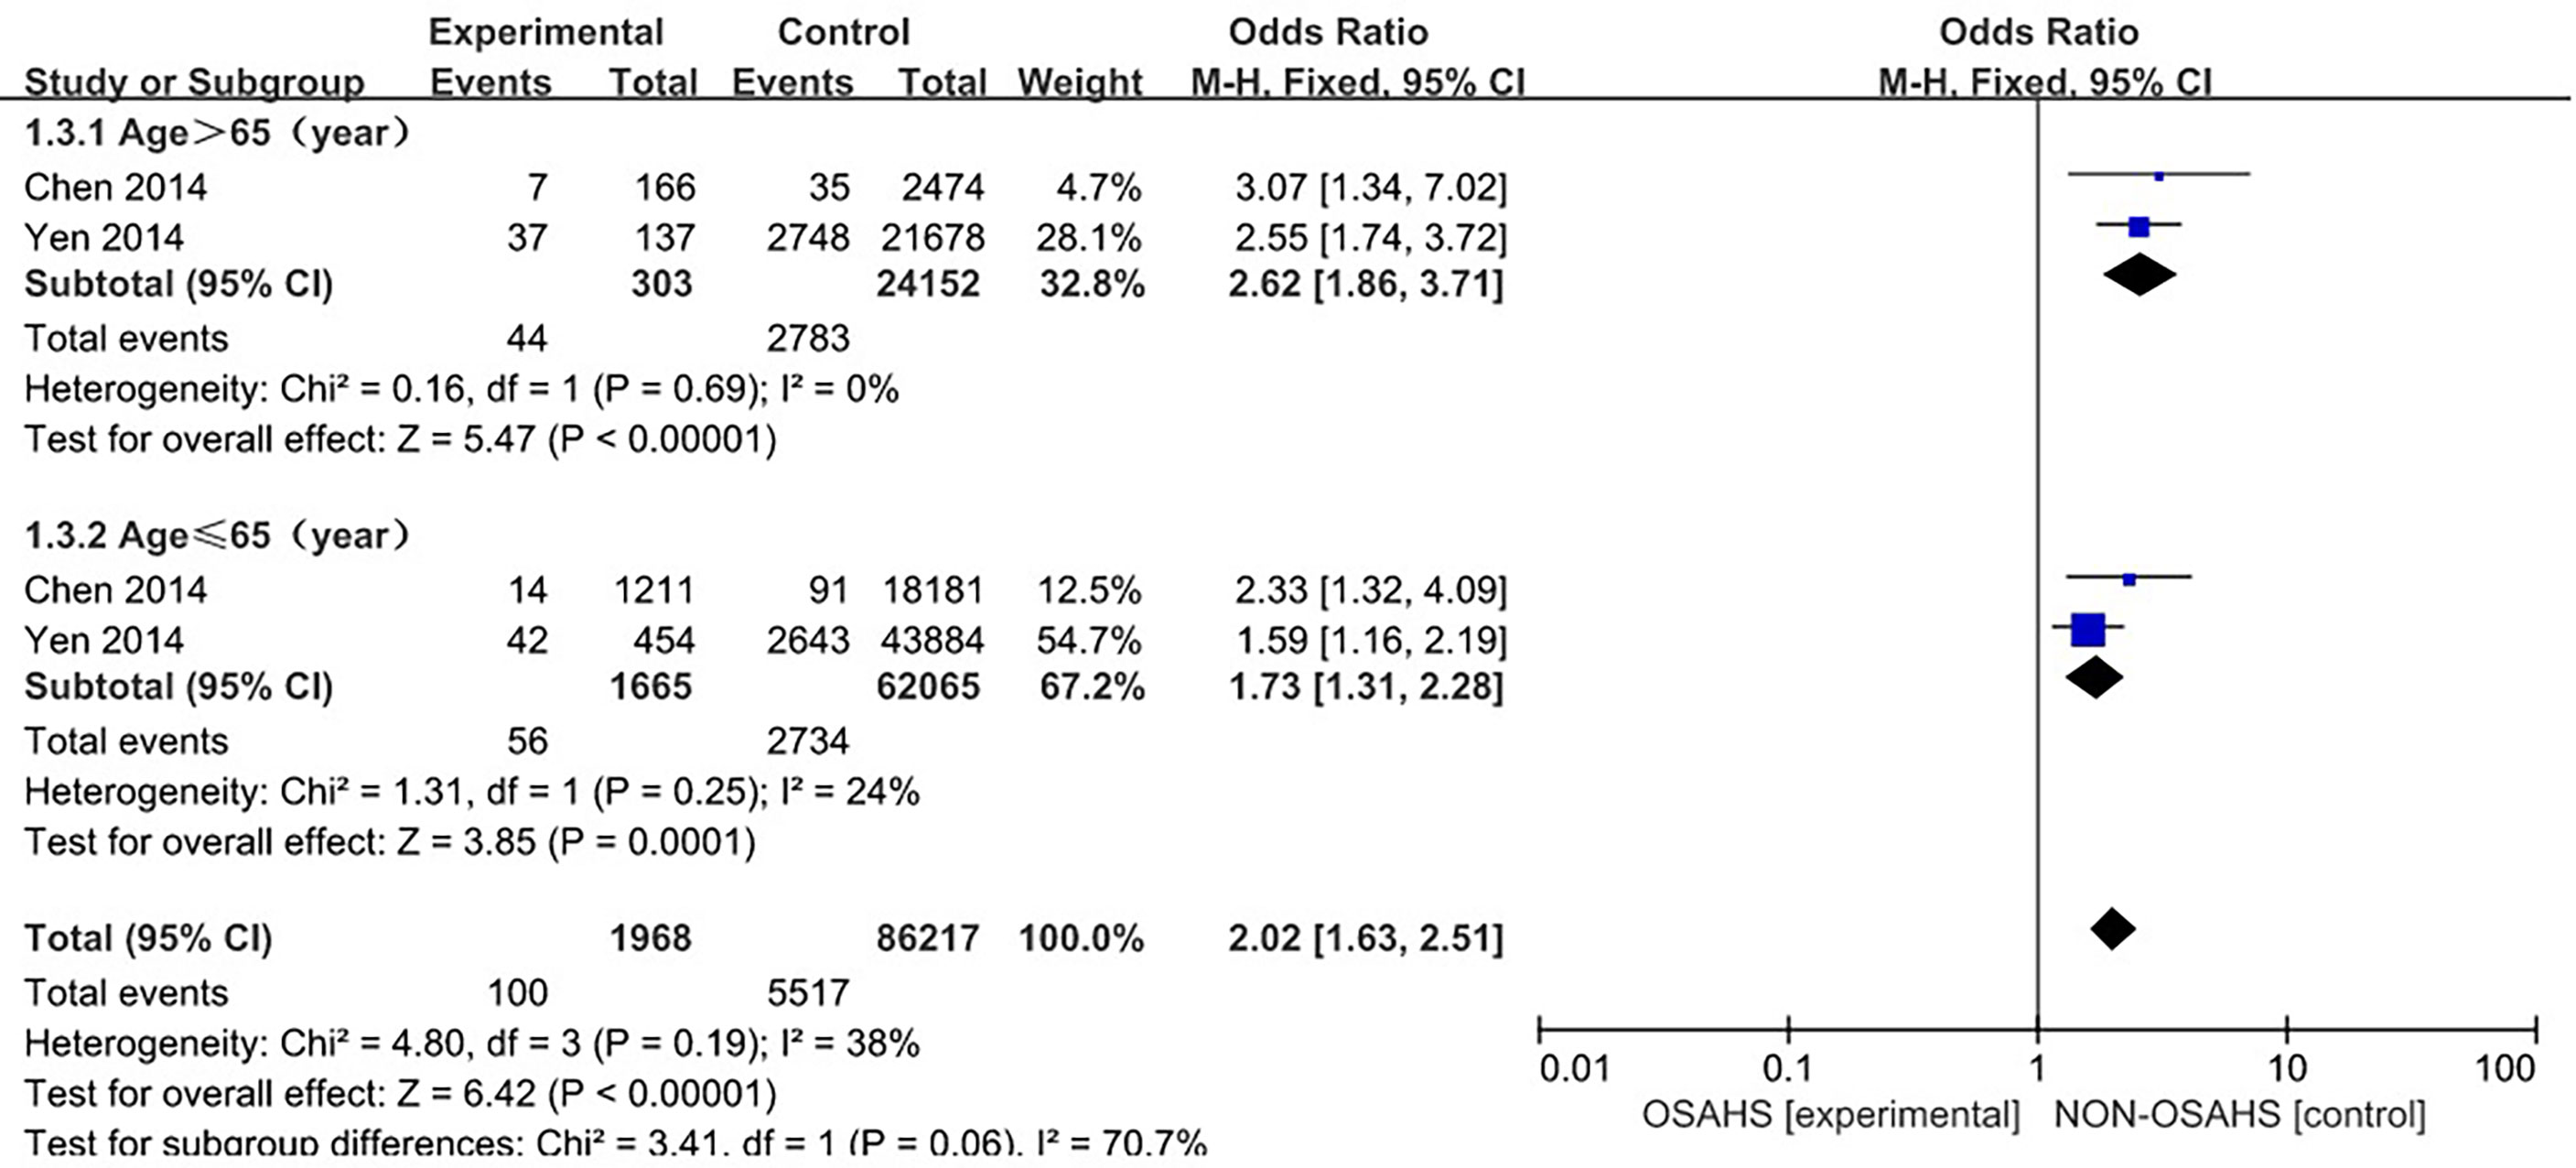
Figure 4 Forest plot of the incidence of osteoporosis in elderly (>65 years old) and middle-aged (40-65 years old) subgroups.
The forest plot analysis of OSAHS and the incidence of osteoporosis suggest that OSAHS is associated with the prevalence of osteoporosis and is a risk factor for the disease.
Ten studies (3, 6, 7, 15, 16, 18–22) were included in a meta-analysis of lumbar spine BMD (Figure 5). Compared with the control group, lumbar spine BMD was significantly lower in the OSAHS group (MD = -0.05, 95% CI: -0.08~-0.02, Z = 3.07, P = 0.002). There was moderate heterogeneity between studies (I2 = 66%, P = 0.002), so a random effect model was used. The elderly population is at increased risk for OSAHS (24, 25) due to changes in the anatomy and function of the upper airway (26), and the frequent coexistence of other medical conditions such as diabetes, hypertension, and cardiovascular disease. Meanwhile, BMD gradually decreases with age (27). Risk factors such as old age, diabetes, hypertension, and some diseases that affect osteoporosis may affect the results of osteoporosis research, leading to unstable results for the association between OSAHS and lumbar spine BMD. To further verify the relationship between OSAHS and lumbar spine BMD, and further reduce the clinical heterogeneity of the study subjects, we conducted a subgroup analysis after excluding osteoporosis-related risk factors, including a subgroup analysis of AHI grouping by OSAHS diagnostic criteria and regional subgroup analysis. The research population of Sforza2013 (7) was older than 65 and accompanied by hypertension, diabetes, and other diseases; in Terzi2015 (16), some of the research subjects had hypertension complications; and all of the above may affect the results of a lumbar spine BMD study.
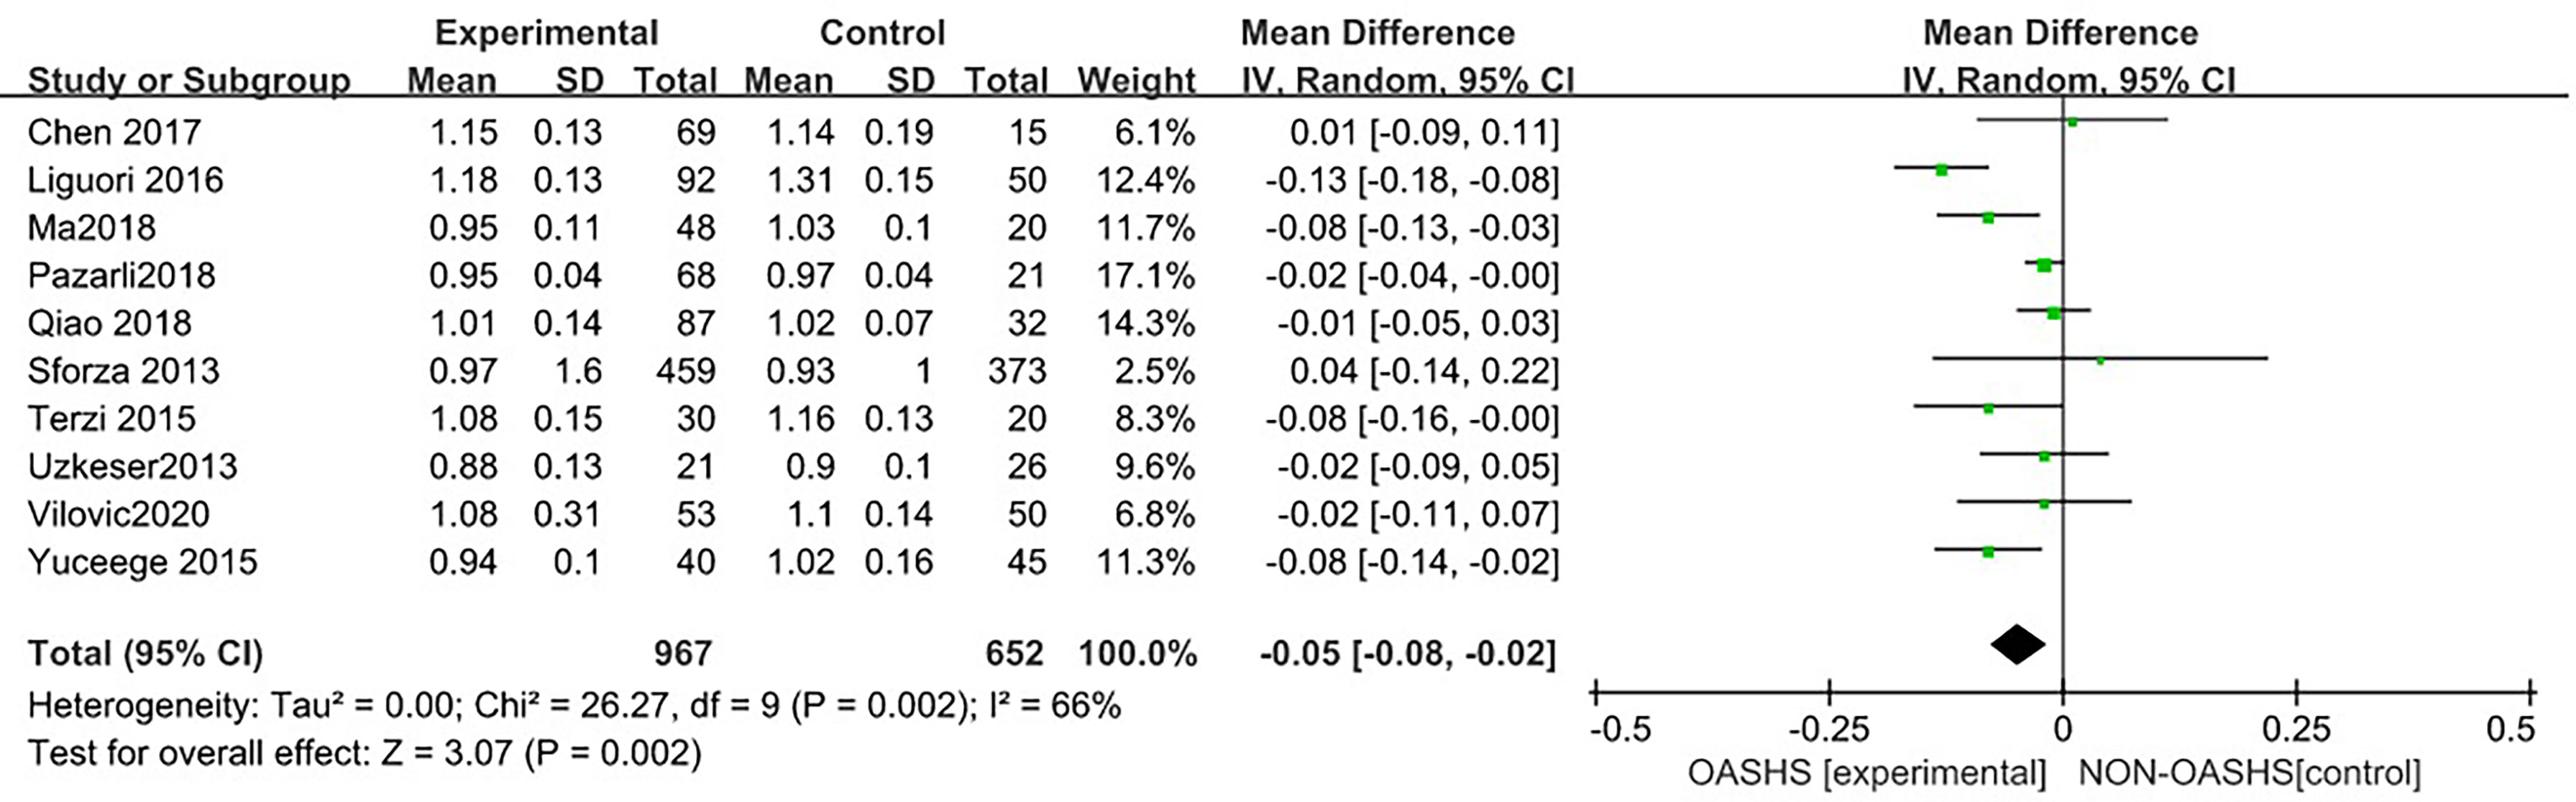
Figure 5 Forest plot of lumbar spine bone mineral density between OSAHS group and control group.
In a subgroup analysis of AHI grouping with OSAHS diagnostic criteria (after the exclusion of osteoporosis-related risk factors) (Figure 6), 8 studies were included (3, 6, 15, 18–22), and the groups were combined for heterogeneity (P = 0.001, I2 = 71%). There was moderate heterogeneity in the statistics. In the subgroup analysis, the OSAHS diagnostic heterogeneity criteria of AHI > 5~10 events/h group was (P = 0.26, I2 = 24%), and the grouping heterogeneity of AHI > 15 events/h was (P = 0.09, I2 = 58%), so a random effect model was used. After the subgroup analysis of OSAHS diagnostic criteria AHI grouping, the correlation between OSAHS and lumbar spine BMD was different. The quality was significantly reduced. The results of subgroup analysis showed that compared with the control group, the lumbar spine BMD of the OSAHS group with AHI > 5~10 events/h was slightly lower (MD = -0.02, 95% CI: -0.05~-0.00, Z = 2.19, P = 0.03), the lumbar spine BMD in the AHI > 15 events/h group was significantly decreased (MD = -0.09, 95% CI: -0.14~-0.03, Z = 3.02, P = 0.003), and the difference was statistically significant. The effect size of lumbar spine BMD in the OSAHS group AHI > 15 events/h was higher than that of the OSAHS diagnostic criteria AHI > 5~10 events/h group, indicating that in patients grouped by OSAHS diagnostic criteria AHI > 15 events/h, compared with AHI > 5~10 events/h, the risk of lumbar BMD decline was higher, so the severity of OSAHS may be related to lumbar BMD. The combined effect size of the AHI group was (MD = -0.05, 95% CI: -0.08~-0.01, Z = 2.79, P = 0.005). The OSAHS group had lower lumbar spine BMD, the results remained unchanged after excluding risk factors for osteoporosis, and the difference was statistically significant.
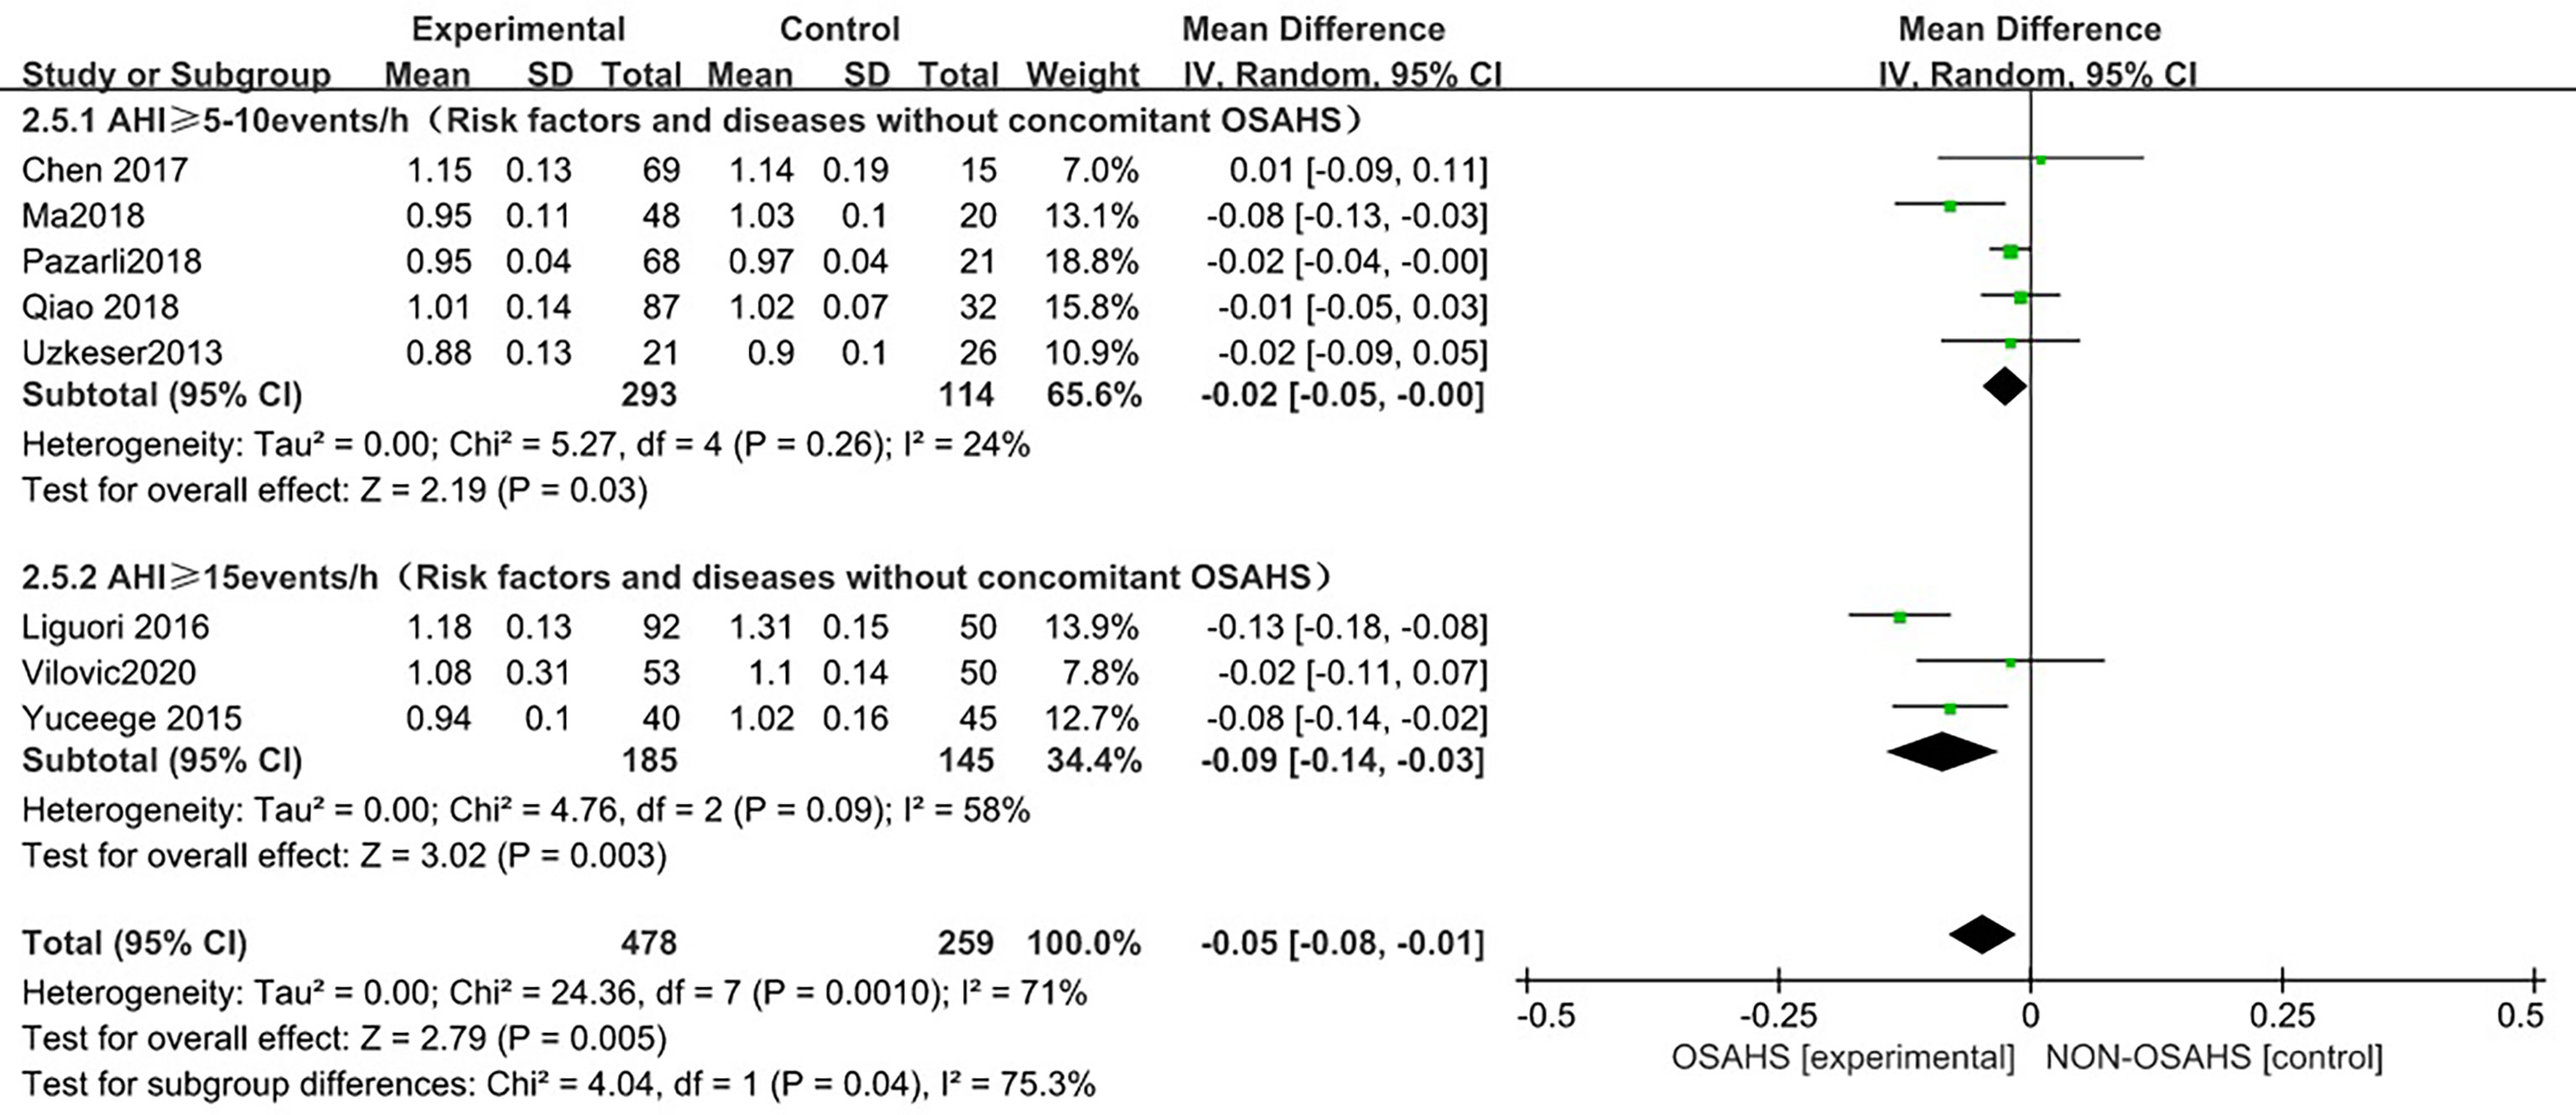
Figure 6 Forest plot of subgroup analysis of lumbar spine BMD in OSAHS group and control group by “AHI group” (grouped according to OSAHS diagnostic criteria, after exclusion of osteoporosis-related risk factors).
In the regional subgroup analysis (after excluding osteoporosis-related risk factors), (Figure 7), 8 studies were included (3, 6, 15, 18–22), and the combined group heterogeneity was (P = 0.001, I2 = 71%), indicating moderate statistical heterogeneity. In the subgroup analysis, the grouping heterogeneity in East Asia was (P = 0.08, I2 = 60%), that in the Middle East was (P = 0.14), I2 = 49%), and that in Europe was (P = 0.04, I2 = 77%), so a random effect model was used. The results of the subgroup analysis showed that, compared with the control group, the East Asian group was (MD = -0.03, 95% CI: -0.09~0.02, Z = 1.16, P = 0.25), Middle East group was (MD = -0.04, 95%). CI: -0.07~0.00, Z = 1.89, P = 0.06), and European group was (MD = -0.08, 95% CI: -0.19~0.02, Z = 1.51, P = 0.13), so the lumbar spine BMD was lower in each regional grouping, but the difference was not statistically significant. The combined effect size of the regional grouping was (MD = -0.05, 95% CI: -0.08~-0.01, Z = 2.79, P = 0.005), indicating that the OSAHS group had lower lumbar spine BMD, and the subgroup analysis was performed after excluding osteoporosis risk factors when the results remained stable and the difference was statistically significant.
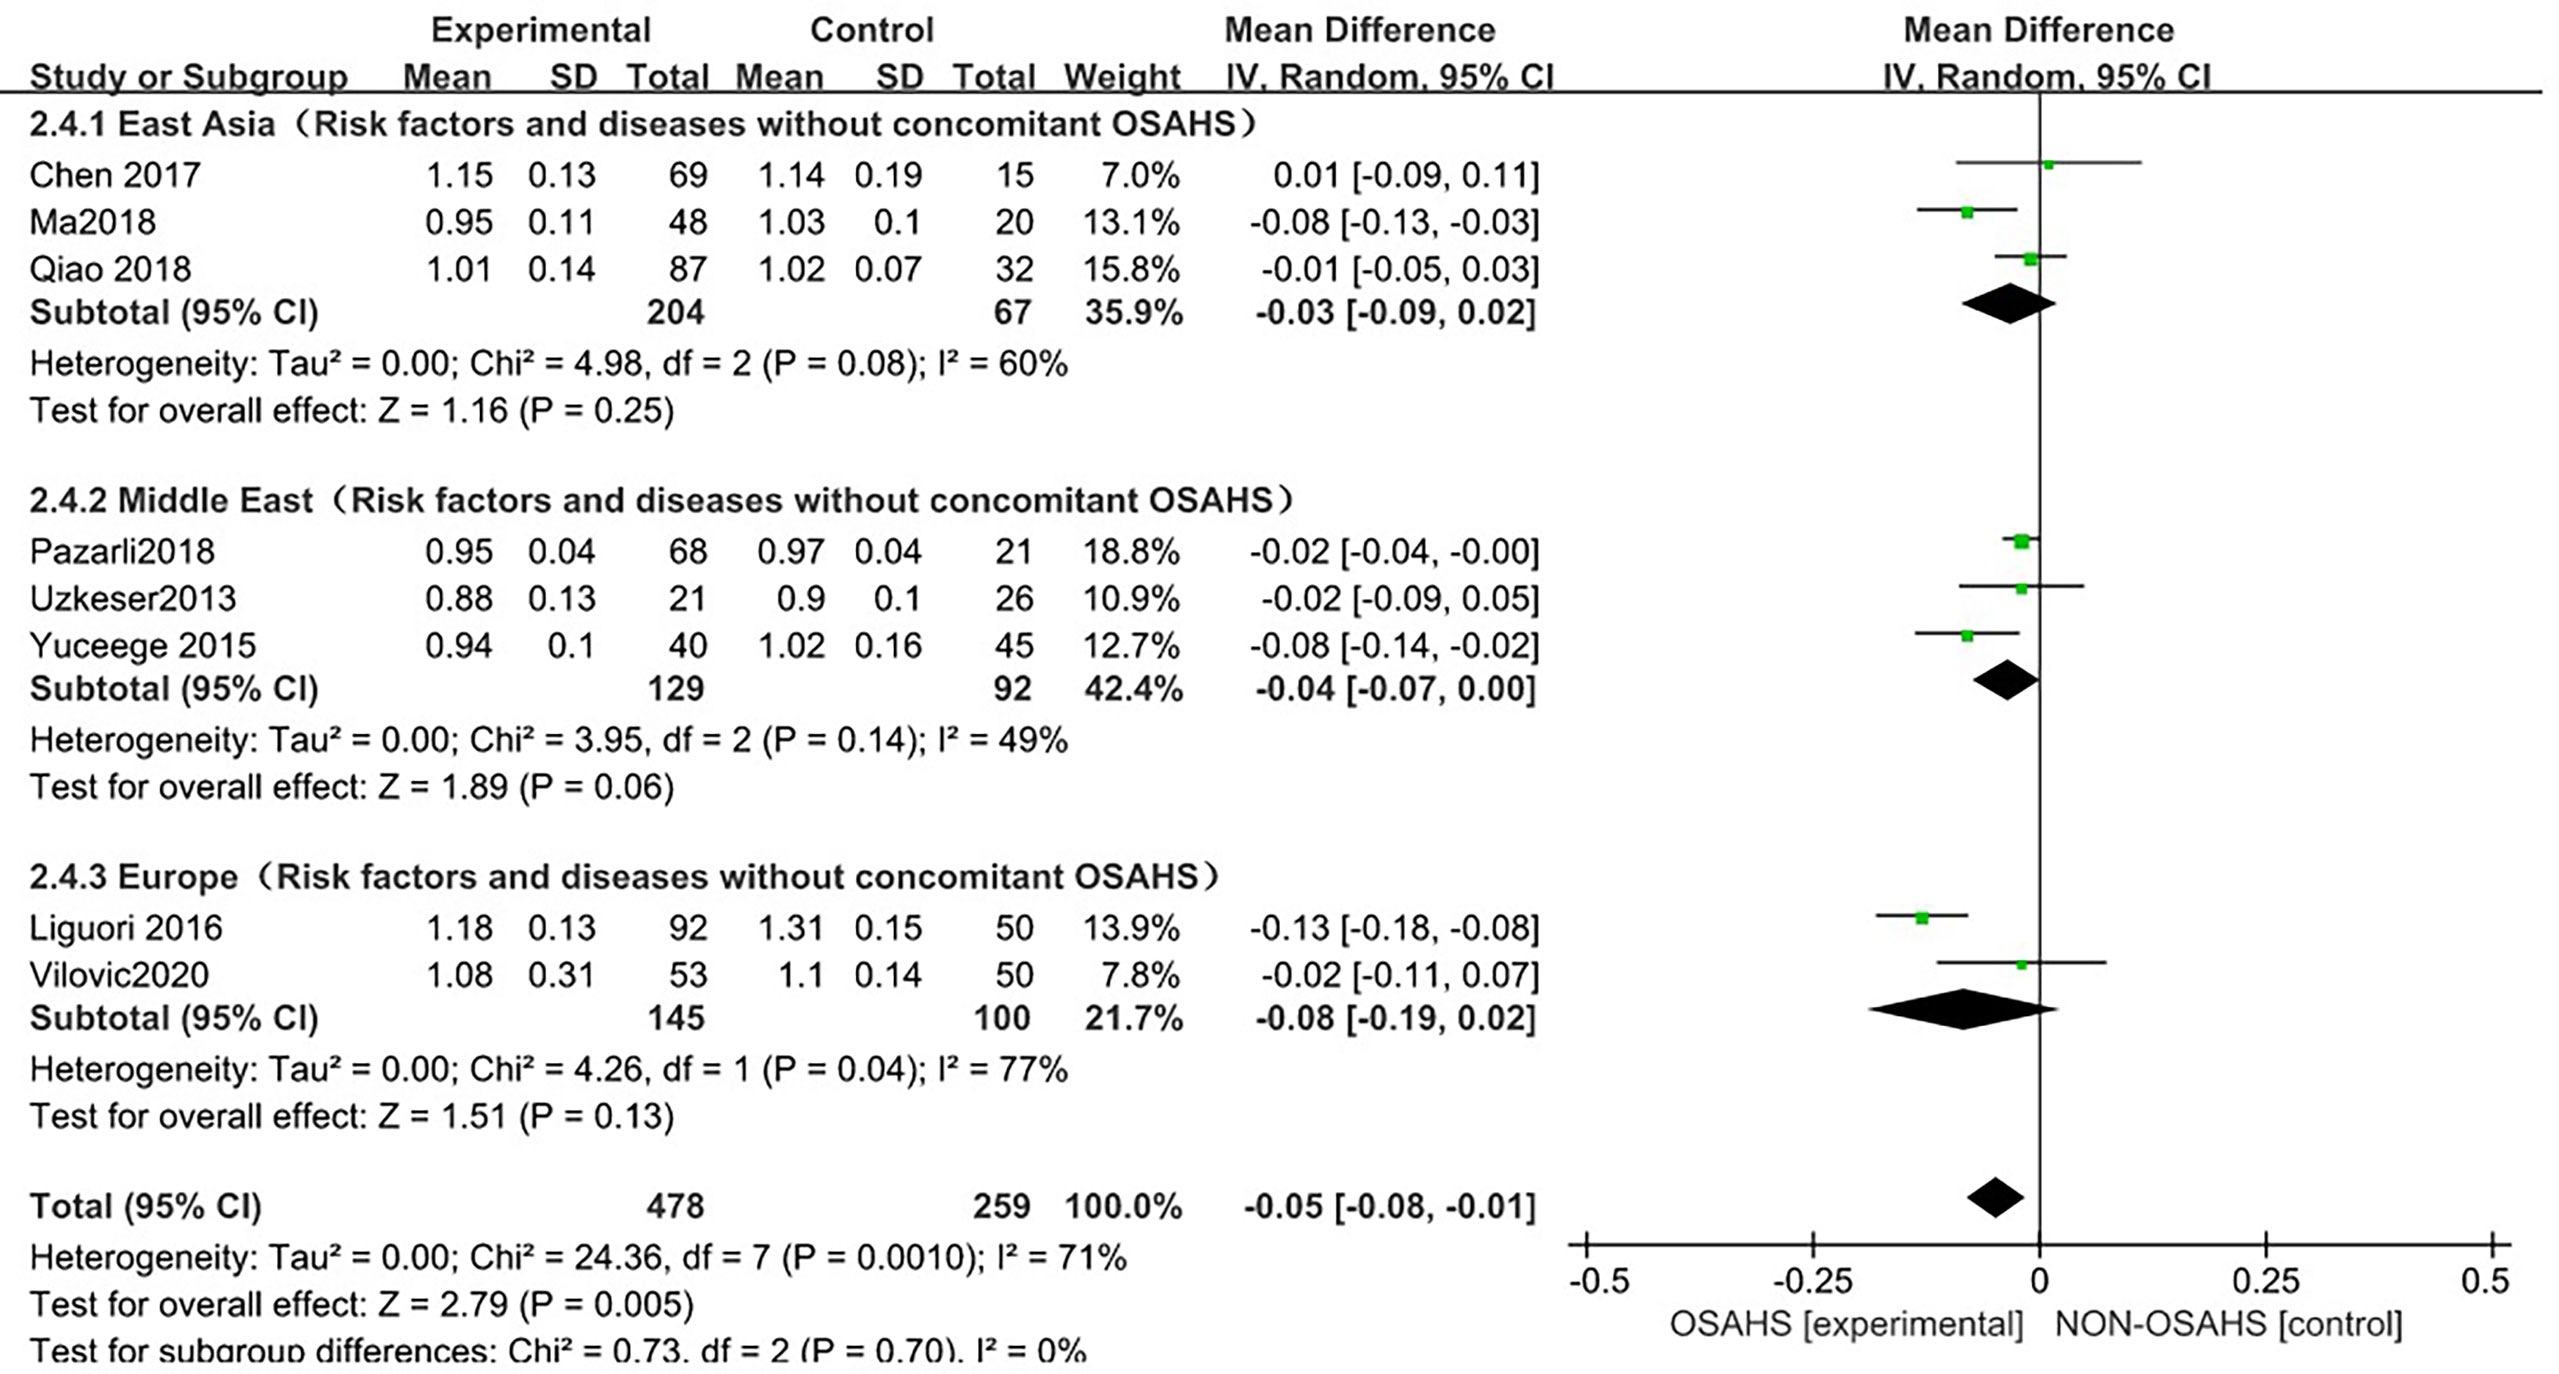
Figure 7 Forest plot of subgroup analysis of lumbar spine BMD in OSAHS group and control group (after excluding risk factors related to osteoporosis).
The forest plot analysis of OSAHS and lumbar spine BMD studies suggested that OSAHS was associated with lumbar spine BMD, OSAHS was a risk factor for the decrease in lumbar spine BMD, and the severity of OSAHS may be related to lumbar spine BMD.
Ten studies (3, 6, 7, 15, 17, 18, 20–23) were included in the meta-analysis of lumbar spine T-score (Figure 8). Compared with the control group, the lumbar spine T-score was significantly lower in the OSAHS group (MD = -0.47, 95% CI: -0.79~-0.14, Z = 2.83, P = 0.005). There was high heterogeneity between studies (I2 = 87%, P < 0.001), so a random effect model was used. Similarly, risk factors such as old age, diabetes, hypertension, and some diseases that affect osteoporosis may affect the results of osteoporosis research, leading unstable results for the association between OSAHS and lumbar spine T-score. In order to further verify the relationship between OSAHS and lumbar spine T-score, and further reduce the clinical heterogeneity of the studies, we conducted a subgroup analysis after excluding risk factors related to osteoporosis, including subgroups grouped by AHI according to the OSAHS diagnostic criteria. The research population of Sforza2013 (7) was older than 65 and accompanied by hypertension, diabetes, and other diseases; the mean age of the research population of Wang2015 (17) was more than 65 and accompanied by chronic obstructive pulmonary disease; as both may affect the results of lumbar spine BMD studies, they were not included in the subgroup analysis.
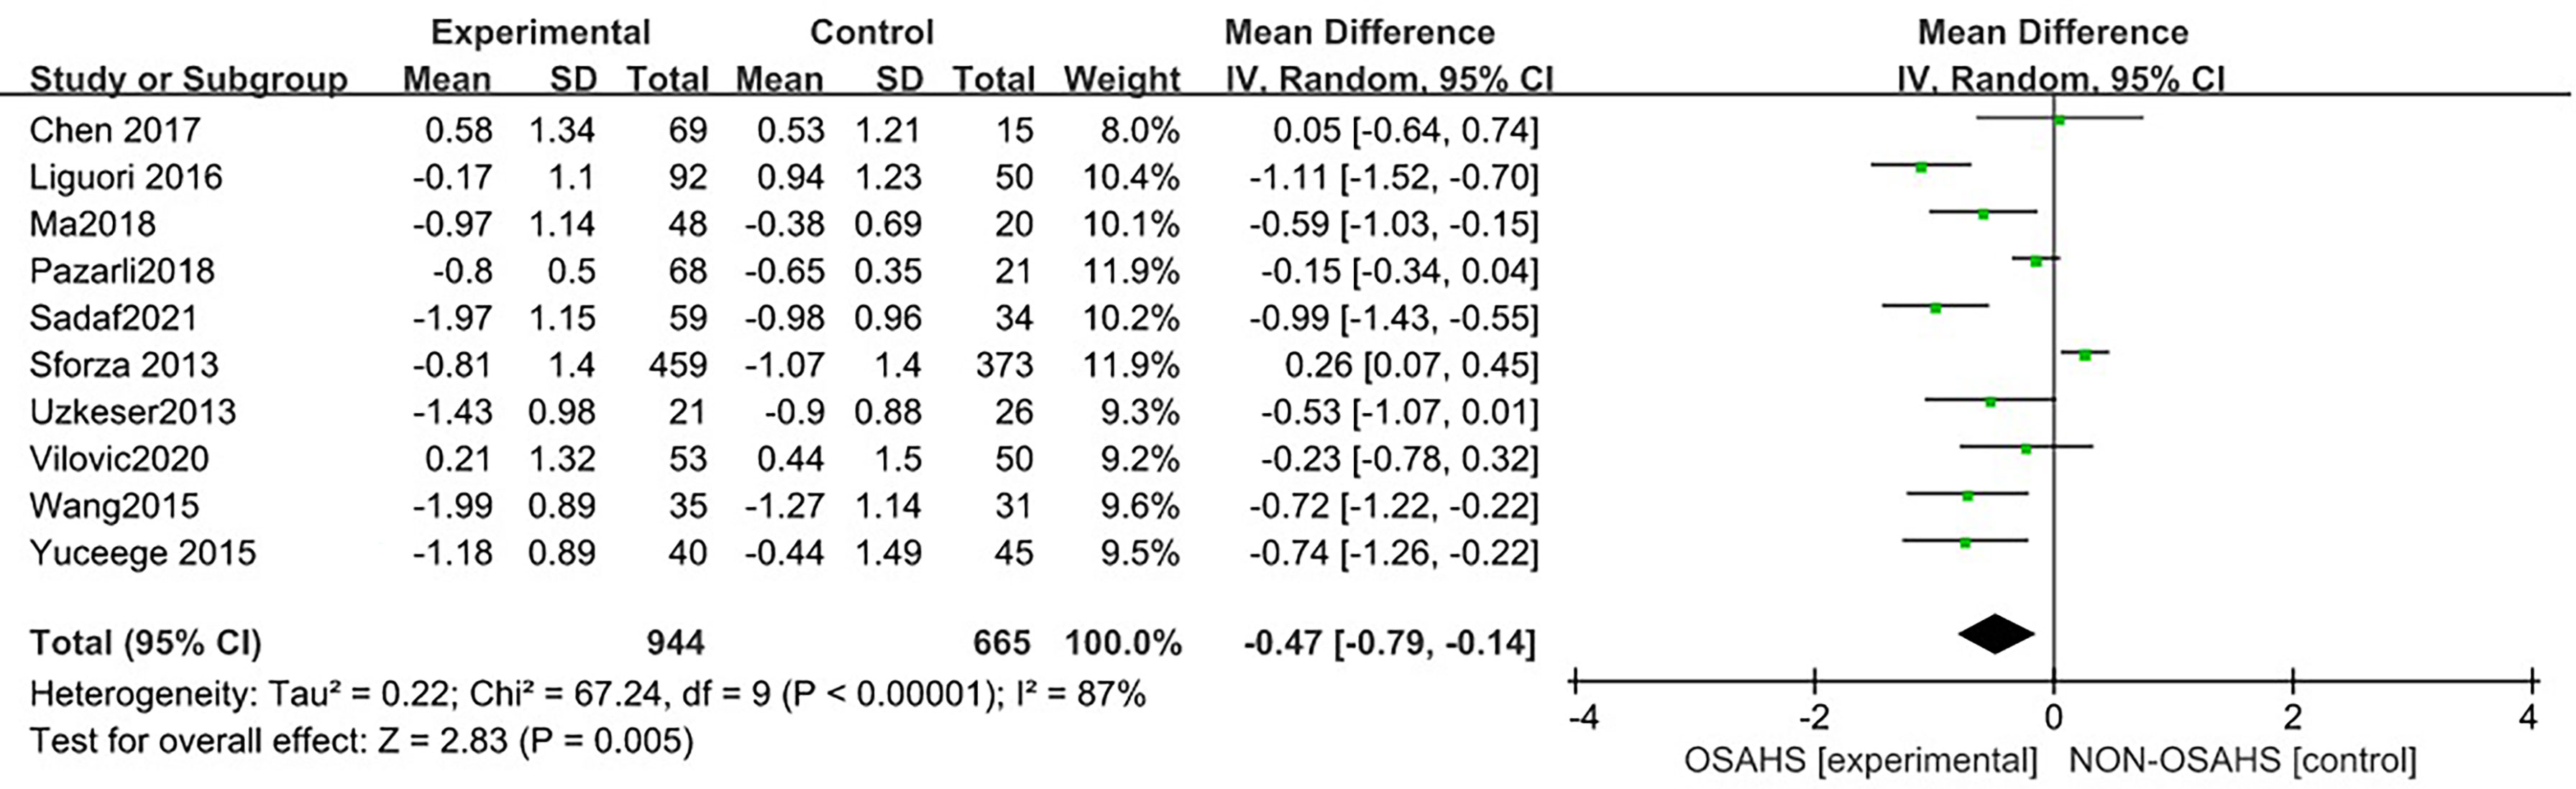
Figure 8 Forest plot of lumbar spine T-score between OSAHS group and control group.
In a subgroup analysis of AHI grouping according to OSAHS diagnostic criteria (after the exclusion of osteoporosis-related risk factors) (Figure 9), 8 studies were included (3, 6, 15, 18, 20–23) with heterogeneous groupings. In the subgroup analysis, the grouping heterogeneity of OSAHS diagnostic criteria AHI > 5~10 events/h was (P = 0.004, I2 = 74%). %), and the grouping heterogeneity of AHI ≥ 15 events/h was (P = 0.04, I2 = 69%), so a random effect model was used. After the OSAHS diagnostic criteria AHI grouping subgroup analysis, The heterogeneity in the correlation study between OSAHS and lumbar spine T-score was significantly reduced, and the heterogeneity of AHI ≥ 5~10 events/h group and AHI ≥ 15 events/h group were reduced to moderate heterogeneity. The results of the subgroup analysis showed that compared with the control group, the lumbar spine T-score in the OSAHS AHI ≥ 5~10 events/h group was decreased (MD = -0.45, 95% CI: -0.82~-0.09, Z = 2.42, P < 0.001), the lumbar spine T-score in the AHI > 15 events/h group was significantly decreased (MD = -0.72, 95% CI: -1.22~-0.21, Z = 2.79, P = 0.005), and the difference was statistically significant. The lumbar spine T-score effect size of the OSAHS diagnostic criteria AHI ≥ 15 events/h group was higher than that of the OSAHS diagnostic criteria AHI ≥ 5~10 events/h group, indicating that compared with AHI ≥ 5-10 events/h group, The risk of lumbar T-score decline was higher in the the patients in the OSAHS diagnostic criteria AHI ≥ 15 events/h group, and the severity of OSAHS may be related to lumbar T-score. The combined effect size of the AHI group (MD = -0.55, 95% CI: -0.86~-0.24, Z = 3.46, P < 0.001), the lumbar spine T-score of the OSAHS group was also lower, excluding the risk factors related to osteoporosis. After group analysis, the results remained stable and the difference was statistically significant.
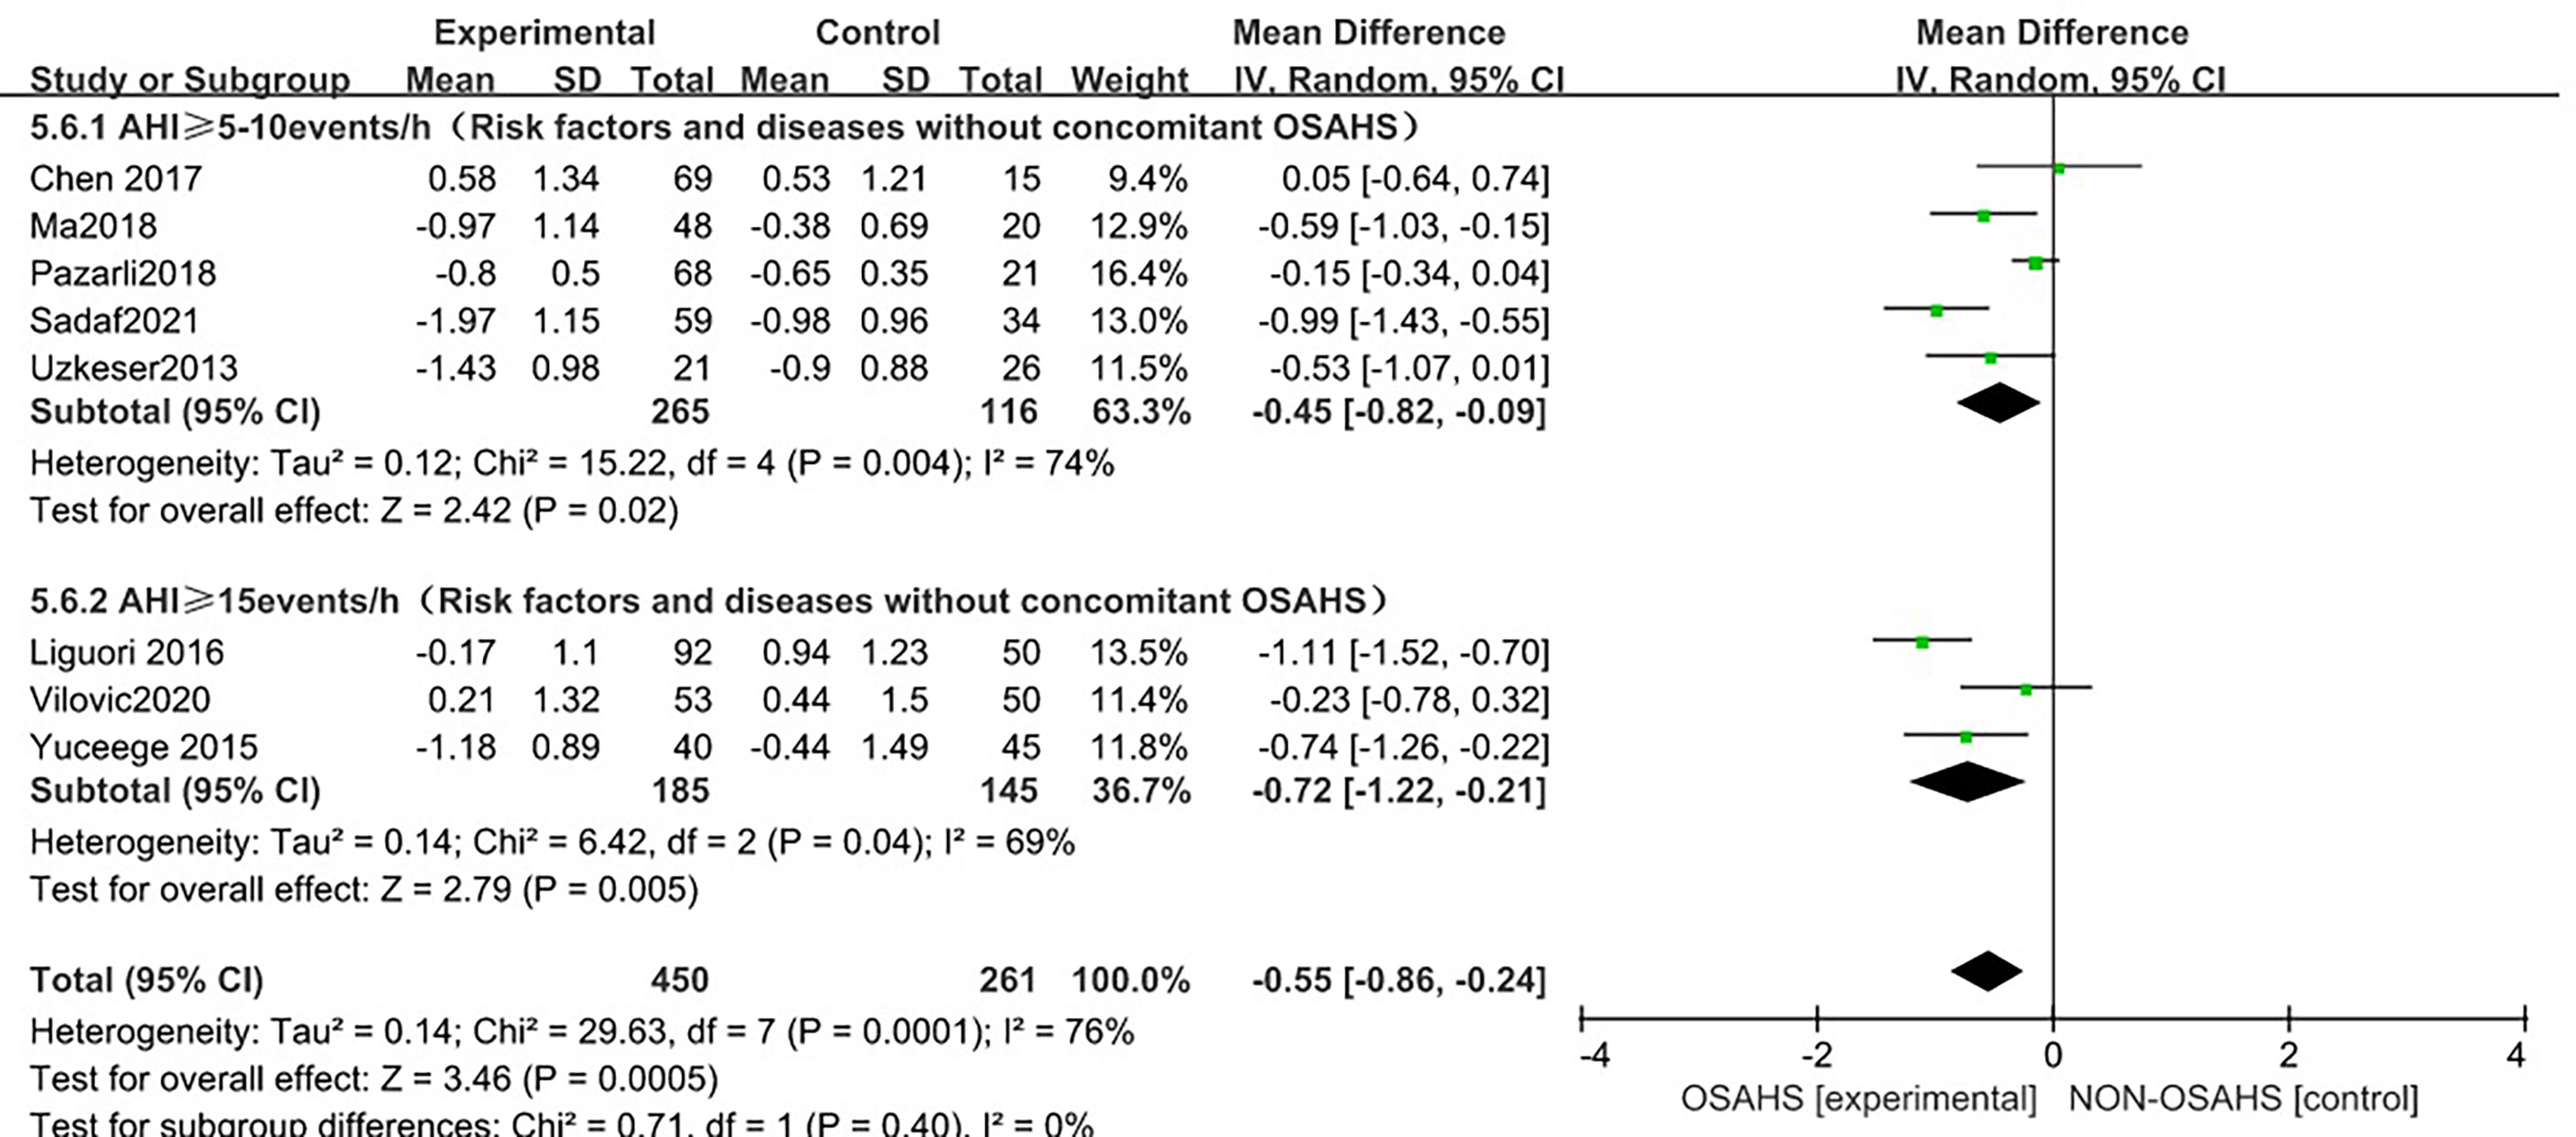
Figure 9 Forest plot of lumbar spine T-score “AHI grouping” subgroup analysis between OSAHS group and control group (grouped according to OSAHS diagnostic criteria, after exclusion of osteoporosis-related risk factors).
In the regional subgroup analysis (after the exclusion of osteoporosis-related risk factors), (Figure 10), 8 studies were included (3, 6, 15, 18, 20–23), and the combined group heterogeneity was (P = 0.0001, I2 = 76%), indicating a high degree of statistical heterogeneity. In the subgroup analysis, the grouping heterogeneity in East Asia was (P = 0.13, I2 = 57%), that in the Middle East was (P = 0.13, I2 = 57%). = 0.002, I2 = 80%), and that in Europe was (P = 0.01, I2 = 84%), so a random effect model was used; after the regional subgroup analysis, the heterogeneity of OSAHS and lumbar spine T-score correlation analysis was lower than before, among which the heterogeneity of East Asian grouping was reduced to moderate heterogeneity. The results of the subgroup analysis showed that, compared with the control group, the OSAHS group had a statistically significant difference in the Middle East group (MD = -0.58, 95% CI: -1.02~-0.13, Z = 2.53, P = 0.01); in the East Asian group (MD = -0.33, 95% CI: -0.94~0.29, Z = 1.04, P = 0.30), lumbar spine T-score was lower, but the difference was not statistically significant. In the Europe group (MD = -0.69, 95% CI: -1.55~0.17, Z = 1.57, P = 0.12), the lumbar spine T-score was lower, and the difference was also not statistically significant. The combined effect size of regional grouping (MD = -0.55, 95% CI: -0.86~-0.24, Z = 3.46, P < 0.001), the lumbar spine T-score of the OSAHS group was lower, After excluding the risk factors for osteoporosis, the results remained stable and the difference was statistically significant.
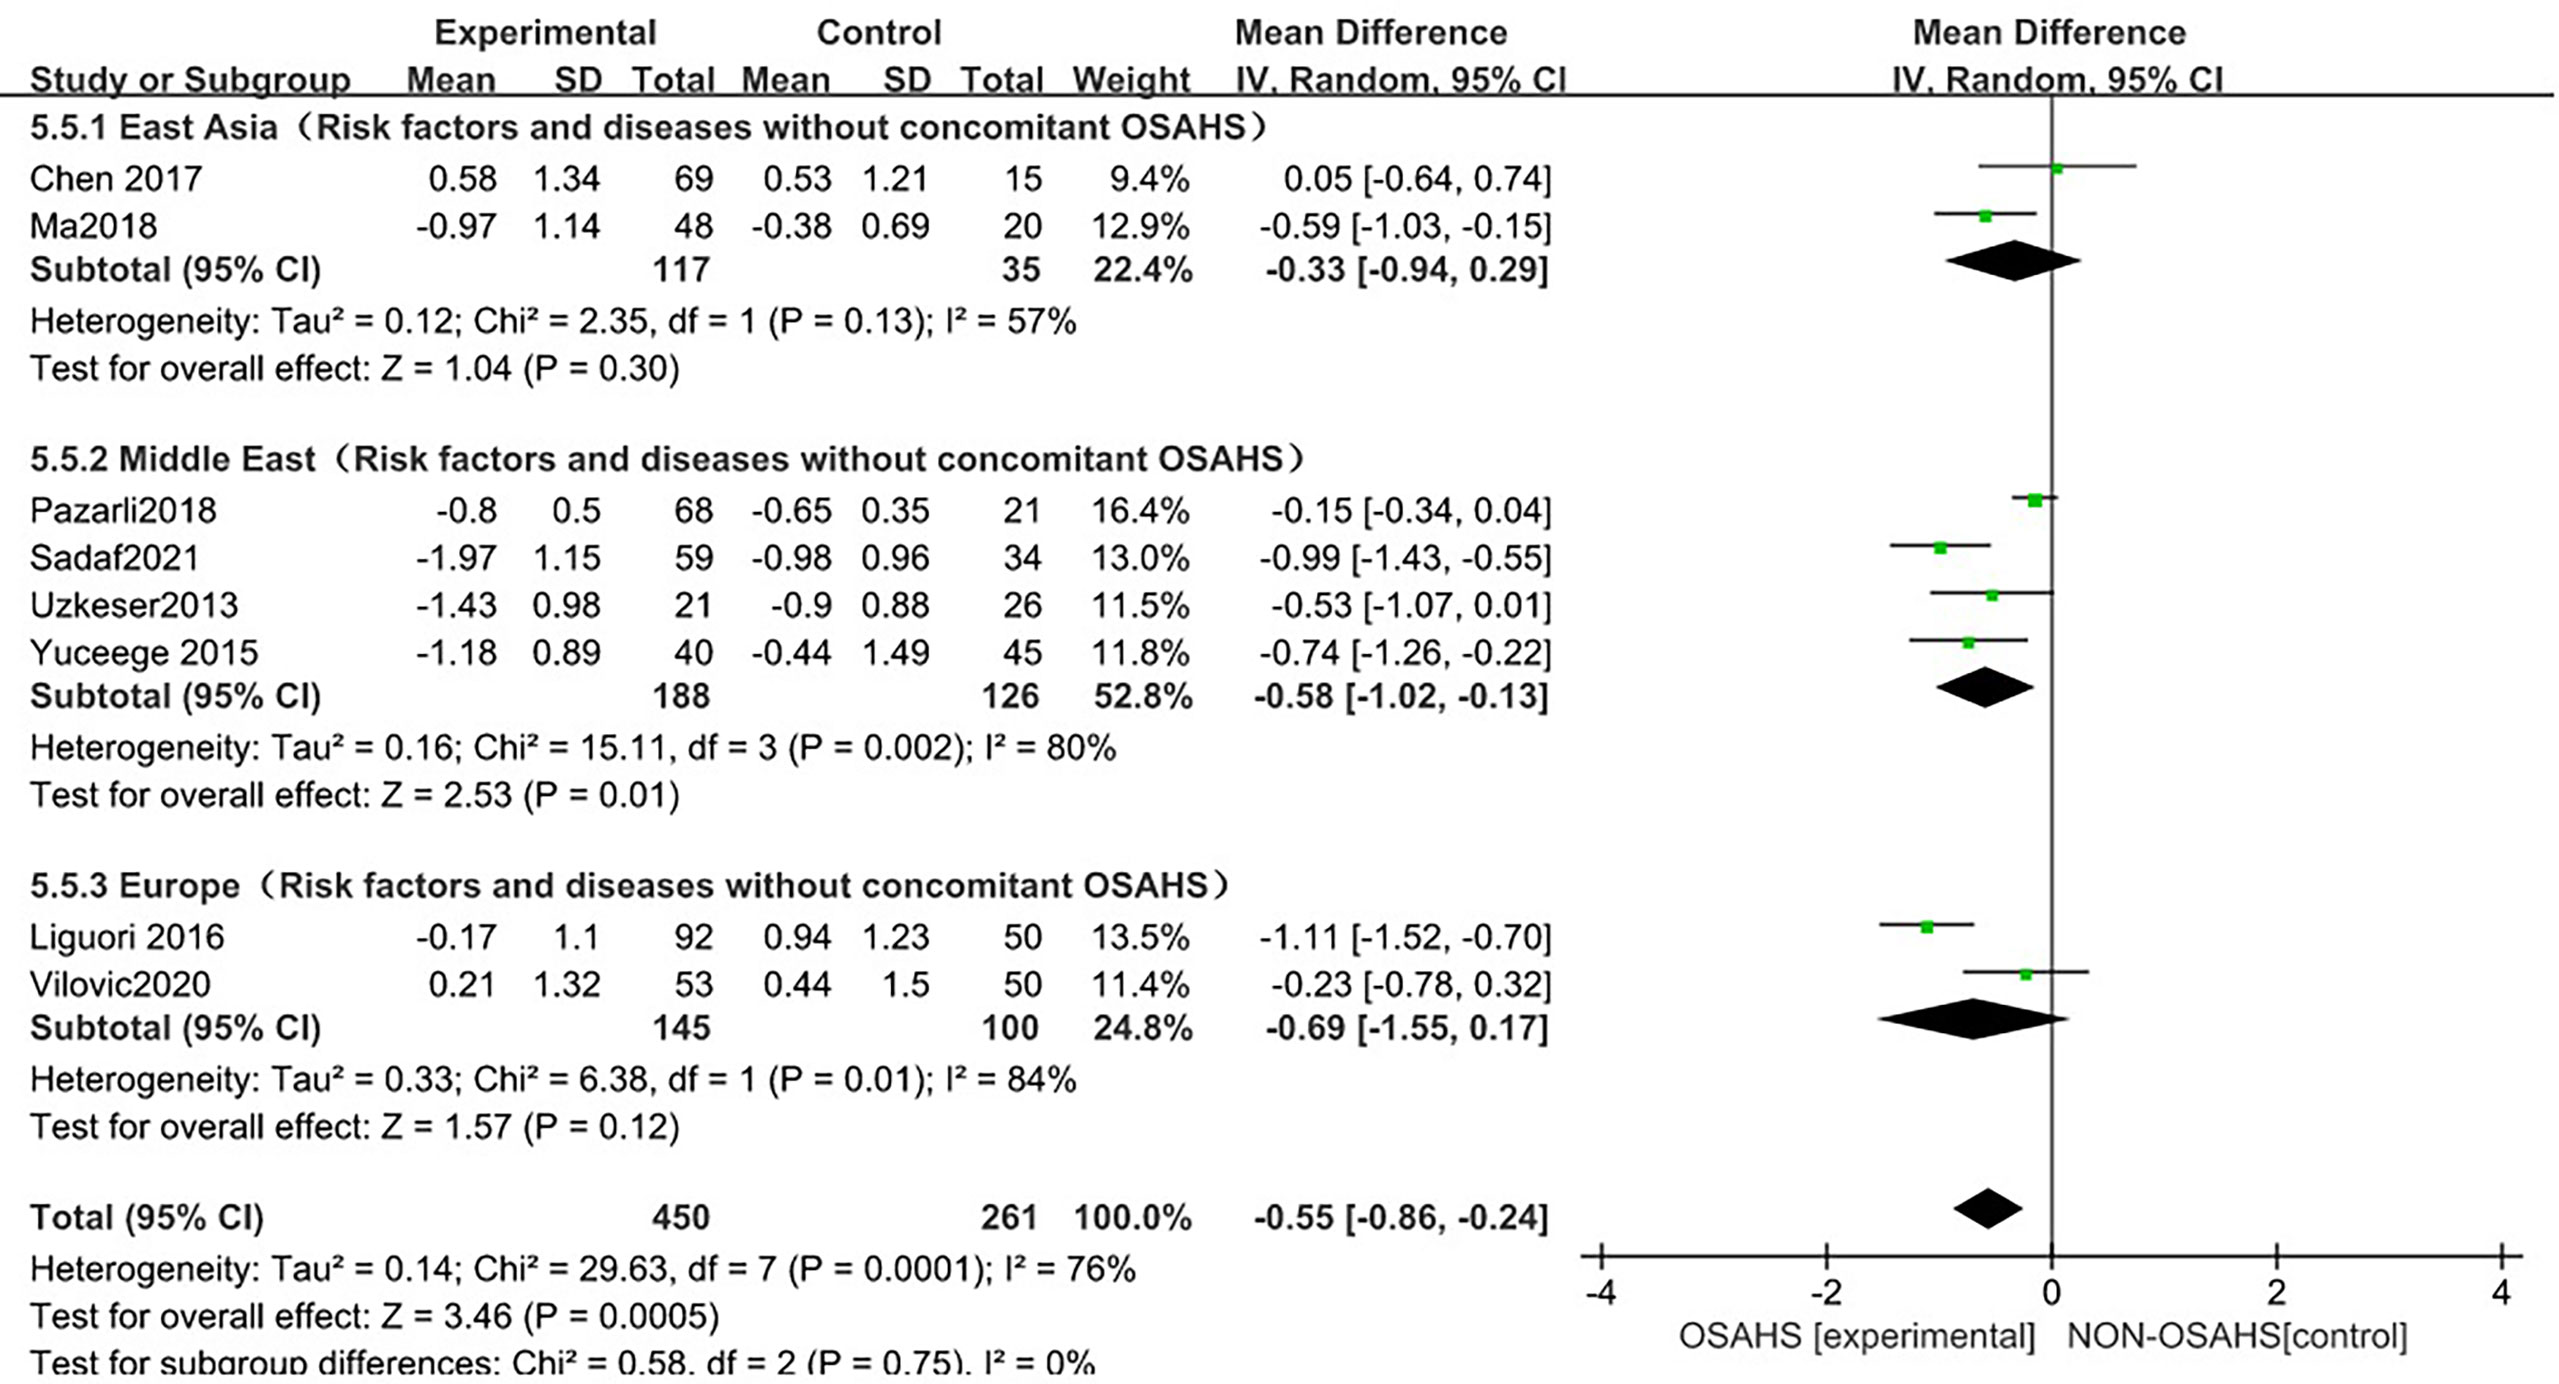
Figure 10 Forest plot of lumbar spine T-score “regional grouping” subgroup analysis between OSAHS group and control group (after excluding osteoporosis-related risk factors).
The forest plot analysis of OSAHS and lumbar spine T-score studies indicated that OSAHS is associated with lumbar spine T-score, OSAHS is a risk factor for lumbar spine T-score reduction, and the severity of OSAHS may be related to the lumbar spine T-score.
In this study, a sensitivity analysis was performed for the results with high heterogeneity. In the sensitivity analysis of the incidence of osteoporosis, lumbar bone mineral density, and lumbar spine T-score between OSAHS and the control group, the results and studies were combined after excluding any literature. There was no significant change in heterogeneity.
The presence of publication bias was assessed using Egger’s method (Figure 11). There were 3 literatures related to OSAHS and the incidence of osteoporosis in the control group, P = 0.291>0.05 (Figure 11A), and the results indicated that there was no publication bias; there were 10 literatures related to OSAHS and the bone mineral density of the lumbar spine in the control group, P = 0.433 >0.05 (Figure 11B), the results suggest that there is no publication bias. There are 10 related literatures about lumbar spine T-score between OSAHS and control group, P=0.042<0. 05 (Figure 11C), the results suggest that there is mild publication bias, there may be reasons:1.The number of literatures included in our meta-analysis is small, which is easy to cause certain bias.2. Some study populations combined with other diseases may also have certain biases, which was further confirmed by our subgroup analysis.
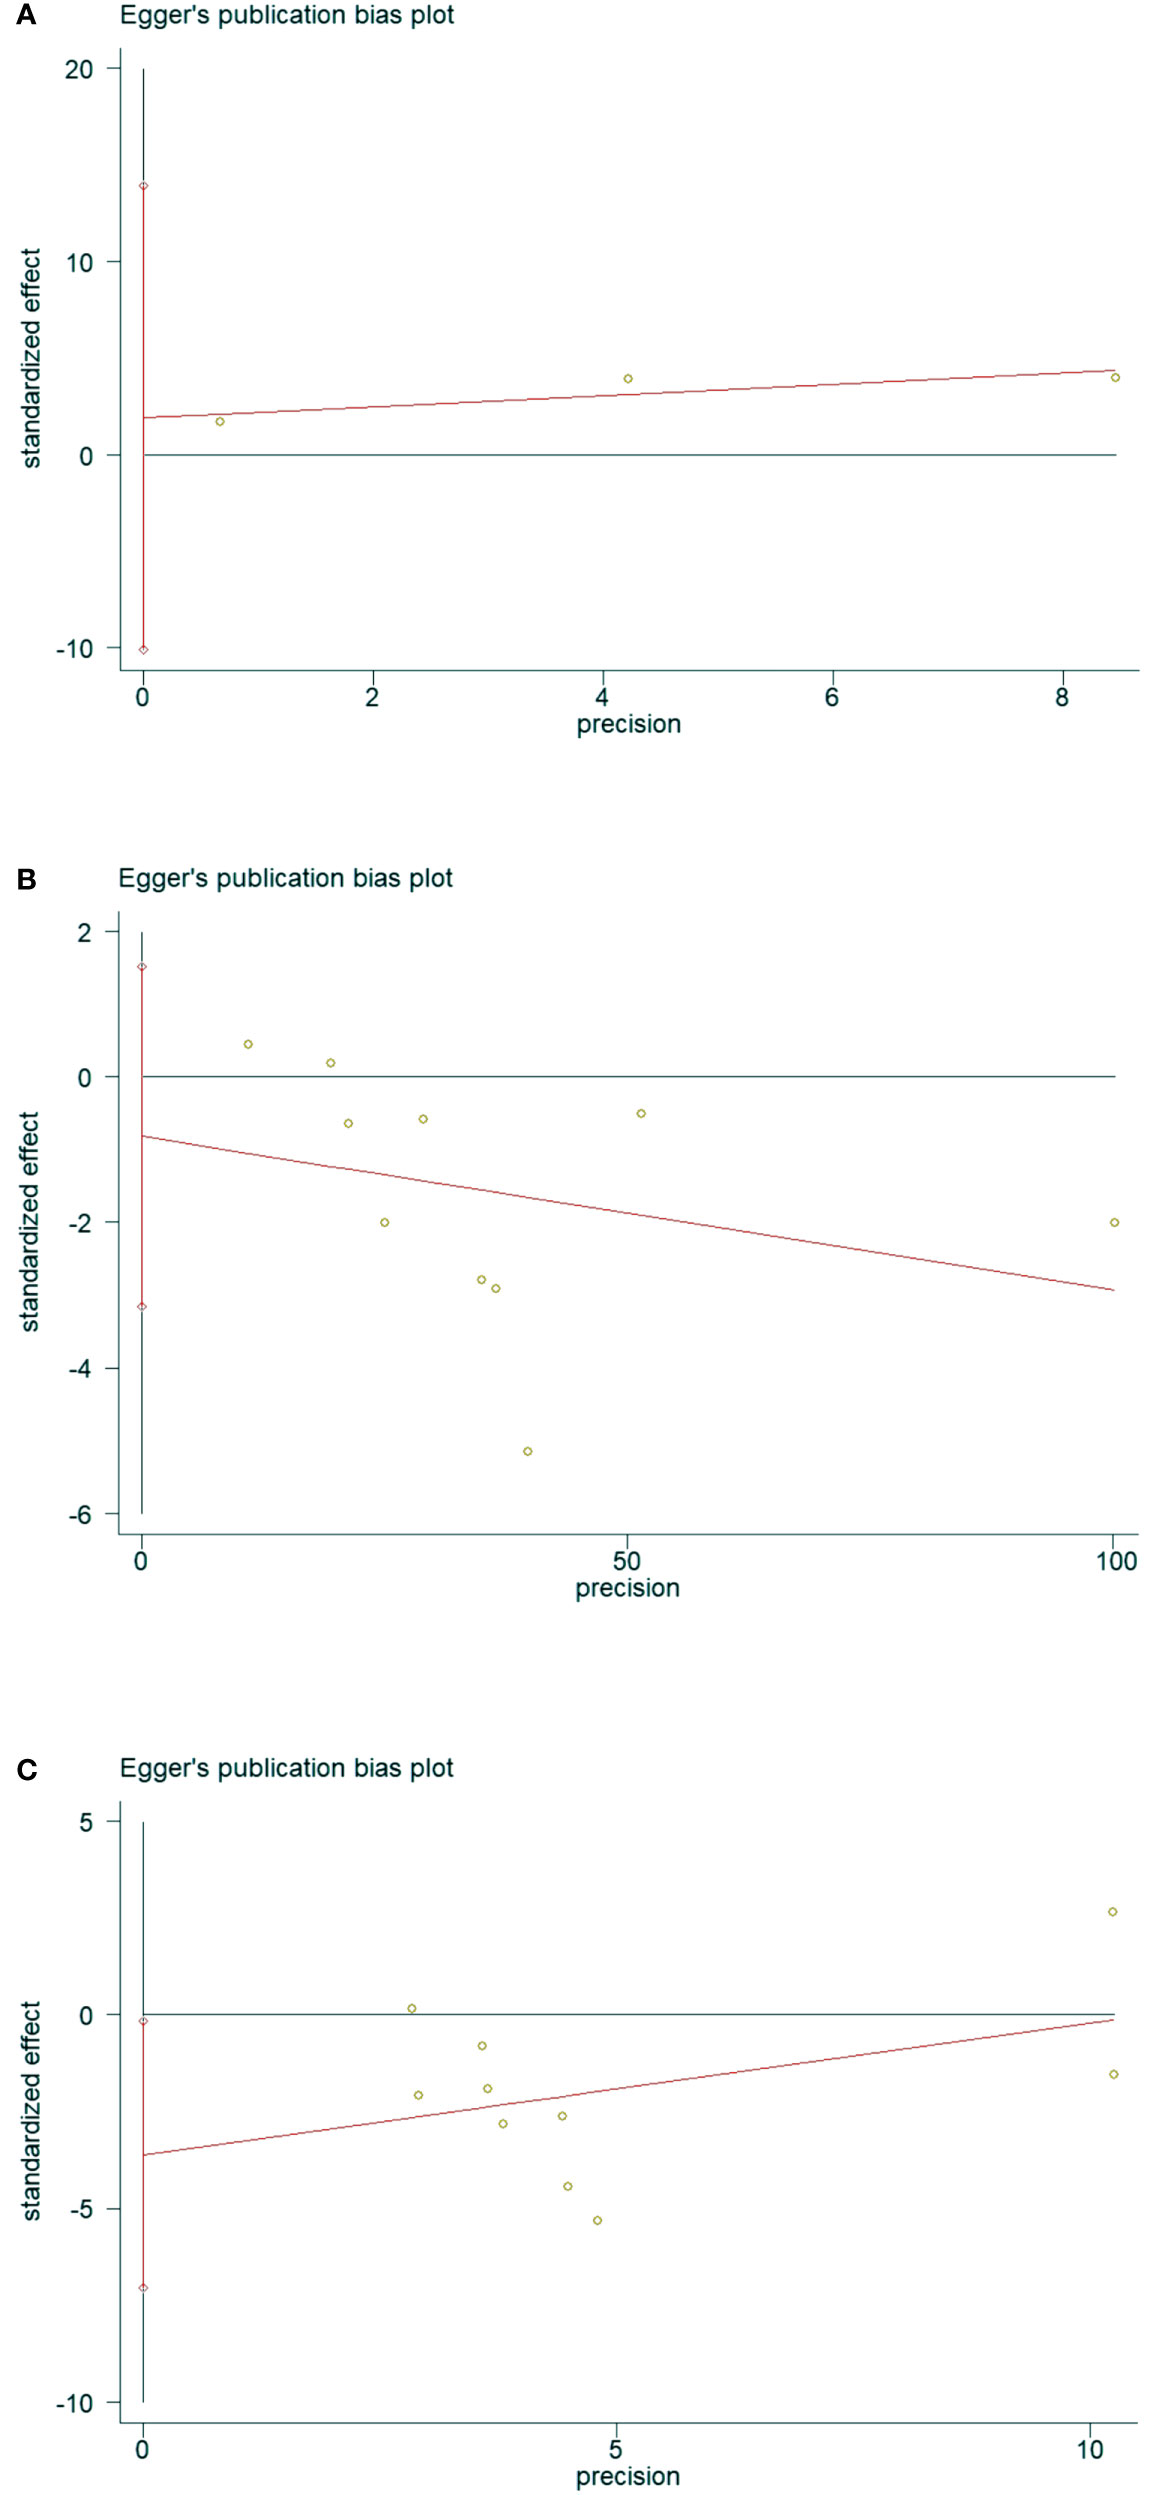
Figure 11 Data plot of Egger’s test for various studies included in the literature.(Note: (A) Data plot of Egger’s test for Osteoporosis incidence. (B) Data plot of Egger’s test for lumbar spine BMD. (C) Data plot of Egger’s test for lumbar spine T-score.).
Osteoporosis is a common human skeletal disease characterized by osteopenia, microarchitectural deterioration, and fragility fractures (28). According to World Health Organization (WHO) standards, it is estimated that 15% of postmenopausal Caucasian women in the United States and 35% of women over the age of 65 have significant osteoporosis. One in two Caucasian women will experience an osteoporotic fracture at some point in their life. As early as 1994, a study showed that fragility fracture patients received more than 400,000 hospitalizations and more than 2.5 million doctor visits each year, causing a serious economic burden (29). Tomiyama et al. (30) first reported the correlation between OSAHS and abnormal bone metabolism in 2008. They studied the abnormal bone metabolism of 50 OSAHS patients and found that compared with the control group, a marker of bone resorption (urinary Type I collagen cross-linked C-terminal peptide) was significantly increased in the OSAHS group, and the elevated bone resorption marker levels decreased somewhat after three months of continuous positive airway pressure therapy. Subsequently, experimental and epidemiological studies have continuously explored the relationship between OSAHS and osteoporosis, BMD, and T-score, and its possible mechanism, but the results have not agreed.
Sikarin,Wang et al. (31, 32) conducted a meta-analysis of the correlation between OSAHS and bone marrow.Too few studies were included in the Sikarin’s analysis, and Sensitivity analysis, meta-regression, and publication bias were not performed.Wang’s analysis is mainly based on the Chinese population, so the research objects may not be representative of the general population, and there may be selection bias. The two meta-analyses did not conduct a global multi-regional population study, nor did further analysis based on the severity of OASHS, and the analysis indicators were relatively single. Therefore, in response to these problems, we conducted an update of the meta-analysis of the correlation between OSAHS and bone marrow.
This meta-analysis included 15 studies. The included studies were all high-quality studies with 6 stars and above according to the NOS quality evaluation.The results of the meta-analysis on the correlation between OSAHS and osteoporosis showed that in males, females, middle-aged people (40~65 years old) and elderly people (> 65 years old), patients with OSAHS had osteoporosis. Although the incidence of osteoporosis is high, only three articles were included in the literature, so more research is needed to further stabilize the results; in addition, the study population included in the literature may have been combined with old age, hypertension, diabetes, cardiovascular disease, COPD, etc., which may have affected the osteoporosis risk factors, and there is currently no prevalence data to exclude the relevant risk factors; thus, further investigation and analysis cannot be carried out, and the results are not stable.
BMD is an important indicator reflecting bone mineral content per unit area. It is mainly used to detect the osteoporosis degree, predict the risk of fracture, and provide a strong laboratory test basis for fractures caused by osteoporosis. BMD is clinically the gold standard for the diagnosis of osteoporosis (33). In recent years, many studies have focused on the relationship between OSAHS and BMD. Tomiyama, Sforza, and Chen et al. (7, 18, 30) found that compared with the control group, OSAHS patients had significantly higher BMD levels; and more studies, including Liguori, Uzkeser, Yuceege, Terzi, Qiao, Pazarli, Ma, and Vilovic et al. (3, 6, 15, 16, 19–22) found that compared with the control group, the bone marrow of OSAHS patients was significantly higher than that of the control group. In order to further confirm the relationship between OSAHS patients and BMD, we conducted a meta-analysis of the correlation between OSAHS and lumbar spine BMD which showed that compared with the control group, the OSAHS group had lower lumbar spine BMD. After further subgroup analysis, the combined effect size still confirms that the OSAHS group has lower lumbar spine BMD compared with the control group. In the subgroup analysis of AHI grouping with OSAHS diagnostic criteria, compared with the control group, the lumbar spine BMD of the OSAHS AHI > 5~10 events/h group and AHI > 15 events/h group were decreased, and the difference was statistically significant. The effect size of lumbar spine BMD in the OSAHS diagnostic criteria AHI > 15 events/h group was higher than that of the OSAHS diagnostic criteria AHI > 5~10 events/h group. Compared with the AHI > 5~10 events/h group, the risk of lumbar spine BMD decline is higher, so the severity of lumbar spine BMD may be related. In the regional subgroup analysis (after excluding risk factors related to osteoporosis), the results showed that compared with the control group, the OSAHS group had lower lumbar spine BMD in the East Asian group, Middle East group, and Europe group, but the differences were not statistically significant. After subgroup analysis, the heterogeneity of the studies could be further reduced, and the research bias was also reduced, indicating that the conclusions of this study are more reliable.
Regarding the possible mechanism of the association between OSAHS and decreased BMD: 1. OSAHS may lead to a state of vitamin D deficiency and induce secondary hyperparathyroidism, which may lead to bone demineralization and decreased BMD (34); 2. Hypoxia is closely related to changes in bone turnover, and recent in vitro studies have shown that lower nighttime oxygen levels are a feature of OSAHS, while hypoxia promotes osteoclast formation and activity while inhibiting osteoblast function, thus determining bone resorption (35, 36).
The T-score is also an important basis for detecting the degree of osteoporosis. According to the results of BMD and the WHO standard, patients are divided into three groups: normal BMD (T-score > -1.0 SD), osteopenia (T-score -1.0 to -2.5 SD) and osteoporosis (T-score < -2.5 SD) (37). In recent years, many studies have focused on the relationship between OSAHS and lumbar spine T-score. Sforza, Chen et al. (7, 18) showed that compared with the control group, the lumbar spine T-score level of OSAHS patients was significantly higher; and more studies by Liguori, Uzkeser, Yuceege, Wang, Terzi, Qiao, Pazarli, Ma and Vilovic et al. (3, 6, 15–17, 20–23) showed that compared with the control group, the lumbar spine T-score level of OSAHS patients was significantly lower. In order to further confirm the relationship between OSAHS patients and lumbar spine T-score levels, we conducted a meta-analysis of the correlation between OSAHS and lumbar spine T-score levels which showed that compared with the control group, the OSAHS group had lower lumbar spine T-score levels. After excluding the related factors of osteoporosis, further subgroup analysis was performed, and the combined effect size still confirmed that the lumbar spine T-score level was lower in the OSAHS group compared with the control group.
In the subgroup analysis of AHI grouping with OSAHS diagnostic criteria (after excluding osteoporosis-related risk factors), compared with the control group, OSAHS diagnostic criteria AHI > 5~10 events/h group and AHI > 15 events/h group, the lumbar spine T-score of all groups decreased, and the difference was statistically significant. The effect size of the lumbar spine T-score in the OSAHS diagnostic criteria AHI > 15 events/h group was higher than that in the OSAHS diagnostic criteria AHI > 5~10 events/h group, and the risk of lumbar spine T-score decline was higher than that in the AHI > 5~10 events/h group, indicating that the severity of OSAHS may be related to the lumbar spine T-score. In the regional subgroup analysis (after excluding risk factors related to osteoporosis), the results showed that compared with the control group, the OSAHS group had lower lumbar spine BMD in the East Asian group, Middle East group, and Europe group, but only the Middle East subgroup was statistically significant. In conclusion, compared with the control group, the OSAHS group had lower lumbar spine T-score levels in the OSAHS diagnostic criteria AHI > 5~10 events/h group, AHI > 15 events/h group and Middle East group. The heterogeneity and research bias can be further reduced, indicating that the conclusions of this study are more reliable. At present, there is a lack of research that clearly clarifies the relationship between T-score and BMD and osteoporosis. However, because T-score is scored according to BMD, the possible mechanism of the correlation between OSAHS and T-score reduction can also be understood.
This study has certain limitations: first, the number of included studies on the relationship between OSAHS and osteoporosis was small, and combined with the related risk factors of osteoporosis, the results were not stable, so more research is needed to further stabilize the study. Second, the diagnostic methods and grading methods of OSAHS in each study were slightly different, and the study populations were from different ethnic groups, which may have led to greater heterogeneity in the results. Third, osteoporosis is more common in women (38), but there were fewer women OSAHS patients in our meta-analysis, which may have generated a selection bias. Fourth, the study sample size was relatively small compared to a large, multicentric, randomized controlled trial. Fifth, the quality of some included literature was not very high, and there may have been selection bias. Therefore, the conclusions should be interpreted with caution.
In conclusion, the results of this study suggest that OSAHS patients have a higher incidence of osteoporosis, and both lumbar spine BMD and lumbar spine T-score are reduced. The severity of AHI may be related to lumbar spine BMD and lumbar spine T-score. Understanding the incidence of osteoporosis in patients with OSAHS and the effect of OSAHS on lumbar spine BMD and T-score provides medical evidence. However, a homogeneous and large-scale prospective study with further adjustment for factors such as age and related diseases affecting osteoporosis is still needed to clarify whether OSAHS is a risk factor for osteoporosis and whether OSAHS has an effect on lumbar spine BMD and T-score. Many drugs have been developed to treat osteoporosis (39), and patients should receive treatment if they have osteoporosis, and should be treated with preventive measures if they have osteopenia. Obviously, prevention is much better than treatment. Through the meta-analysis of this paper, it can be concluded that the effective management of OSAHS can effectively reduce the risk of osteoporosis.
The raw data supporting the conclusions of this article will be made available by the authors, without undue reservation.
JHL, CW, ZPZ, ZZZ, XC and YZ are the guarantor of the manuscript and take responsibility for the content of this manuscript. JHL, QY, RC and CW contributed to the design of the study. HC, JZ, JYL and HZL were involved in the data analysis. ZPZ, JYL, HWL and RC contributed to the acquisition of primary data. ZPZ, CW and RC wrote the initial draft of the manuscript. QY, RC and JHL contributed significantly to the revision of the manuscript. All authors read and approved the final manuscript.
This study was funded by the Natural Science Foundation of Guangdong Province (2021A1515011373).
We would also like to thank Professor Nanshan Zhong from State Key Laboratory of Respiratory Disease for the constructive advice he gave.
The authors declare that the research was conducted in the absence of any commercial or financial relationships that could be construed as a potential conflict of interest.
All claims expressed in this article are solely those of the authors and do not necessarily represent those of their affiliated organizations, or those of the publisher, the editors and the reviewers. Any product that may be evaluated in this article, or claim that may be made by its manufacturer, is not guaranteed or endorsed by the publisher.
1. Young T, Peppard PE, Gottlieb DJ. Epidemiology of obstructive sleep apnea: a population health perspective. Am J Respir Crit Care Med (2002) 165:1217–39. doi: 10.1164/rccm.2109080
2. Guiglia R, Di Fede O, RL Lo, Sprini D, GB R, Campisi G. Osteoporosis, jawbones and periodontal disease. Med Oral Patol Oral Cir Bucal. (2013) 18:e93–9. doi: 10.4317/medoral.18298
3. Uzkeser H, Yildirim K, Aktan B, Karatay S, Kaynar H, Araz O, et al. Bone mineral density in patients with obstructive sleep apnea syndrome. SLEEP BREATH (2013) 17:339–42. doi: 10.1007/s11325-012-0698-y
4. Chen YL, Weng SF, Shen YC, Chou CW, Yang CY, Wang JJ, et al. Obstructive sleep apnea and risk of osteoporosis: a population-based cohort study in Taiwan. J Clin Endocrinol Metab (2014) 99:2441–7. doi: 10.1210/jc.2014-1718
5. Choi SB, Lyu IS, Lee W, Kim DW. Increased fragility fracture risk in Korean women who snore: a 10-year population-based prospective cohort study. BMC Musculoskelet Disord (2017) 18:236. doi: 10.1186/s12891-017-1587-0
6. Liguori C, Mercuri NB, Izzi F, Romigi A, Cordella A, Piccirilli E, et al. Obstructive sleep apnoea as a risk factor for osteopenia and osteoporosis in the male population. Eur Respir J (2016) 47:987–90. doi: 10.1183/13993003.01830-2015
7. Sforza E, Thomas T, Barthelemy JC, Collet P, Roche F. Obstructive sleep apnea is associated with preserved bone mineral density in healthy elderly subjects. SLEEP (2013) 36:1509–15. doi: 10.5665/sleep.3046
8. Stroup DF, Berlin JA, Morton SC, Olkin I, Williamson GD, Rennie D, et al. Meta-analysis of observational studies in epidemiology: A proposal for reporting. meta-analysis of observational studies in epidemiology (MOOSE) group. JAMA (2000) 283:2008–12. doi: 10.1001/jama.283.15.2008
9. Zhang X, Tan R, Lam WC, Yao L, Wang X, Cheng CW, et al. PRISMA (Preferred reporting items for systematic reviews and meta-analyses) extension for Chinese herbal medicines 2020 (PRISMA-CHM 2020). Am J Chin Med (2020) 48:1279–313. doi: 10.1142/S0192415X20500639
10. Thornton AT, Singh P, Ruehland WR, Rochford PD. AASM criteria for scoring respiratory events: interaction between apnea sensor and hypopnea definition. SLEEP (2012) 35:425–32. doi: 10.5665/sleep.1710
11. Kanis JA. Diagnosis of osteoporosis and assessment of fracture risk. LANCET (2002) 359:1929–36. doi: 10.1016/S0140-6736(02)08761-5
12. Stang A, Jonas S, Poole C. Case study in major quotation errors: a critical commentary on the Newcastle-Ottawa scale. Eur J EPIDEMIOL. (2018) 33:1025–31. doi: 10.1007/s10654-018-0443-3
13. Yen CM, Kuo CL, Lin MC, Lee CF, Lin KY, Lin CL, et al. Sleep disorders increase the risk of osteoporosis: a nationwide population-based cohort study. SLEEP Med (2014) 15:1339–44. doi: 10.1016/j.sleep.2014.07.005
14. Aslan SH, Yosunkaya S, Kiyici A, Sari O. Obstructive sleep apnea syndrome may be a risk factor for the development of osteoporosis in men at an early age? Türkiye Fiziksel Tip ve Rehabilitasyon Dergisi. (2015) 61:216–22. doi: 10.5152/tftrd.2015.59913
15. Yüceege M, Dülgerolu DE, Firat H, Yalcindag A. Can sleep apnea be a secondary cause of osteoporosis in young people? SLEEP Biol RHYTHMS (2015) 13:189–94. doi: 10.1111/sbr.12106
16. Terzi R, Yilmaz Z. Bone mineral density and changes in bone metabolism in patients with obstructive sleep apnea syndrome. J Bone MINER Metab (2016) 34:475–81. doi: 10.1007/s00774-015-0691-1
17. Wang TY, Lo YL, Chou PC, Chung FT, Lin SM, Lin TY, et al. Associated bone mineral density and obstructive sleep apnea in chronic obstructive pulmonary disease. Int J Chron Obstruct Pulmon Dis (2015) 10:231–7. doi: 10.2147/COPD.S72099
18. Chen DD, Huang JF, Lin QC, Chen GP, Zhao JM. Relationship between serum adiponectin and bone mineral density in male patients with obstructive sleep apnea syndrome. SLEEP BREATH. (2017) 21:557–64. doi: 10.1007/s11325-017-1492-7
19. Qiao Y, Wang B, Yang JJ, Fan YF, Guo Q, Dou ZJ, et al. Bone metabolic markers in patients with obstructive sleep apnea syndrome. Chin Med J (Engl) (2018) 131:1898–903. doi: 10.4103/0366-6999.238149
20. Pazarli AC, Ekiz T, Inonu KH. Association between 25-hydroxyvitamin d and bone mineral density in people with obstructive sleep apnea syndrome. J Clin DENSITOM. (2019) 22:39–46. doi: 10.1016/j.jocd.2018.10.001
21. Ma XR, Wang Y, Sun YC. Imbalance of osteoprotegerin/receptor activator of nuclear factor-kappaB ligand and oxidative stress in patients with obstructive sleep apnea-hypopnea syndrome. Chin Med J (Engl) (2019) 132:25–9. doi: 10.1097/CM9.0000000000000046
22. Vilovic M, Dogas Z, Ticinovic KT, Borovac JA, Supe-Domic D, Vilovic T, et al. Bone metabolism parameters and inactive matrix gla protein in patients with obstructive sleep apneadagger. SLEEP (2020) 43(3):zsz243. doi: 10.1093/sleep/zsz243
23. Sadaf S, Shameem M, Siddiqi SS, Anwar S, Mohd S. Effect of obstructive sleep apnea on bone mineral density. Turk Thorac J (2021) 22:301–10. doi: 10.5152/TurkThoracJ.2021.20051
24. Young T, Shahar E, Nieto FJ, Redline S, Newman AB, Gottlieb DJ, et al. Predictors of sleep-disordered breathing in community-dwelling adults: the sleep heart health study. Arch Intern Med (2002) 162:893–900. doi: 10.1001/archinte.162.8.893
25. Neikrug AB, Ancoli-Israel S. Sleep disorders in the older adult - a mini-review. GERONTOLOGY (2010) 56:181–9. doi: 10.1159/000236900
26. Eikermann M, Jordan AS, Chamberlin NL, Gautam S, Wellman A, Lo YL, et al. The influence of aging on pharyngeal collapsibility during sleep. CHEST (2007) 131:1702–9. doi: 10.1378/chest.06-2653
27. Mora S, Gilsanz V. Establishment of peak bone mass. Endocrinol Metab Clin North Am (2003) 32:39–63. doi: 10.1016/s0889-8529(02)00058-0
28. Melton LR. Epidemiology of spinal osteoporosis. Spine (Phila Pa 1976) (1997) 22:2S–11S. doi: 10.1097/00007632-199712151-00002
29. Alexeeva L, Burkhardt P, Christiansen C, Cooper C, Delmas P, Johnell O, et al. Assessment of fracture risk and its application to screening for postmenopausal osteoporosis. Report of a WHO study group. World Health Organ Tech Rep Ser (1994) 843:1–129.
30. Tomiyama H, Okazaki R, Inoue D, Ochiai H, Shiina K, Takata Y, et al. Link between obstructive sleep apnea and increased bone resorption in men. Osteoporos Int (2008) 19:1185–92. doi: 10.1007/s00198-007-0556-0
31. Upala S, Sanguankeo A, Congrete S. Association between obstructive sleep apnea and osteoporosis: A systematic review and meta-analysis. Int J Endocrinol Metab (2016) 14:e36317. doi: 10.5812/ijem.36317
32. Wang Y, Shen Q, Cheng Y, Zhang Y. A meta-analysis of association between obstructive sleep apnea-hypopnea syndrome and low bone mass in adults. Chin J Osteoporos (2021) 27(02):190–7. doi: 10.3969/j.issn.1006-7108.2021.02.006
33. Muller D, Pulm J, Gandjour A. Cost-effectiveness of different strategies for selecting and treating individuals at increased risk of osteoporosis or osteopenia: A systematic review. VALUE Health (2012) 15:284–98. doi: 10.1016/j.jval.2011.11.030
34. Liguori C, Romigi A, Izzi F, Mercuri NB, Cordella A, Tarquini E, et al. Continuous positive airway pressure treatment increases serum vitamin d levels in Male patients with obstructive sleep apnea. J Clin SLEEP Med (2015) 11:603–7. doi: 10.5664/jcsm.4766
35. Arnett TR, Gibbons DC, Utting JC, Orriss IR, Hoebertz A, Rosendaal M, et al. Hypoxia is a major stimulator of osteoclast formation and bone resorption. J Cell Physiol (2003) 196:2–8. doi: 10.1002/jcp.10321
36. Utting JC, Robins SP, Brandao-Burch A, Orriss IR, Behar J, Arnett TR. Hypoxia inhibits the growth, differentiation and bone-forming capacity of rat osteoblasts. Exp Cell Res (2006) 312:1693–702. doi: 10.1016/j.yexcr.2006.02.007
37. Orimo H, Hayashi Y, Fukunaga M, Sone T, Fujiwara S, Shiraki M, et al. Diagnostic criteria for primary osteoporosis: year 2000 revision. J Bone MINER Metab (2001) 19:331–7. doi: 10.1007/s007740170001
38. McClain JJ, Lewin DS, Laposky AD, Kahle L, Berrigan D. Associations between physical activity, sedentary time, sleep duration and daytime sleepiness in US adults. Prev Med (2014) 66:68–73. doi: 10.1016/j.ypmed.2014.06.003
Keywords: obstructive sleep apnea-hypopnea syndrome, meta-analysis, osteoporosis, bone density, lumbar spine
Citation: Wang C, Zhang Z, Zheng Z, Chen X, Zhang Y, Li C, Chen H, Liao H, Zhu J, Lin J, Liang H, Yu Q, Chen R and Liang J (2022) Relationship between obstructive sleep apnea-hypopnea syndrome and osteoporosis adults: A systematic review and meta-analysis. Front. Endocrinol. 13:1013771. doi: 10.3389/fendo.2022.1013771
Received: 07 August 2022; Accepted: 26 October 2022;
Published: 17 November 2022.
Edited by:
Giacomina Brunetti, University of Bari Aldo Moro, ItalyCopyright © 2022 Wang, Zhang, Zheng, Chen, Zhang, Li, Chen, Liao, Zhu, Lin, Liang, Yu, Chen and Liang. This is an open-access article distributed under the terms of the Creative Commons Attribution License (CC BY). The use, distribution or reproduction in other forums is permitted, provided the original author(s) and the copyright owner(s) are credited and that the original publication in this journal is cited, in accordance with accepted academic practice. No use, distribution or reproduction is permitted which does not comply with these terms.
*Correspondence: Qiuying Yu, eXVxaXV5aW5nMTMxQDE2My5jb20=; Riken Chen, Y2hlbnJpa2VuQDEyNi5jb20=; Jinhua Liang, ODE0NDYwNjlAcXEuY29t
†These authors have contributed equally to this work
Disclaimer: All claims expressed in this article are solely those of the authors and do not necessarily represent those of their affiliated organizations, or those of the publisher, the editors and the reviewers. Any product that may be evaluated in this article or claim that may be made by its manufacturer is not guaranteed or endorsed by the publisher.
Research integrity at Frontiers
Learn more about the work of our research integrity team to safeguard the quality of each article we publish.