 Li Li†
 Xiantong Zou
 Xianghai Zhou
 Linong Ji
- Department of Endocrinology and Metabolism, Peking University People’s Hospital, Beijing, China
Background: The difference in the relationship between β-cell function and insulin resistance among Africans, Caucasians and East Asians with normal glucose tolerance (NGT) was not well investigated.
Methods: We searched PubMed and Web of Science with keywords and identified studies that used the homeostasis model assessment (HOMA) model to evaluate β-cell function (HOMA-B) and insulin sensitivity/resistance (HOMA-S/HOMA-IR) in certain ethnic groups. We used random-effect model to pool data of HOMAs and compared the combined data among the three ethnic groups using subgroup analysis. Linear regression analysis was used to estimate the coefficient of HOMA-S on HOMA-B in these ethnic groups.
Results: We evaluated pooled data of HOMAs in eight African, 26 Caucasian, and 84 East Asian cohorts with NGT, and also 2,392, 6,645 and 67,317 individuals, respectively. The three ethnic groups had distinct HOMA-B but similar HOMA-IR. The regression coefficient of lnHOMA-B on lnHOMA-S was different between Africans and Caucasians (−1.126 vs −0.401, P = 0.0006) or East Asian (−1.126 vs −0.586, P = 0.0087), but similar between Caucasians and East Asians (−0.401 vs −0.586, P = 0.1282). The coefficient in all ethnic groups was similar when age, BMI, and gender were adjusted (African vs Caucasian P = 0.0885, African vs East Asian P = 0.1092, and Caucasian vs East Asian P = 0.6298).
Conclusions: In subjects with NGT, East Asians had lower HOMA-B but similar β-cell response relative to insulin resistance with Caucasians and Africans when age, BMI, and gender were controlled. This result may challenge the allegation that there was an Asian-specific diabetes phenotype with worse β-cell function.
Introduction
The latest atlas of the International Diabetes Federation (IDF) indicated that there were 162.6 million people with diabetes in the Western Pacific Region in 2019, which was 35% of the world’s total number of adults with diabetes, ranking the first among all regions (1). ‘Asian type diabetes’ was proposed since Asian people with diabetes had earlier age-of-onset, lower BMI, and some unique susceptible genetic loci related to diabetes (2, 3) compared with non-Asian counterparts. Studies suggested that East Asians, either with or without diabetes, had poor β-cell function than other ethnicities, either assessed by oral glucose tolerance test (OGTT) or by frequently sampled intravenous glucose tolerance tests (FSIGT) (4–7). Compared with Caucasians, Asian subjects with normal glucose tolerance (NGT), pre-diabetes or diabetes all had lower insulin secretion post 75-g glucose challenge (8). Nevertheless, despite ‘worse’ β-cell function, East Asians are less resistant to insulin (6) and have relatively lower BMI (9). It was well established that the relationship between β-cell function and insulin sensitivity was linked through a negative feedback loop (10–12). Bergman et al. first proposed a hyperbolic function could characterize this relationship: the product of β-cell response and insulin sensitivity was a constant (13), and Kahn et al. verified it by using regression analysis with log transformation: log (insulin secretion) = constant − log (insulin sensitivity) (14). An ideal equation may have a coefficient of log (insulin sensitivity) close to −1 (11, 14). The β-cell function in East Asians may be underestimated without considering their insulin sensitivity.
Whether East Asians had poor insulin secretion response to insulin resistance was largely unknown until Kodama et al. pooled the data of FSIGT to evaluate the relationship between insulin sensitivity and β-cell function in different ethnicities (7). They reported ethnic differences in the optimal points in the canalization of normal blood glucose levels, and speculated that East Asians were more susceptible to diabetes, and a small change in insulin resistance may lead to drastic variations in their β-cell function (7). However, the studies referenced by Kodama et al. were all FISIGT studies with small sample sizes, especially in East Asians, possibly due to the inconvenience of sampling. This study aimed to investigate the ethical difference in the relationship between β-cell function and insulin resistance with the homeostasis assessment (HOMA) model calculated from fasting glucose and insulin levels (15) in subjects with NGT in large-scale epidemiological studies.
Methods
The Preferred Reporting Items for Systematic reviews and Meta-Analyses (PRISMA) was used as guidance for our meta-analysis (16).
Study Selection
In this meta-analysis, studies met the following inclusion criteria: 1) age of study subjects ≥18 years; 2) β-cell function and insulin resistance (or insulin sensitivity) were measured by HOMA method (15) or HOMA-2 calculator provided on the Oxford website (https://www.dtu.ox.ac.uk/homacalculator/download.php); 3) data of HOMAs can be extracted by different ethnic groups in participants with normal glucose tolerance (NGT). Studies were excluded when subjects had other diseases influencing glycemic control or anti-glycemic therapy, baseline information was unavailable, or HOMAs were miscalculated using wrong formula.
Data Sources and Searches
We searched PubMed for studies that used the HOMA model to measure β-cell function and insulin resistance (or insulin sensitivity) before February 2020. The strategy was performed using the following terms: [“HOMA-β” AND (“HOMA-IS” OR “HOMA-IR” OR “Caucasian” OR “African” OR “Chinese” OR “Japanese” OR “Korean”)] OR [“β-cell function” AND (“HOMA-IS” OR “HOMA-IR” OR “Caucasian” OR “African” OR “Chinese” OR “Japanese” OR “Korean”)]. We also reviewed the reference lists and supplementary material of eligible publications and manually searched literature on Web of Science (https://apps-webofknowledge-com./). The language of the articles was restricted to English. We contacted original authors by sending e-mails if necessary. Two review authors independently extracted data from each publication, and disagreements or discrepancies were resolved by discussion.
Data Extraction and Quality Assessment
We extracted the following data from each publication using a unified form: publication information (first author, year and PMID); sample size of the study population; study subjects’ mean age, BMI, HOMA-B, and HOMA-IR (or HOMA-S, which is the reciprocal of HOMA-IR). We chose the most detailed study from its duplicates.
We used the modified Newcastle-Ottawa Scale (MNOS), which was developed to assess the quality of non-randomized studies in meta-analysis (http://www.ohri.ca/programs/clinical_epidemiology/oxford.asp), to assess the quality of included studies based on three items: study selection (e.g., representativeness of the cohort and purity of ethnic groups), confounding factors and measurement of HOMAs. We grade all studies and defined studies obtaining eight or nine points as high quality, seven points as medium, and ≤six points as poor on a scale of zero to nine points (7).
Data Synthesis and Analysis
To unify data types of presented HOMA values, we transformed median- (range interquartile) into meta-analytic mean-(standard deviation) using methods proposed by Wan et al. (17) and Luo et al. (18) (both available on http://www.math.hkbu.edu.hk/~tongt/papers/median2mean.html). We pooled mean values of HOMA-B, HOMA-IR (or HOMA-IS), BMI, and age in three ethnic groups using the random-effect model (19). Subgroup analyses were performed to pool and compare data of HOMAs among different ethnic groups by random-effect model, and sensitivity analysis was performed to assess the robustness of results (20). The heterogeneity among studies was estimated by I2 statistics (21). Results were presented as mean (95% CI). HOMA-B and HOMA-S were plotted against each other, and the hyperbolic curve was fitted. Liner regression of ln-transformed HOMAs was used to evaluate the relationship between HOMA-B and HOMA-S (14, 22, 23). The regression coefficients among subgroups in crude or adjusted with confounders, e.g., BMI, age and male percentage, were compared using the Wald test. All statistical analysis was performed with the Stata statistical software package (version 16.0), and P < 0.05 was considered to be statistically significant.
Results
We searched on PubMed using keywords and obtained 1,882 original articles, of which 1,509 were excluded because of study subjects’ characteristics (e.g., age <18 or from other ethnicities), inadequate HOMA analysis (e.g., only measuring HOMA-B), and other situations (e.g., duplication study or full article unavailable). We reviewed the ones left and further excluded studies: 1) study subjects had unclassified glucose tolerance, 2) study subjects had other diseases or took medications that influence glycemic control, or 3) studies used wrong equation to calculate HOMAs. Eventually, 118 cohorts with normal glucose tolerance containing three ethnic groups were identified: eight African, 26 Caucasian, and 84 East Asian cohorts comprised of 2,392, 6,645, and 67,317 individuals, respectively. The selection process was summarized in Figure 1. The MNOS assessment showed that six African cohorts had high quality (maximum nine points), and the other two cohorts had low quality (obtaining only five or six points); of the 26 Caucasian cohorts, 22 had high quality (eight cohorts got nine points and 14 got eight points) and the other four cohorts had medium quality; of the 84 East Asian cohorts, 74 had high quality (34 got nine points and 40 got eight points), nine had medium quality and the left one had low quality (six points).
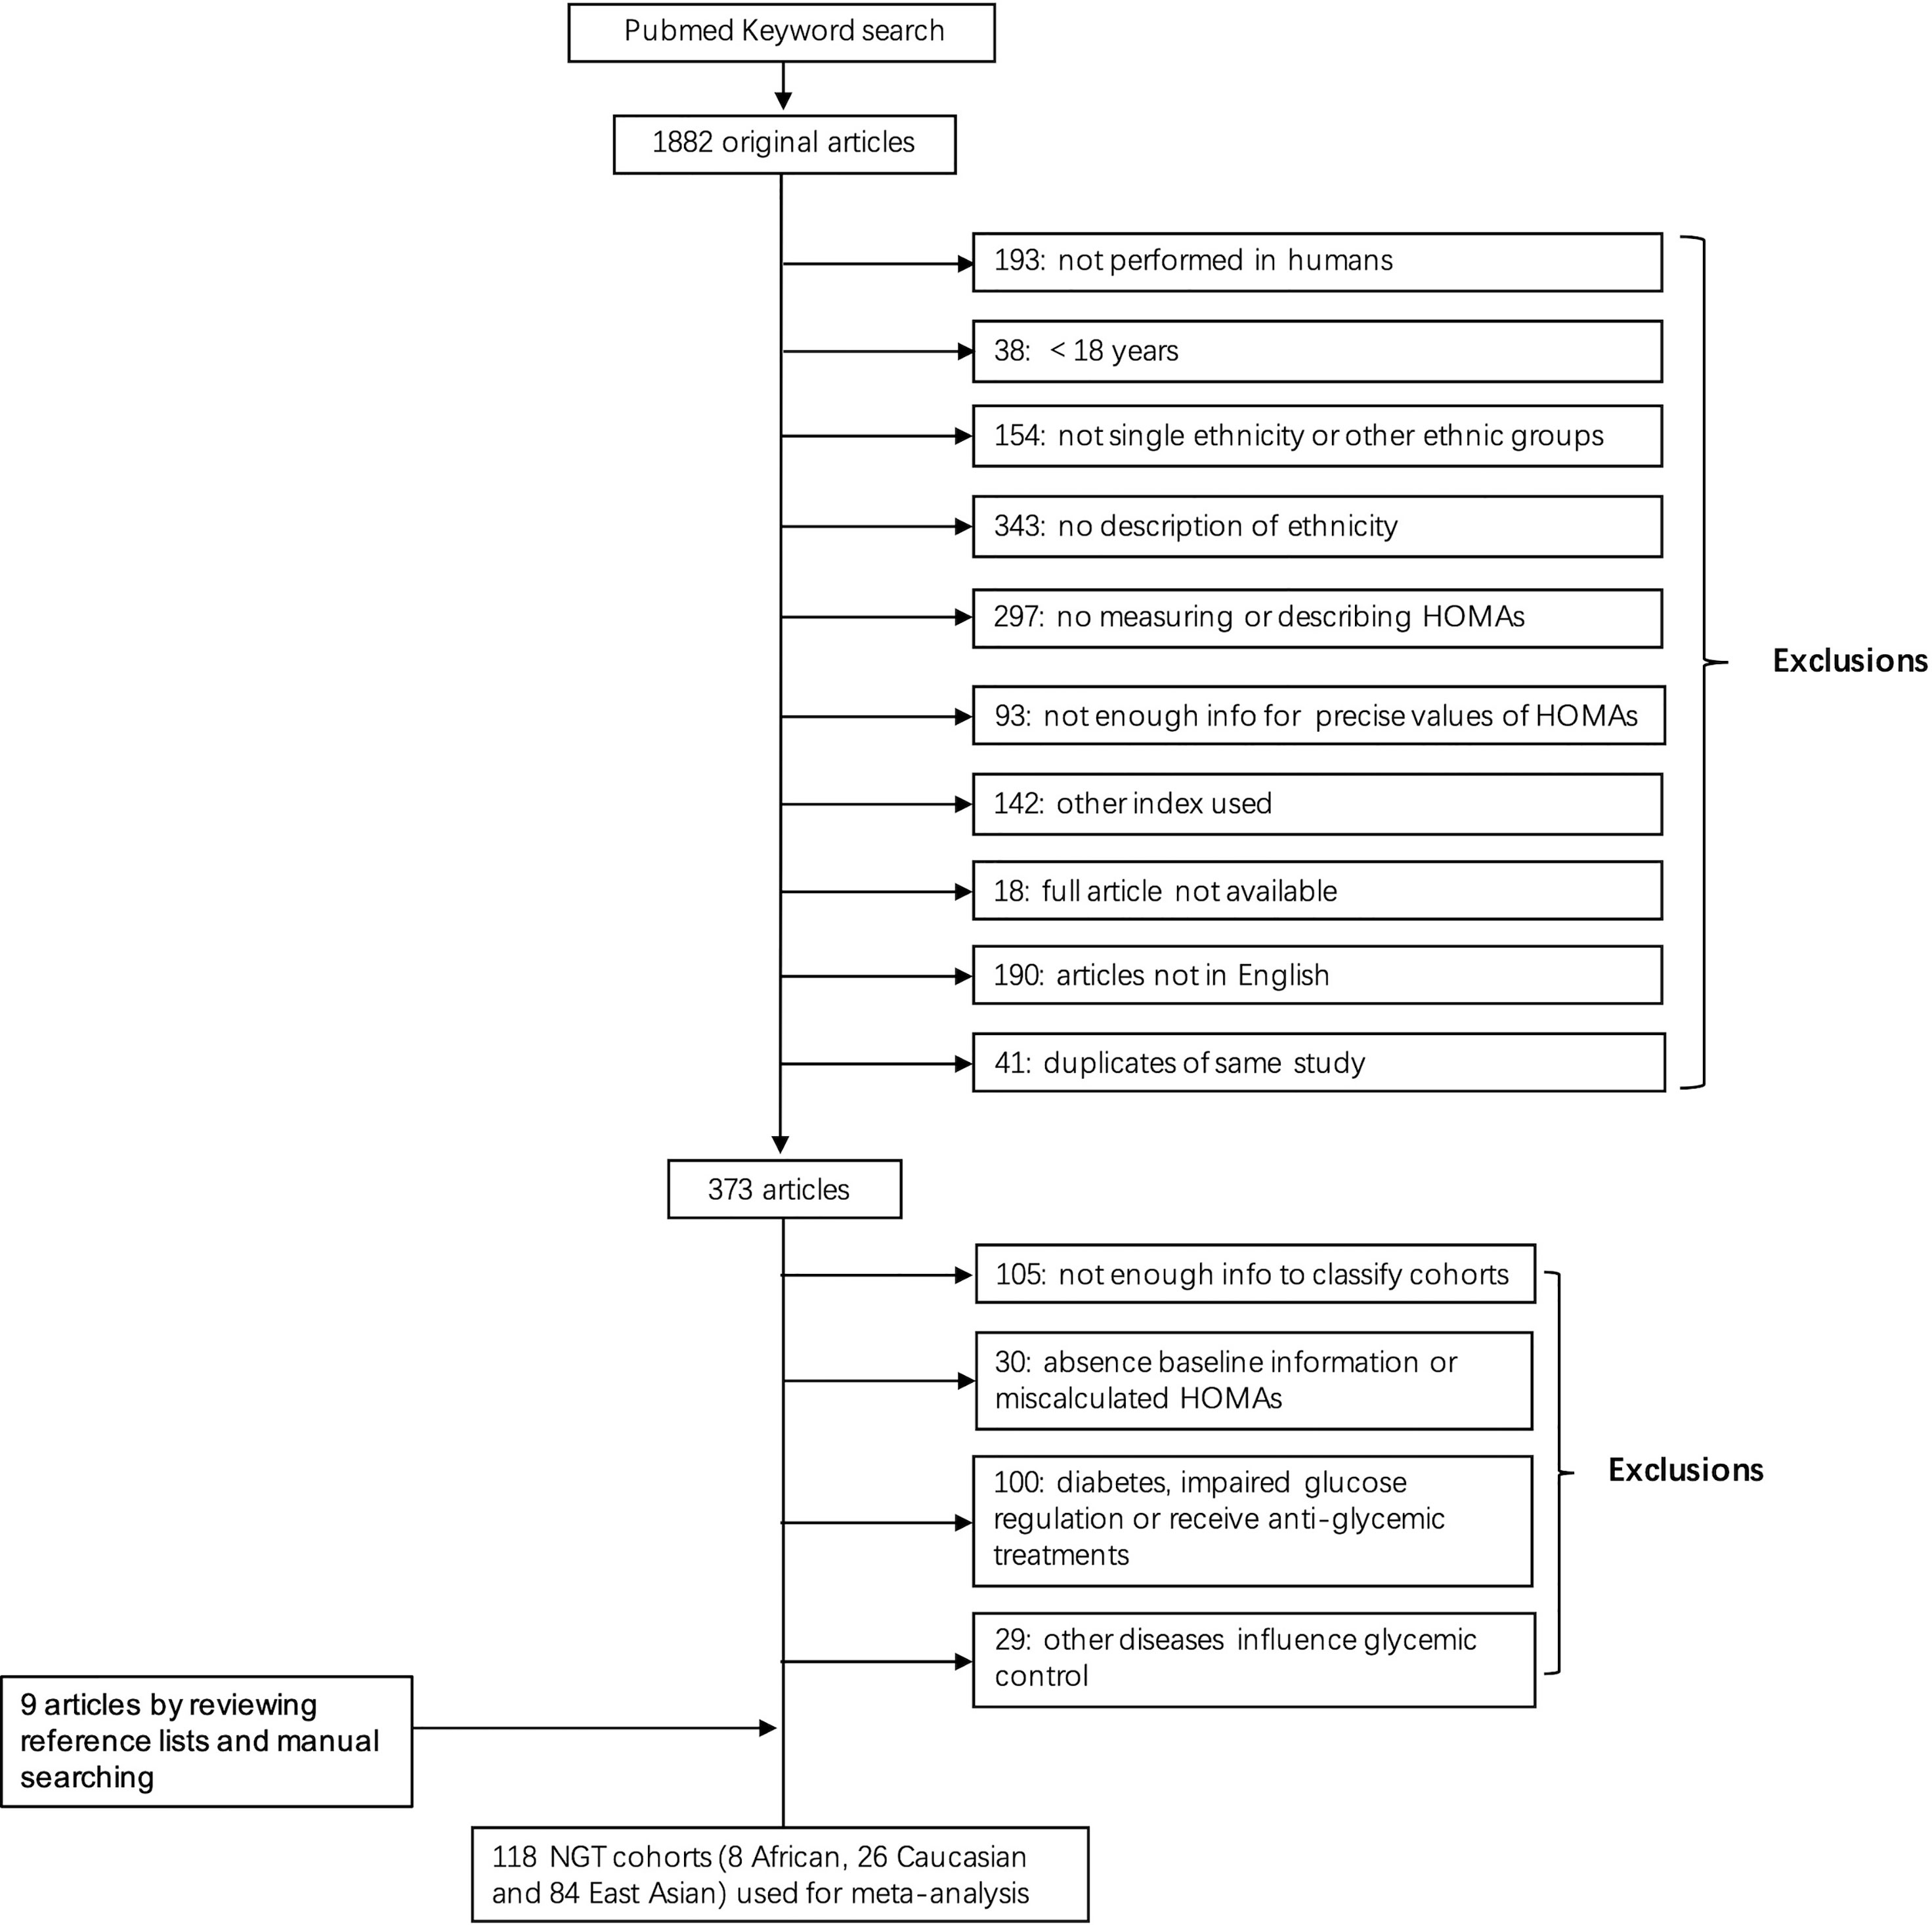
Figure 1 Flow diagram of literature search and cohort identification.
Mean age, BMI, HOMA-B, and HOMA-IR were pooled and compared among the three ethnic groups. East Asians were older with lower BMI than the other two groups. Caucasians had higher HOMA-B than Asians, as indicated by the 95% CI (Table 1). Subgroup analysis showed that three ethnic groups had significance in HOMA-B (P = 0.0008) but not in HOMA-IR (P = 0.1770) (Table 1 and Supplementary Figure S1).

Table 1 Ethnic characteristics of pooled data in NGT population.
We plotted the mean values of HOMA-B against HOMA-S in the NGT (healthy) cohorts in the three ethnicities. We fitted the HOMA-B and HOMA-S in a hyperbolic curve [ln (HOMA-B) = −0.626 ln (HOMA-S) + 4.399]. Most cohorts clustered and located around the center of the hyperbola, especially those with large sample sizes. Some East Asian cohorts with small sample sizes were distributed at both ends and a few African cohorts with small sample sizes were located at the upper end of the curve (Figure 2).
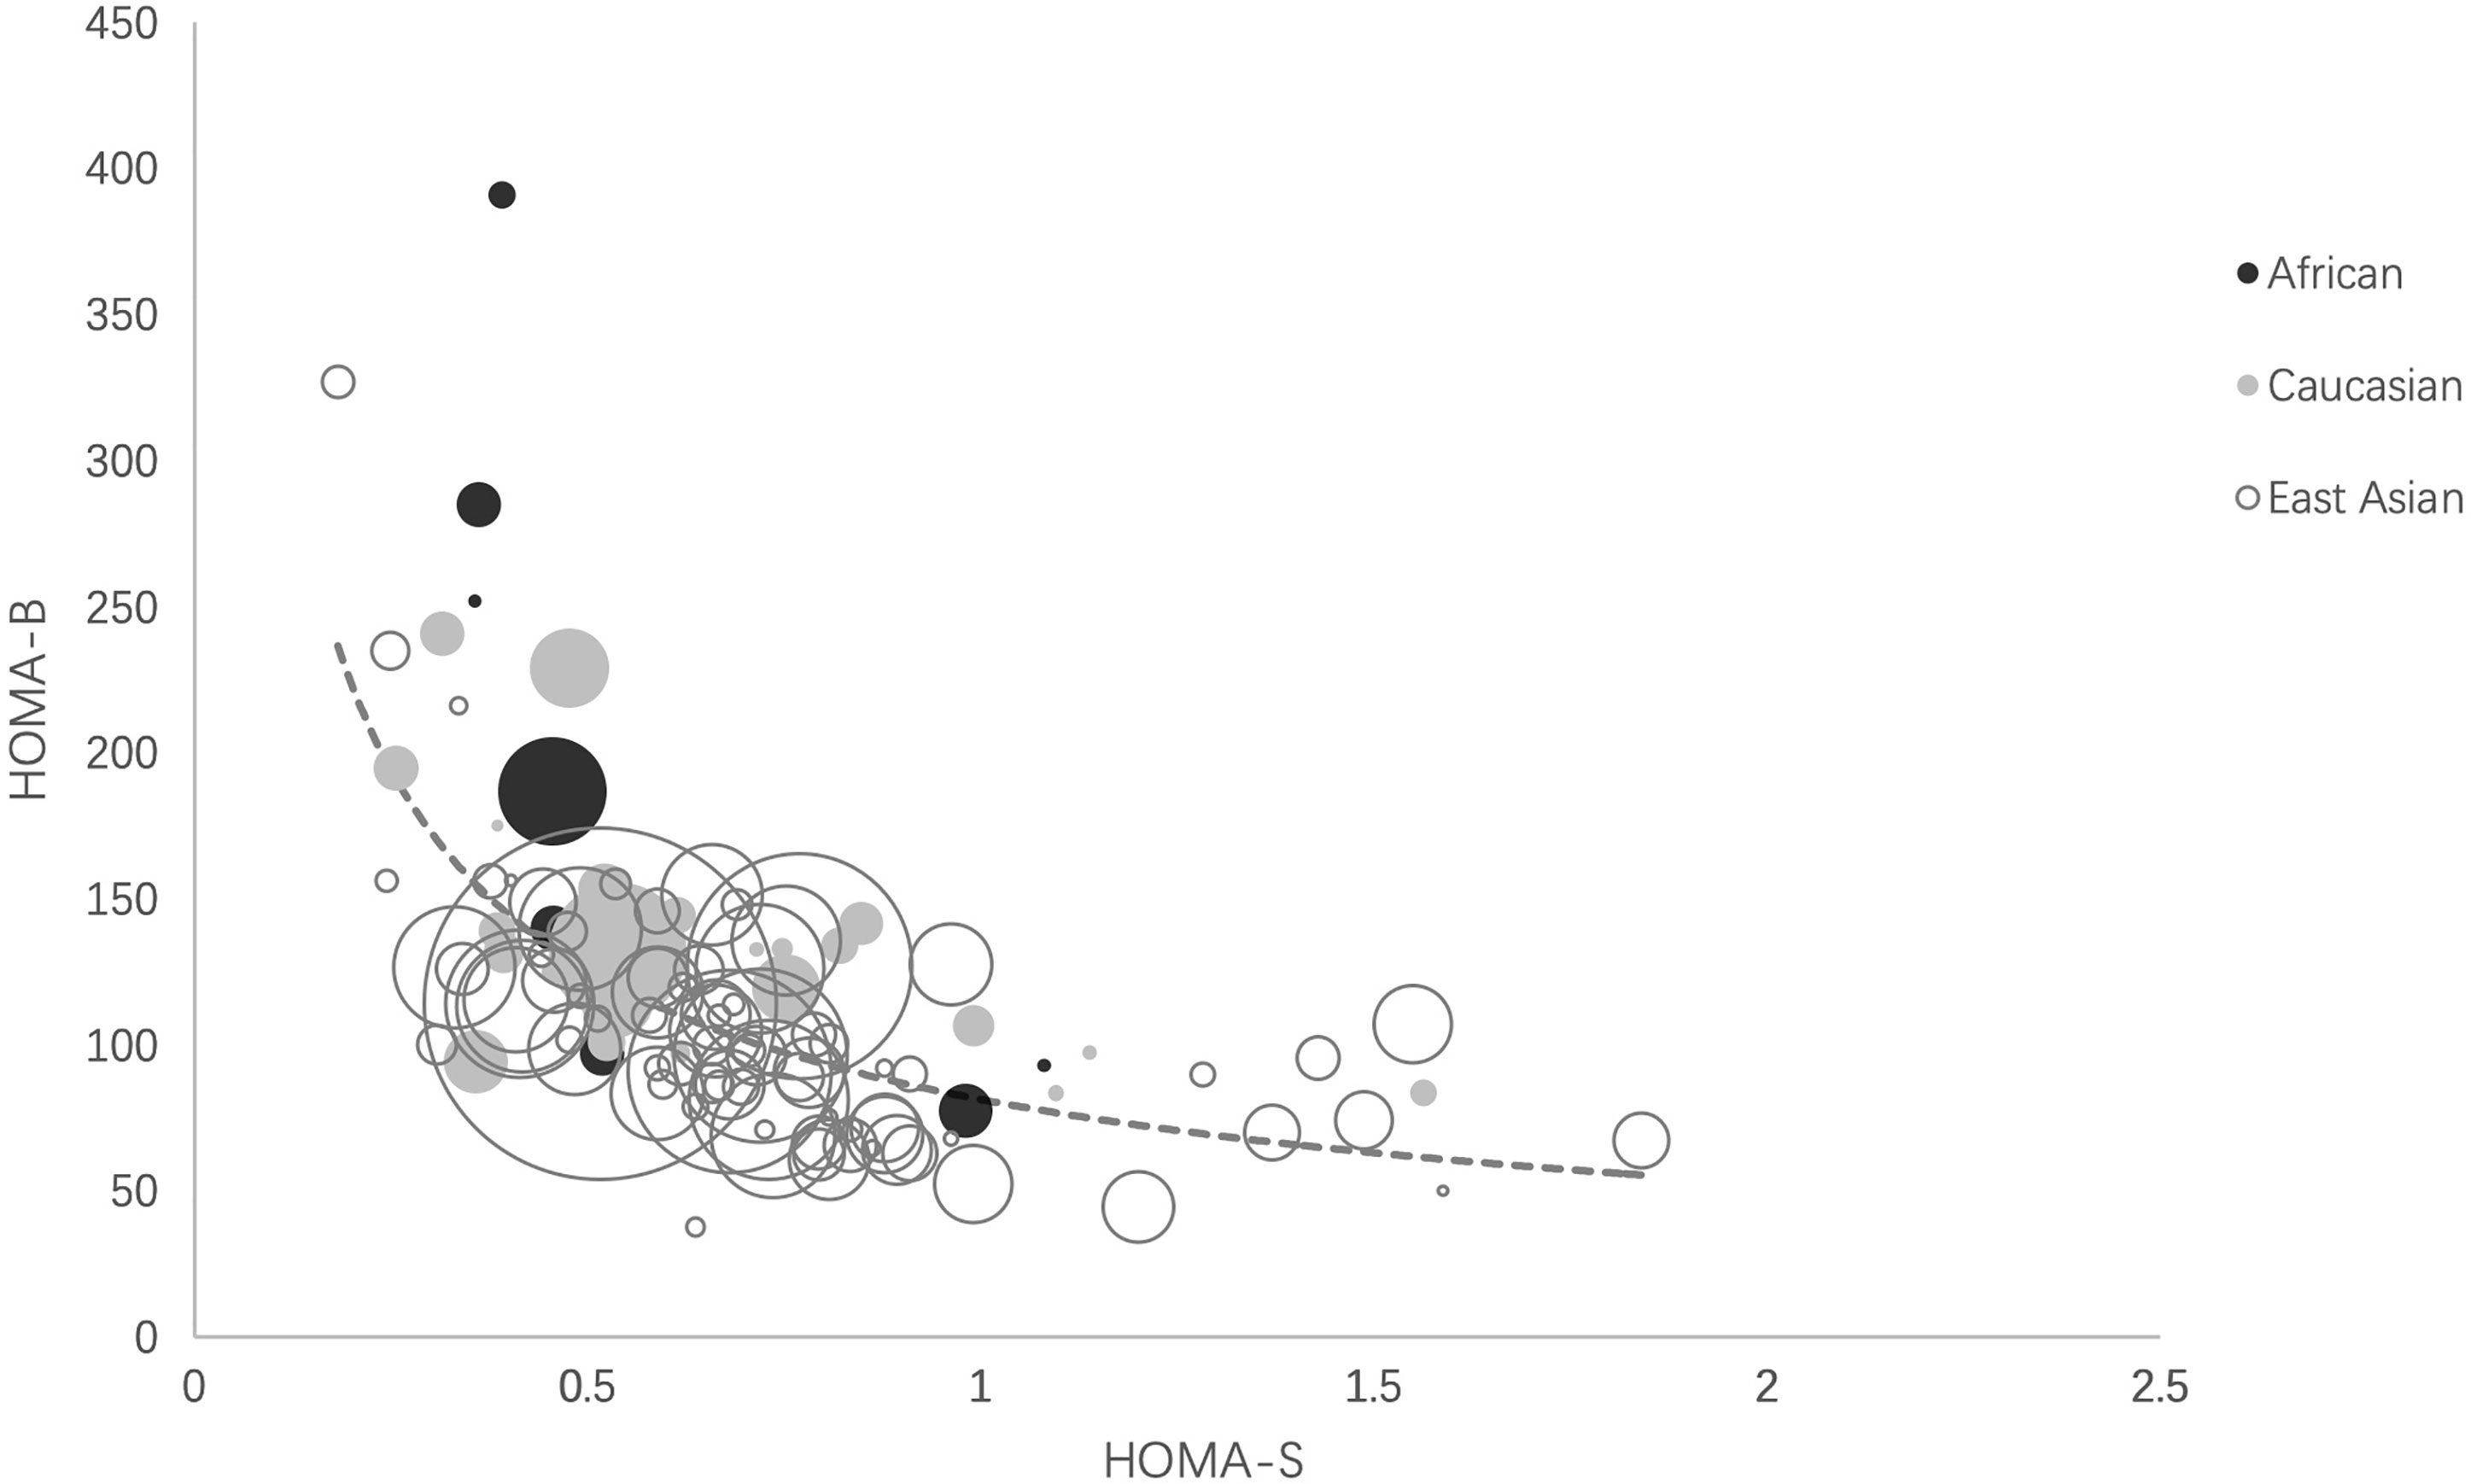
Figure 2 Ethnic distributions of HOMA-B relative to HOMA-S. The scatter plot reflects the hyperbolic relationship between HOMA-B and HOMA-S across African, Caucasian, and East Asian cohorts. Each circle indicates one cohort and the circle area is proportional to sample size of the cohort. The curve was calculated as ln (HOMA-B) = −0.626 ln (HOMA-S) + 4.399 by liner regression analysis. HOMA-S, homeostasis model assessment-insulin sensitivity; HOMA-B, homeostasis model assessment-β-cell function.
To investigate the hyperbolic relationship between HOMA-S and HOMA-B, we ln-transformed these two parameters and calculated the coefficient of lnHOMA-S on lnHOMA-B using a linear regression model. lnHOMA-S and ln HOMA-B were all fitted into a linear regression model before and after adjustment in all ethnicities (p <0.001). In crude, the coefficient in Africans was significantly lower than that in Caucasians or East Asians (Table 2), and the coefficients had no significant difference between East Asians and Caucasians. No significant difference was observed among the three ethnic groups after age, BMI and/or gender was adjusted (Table 2 and Supplementary Figure S2).
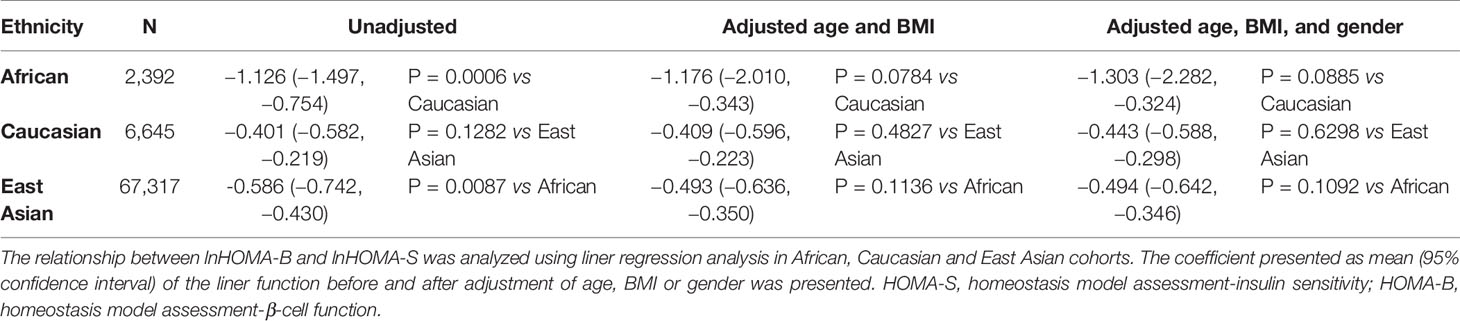
Table 2 Coefficients of lnHOMA-S on lnHOMA-B across the three ethnic groups.
Discussion
Our study demonstrated a significant difference in the HOMA-B level but similar HOMA-IR level among East Asian, African, and Caucasian study subjects with NGT. East Asians had significantly lower HOMA-B than Caucasians. The relationship between HOMA-S and HOMA-B was similar across three ethnic groups when BMI, age and/or gender were adjusted.
Our study showed that the pooled data of HOMA-B and HOMA-S of three ethnic groups all clustered and overlapped around the center of the hyperbolic curve, indicating that East Asians had a similar relationship between HOMA-B and HOMA-S with Caucasians and Africans. Similar with our findings, one study reported that β-cell function adjusted by insulin sensitivity in Asians showed no significant difference among the three ethnic groups (6). In contrast, Kodama et al. found that the African cohorts clustered at the upper end and East Asian cohorts clustered at the lower end of the hyperbolic curve and speculated this might contribute to unstable glucose canalization in these ethnic groups (7). The unbalanced distribution of these two ethnicities may be attributable to small sample sizes in East Asian (n = 205) and African cohorts (n = 688) with NGT in that study (7). In addition, the inclusion criteria of our study were different from Kodama et al. They included adolescents and excluded participants with BMI >30 kg/m2, whereas we mainly recruited with a wide BMI range. Our study greatly expanded the sample size of all three groups using epidemiological data and the statistical power to test the hypothesis of whether the ethnic difference exists.
As previously demonstrated by other studies, East Asians had the lowest HOMA-B compared with Caucasians and Africans. The insulin resistance showed no significant difference among three ethnic groups. Our hypothesis that the reduced β-cell function was secondary to lower insulin resistance rather than β-cell function impairment per se was supported by the findings that the relationship between HOMA-S and HOMA-B was consistent among three ethnic groups after BMI and age were adjusted. This suggested that if East Asians had significantly elevated insulin resistance, as much as the Caucasians, their insulin secretion may compensatively increase in NGT study subjects. Unlike other studies that indicated Asians had less insulin resistance than others (6), our study showed there was a non-significant trend of decrease in the pooled HOMA-IR in Asians. This could be possibly due to the large variance and relatively small sample size in African cohorts. Africans had a high coefficient in the same increment of HOMA-S. However, this was primarily attributable to BMI and age. In this study we adjusted age, BMI and gender since numerous studies have demonstrated that BMI, age and gender may affect the ethnic difference in the relationship between insulin secretion and insulin sensitivity (24–27). In fact, insulin resistance was higher in study subjects with higher BMI (28) and insulin response had no significant difference between East Asians and Caucasians after controlling for BMI (25). Also, age was shown to affect insulin resistance and β-cell function in different ethnic groups with NGT (29–31).
The constant of the hyperbolic curve, which is the product of insulin secretion and insulin sensitivity, is frequently called the disposition index (DI), reflecting β-cell response compensated for insulin resistance (14, 32). We pooled the AIR*Si using IFSGT data from NGT derived from references included by Kodama et al. and references from Web of Science, and our results showed that East Asians had similar DI with other ethnic groups (Supplementary Figure S3). Many studies suggested DI may be consistent among ethnicities when confounders affecting glucose homeostasis were adjusted. Studies indicated that after matching or adjusting for BMI and/or age, DI derived from FSIGT or Clamp studies were similar among different ethnic groups (27, 33, 34). In fact, Moller et al. discovered that DI was consistent between Japanese and Caucasians not only in NGT but also in subjects with IGT and type 2 diabetes using oral glucose tolerance test (OGTT) (8). Our data additionally supported that glucose homeostasis’ stabilization point was consistent across different ethnicities as a summary of epidemiological evidence.
It was proposed that Asian diabetes should be categorized as subgroup of diabetes since East Asians had poor β-cell function, higher postprandial glucose excursion, and responded to glucose lowering medication differently (2) and difference response to some anti-diabetes medication (35, 36). Our result suggests that the relationship between β-cell function and insulin resistance may be similar among three ethnic groups. The β-cell function may be underestimated in East Asians due to their high insulin sensitivity. Whether Asians deserve particular glucose-lowering therapy was still in dispute since there was robust evidence the ethnic difference in anti-diabetes therapies may not exist (37–40). Taken together, we propose that there is no sufficient evidence to support ‘Asian type diabetes’ either to emphasize the difference in β-cell function or to promote ethnic-specific treatment. Etiological and pathogenesis studies, including genetic susceptibility, molecular biological mechanism, and clinical trials regarding the difference among ethnic groups should consider that the relative relationship between β-cell function and insulin resistance was similar across ethnic groups.
Another important question regarding the ethnical difference in β cell function was whether post glucose challenge insulin secretion differed among ethnic groups. Our data only measured fasting β-cell function since epidemiological studies mainly solely measured glucose insulin at fasting status. Kodama et al. pooled data from IVGTT and found that the acute insulin response to glucose (AIRg) was lower in Asian subjects than African and Caucasian subjects (7). Chiu et al. found that the second phase insulin secretion of Asians was lower than Mexican Americans but higher than Caucasians and African Americans (27). β-cell response estimated using oral minimal models (OMM) was lower in Japanese surjects at basal but similar at dynamic and static status compared with Caucasians especially when BMI was adjusted (8). Few studies investigated the ethnical difference in the relative relationship between post-challenge insulin secretion and insulin resistance. It was found that the static DI was similar between Japanese and Caucasians regardless of the glucose tolerance status (8). Further studies were necessary to gather more information on post challenge β-cell function in reference to insulin resistance.
Our study had an advantage in sample size by pooling data from large-scale population-based epidemiological surveys in study subjects with NGT with HOMAs since these values were convenient and widely used in many epidemiological studies (41–44). We also adjusted BMI, age, and gender confounders to reveal the underlying association between β-cell function and insulin sensitivity in different ethnic groups. There were also limitations in our studies: (1) HOMA models calculated using fasting glucose and insulin level at one single time were less stable than index derived from IVGTT or OGTT. We were unable to assess insulin secretion post glucose challenge and its relative relationship with insulin sensitivity. However, HOMA models were widely used to investigate the hyperbolic relationship before (22), and estimates derived from HOMA models correlate well with that from hyperglycemic clamps and IVGTT (15, 42). An optimal hyperbolic function required a coefficient close to −1. Our study shows that coefficients in Caucasian and East Asian groups were far from −1, limiting the use of the HOMA model in analyzing the hyperbolic functions (11, 14). (2) Another limitation was the relatively high heterogeneities which may result from the following reasons: 1) research design and qualities of included studies varied across ethnicities; 2) the included cohorts from different studies may not have precisely the same glucose tolerance given that some healthy or control cohorts from volunteer-based studies included study subjects who had unknown impaired glucose tolerance (IGT) or took unreported medications that could influence glycemic control; 3) some cohorts may have impure ethnic ancestry—some of the African cohorts included African-Americans, and some cohorts were based on self-reported ancestry. Despite of this, our sensitivity analysis shows no outlier study cohorts that could affect our combined results (data not shown). (3) Finally, potential selection bias was inevitable. There were a large number of Asian studies but studies from African ancestry were less. We mainly searched PubMed and Web of Science using keywords and restricted language to English and lost a few studies. Despite these limitations, this is the first study to investigate hyperbolic relationships between HOMA-B and HOMA-S across three ethnic groups by comparing the parameters derived from their corresponding hyperbolic functions before or after adjustment for age and BMI.
In conclusion, East Asians had lower β-cell function and similar insulin sensitivity compared with Caucasians and Africans. The relationship between β-cell function and insulin sensitivity was consistent among the three ethnic groups, especially when age and BMI were adjusted. This study challenged the conventional impression that East Asians had poor β-cell functions and the existence of Asian type diabetes, which may give new insights to clinicians in making clinical recommendations in patients from different ethnic background and researchers in implicating etiological studies on the pathogenesis of diabetes in different ethnic groups.
Data Availability Statement
The original contributions presented in the study are included in the article/Supplementary Material. Further inquiries can be directed to the corresponding authors.
Author Contributions
LL and XTZ did the literature research and created the figures and tables. LL and XTZ did the data collection, data analysis, and writing of the report. LJ contributed to the design of this study and reviewed the manuscript. QH contributed to data analysis. XH and XHZ reviewed the manuscript. All authors contributed to the article and approved the submitted version.
Funding
Work on this study was supported by a grant from Beijing Nova Program of Science and Technology (Z191100001119026) to XTZ and grants from the National Key R&D Program of China to LJ (2016YFC1304901) and XHZ (2016YFC1305603) and a grant from Peking University People’s Hospital Research And Development Funds (RDX2019-11) to XTZ
Conflict of Interest
The authors declare that the research was conducted in the absence of any commercial or financial relationships that could be construed as a potential conflict of interest.
Publisher’s Note
All claims expressed in this article are solely those of the authors and do not necessarily represent those of their affiliated organizations, or those of the publisher, the editors and the reviewers. Any product that may be evaluated in this article, or claim that may be made by its manufacturer, is not guaranteed or endorsed by the publisher.
Supplementary Material
The Supplementary Material for this article can be found online at: https://www.frontiersin.org/articles/10.3389/fendo.2021.780557/full#supplementary-material
References
1. Federation ID. IDF Diabetes Atlas. 9th Vol. 2019. . Brussels, Belgium: International Diabetes Federation (2019).
2. Chan JC, Malik V, Jia W, Kadowaki T, Yajnik CS, Yoon KH, et al. Diabetes in Asia: Epidemiology, Risk Factors, and Pathophysiology. JAMA (2009) 301(20):2129–40. doi: 10.1001/jama.2009.726
3. Hu C, Jia W. Diabetes in China: Epidemiology and Genetic Risk Factors and Their Clinical Utility in Personalized Medication. Diabetes (2018) 67(1):3–11. doi: 10.2337/dbi17-0013
4. Fukushima M, Usami M, Ikeda M, Nakai Y, Taniguchi A, Matsuura T, et al. Insulin Secretion and Insulin Sensitivity at Different Stages of Glucose Tolerance: A Cross-Sectional Study of Japanese Type 2 Diabetes. Metabolism (2004) 53(7):831–5. doi: 10.1016/j.metabol.2004.02.012
5. Torrens JI, Skurnick J, Davidow AL, Korenman SG, Santoro N, Soto-Greene M, et al. Ethnic Differences in Insulin Sensitivity and β-Cell Function in Premenopausal or Early Perimenopausal Women Without Diabetes: The Study of Women’s Health Across the Nation (SWAN). Diabetes Care (2004) 27(2):354–61. doi: 10.2337/diacare.27.2.354
6. Jensen CC, Cnop M, Hull RL, Fujimoto WY, Kahn SE, American Diabetes Association GSG. β-Cell Function Is a Major Contributor to Oral Glucose Tolerance in High-Risk Relatives of Four Ethnic Groups in the U.S. Diabetes (2002) 51(7):2170–8. doi: 10.2337/diabetes.51.7.2170
7. Kodama K, Tojjar D, Yamada S, Toda K, Patel CJ, Butte AJ. Ethnic Differences in the Relationship Between Insulin Sensitivity and Insulin Response: A Systematic Review and Meta-Analysis. Diabetes Care (2013) 36(6):1789–96. doi: 10.2337/dc12-1235
8. Moller JB, Dalla Man C, Overgaard RV, Ingwersen SH, Tornoe CW, Pedersen M, et al. Ethnic Differences in Insulin Sensitivity, β-Cell Function, and Hepatic Extraction Between Japanese and Caucasians: A Minimal Model Analysis. J Clin Endocrinol Metab (2014) 99(11):4273–80. doi: 10.1210/jc.2014-1724
9. Ma RC, Chan JC. Type 2 Diabetes in East Asians: Similarities and Differences With Populations in Europe and the United States. Ann N Y Acad Sci (2013) 1281:64–91. doi: 10.1111/nyas.12098
10. Turner RC, Holman RR, Matthews D, Hockaday TD, Peto J. Insulin Deficiency and Insulin Resistance Interaction in Diabetes: Estimation of Their Relative Contribution by Feedback Analysis From Basal Plasma Insulin and Glucose Concentrations. Metabolism (1979) 28(11):1086–96. doi: 10.1016/0026-0495(79)90146-x
11. Retnakaran R, Shen S, Hanley AJ, Vuksan V, Hamilton JK, Zinman B. Hyperbolic Relationship Between Insulin Secretion and Sensitivity on Oral Glucose Tolerance Test. Obes (Silver Spring) (2008) 16(8):1901–7. doi: 10.1038/oby.2008.307
12. Kahn SE. The Relative Contributions of Insulin Resistance and β-Cell Dysfunction to the Pathophysiology of Type 2 Diabetes. Diabetologia (2003) 46(1):3–19. doi: 10.1007/s00125-002-1009-0
13. Bergman RN, Phillips LS, Cobelli C. Physiologic Evaluation of Factors Controlling Glucose Tolerance in Man: Measurement of Insulin Sensitivity and β-Cell Glucose Sensitivity From the Response to Intravenous Glucose. J Clin Invest (1981) 68(6):1456–67. doi: 10.1172/jci110398
14. Kahn SE, Prigeon RL, McCulloch DK, Boyko EJ, Bergman RN, Schwartz MW, et al. Quantification of the Relationship Between Insulin Sensitivity and β-Cell Function in Human Subjects. Evidence for a Hyperbolic Function. Diabetes (1993) 42(11):1663–72. doi: 10.2337/diab.42.11.1663
15. Matthews DR, Hosker JP, Rudenski AS, Naylor BA, Treacher DF, Turner RC. Homeostasis Model Assessment: Insulin Resistance and β-Cell Function From Fasting Plasma Glucose and Insulin Concentrations in Man. Diabetologia (1985) 28(7):412–9. doi: 10.1007/BF00280883
16. Liberati A, Altman DG, Tetzlaff J, Mulrow C, Gotzsche PC, Ioannidis JP, et al. The PRISMA Statement for Reporting Systematic Reviews and Meta-Analyses of Studies That Evaluate Health Care Interventions: Explanation and Elaboration. PloS Med (2009) 6(7):e1000100. doi: 10.1371/journal.pmed.1000100
17. Wan X, Wang W, Liu J, Tong T. Estimating the Sample Mean and Standard Deviation From the Sample Size, Median, Range and/or Interquartile Range. BMC Med Res Methodol (2014) 14:135. doi: 10.1186/1471-2288-14-135
18. Luo D, Wan X, Liu J, Tong T. Optimally Estimating the Sample Mean From the Sample Size, Median, Mid-Range, and/or Mid-Quartile Range. Stat Methods Med Res (2018) 27(6):1785–805. doi: 10.1177/0962280216669183
19. DerSimonian R, Laird N. Meta-Analysis in Clinical Trials. Control Clin Trials (1986) 7(3):177–88. doi: 10.1016/0197-2456(86)90046-2
20. Higgins JPT, Thomas J, Chandler J, Cumpston M, Li T, Page MJ, Welch VA eds. Cochrane Handbook for Systematic Reviews of Interventions. 2nd Edition. Chichester (UK). John Wiley & Sons (2019).
21. Higgins JP, Thompson SG. Quantifying Heterogeneity in a Meta-Analysis. Stat Med (2002) 21(11):1539–58. doi: 10.1002/sim.1186
22. Hu Y, Li L, Xu Y, Yu T, Tong G, Huang H, et al. Short-Term Intensive Therapy in Newly Diagnosed Type 2 Diabetes Partially Restores Both Insulin Sensitivity and β-Cell Function in Subjects With Long-Term Remission. Diabetes Care (2011) 34(8):1848–53. doi: 10.2337/dc10-2105
23. Albu JB, Kovera AJ, Allen L, Wainwright M, Berk E, Raja-Khan N, et al. Independent Association of Insulin Resistance With Larger Amounts of Intermuscular Adipose Tissue and a Greater Acute Insulin Response to Glucose in African American Than in White Nondiabetic Women. Am J Clin Nutr (2005) 82(6):1210–7. doi: 10.1093/ajcn/82.6.1210
24. Kanaya AM, Herrington D, Vittinghoff E, Ewing SK, Liu K, Blaha MJ, et al. Understanding the High Prevalence of Diabetes in U.S. South Asians Compared With Four Racial/Ethnic Groups: The MASALA and MESA Studies. Diabetes Care (2014) 37(6):1621–8. doi: 10.2337/dc13-2656
25. Moller JB, Pedersen M, Tanaka H, Ohsugi M, Overgaard RV, Lynge J, et al. Body Composition Is the Main Determinant for the Difference in Type 2 Diabetes Pathophysiology Between Japanese and Caucasians. Diabetes Care (2014) 37(3):796–804. doi: 10.2337/dc13-0598
26. Ahuja V, Kadowaki T, Evans RW, Kadota A, Okamura T, El Khoudary SR, et al. Comparison of HOMA-IR, HOMA-β% and Disposition Index Between US White Men and Japanese Men in Japan: The ERA JUMP Study. Diabetologia (2015) 58(2):265–71. doi: 10.1007/s00125-014-3414-6
27. Chiu KC, Cohan P, Lee NP, Chuang LM. Insulin Sensitivity Differs Among Ethnic Groups With a Compensatory Response in β-Cell Function. Diabetes Care (2000) 23(9):1353–8. doi: 10.2337/diacare.23.9.1353
28. Iwao T, Sakai K, Ando E. Relative Contribution of Insulin Secretion and Sensitivity at Different Stages of Glucose Tolerance: non-Obese Versus Obese Japanese Subjects. Intern Med (2014) 53(5):383–90. doi: 10.2169/internalmedicine.53.0337
29. Chiu KC, Lee NP, Cohan P, Chuang LM. β Cell Function Declines With Age in Glucose Tolerant Caucasians. Clin Endocrinol (Oxf) (2000) 53(5):569–75. doi: 10.1046/j.1365-2265.2000.01132.x
30. Chiu KC, Martinez DS, Chu A. Comparison of the Relationship of Age and β Cell Function in Three Ethnic Groups. Clin Endocrinol (Oxf) (2005) 62(3):296–302. doi: 10.1111/j.1365-2265.2005.02213.x
31. Liu J, Wu YY, Huang XM, Yang M, Zha BB, Wang F, et al. Ageing and Type 2 Diabetes in an Elderly Chinese Population: The Role of Insulin Resistance and β Cell Dysfunction. Eur Rev Med Pharmacol Sci (2014) 18(12):1790–7.
32. Bergman RN, Ader M, Huecking K, Van Citters G. Accurate Assessment of β-Cell Function: The Hyperbolic Correction. Diabetes (2002) 51 Suppl 1:S212–20. doi: 10.2337/diabetes.51.2007.s212
33. Goedecke JH, Dave JA, Faulenbach MV, Utzschneider KM, Lambert EV, West S, et al. Insulin Response in Relation to Insulin Sensitivity: An Appropriate β-Cell Response in Black South African Women. Diabetes Care (2009) 32(5):860–5. doi: 10.2337/dc08-2048
34. Goran MI, Bergman RN, Cruz ML, Watanabe R. Insulin Resistance and Associated Compensatory Responses in African-American and Hispanic Children. Diabetes Care (2002) 25(12):2184–90. doi: 10.2337/diacare.25.12.2184
35. Kim YG, Hahn S, Oh TJ, Kwak SH, Park KS, Cho YM. Differences in the Glucose-Lowering Efficacy of Dipeptidyl Peptidase-4 Inhibitors Between Asians and Non-Asians: A Systematic Review and Meta-Analysis. Diabetologia (2013) 56(4):696–708. doi: 10.1007/s00125-012-2827-3
36. Kim YG, Hahn S, Oh TJ, Park KS, Cho YM. Differences in the HbA1c-Lowering Efficacy of Glucagon-Like Peptide-1 Analogues Between Asians and Non-Asians: A Systematic Review and Meta-Analysis. Diabetes Obes Metab (2014) 16(10):900–9. doi: 10.1111/dom.12293
37. Gao W, Wang Q, Yu S. Efficacy, Safety and Impact on β-Cell Function of Dipeptidyl Peptidase-4 Inhibitors Plus Metformin Combination Therapy in Patients With Type 2 Diabetes and the Difference Between Asians and Caucasians: A Meta-Analysis. J Endocrinol Invest (2016) 39(9):1061–74. doi: 10.1007/s40618-016-0465-1
38. Cai X, Gao X, Yang W, Chen Y, Zhang S, Zhou L, et al. No Disparity of the Efficacy and All-Cause Mortality Between Asian and Non-Asian Type 2 Diabetes Patients With Sodium-Glucose Cotransporter 2 Inhibitors Treatment: A Meta-Analysis. J Diabetes Investig (2018) 9(4):850–61. doi: 10.1111/jdi.12760
39. Gao X, Cai X, Yang W, Chen Y, Han X, Ji L. Meta-Analysis and Critical Review on the Efficacy and Safety of Alpha-Glucosidase Inhibitors in Asian and Non-Asian Populations. J Diabetes Investig (2018) 9(2):321–31. doi: 10.1111/jdi.12711
40. Cai X, Han X, Luo Y, Ji L. Comparisons of the Efficacy of Alpha Glucosidase Inhibitors on Type 2 Diabetes Patients Between Asian and Caucasian. PloS One (2013) 8(11):e79421. doi: 10.1371/journal.pone.0079421
41. Haffner SM, Miettinen H, Stern MP. The Homeostasis Model in the San Antonio Heart Study. Diabetes Care (1997) 20(7):1087–92. doi: 10.2337/diacare.20.7.1087
42. Wallace TM, Levy JC, Matthews DR. Use and Abuse of HOMA Modeling. Diabetes Care (2004) 27(6):1487–95. doi: 10.2337/diacare.27.6.1487
43. Song Y, Manson JE, Tinker L, Howard BV, Kuller LH, Nathan L, et al. Insulin Sensitivity and Insulin Secretion Determined by Homeostasis Model Assessment and Risk of Diabetes in a Multiethnic Cohort of Women: The Women’s Health Initiative Observational Study. Diabetes Care (2007) 30(7):1747–52. doi: 10.2337/dc07-0358
Keywords: diabetes, β-cell function, ethical differences, insulin resistance, prediabetes
Citation: Li L, Zou X, Huang Q, Han X, Zhou X and Ji L (2021) Do East Asians With Normal Glucose Tolerance Have Worse β-Cell Function? A Meta-Analysis of Epidemiological Studies. Front. Endocrinol. 12:780557. doi: 10.3389/fendo.2021.780557
Received: 11 October 2021; Accepted: 01 November 2021;
Published: 30 November 2021.
Edited by:
Åke Sjöholm, Gävle Hospital, SwedenReviewed by:
Akinobu Nakamura, Hokkaido University, JapanLuca D’Onofrio, Sapienza University of Rome, Italy
Copyright © 2021 Li, Zou, Huang, Han, Zhou and Ji. This is an open-access article distributed under the terms of the Creative Commons Attribution License (CC BY). The use, distribution or reproduction in other forums is permitted, provided the original author(s) and the copyright owner(s) are credited and that the original publication in this journal is cited, in accordance with accepted academic practice. No use, distribution or reproduction is permitted which does not comply with these terms.
*Correspondence: Xiantong Zou, ZXZhMjE3MkAxNjMuY29t; Linong Ji, amlsbkBiam11LmVkdS5jbg==
†These authors have contributed equally to this work and share first authorship