 Shuheng Yang1
 Wei Zheng1
 Chen Yang1
 Ruowen Zu1
 Shiyu Ran1
 Huan Wu1
 Mingkun Mu1
 Simin Sun1
 Nana Zhang1
 Rick F. Thorne2,3*
 Yichun Guan1*
- 1Center for Reproductive Medicine, The Third Affiliated Hospital of Zhengzhou University, Zhengzhou, China
- 2Translational Research Institute, Henan Provincial People's Hospital, Zhengzhou, China
- 3Academy of Medical Sciences, Zhengzhou University, Zhengzhou, China
Objective: Supraphysiological hormone exposure, in vitro culture and embryo transfer throughout the in vitro fertilization-embryo transfer (IVF-ET) procedures may affect placental development. The present study aimed to identify differences in genomic expression profiles between IVF-ET and naturally conceived placentals and to use this as a basis for understanding the underlying effects of IVF-ET on placental function.
Methods: Full-term human placental tissues were subjected to next-generation sequencing to determine differentially expressed miRNAs (DEmiRs) and genes (DEGs) between uncomplicated IVF-ET assisted and naturally conceived pregnancies. Gene ontology (GO) enrichment analysis and transcription factor enrichment analysis were used for DEmiRs. MiRNA-mRNA interaction and protein-protein interaction (PPI) networks were constructed. In addition, hub genes were obtained by using the STRING database and Cytoscape. DEGs were analyzed using GO and Kyoto Encyclopedia of Genes and Genomes (KEGG) pathway analysis. Differentially expressed miRNAs were validated through qRT-PCR.
Results: Compared against natural pregnancies, 12 DEmiRs and 258 DEGs were identified in IVF-ET placental tissues. In a validation cohort, it was confirmed that hsa-miR-204-5p, hsa-miR-1269a, and hsa-miR-941 were downregulation, while hsa-miR-4286, hsa-miR-31-5p and hsa-miR-125b-5p were upregulation in IVF-ET placentas. Functional analysis suggested that these differentially expressed genes were significantly enriched in angiogenesis, pregnancy, PI3K-Akt and Ras signaling pathways. The miRNA-mRNA regulatory network revealed the contribution of 10 miRNAs and 109 mRNAs while EGFR was the most highly connected gene among ten hub genes in the PPI network.
Conclusion: Even in uncomplicated IVF-ET pregnancies, differences exist in the placental transcriptome relative to natural pregnancies. Many of the differentially expressed genes in IVF-ET are involved in essential placental functions, and moreover, they provide a ready resource of molecular markers to assess the association between placental function and safety in IVF-ET offspring.
Introduction
In vitro fertilization-embryo transfer (IVF-ET) is the main method of assisted reproductive technology (ART), and can improve the success rates of infertility treatment (1, 2). The use of this procedure has been steadily increasing worldwide and for example, in China, the average number of ART treatments performed now exceeds 700,000 annually (3). The vast majority of children successfully delivered through ART are healthy (4). Nonetheless, there are increased risks of several pregnancy-related complications, including gestational diabetes (5), pre-eclampsia (6), placenta previa (7), abnormal placental growth, preterm delivery (8), and low birth weight (9). Some reports have suggested that the adverse perinatal outcomes occur due to IVF-ET procedures such as supraphysiological estrogen level during stimulation, in vitro culture, and microscopic manipulation (10, 11). However, the underlying causes of IVF-ET-associated complications are largely unknown, although many conceptually appear related to placental vascular complications and the resulting effects on fetal development.
MicroRNAs (miRNAs) represent a major class of non-coding RNAs consisting of single-stranded RNAs of approximately 18-25 nucleotides in length (12). They function as negative gene regulators by binding to the 3’ UTR of messenger RNAs (mRNAs), to either prevent protein translation or to direct the mRNA towards degradation (13). The placenta expresses many ubiquitous as well as specific miRNAs and a growing body of evidence proposes that miRNAs function as important regulators of placental development (14). Here, various miRNAs have been shown to control the differentiation, replication, apoptosis, invasion/migration and angiogenesis of trophoblasts, indicating the widespread contribution of miRNAs to the placental growth (15, 16). For example, miR-346 and miR-582-3p down-regulate the expression of endocrine gland-derived vascular endothelial growth factor (EG-VEGF) and inhibit trophoblast cell invasion and migration (17). miR-191 inhibits angiogenesis by activating the nuclear factor-κB (NF-κB) signaling pathway (18). It was also found that miR-29b inhibited trophoblast invasion and angiogenesis by suppressing vascular endothelial growth factor (VEGF) expression (19). In addition, animal experiments in mice revealed that miR-450a-3p played a role in inhibiting cell proliferation, promoting apoptosis and interfering with embryonic development through regulating the target gene Bub1 (20). However, the impact of specific microRNAs in IVF-ET placental tissue, and their potential impact on related gene regulatory networks has to date been poorly investigated.
This study aimed to understand the differences in placental genomic expression profiles comparing IVF-ET and natural pregnancy-derived placentas, and the link between IVF-ET manipulation and placental structure and function. We used next-generation sequencing techniques to analyze of miRNA and mRNA expression profiles in IVF-ET and natural gestational placental tissue. Based on co-expression analysis and online prediction. we established a miRNA-mRNA regulatory network comprising 10 miRNAs and 109 mRNAs together with a PPI network comprised of ten hub genes. Furthermore, we verified that miR-204-5p, miR-1269a and miR-941 were downregulated in IVF-ET placentals thereby proposing these as key regulators involved in the effects of IVF-ET on placental development and function. Moreover, our study constitutes a verified resource for enabling further investigation into the transcriptomic and mechanistic differences between IVF-ET and naturally conceived pregnancies with the goal of providing new targets to assess the safety of IVF-ET in the clinic.
Materials and Methods
Tissue Collection and Ethics
Placental tissue samples were collected from women who underwent caesarean deliveries after IVF-ET assisted (n=3) or natural conceived (n=3) pregnancies. Inclusion criteria included full-term singleton delivery after IVF-ET, with age between 20 and 35 years, 37-42 gestational weeks, infant birth weight between 2500 g and 4000 g, and uncomplicated pregnancies. Three strictly matched natural pregnancies were selected as controls with matching parameters: delivery, maternal age, parity, and gestational duration (Table 1). A validation cohort of 8 uncomplicated IVF-ET and 8 normal conception patients were similarly collected (Table 2). We used an equal number of male and female placentals for both discovery and validation cohorts and selected tissue from the middle placenta throughout to minimize sampling bias. All placental tissues were rinsed extensively with ice cold PBS and stored at -80°C until later RNA extraction. Tissue collection was approved by the Ethics Committee of the Third Affiliated Hospital of Zhengzhou University with written informed consent provided by all patients prior to sample collection.
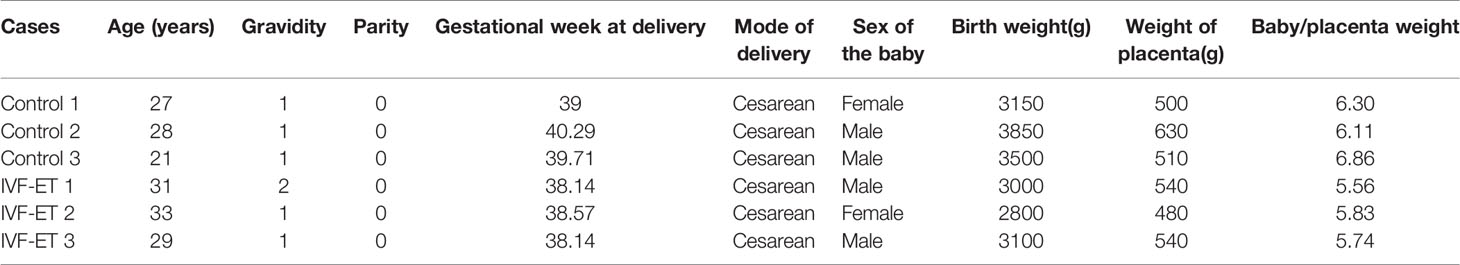
Table 1 Clinical characteristics of IVF-ET and controls for high-throughput sequencing.
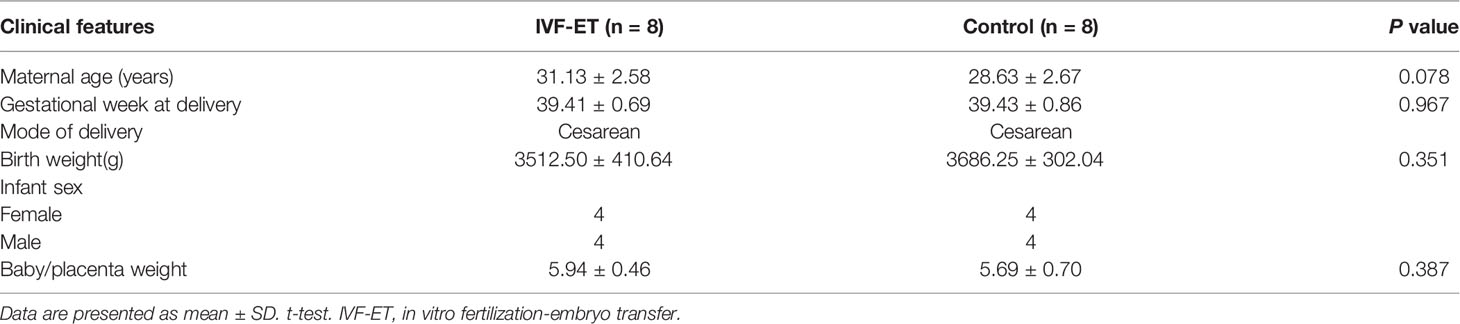
Table 2 Clinical characteristics of IVF-ET and controls.
RNA Extraction and Sequencing
Total RNA was isolated from placental tissue using the mirVana RNA Isolation Kit (Cat #. AM1561, Austin TX, US) according to the manufacturer’s instructions. RNA concentration and integrity were then verified using an Agilent Bioanalyzer 2100 (Agilent technologies Santa Clara, US) before subjecting the samples to library preparation and sequencing. The concentration and size of the constructed libraries were measured using a Qubit® 2.0 Fluorometer (Life Technologies, USA) and Agilent 2100 Bioanalyzer, respectively. The samples were prepared according to the HiSeq 2500 User Guide, and the flow cell with the cluster was loaded on the Illumina HiSeq 2500 (50-bp single-end FASTQ reads). The number of sequencing reads per sample was at least 10M and the proportion of bases with mass greater than 20 was greater than 95%, and the quality control meets the requirements of data analysis.
Differential Expression Analysis
The DESeq2 package of R version 3.5.2 (http://www.r-project.org) was used to define differentially expressed miRNAs (DEmiRs) and genes (DEGs) with the Bayesian method used to correct batch effects. MiRNAs and mRNAs with statistical significance between the IVF-ET and control groups were selected according to the threshold criterion of fold change (FC) >1.5 and P < 0.05. Volcano maps were created in the R studio using the plot packages to illustrate the differential expression of DEmiRs and DEGs.
GO Enrichment Analysis for the Targets of Transcription Factors
DEmiRs were uploaded to FunRich software to screen for upstream transcription factors, which is primarily used for functional enrichment and interaction network analysis of genes and proteins, as well as enrichment targets for transcription factor pathways (21). For interaction network analysis between miRNAs, gene/mRNA, and transcription factors, gene ontogeny (GO) enrichment analysis was also used (22, 23).
Construction of the miRNA-mRNA Regulatory Networks
The miRWalk V2.0, StarBase and TargetScan databases were used to predict the target mRNAs of the miRNAs identified as DEmiRs. Subsequently, the predicted DEGs were matched with the experimentally determined DEGs to develop miRNA-mRNA regulatory networks with visualization using Cytoscape software (http://www.cytoscape.org/) (24). All node degrees, proximity and presence of the regulatory network were simultaneously computed.
GO and KEGG Enrichment Analyses
For gene ontology (GO) and Kyoto Encyclopedia of Genes and Genomes (KEGG) pathway analysis of DEGs, we used the Database for Annotation, Visualization and Integrated Discovery (DAVID) and used ggplot2 packages in the R studio to identify significantly altered biological processes (BPs), cellular components (CCs), molecular functions (MFs) and pathways associated with DEGs (P < 0.05).
Protein-Protein Interaction (PPI) Network Analysis and Hub Gene Identification
Differentially expressed gene data was uploaded to the STRING database (http://www.string-db.org/) (25). Interactions with a composite score of >0.4 were considered significant. The target genes in the PPI network act as nodes and the line from two nodes indicates relevant interactions. Cytoscape software was used to visualize the PPI network. We screened the top 10 genes with the highest degree of correlation to the others as hub genes with the CytoHubba plugin of Cytoscape (26).
Quantitative Real-Time Polymerase Chain Reaction (qRT-PCR)
One μg total RNA was reverse transcribed into cDNA using the ReverTra Ace qPCR RT Kit (Toyobo, Japan) according to the manufacturers’ instructions. Specific primers were used to synthesize the cDNA of miRNAs. qRT-PCR reactions were performed with the indicated primers (Table 3) in triplicate 20 μL reactions using the SYBR Green Realtime PCR Master Mix (Toyobo, Japan) on a StepOnePlus™ Real-Time PCR System. Cycling conditions were as follows: 95°C for 60 seconds, 40 cycles of 95°C for 15 seconds, 60°C for 15 seconds, and 72°C for 45 seconds. The results were normalized to U6 and the relative changes calculated using the 2−ΔΔCt method (27).
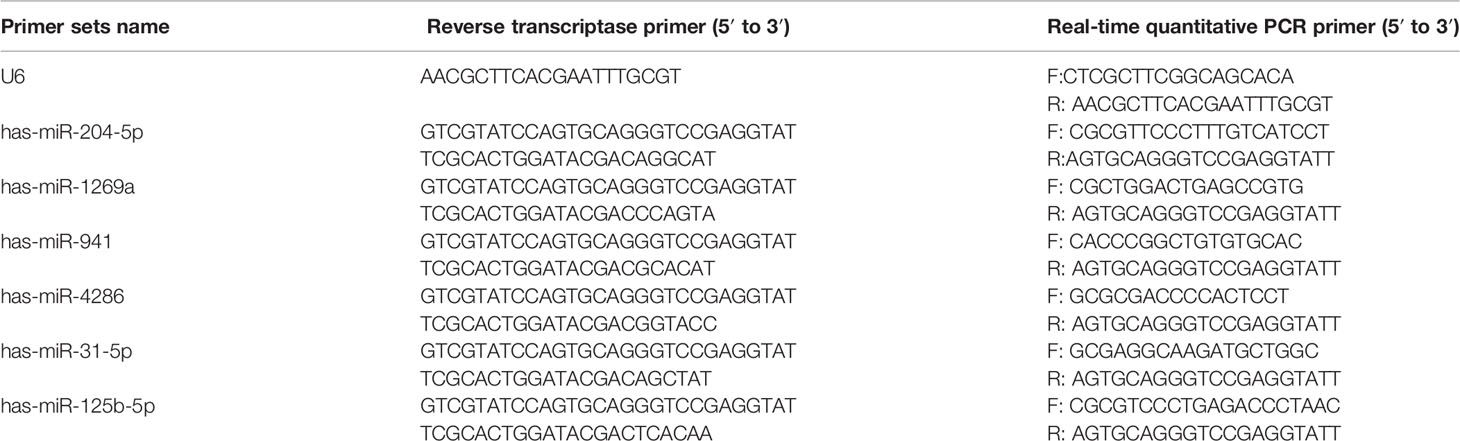
Table 3 Oligonucleotides used in this study.
Statistical Analysis
Data were presented as means ± standard deviations (SD) for quantitative variables and the Student’s t-test used to assess differences between groups. Otherwise, for discrete variables the Mann-Whitney U-test was used. A value of P < 0.05 was regarded as statistically significant. SPSS 21.0 and GraphPad Prism 6.0 were used for analysis.
RESULTS
Identification of Differentially Regulated Genes in IVF-ET Placentals
The schema of the overall study and analysis approach is presented in Figure 1. High throughput sequencing analysis was performed to analyze the expression profiles of miRNAs and mRNAs in placentals from uncomplicated full-term IVF-ET and natural conception pregnancies. From these data we identified a total of 12 differentially expressed miRNAs (DEmiRs; Figure 2A) including 4 downregulated miRNAs: hsa-miR-1269a, hsa-miR-204-5p, hsa-miR-224-5p and hsa-miR-941, and 8 upregulated miRNAs: hsa-miR-1269b, hsa-miR-125b-5p, hsa-miR-193b-3p, hsa-miR-193b-5p, hsa-miR-31-5p, hsa-miR-371a-5p, hsa-miR-4286 and hsa-miR-9-5p (Table 4). We also identified 258 differentially expressed mRNAs consisting of 52 downregulated and 206 upregulated DEGs (Figure 2B and Supplementary Table SI).
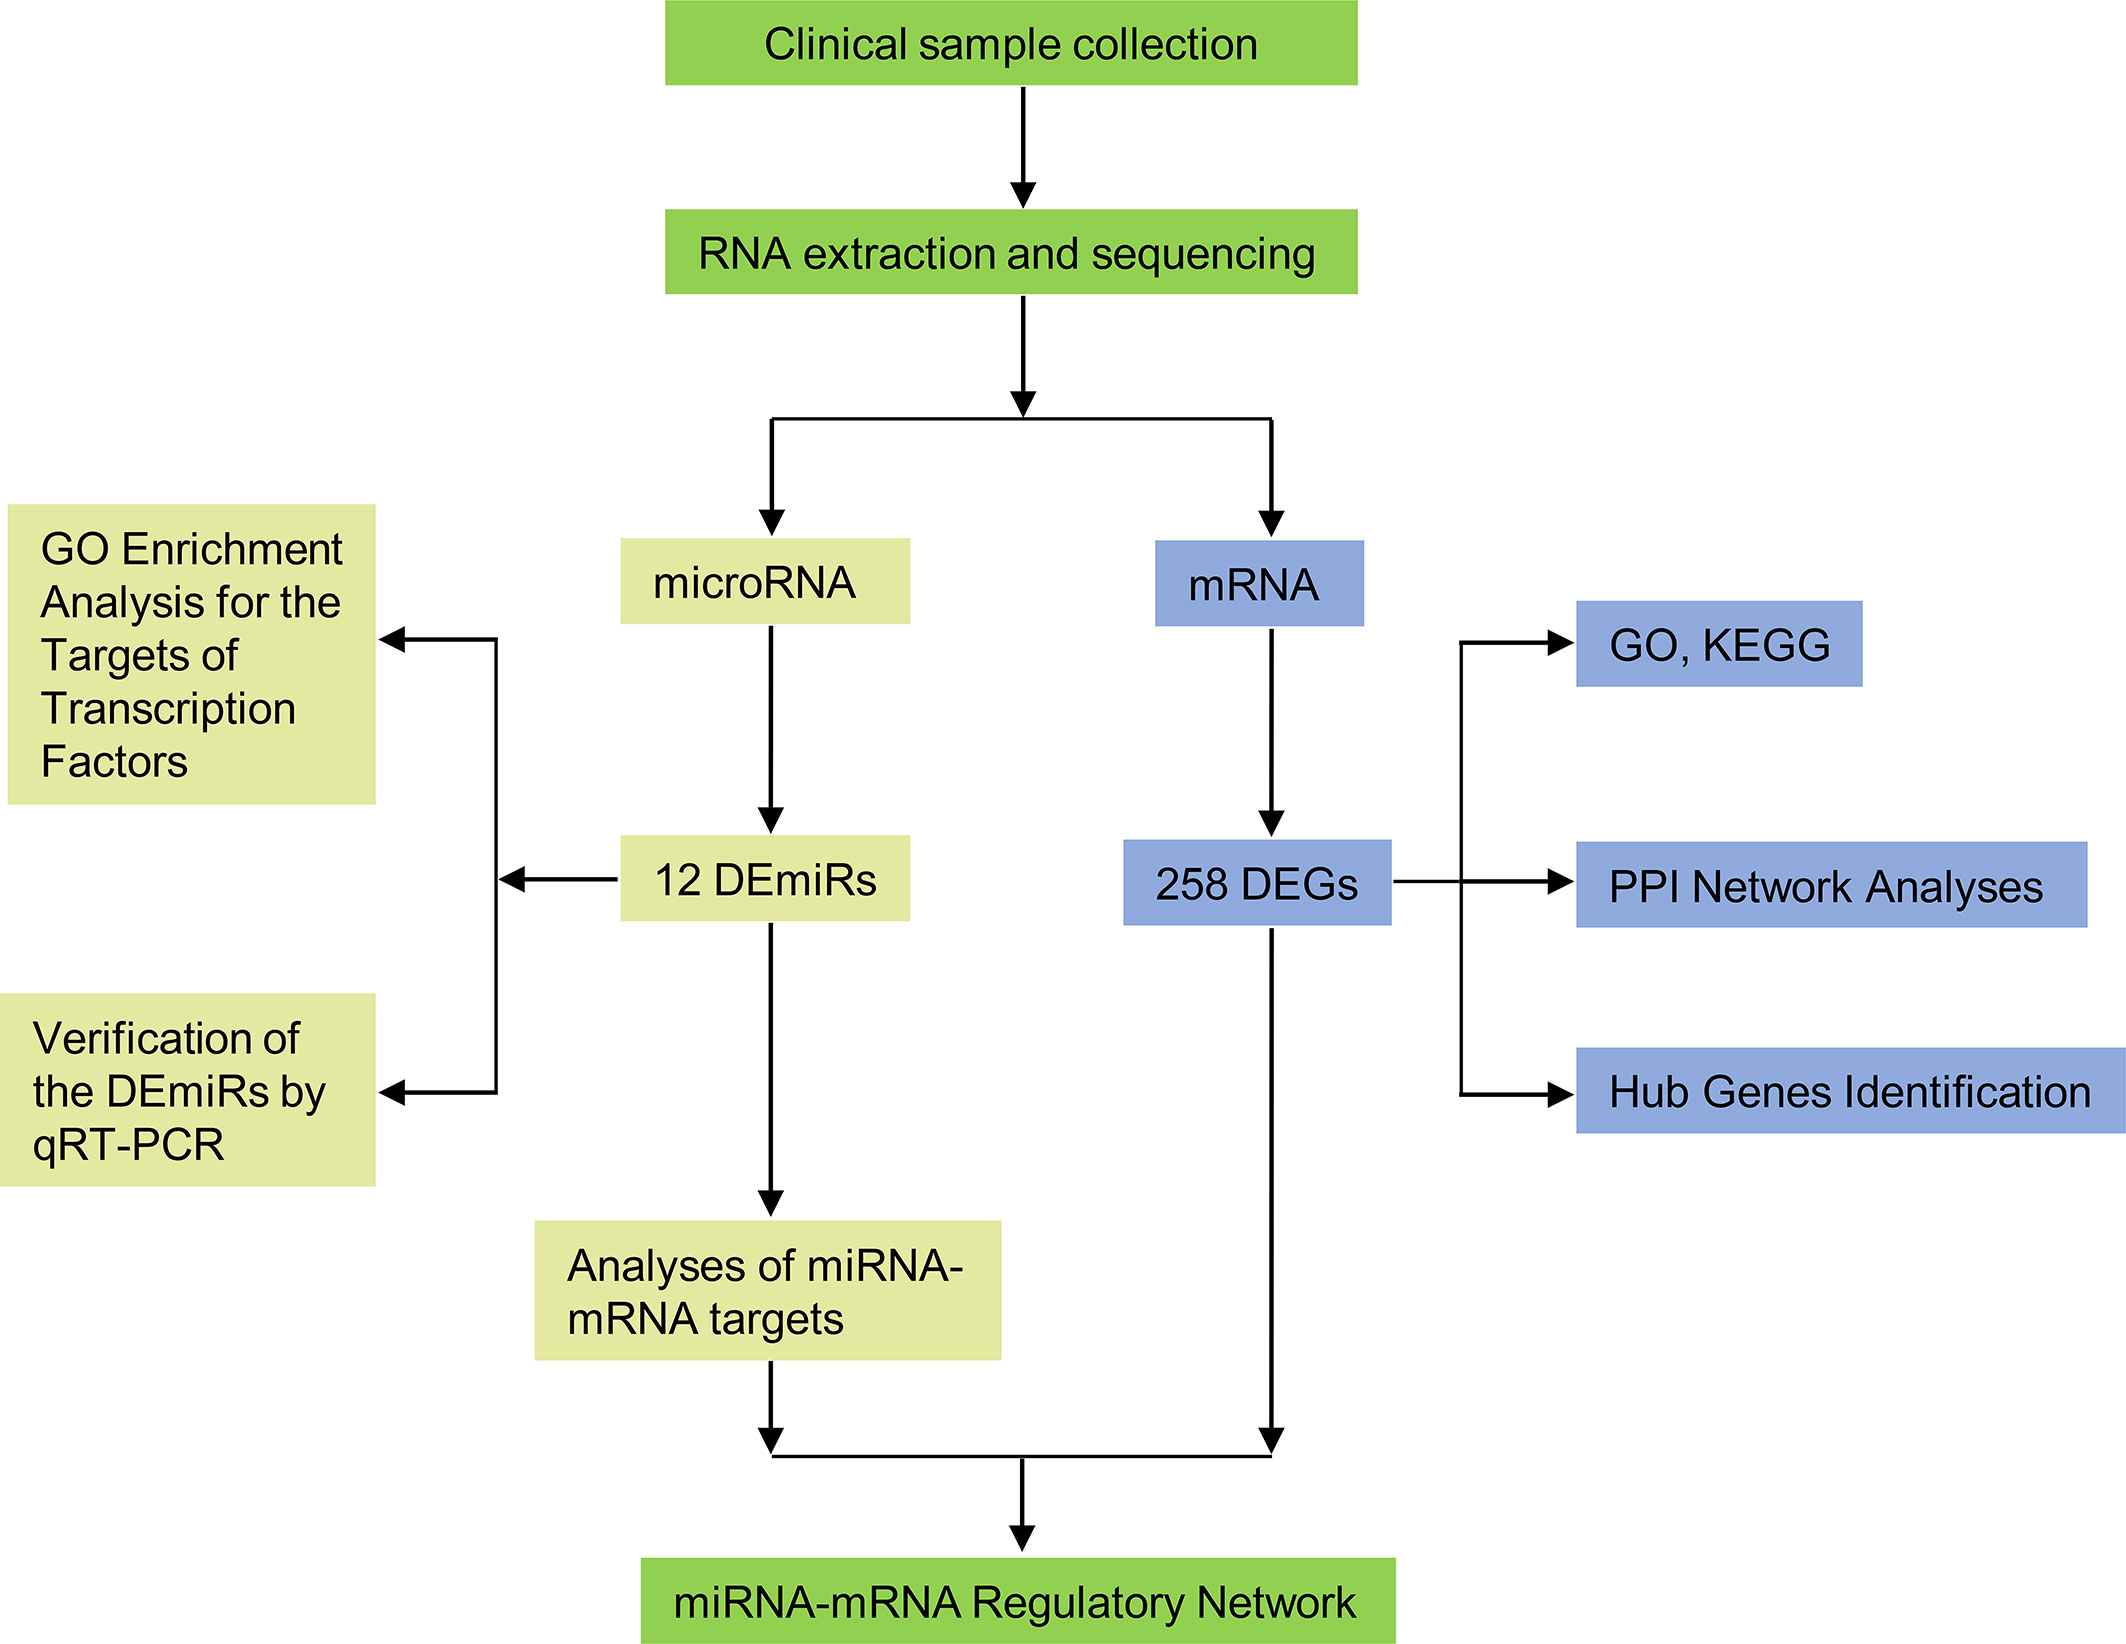
Figure 1 Flow diagram of the study design. DEmiRs, differentially expressed miRNAs; DEGs, differentially expressed genes; GO, Gene Ontology; KEGG, Kyoto Encyclopedia of Genes and Genomes; PPI, protein-protein interaction.
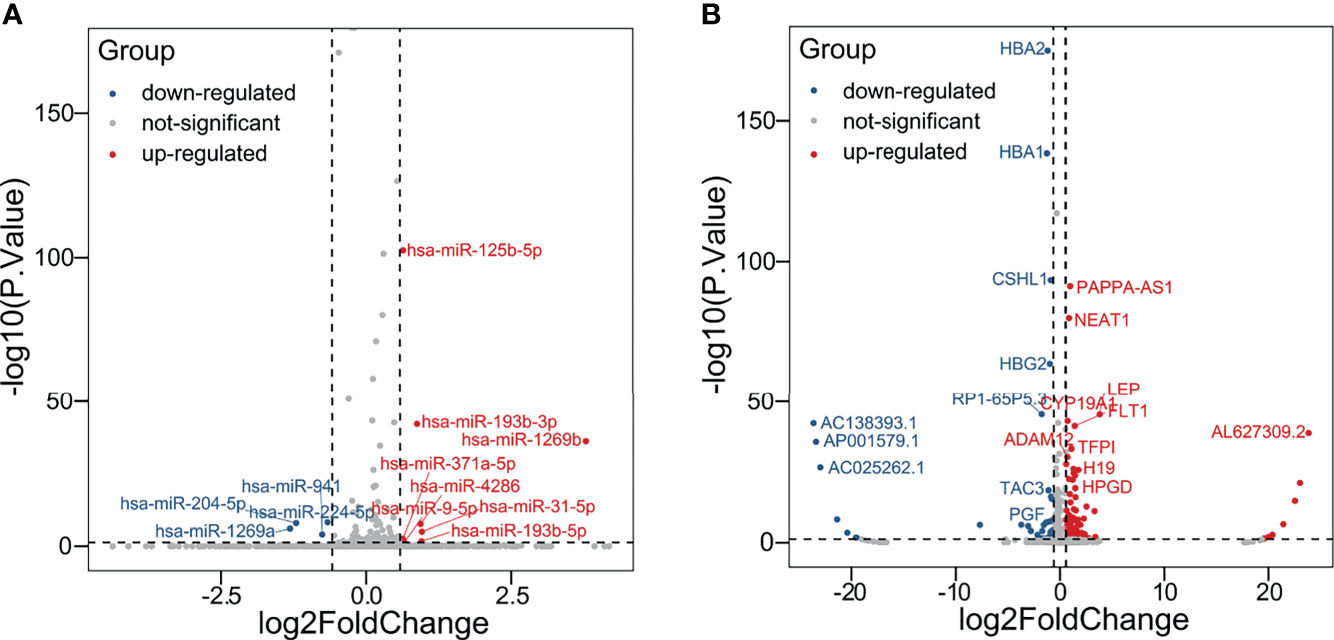
Figure 2 Identification of DEmiRs and DEGs. Volcano plots illustrating (A) DEmiRs and (B) DEGs in placental tissues determined by comparing IVF-ET (n = 3) with normal conception (n = 3) pregnancies. Differential expression thresholds employed for deriving DEmiRs and DEGs involved fold change (FC) >1.5 and P < 0.05. Red and blue points represent significantly upregulated or downregulated miRNAs/mRNAs, respectively.
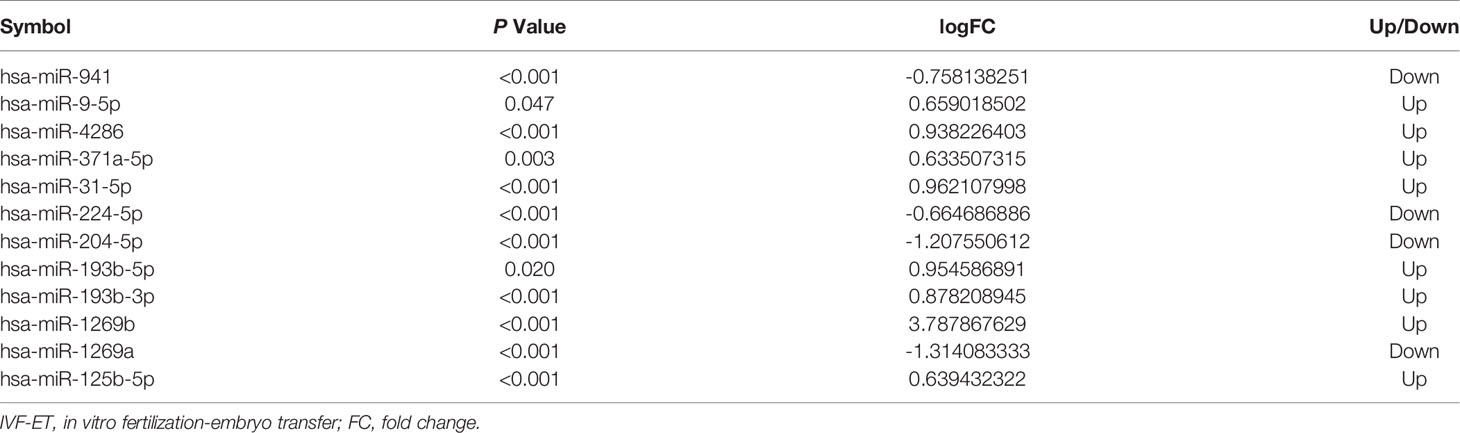
Table 4 The 12 differentially expressed miRNAs (DEmiRs) in IVF-ET.
Verification of the DEmiRs by qRT-PCR in Placental Tissues
To ensure the veracity of the high throughput sequencing analysis, it was necessary to validate our findings using alternative methodology and samples. On the basis of subsequent bioinformatics (see below), we selected 6 of the 12 DEmiRs (3 downregulated and 3 upregulated, respectively) and analyzed their expression using qRT-PCR in a validation cohort of 8 IVF-ET and 8 normal conception placentas. Instructively, we found that the relative expression levels of hsa-miR-204-5p, hsa-miR-1269a, and hsa-miR-941 were significantly downregulated whereas hsa-miR-4286, hsa-miR-31-5p and hsa-miR-125b-5p were all upregulated, respectively, in IVF-ET compared to the control placentas (Figures 3A–F). These results suggest that the dysregulation of these miRNAs commonly occurs in IVF-ET pregnancies but further verification will be required to support the general veracity of the global sequencing data and analysis of the study.
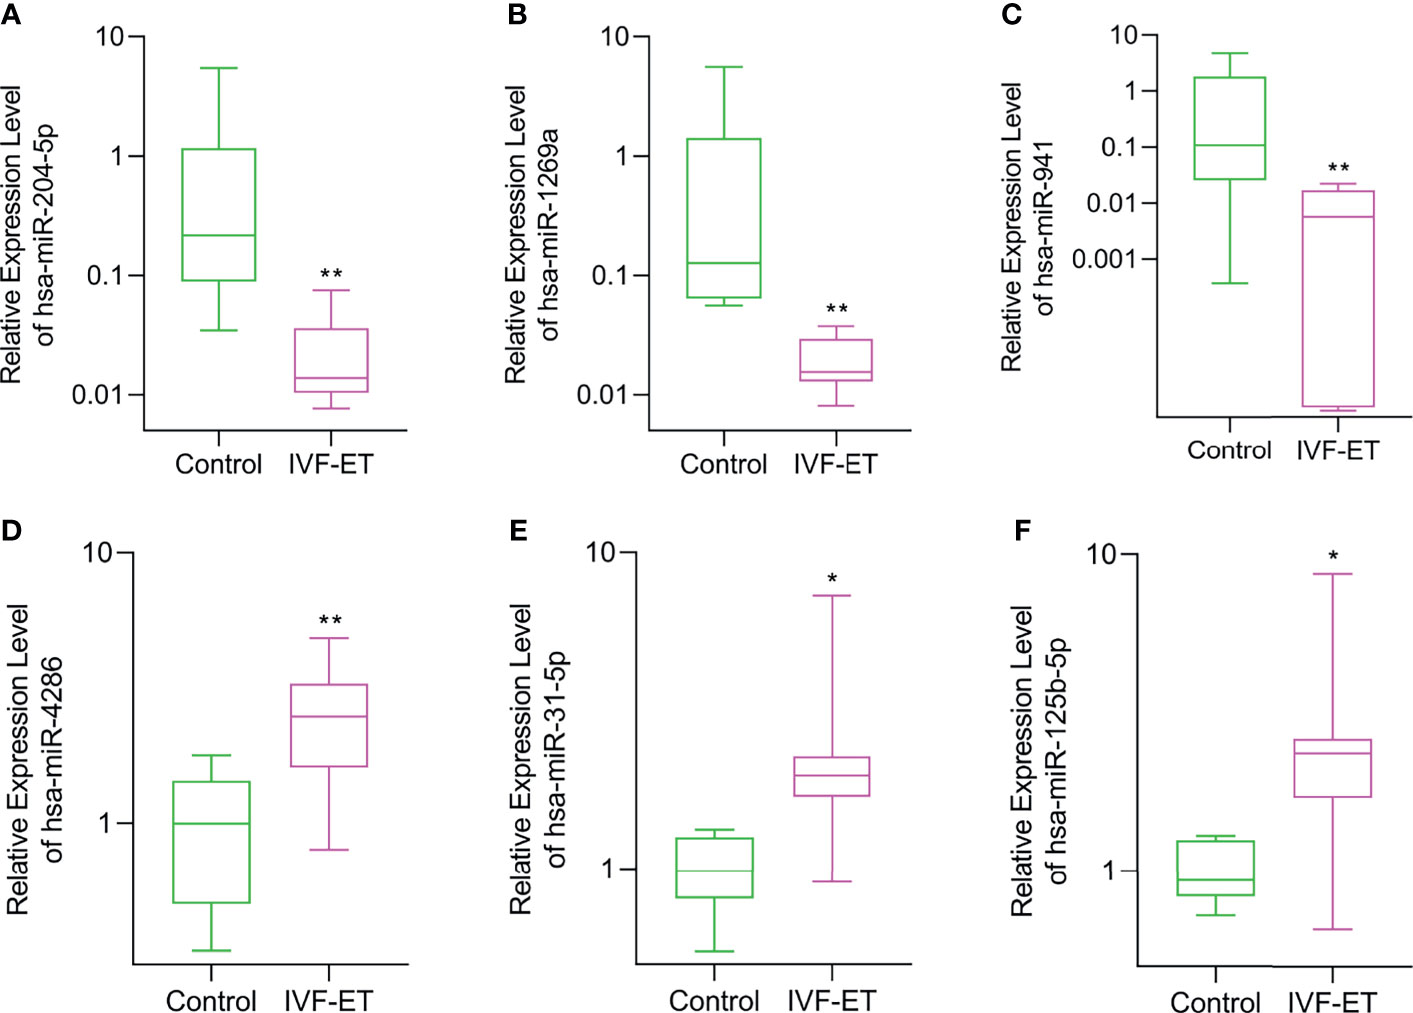
Figure 3 Validation of differential expression of randomly selected DEmiRs in IVF-ET versus control placental tissues. The relative expression levels of (A) hsa-miR-204-5p, (B) hsa-miR-1269a, (C) hsa-miR-941, (D) hsa-miR-4286, (E) hsa-miR-31-5p and (F) hsa-miR-125b-5p were measured in an independent cohort of placental tissues from uncomplicated IVF-ET (n = 8) and natural conceived pregnancies (n = 8). Box and whisker plot with relative expression plotted in log scale showing the range (whiskers), first and third quartiles (boxes) and median values. *P < 0.05, **P < 0.01.
Transcription Factor Enrichment and GO Enrichment Analysis
Transcription factors often represent the critical final step in signal transduction pathways. To investigate the enrichment of transcription factor targets likely associated with the genetic landscape of the IVF-ET placenta, we filtered out the top 10 transcription factors most closely linked to the DEmiRs. In deceasing probability order, this analysis identified SP1, EGR1, SP4, KLF7, ONECUT1, MYF5, TCF3, NFIC, SRF, and HOXB4 (Figure 4A). It indicates a regulatory interaction between these transcription factors and DEmiRs. Intriguingly, SP1 was apparently able to regulate majority of the DEmiRs.
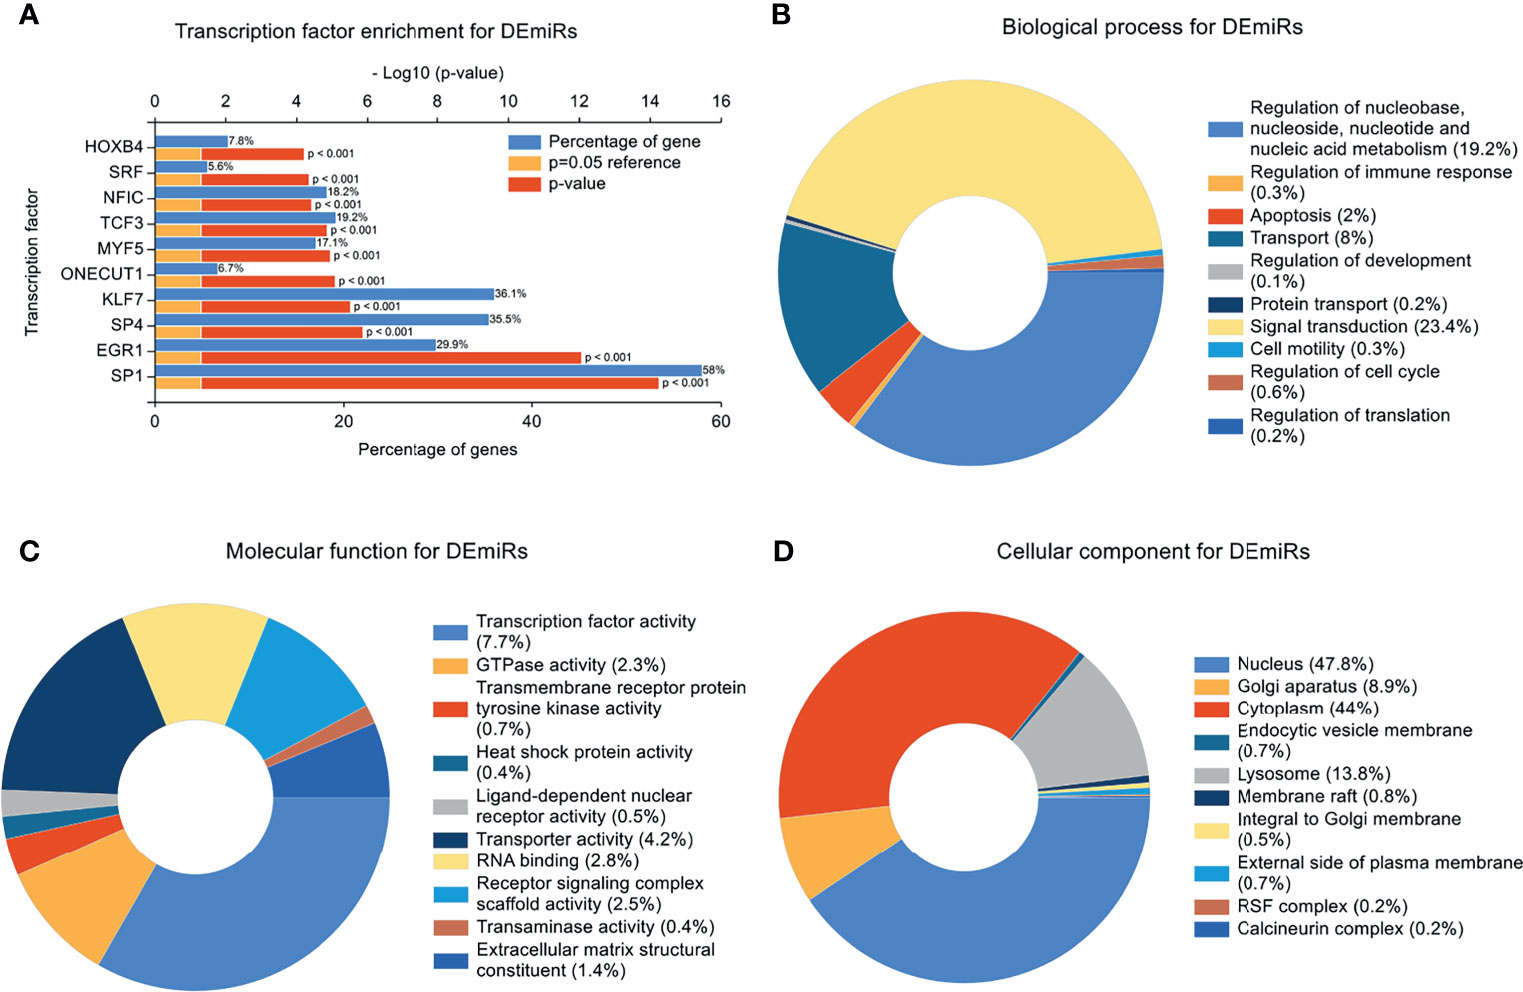
Figure 4 Transcription Factor Enrichment and GO Enrichment Analysis. (A) Transcription factors (TF) of the differentially expressed miRNAs (DEmiRs) from FunRich. Blue bars, orange bars, and red bars represent percentage of predicted genes, reference of P=0.05, and p value, respectively. (B) mRNAs involved in biological process terms for DEmiRs. (C) mRNAs involved in molecular function terms for DEmiRs. (D) mRNAs involved in cellular component terms for DEmiRs.
In concert with these findings, GO enrichment analysis indicated that the top 5 biological progress (BP) terms with the most enriched targets of the DEmiRs involved signal transduction; regulation of nucleobase, nucleoside, nucleotide and nucleic acid metabolism, transport, apoptosis, and regulation of immune response (Figure 4B). GO enrichment terms associated with molecular function (MF) indicated most of the genes were involved in transcription factor activity, transporter activity, RNA binding, Receptor signaling complex scaffold activity, and GTPase activity (Figure 4C). The top 5 enriched cellular component (CC) terms were nucleus, cytoplasm, Golgi apparatus, lysosome and membrane raft (Figure 4D).
Construction of miRNA-mRNA Regulatory Networks
Reliable identification of miRNA targets is still an imprecise process, but it is widely appreciated that predictions can be improved using the outputs of multiple algorithms (28). Consequently, we employed three databases (miRWalk V2.0, StarBase and TargetScan) to analyze the potential impact of the DEmiRs on the placental transcriptome. Screening miRNA targets based on the overlapping results of the three databases and the intersection with DEGs. This analysis yielded paired interactions between 109 DEGs with 10 of the 12 identified DEmiRs. The network of miRNA-mRNA interactions was visualized in Cytoscape (Figure 5) and the target genes of the DEmiRs are listed in Table 5. Notably, among these, the four downregulated DEmiRs, particularly hsa-miR-204-5p, hsa-miR-1269a and hsa-miR-941, formed the most extensive interactive network with multiple gene targets while the upregulated DEmiRs aligned with a more discrete set of target genes.
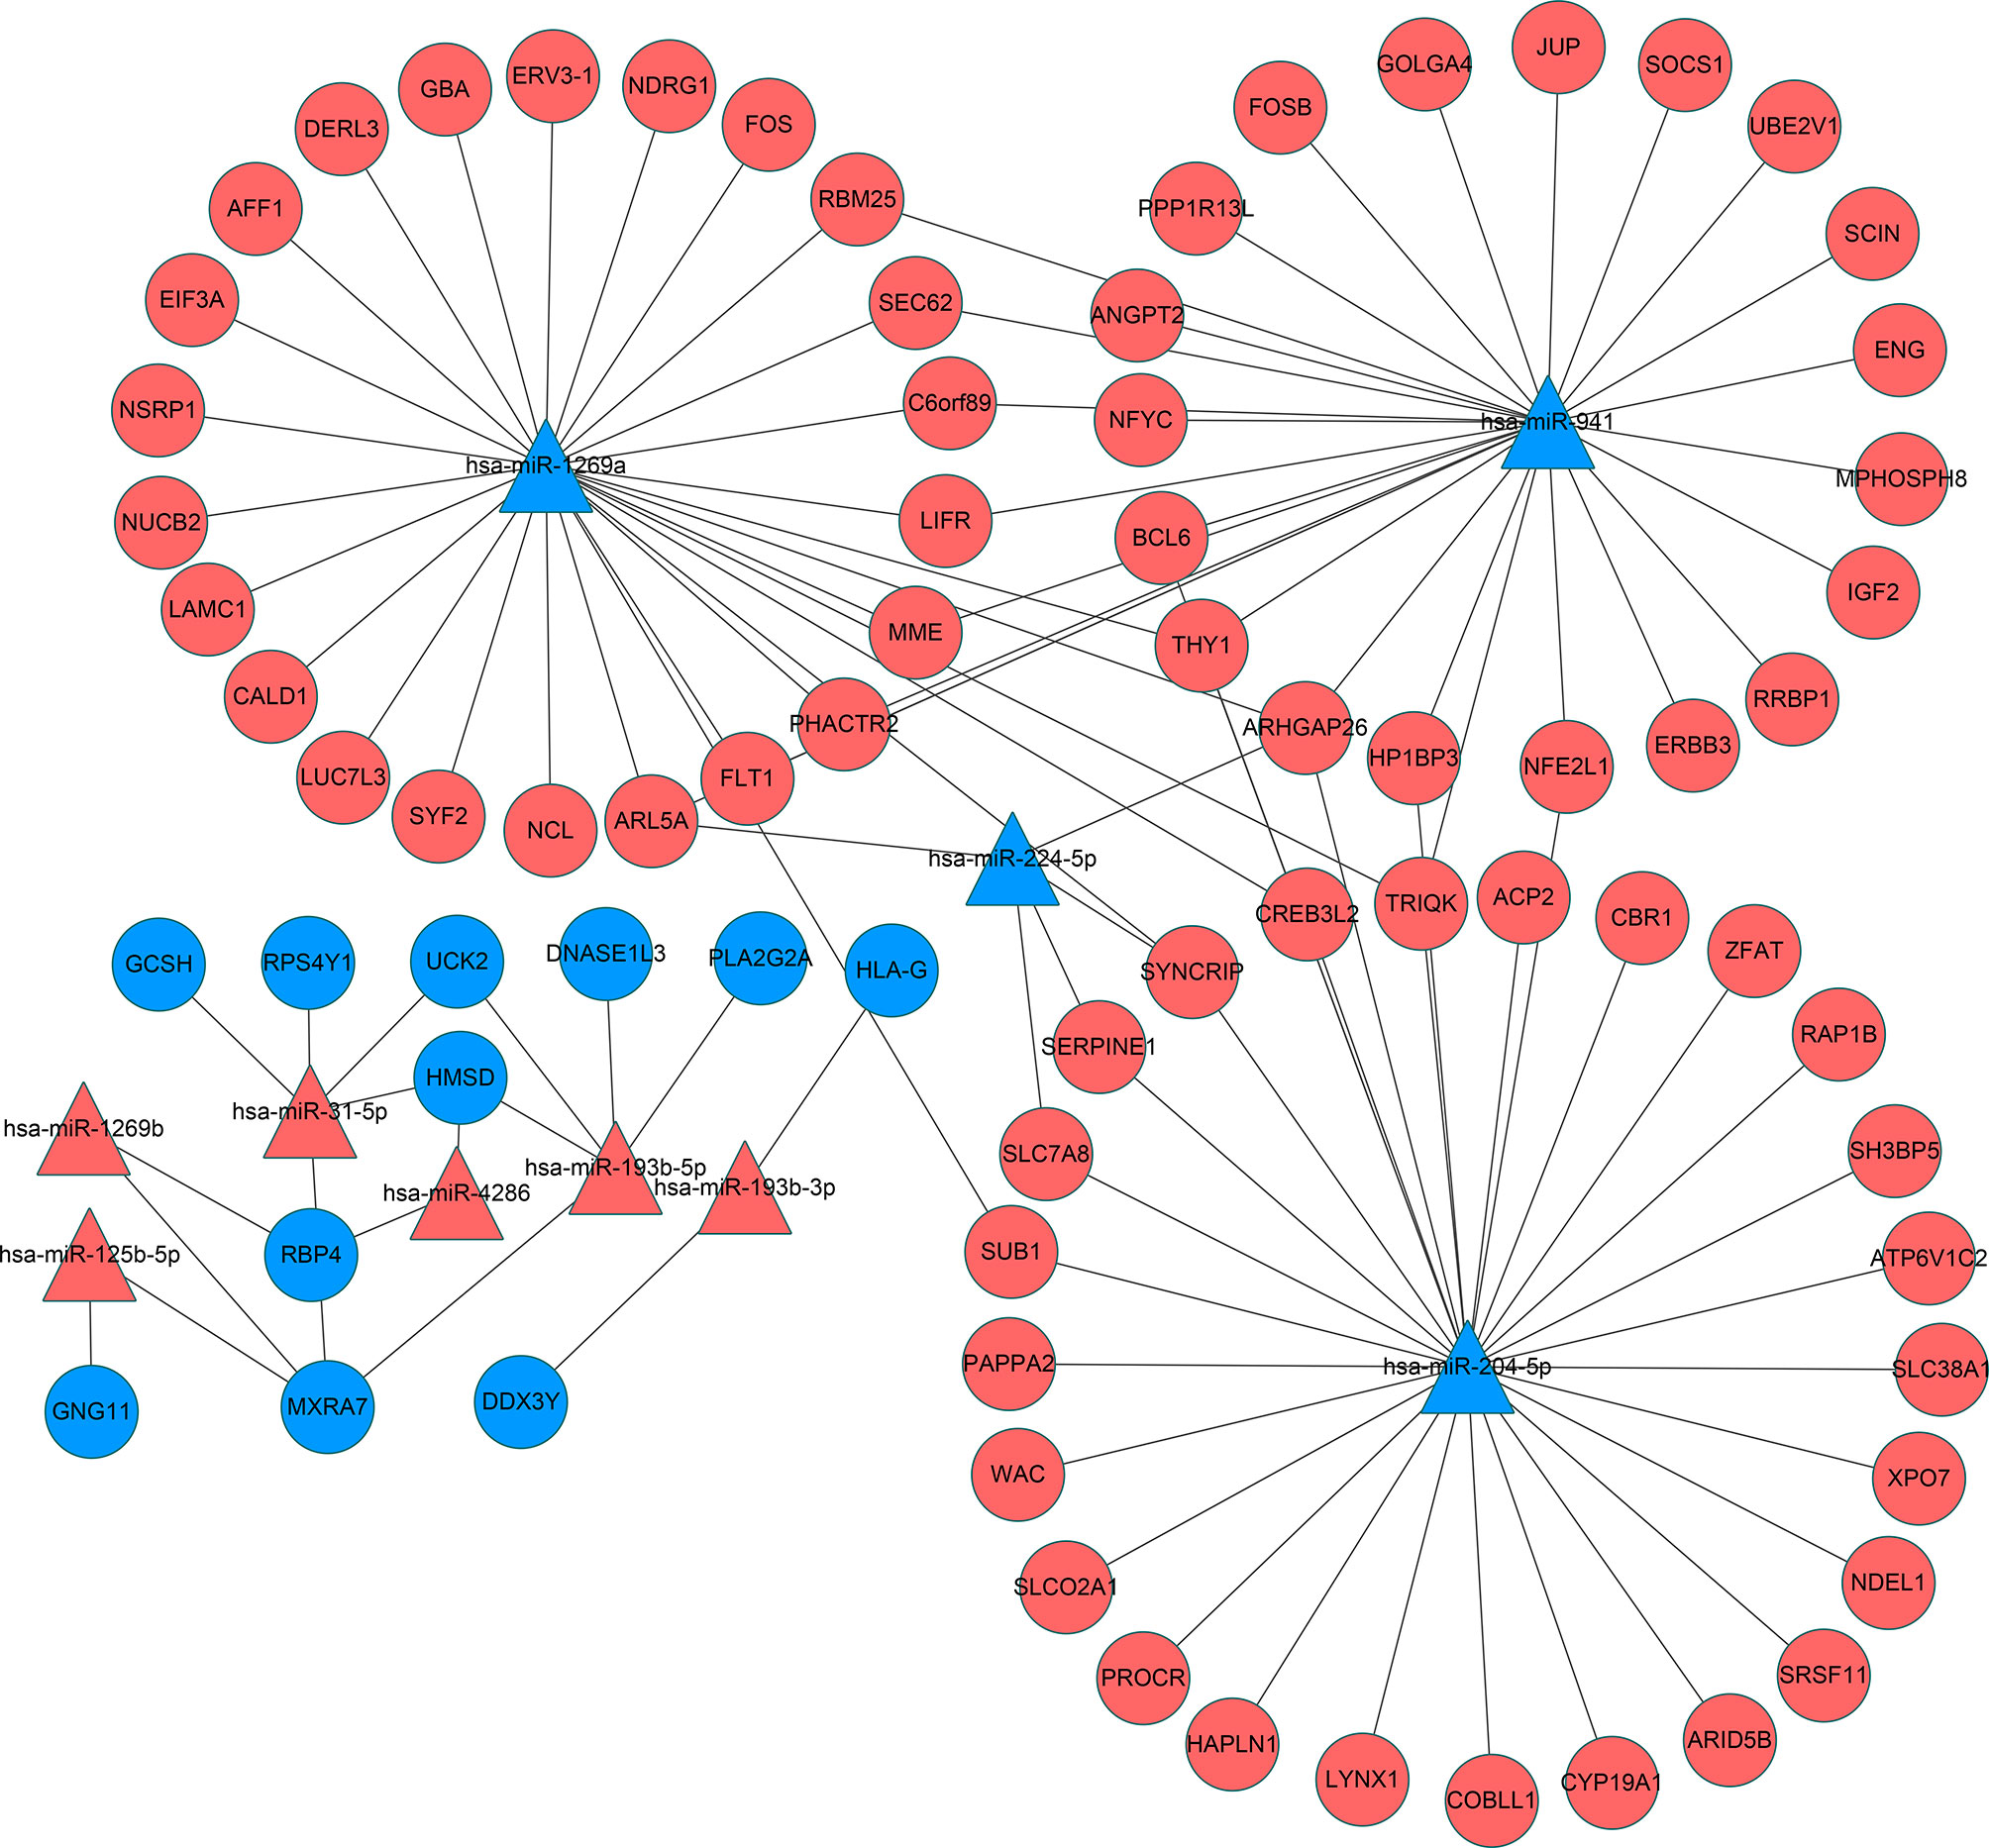
Figure 5 Interaction networks of miRNA and target DEGs in IVF-ET placenta tissues. microRNAs are represented by triangles and mRNAs are represented by circles. Red indicates genes with up-regulated expression and blue indicates genes with down-regulated expression. miRNA, microRNA; mRNA, messenger RNA; IVF-ET, in vitro fertilization-embryo transfer.
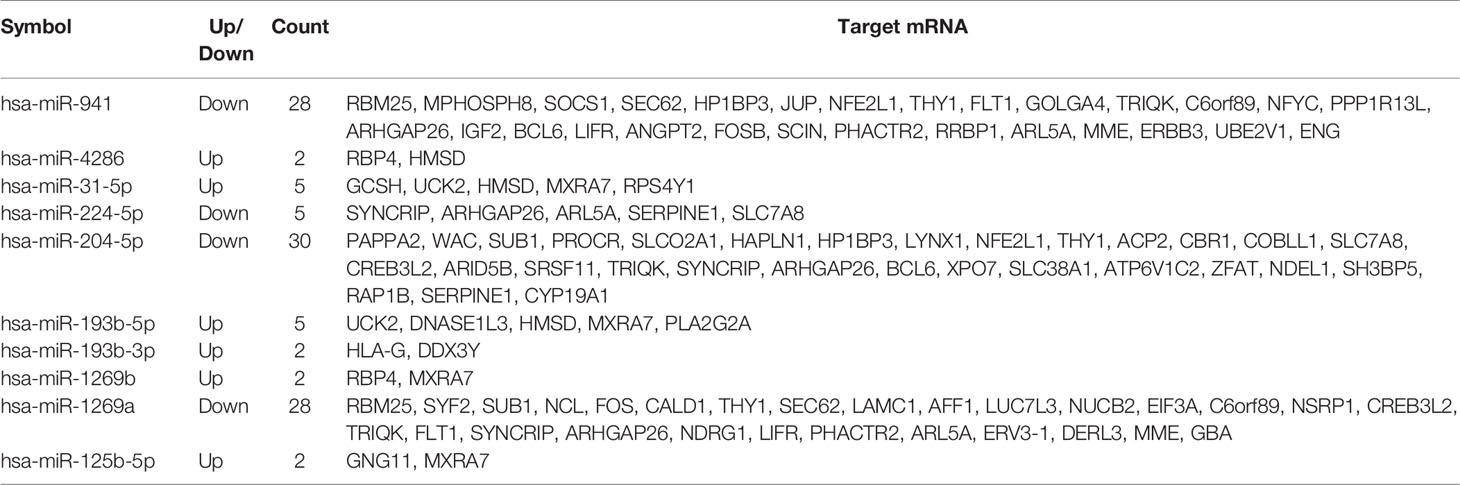
Table 5 The miRNA-mRNA network.
Functional Enrichment Analysis of the DEGs
Independent of the preceding analysis, we utilized ggplot2 and enrichment analysis to profile GO annotations and KEGG pathways associated with the differentially expressed genes. These predictions would allow an improved understanding of the functional impact of the genes dysregulated in IVF-ET. As illustrated, the top 10 enriched GO and KEGG terms are presented in categories of biological processes (BPs), cellular components (CCs), molecular functions (MFs) and defined KEGG pathway identifiers (Figure 6).
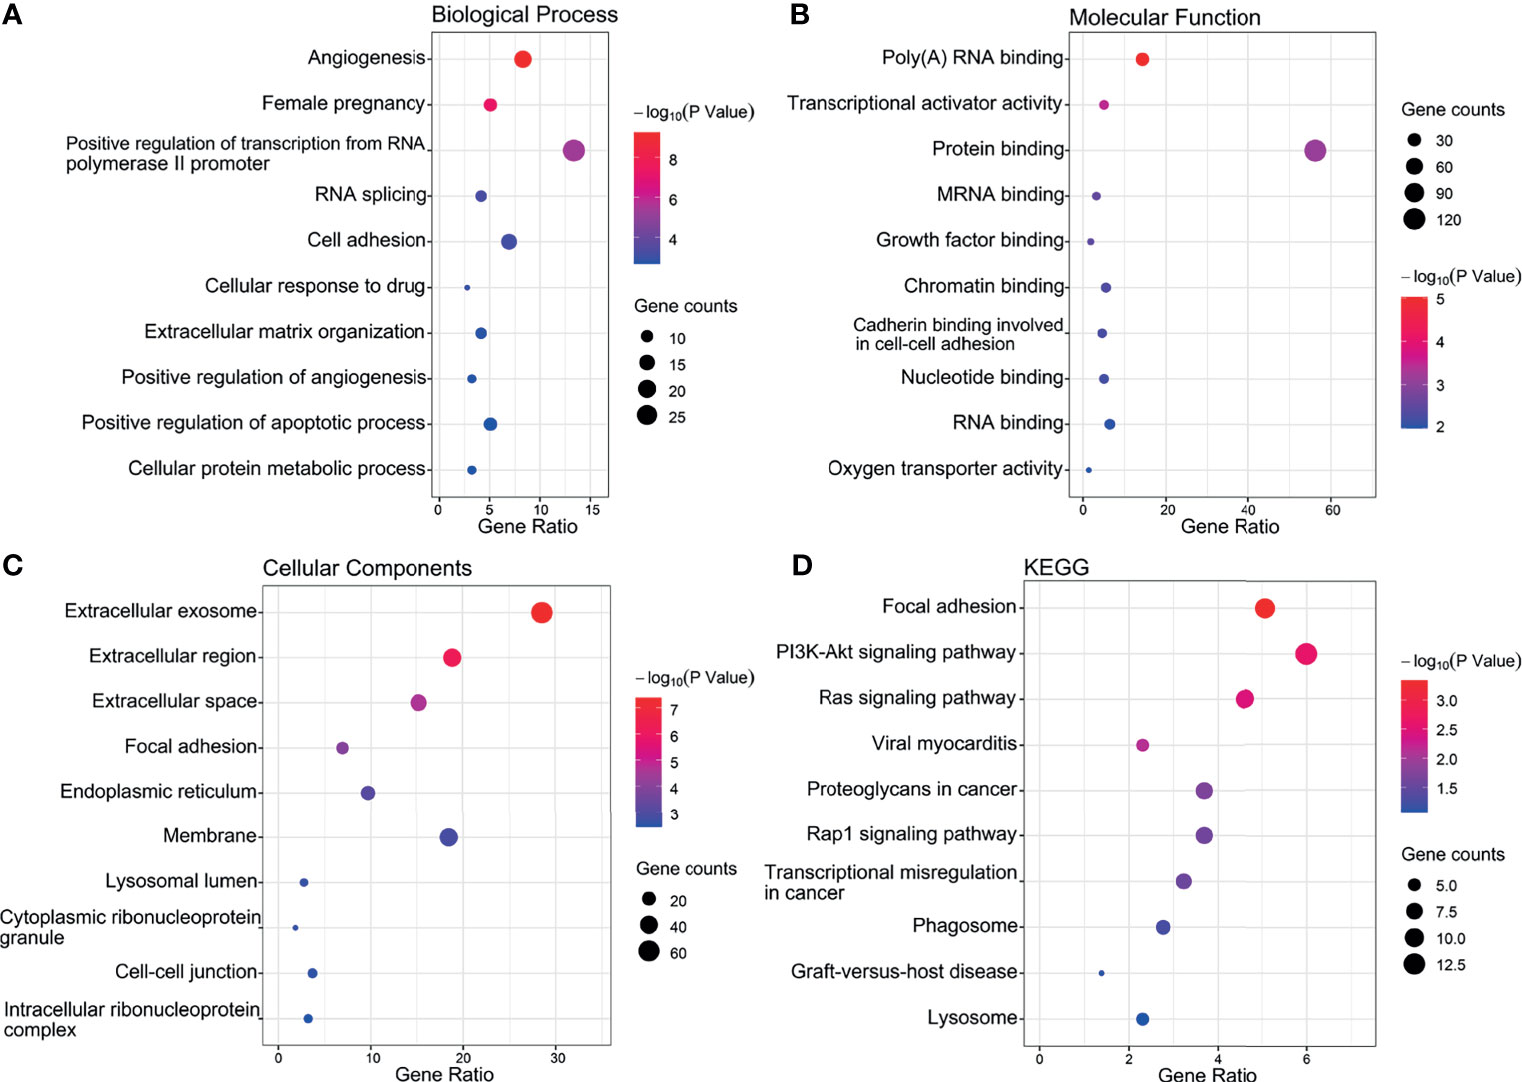
Figure 6 Top 10 significant enrichment GO and KEGG terms of DEGs. (A) BP, biological process. (B) MF, molecular function. (C) CC, cellular component. (D) KEGG, Kyoto Encyclopedia of Genes and Genomes.
Notably, this analysis revealed significant enrichment for BP entries aligned with angiogenesis, pregnancy, cell adhesion, positive regulation of transcription from the RNA polymerase II promoter and positive regulation of angiogenesis (Figure 6A). Furthermore, the protein binding, poly (A) RNA binding and transcriptional activator activity accounted for the majority of MF terms (Figure 6B) while the most enriched CCs were extracellular exosome, membrane, and extracellular region (Figure 6C). The top 10 most highly enriched KEGG classifications included the PI3K-Akt and Ras signaling pathways along with focal adhesion (Figure 6D).
Construction of Protein-Protein Interaction (PPI) Networks
Using the DEGs we next built a PPI network using the online STRING database and tools in Cytoscape. The network was mapped to a limit of 148 DEGs (Figure 7). Node size is proportional to the degree of the node itself. Edge width is proportional to the combined degree between genes. We assessed their degree of connectivity and identified 10 hub genes, and the genes are listed in Table 6.
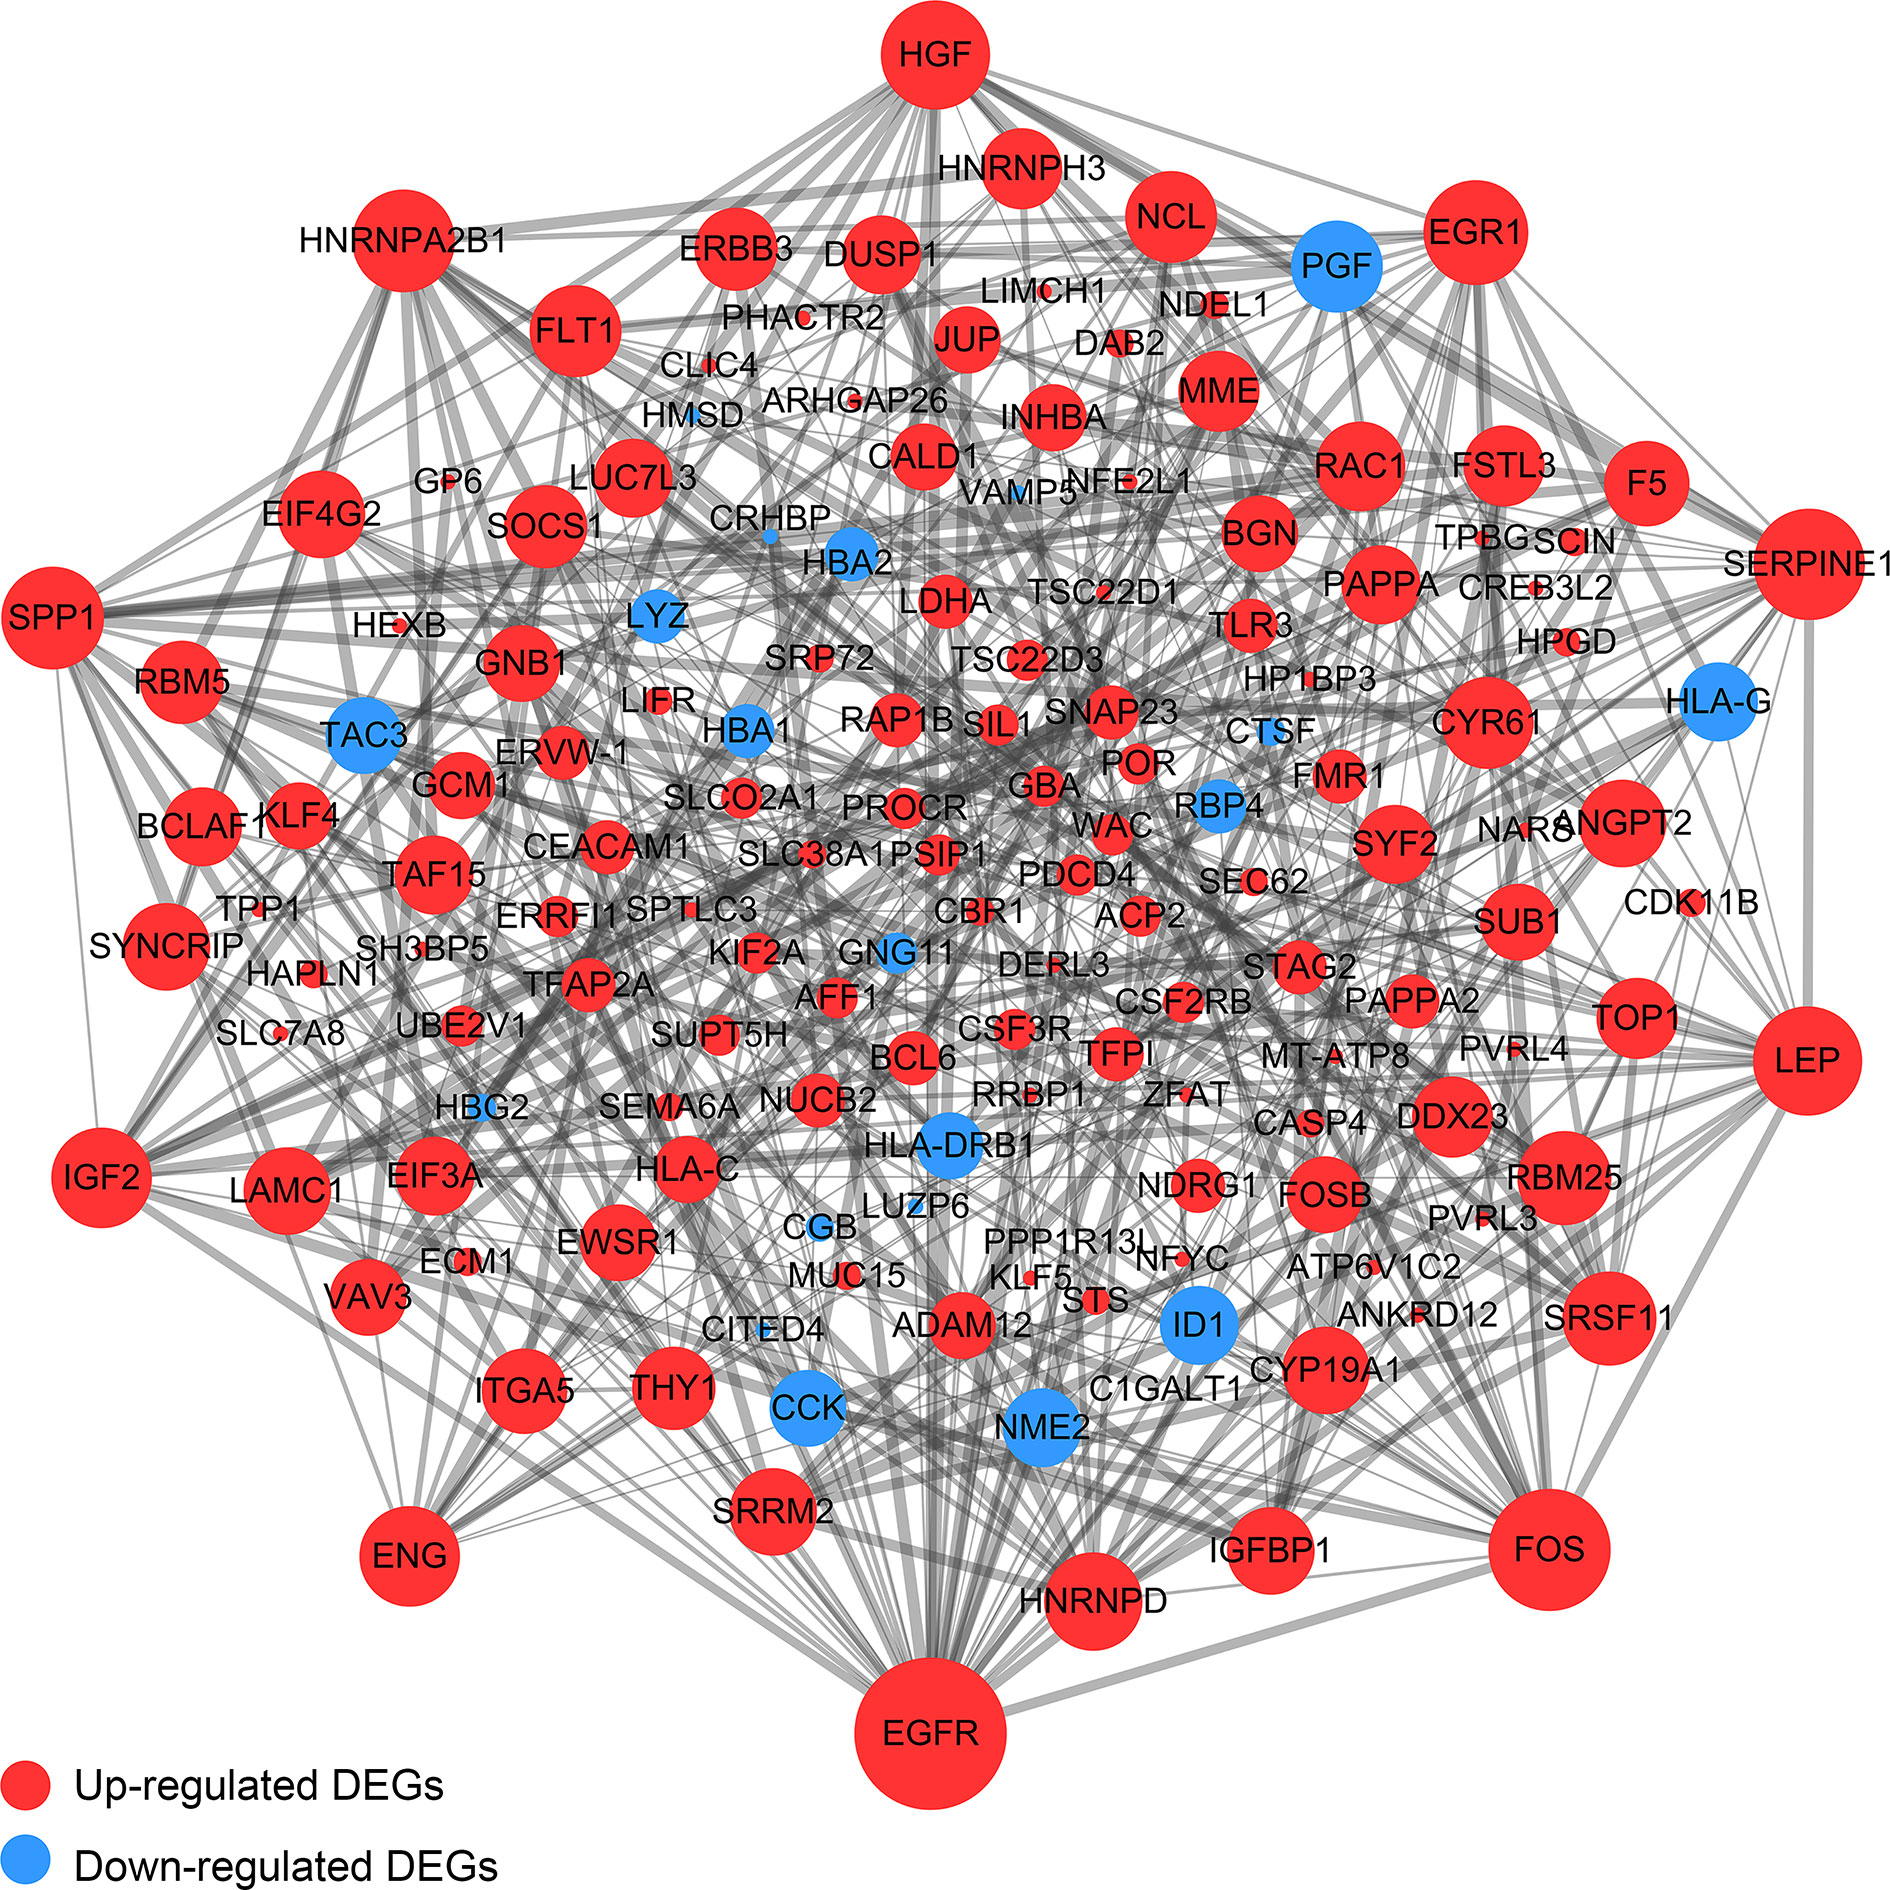
Figure 7 The PPI Network of DEGs. The upregulated genes were exhibited by the red color, while the blue color exhibited the downregulated genes. Node size is proportional to the degree of the node itself. Edge width is proportional to the combined degree between genes.
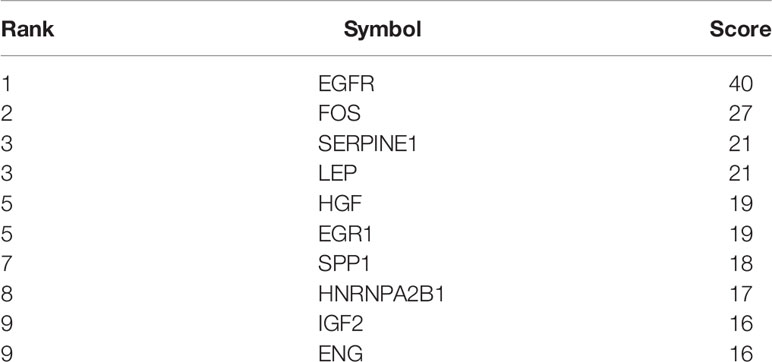
Table 6 The top 10 genes in the network are ranked in order of degree.
Biological Analysis of the Hub Genes
Highly-connected genes with a network are considered master regulatory elements otherwise known as hub genes (29). We used the cytoHubba plugin of Cytoscape to reveal the ten most strongly related interactions amongst the DEGs in IVF-ET. This approach generated 10 nodes with 37 edges with the most likely hub genes consisting of EGFR, FOS, SERPINE1, LEP, HGF, EGR1, SPP1, HNRNPA2B1, IGF2 and ENG (Figure 8A). In addition, KEGG analysis of the top 10 enrichment pathways were identified (Figures 8B, C).
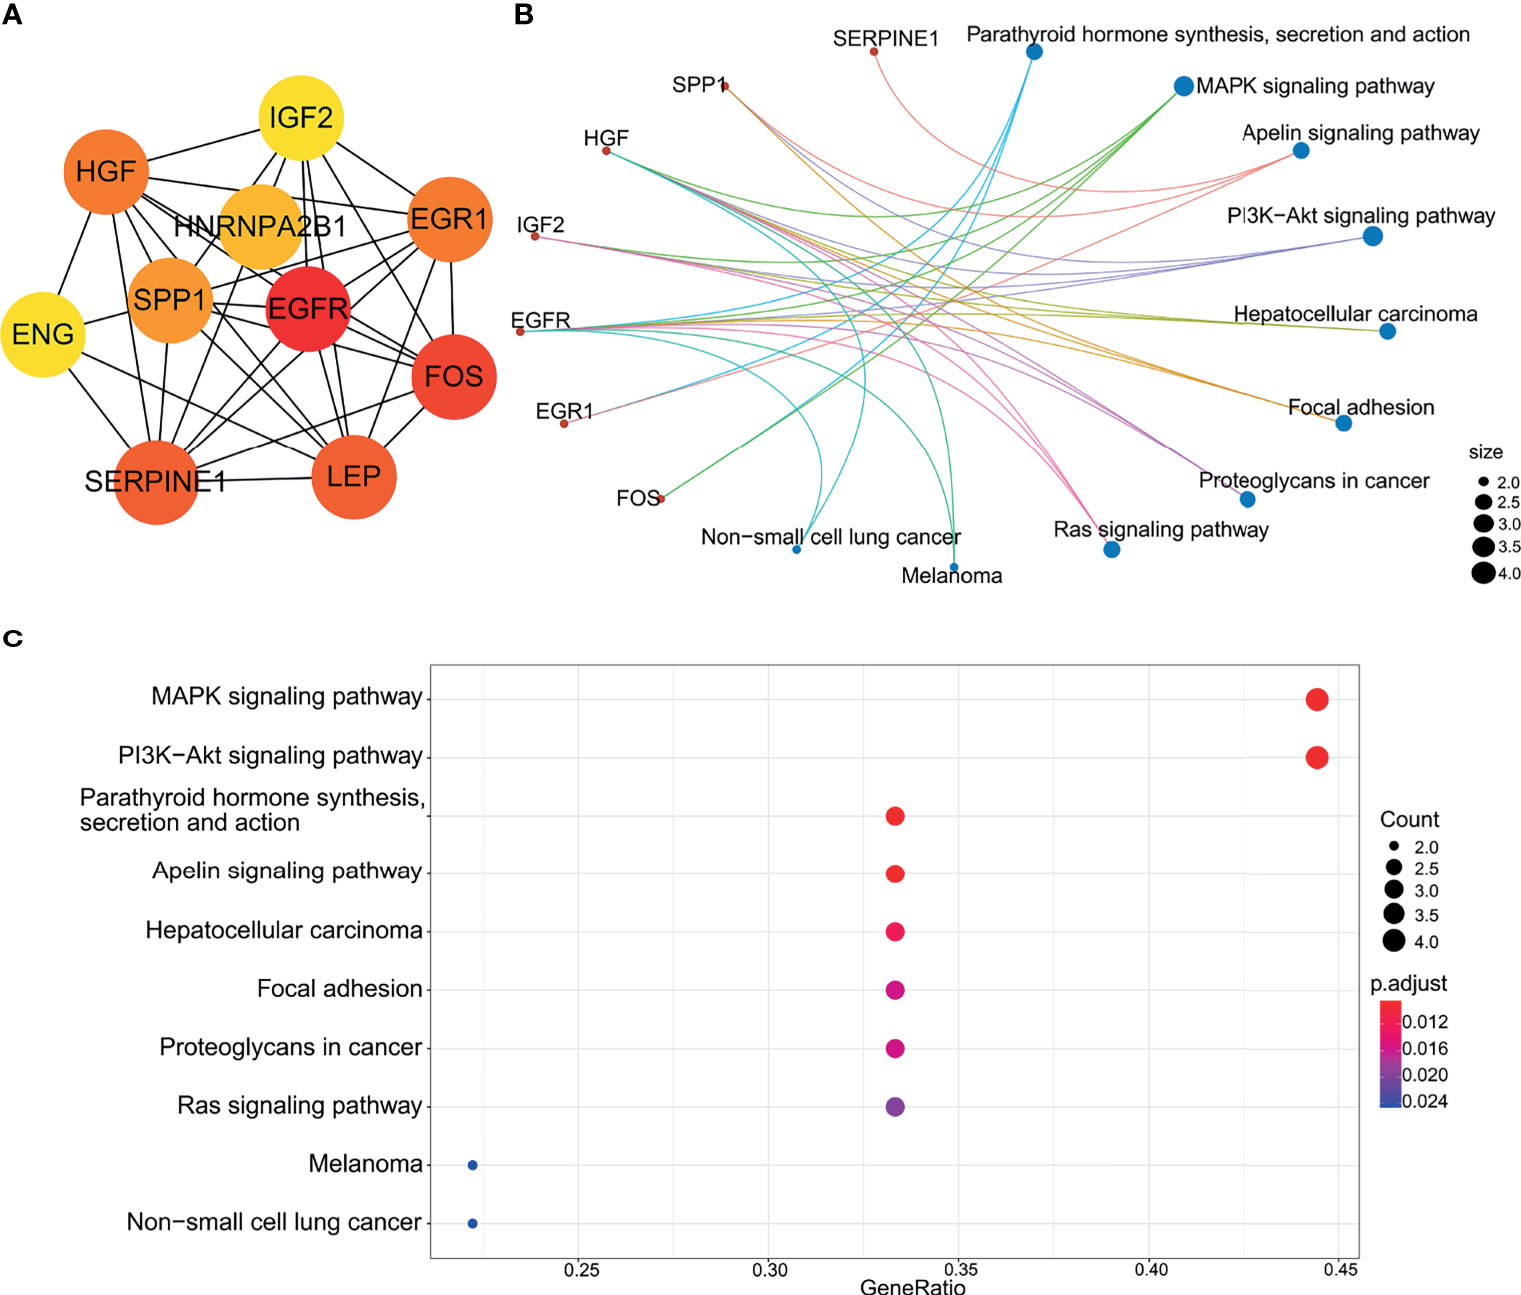
Figure 8 Biological analysis of hub genes. (A) The interaction of 10 hub genes. (B) and (C) the top 10 KEGG enrichment analysis by R language.
Discussion
As one of the main tools of ART, IVF-ET can improve the success rate of infertility treatments for many affected couples. Nonetheless, despite its use for several decades and widespread acceptance, there are still uncertainties associated with IVF-ET in terms of perinatal risks and offspring health. On this basis we hypothesized that complications associated with IVF-ET may be associated with the altered expression of genes that regulate placental development and function. Consequently, we performed genome-wide miRNA and mRNA analyses comparing placentas from IVF-ET assisted and naturally conceived pregnancies. The choice of samples from uncomplicated births was deliberate, as large gene differences from pathological births would be expected while more fundamental changes could be revealed by the experimental design used.
Foremost we considered the epigenetic regulatory mechanisms involving miRNAs as these are recognized effectors of placental-mediated complications during pregnancy (15). Indeed, there has been strong interest in miRNAs as predictive biomarkers for the detection of pathologies in pregnancy with the villous trophoblast being a major source of miRNAs found in maternal circulation (30). Such changes in circulating miRNAs would naturally reflect the changes occurring within the placenta. Our analysis produced a shortlist of 12 miRNAs that were differentially expressed in IVF-ET compared to placental tissue from natural pregnancies.
Three of the 12 differentially expressed miRNAs were confirmed in an independent cohort to be specifically downregulated in IVF-ET placentas, i.e., hsa-miR-204-5p, hsa-miR-1269a and hsa-miR-941. Notably, all three microRNAs have been previously implicated in placental dysfunction and potential fetal growth complications although the underlying mechanisms generally remain unclear. The downregulation of miR-204-5p is associated with fetal growth abnormalities and is enriched in related biological pathways and has also been found to be regulated in the presence of adverse pregnancy-related outcomes (31). For instance, miR-204-5p can inhibit angiogenesis by regulating pro-angiogenic genes such as ANGPT1 and members of the VEGF family (32). miR-1269a was found to be a risk factor for ectopic pregnancy, and currently known risk factors include assisted reproductive technologies such as in vitro artificial insemination and hormonal stimulation (33). It has also been suggested that miR-941 is expressed in trophoblast cells and involved in insulin-related intracellular signaling pathways such as Wnt signaling, phosphoinositide-3-kinase, TGF-β signaling, and PPAR-gamma (34). In addition, miR-941 has been shown to target Keap1 to activate the Nrf2 signaling pathway, which in turn protects human endometrial cells from oxygen and glucose deprivation-re-oxygenation induced oxidative stress and programmed necrosis (35). These correlates provide a compelling rationale for the functional significance of these miRNAs in IVF-ET fetal growth.
Given the central importance of miRNA expression in the execution of the transcriptional programs, we predicted transcription factors that might regulate these DEmiRs. The top ranked transcription factor was specificity protein 1 (SP1), a zinc finger transcription factor that binds to a variety of GC-rich motifs and regulates the expression and function of miRNAs as well as the expression of genes associated with embryonic development and differentiation (36, 37). SP1 has been shown to regulate the placental glucocorticoid barrier by repressing the expression of 11β-hydroxysteroid dehydrogenase type 2, leading to fetal growth restriction (FGR) (38). One study identified the interaction of miR-331-3p with SP1 and the interaction of miR-331-3p and miR-1908-5p with glycosyltransferases as a novel mechanism for ABO blood group regulation (39). The second ranked hit in the TF analysis was EGR1 which has been previously implicated in follicular development, ovulation, corpus luteum formation and placental angiogenesis (40), and plays a key role in placental implantation (41). Notably, EGR1 was also identified in the construction of the PPI network.
Here we screened key genes altered in IVF-ET placental tissue based on mRNA next-generation sequencing data and online tools to identify ten hub genes. Among these, EGFR signals through Src- and ERK-mediated pathways activated by VEGFR2. Placental trophoblast cells are enriched in EGFR (42) and activation of EGFR regulates the proliferation, migration and invasive capacity of extravillous trophoblast cells (43). FOS is another molecule involved in angiogenesis. FOS belongs to the transcription factor-activated protein 1 (AP-1) superfamily, which is responsible for a variety of cellular processes, including proliferation, differentiation, apoptosis, hypoxia, angiogenesis and steroidogenesis (44, 45), as demonstrated in trophoblast cells (46). LEP, an important metabolic hormone, is highly expressed in the placenta and regulates placental, fetal growth and angiogenesis (47). SPP1, also called osteopontin (OPN), is located in the cytoplasm of placental syncytiotrophoblast and capillary endothelial cells and is considered a marker of placental bed remodeling. Placental development occurs in a hypoxic environment and can stimulate angiogenesis through upregulation of the vascular endothelial growth factor inhibitor of fibrinolytic plasminogen activator 1 (SERPINE1) (48).
Considering the important role of these key genes in placental development and angiogenesis, it was instructive to consider how these gene networks were impacted by altered miRNA expression. We used the intersection of miRNA and mRNA sequencing data to construct a microRNA-mRNA network. This analysis revealed more complexity in predicted interactions for the downregulated DeMiRs compared to their upregulated counterparts. Indeed, the downregulated DeMiRs display a far more extensive repertoire of target genes, particularly, hsa-miR-204-5p, hsa-miR-1269a and hsa-miR-941, for which, as discussed above, have tangible functional links to different aspects of placental regulation. Nonetheless, more work is needed to determine which gene targets are most functionally important but further understanding of the underlying mechanisms may help to reduce pregnancy complications and improve offspring safety.
Our current study has its limitations. The discovery cohort was small and we only validated selected miRNAs in the placentas of 8 IVF-ET assisted conception patients and 8 normal controls, which may reduce the reliability of our findings. Moreover, while we were diligent to sex match the placentals and minimize sampling bias by location, placental tissue is known to be divided into maternal, intermediate and fetal zones with different gene expression profiles (49) and inter-placental differences are inevitable. Moreover, the molecular interactions and proposed functional relationships proposed by the bioinformatic analyses need formal verification in both experimental and clinical settings. Thus, more work is needed to explore the specific functions of differentially expressed genes in IVF-ET placentas and their mechanisms.
Conclusions
In summary, we constructed a miRNA-mRNA regulatory network to regulate the expression of genes essential for IVF-ET placental development and function using bioinformatic analysis. Our data reveal both previously identified miRNAs and mRNAs associated with placental dysfunction and pregnancy complications along with novel candidates. As such these data represent a ready resource for subsequent investigations into the effects of IVF-ET on placental development and function and may provide a basis for future prevention and treatment of adverse perinatal outcomes.
Data Availability Statement
The data presented in the study is deposited in the NCBI repository, accession number GSE186149.
Ethics Statement
Tissue collection was approved by the Ethics Committee of the Third Affiliated Hospital of Zhengzhou University. The patients/participants provided their written informed consent to participate in this study. Written informed consent was obtained from the individual(s) for the publication of any potentially identifiable images or data included in this article.
Author Contributions
SY conducted the majority of the experiments and prepared the manuscript. WZ, MM, and SS were involved in the analysis and interpretation of the data. CY, RZ, NZ, SR, and HW collected samples of placenta and clinical data. RT contributed to the revision and critical discussion of the article. YG was engaged in research design, article drafting and critical discussion. All authors contributed to the article and approved the submitted version.
Funding
This work was supported by the Henan Province Science and Technology Tackling Plan awarded to YG (Grant no. 202102310061) with further funding support from the State Key Laboratory of Reproductive Medicine, Nanjing Medical University awarded to YG (Grant no. SKLRM-K201902 and SKLRM-K201903).
Conflict of Interest
The authors declare that the research was conducted in the absence of any commercial or financial relationships that could be construed as a potential conflict of interest.
Publisher’s Note
All claims expressed in this article are solely those of the authors and do not necessarily represent those of their affiliated organizations, or those of the publisher, the editors and the reviewers. Any product that may be evaluated in this article, or claim that may be made by its manufacturer, is not guaranteed or endorsed by the publisher.
Acknowledgments
The authors thank the participants who contributed to this study together with the clinical members involved in the care of our patients.
Supplementary Material
The Supplementary Material for this article can be found online at: https://www.frontiersin.org/articles/10.3389/fendo.2021.774997/full#supplementary-material
References
1. Kushnir VA, Barad DH, Albertini DF, Darmon SK, Gleicher N. Systematic Review of Worldwide Trends in Assisted Reproductive Technology 2004-2013. Reprod Biol Endocrinol (2017) 15(1):6. doi: 10.1186/s12958-016-0225-2
2. Levine AD, Boulet SL, Kissin DM. Contribution of Assisted Reproductive Technologyto Overall Births by Maternal Age in the UnitedStates, 2012-2014. JAMA (2017) 317(12):1272–3. doi: 10.1001/jama.2016.21311
3. Lv H, Diao F, Du J, Chen T, Meng Q, Ling X, et al. Assisted Reproductive Technology and Birth Defects in a Chinese Birth Cohort Study. Lancet Regional Health - Western Pacific (2021) 7:100090. doi: 10.1016/j.lanwpc.2020.100090
4. Nejat EJ, Buyuk E. Reproductive Technologies and the Risk of Birth Defects. N Engl J Med (2012) 367(9):875; author reply 875–6. doi: 10.1056/NEJMc1206859
5. Wei SQ, Bilodeau-Bertrand M, Lo E, Auger N. Effect of Publicly Funded Assisted Reproductive Technology on Maternal and Infant Outcomes: A Pre- and Post-Comparison Study. Hum Reprod (2021) 36(1):219–28. doi: 10.1093/humrep/deaa270
6. Imudia AN, Awonuga AO, Doyle JO, Kaimal AJ, Wright DL, Toth TL, et al. Peak Serum Estradiol Level During Controlled Ovarian Hyperstimulation Is Associated With Increased Risk of Small for Gestational Age and Preeclampsia in Singleton Pregnancies After In Vitro Fertilization. Fertil Steril (2012) 97(6):1374–9. doi: 10.1016/j.fertnstert.2012.03.028
7. Romundstad LB, Romundstad PR, Sunde A, von During V, Skjaerven R, Vatten LJ. Increased Risk of Placenta Previa in Pregnancies Following IVF/ICSI; A Comparison of ART and Non-ART Pregnancies in the Same Mother. Hum Reprod (2006) 21(9):2353–8. doi: 10.1093/humrep/del153
8. Johnson KM, Hacker MR, Thornton K, Young BC, Modest AM. Association Between In Vitro Fertilization and Ischemic Placental Disease by Gestational Age. Fertil Steril (2020) 114(3):579–86. doi: 10.1016/j.fertnstert.2020.04.029
9. Heo JS, Lee HJ, Lee MH, Choi CW. Comparison of Neonatal Outcomes of Very Low Birth Weight Infants by Mode of Conception: In Vitro Fertilization Versus Natural Pregnancy. Fertil Steril (2019) 111(5):962–70. doi: 10.1016/j.fertnstert.2019.01.014
10. Yang X, Li Y, Li C, Zhang W. Current Overview of Pregnancy Complications and Live-Birth Outcome of Assisted Reproductive Technology in Mainland China. Fertil Steril (2014) 101(2):385–91. doi: 10.1016/j.fertnstert.2013.10.017
11. Hansen M, Kurinczuk JJ, Milne E, de Klerk N, Bower C. Assisted Reproductive Technology and Birth Defects: A Systematic Review and Meta-Analysis. Hum Reprod Update (2013) 19(4):330–53. doi: 10.1093/humupd/dmt006
12. Santamaria X, Taylor H. MicroRNA and Gynecological Reproductive Diseases. Fertil Steril (2014) 101(6):1545–51. doi: 10.1016/j.fertnstert.2014.04.044
13. Fasanaro P, Greco S, Ivan M, Capogrossi MC, Martelli F. microRNA: Emerging Therapeutic Targets in Acute Ischemic Diseases. Pharmacol Ther (2010) 125(1):92–104. doi: 10.1016/j.pharmthera.2009.10.003
14. Mayor-Lynn K, Toloubeydokhti T, Cruz AC, Chegini N. Expression Profile of microRNAs and mRNAs in Human Placentas From Pregnancies Complicated by Preeclampsia and Preterm Labor. Reprod Sci (2011) 18(1):46–56. doi: 10.1177/1933719110374115
15. Fu G, Brkic J, Hayder H, Peng C. MicroRNAs in Human Placental Development and Pregnancy Complications. Int J Mol Sci (2013) 14(3):5519–44. doi: 10.3390/ijms14035519
16. Vaiman D. Genes, Epigenetics and miRNA Regulation in the Placenta. Placenta (2017) 52:127–33. doi: 10.1016/j.placenta.2016.12.026
17. Su MT, Tsai PY, Tsai HL, Chen YC, Kuo PL. miR-346 and miR-582-3p-Regulated EG-VEGF Expression and Trophoblast Invasion via Matrix Metalloproteinases 2 and 9. Biofactors (2017) 43(2):210–9. doi: 10.1002/biof.1325
18. Gu Y, Ampofo E, Menger MD, Laschke MW. miR-191 Suppresses Angiogenesis by Activation of NF-KappaB Signaling. FASEB J (2017) 31(8):3321–33. doi: 10.1096/fj.201601263R
19. Li P, Guo W, Du L, Zhao J, Wang Y, Liu L, et al. microRNA-29b Contributes to Pre-Eclampsia Through Its Effects on Apoptosis, Invasion and Angiogenesis of Trophoblast Cells. Clin Sci (Lond) (2013) 124(1):27–40. doi: 10.1042/CS20120121
20. Luo M, Weng Y, Tang J, Hu M, Liu Q, Jiang F, et al. MicroRNA-450a-3p Represses Cell Proliferation and Regulates Embryo Development by Regulating Bub1 Expression in Mouse. PLoS One (2012) 7(10):e47914. doi: 10.1371/journal.pone.0047914
21. Pathan M, Keerthikumar S, Chisanga D, Alessandro R, Ang CS, Askenase P, et al. A Novel Community Driven Software for Functional Enrichment Analysis of Extracellular Vesicles Data. J Extracell Vesicles (2017) 6(1):1321455. doi: 10.1080/20013078.2017.1321455
22. Pathan M, Keerthikumar S, Ang CS, Gangoda L, Quek CY, Williamson NA, et al. FunRich: An Open Access Standalone Functional Enrichment and Interaction Network Analysis Tool. Proteomics (2015) 15(15):2597–601. doi: 10.1002/pmic.201400515
23. Zhou J, Hui X, Mao Y, Fan L. Identification of Novel Genes Associated With a Poor Prognosis in Pancreatic Ductal Adenocarcinoma via a Bioinformatics Analysis. Biosci Rep (2019) 39(8):BSR20190625. doi: 10.1042/BSR20190625
24. Smoot ME, Ono K, Ruscheinski J, Wang PL, Ideker T. Cytoscape 2.8: New Features for Data Integration and Network Visualization. Bioinformatics (2011) 27(3):431–2. doi: 10.1093/bioinformatics/btq675
25. Szklarczyk D, Franceschini A, Wyder S, Forslund K, Heller D, Huerta-Cepas J, et al. STRING V10: Protein-Protein Interaction Networks, Integrated Over the Tree of Life. Nucleic Acids Res (2015) 43(Database issue):D447–52. doi: 10.1093/nar/gku1003
26. Su G, Morris JH, Demchak B, Bader GD. Biological Network Exploration With Cytoscape 3. Curr Protoc Bioinf (2014) 47:8.13.1–8.13.24. doi: 10.1002/0471250953.bi0813s47
27. Chang S, Chen W, Yang J. Another Formula for Calculating the Gene Change Rate in Real-Time RT-PCR. Mol Biol Rep (2009) 36(8):2165–8. doi: 10.1007/s11033-008-9430-1
28. Oliveira AC, Bovolenta LA, Nachtigall PG, Herkenhoff ME, Lemke N, Pinhal D. Combining Results From Distinct MicroRNA Target Prediction Tools Enhances the Performance of Analyses. Front Genet (2017) 8:59. doi: 10.3389/fgene.2017.00059
29. Yu D, Lim J, Wang X, Liang F, Xiao G. Enhanced Construction of Gene Regulatory Networks Using Hub Gene Information. BMC Bioinf (2017) 18(1):186. doi: 10.1186/s12859-017-1576-1
30. Morales-Prieto DM, Ospina-Prieto S, Schmidt A, Chaiwangyen W, Markert UR. Elsevier Trophoblast Research Award Lecture: Origin, Evolution and Future of Placenta miRNAs. Placenta (2014) 35 Suppl:S39–45. doi: 10.1016/j.placenta.2013.11.017
31. Rodosthenous RS, Burris HH, Sanders AP, Just AC, Dereix AE, Svensson K, et al. Second Trimester Extracellular microRNAs in Maternal Blood and Fetal Growth: An Exploratory Study. Epigenetics (2017) 12(9):804–10. doi: 10.1080/15592294.2017.1358345
32. Chen X, Mangala LS, Mooberry L, Bayraktar E, Dasari SK, Ma S, et al. Identifying and Targeting Angiogenesis-Related microRNAs in Ovarian Cancer. Oncogene (2019) 38(33):6095–108. doi: 10.1038/s41388-019-0862-y
33. Zhang S, Sun Q, Jiang X, Gao F. Clinical Significance of Expression of Hsa-Mir-1247 and Hsa-Mir-1269a in Ectopic Pregnancy Due to Salpingitis. Exp Ther Med (2018) 15(6):4901–5. doi: 10.3892/etm.2018.5998
34. Hu HY, He L, Fominykh K, Yan Z, Guo S, Zhang X, et al. Evolution of the Human-Specific microRNA miR-941. Nat Commun (2012) 3(1):1145. doi: 10.1038/ncomms2146
35. Li SP, Cheng WN, Li Y, Xu HB, Han H, Li P, et al. Keap1-Targeting microRNA-941 Protects Endometrial Cells From Oxygen and Glucose Deprivation-Re-Oxygenation via Activation of Nrf2 Signaling. Cell Commun Signal (2020) 18(1):32. doi: 10.1186/s12964-020-0526-0
36. Marin M, Karis A, Visser P, Grosveld F, Philipsen S. Transcription Factor Sp1 Is Essential for Early Embryonic Development But Dispensable for Cell Growth and Differentiation. Cell (1997) 89(4):619–28. doi: 10.1016/s0092-8674(00)80243-3
37. Thomas K, Wu J, Sung DY, Thompson W, Powell M, McCarrey J, et al. SP1 Transcription Factors in Male Germ Cell Development and Differentiation. Mol Cell Endocrinol (2007) 270(1-2):1–7. doi: 10.1016/j.mce.2007.03.001
38. Fan F, Shen W, Wu S, Chen N, Tong X, Wang F, et al. Sp1 Participates in the Cadmium-Induced Imbalance of the Placental Glucocorticoid Barrier by Suppressing 11beta-HSD2 Expression. Environ Pollut (2020) 261:113976. doi: 10.1016/j.envpol.2020.113976
39. Kronstein-Wiedemann R, Nowakowska P, Milanov P, Gubbe K, Seifried E, Bugert P, et al. Regulation of ABO Blood Group Antigen Expression by miR-331-3p and miR-1908-5p During Hematopoietic Stem Cell Differentiation. Stem Cells (2020) 38(10):1348–62. doi: 10.1002/stem.3251
40. Guo B, Tian XC, Li DD, Yang ZQ, Cao H, Zhang QL, et al. Expression, Regulation and Function of Egr1 During Implantation and Decidualization in Mice. Cell Cycle (2014) 13(16):2626–40. doi: 10.4161/15384101.2014.943581
41. Yang W, Lu Z, Zhi Z, Liu L, Deng L, Jiang X, et al. Increased miRNA-518b Inhibits Trophoblast Migration and Angiogenesis by Targeting EGR1 in Early Embryonic Arrest. Biol Reprod (2019) 101(4):664–74. doi: 10.1093/biolre/ioz109/5530751
42. Clemente L, Boeldt DS, Grummer MA, Morita M, Morgan TK, Wiepz GJ, et al. Adenoviral Transduction of EGFR Into Pregnancy-Adapted Uterine Artery Endothelial Cells Remaps Growth Factor Induction of Endothelial Dysfunction. Mol Cell Endocrinol (2020) 499:110590. doi: 10.1016/j.mce.2019.110590
43. Denison FC, Battersby S, King AE, Szuber M, Jabbour HN. Prokineticin-1: A Novel Mediator of the Inflammatory Response in Third-Trimester Human Placenta. Endocrinology (2008) 149(7):3470–7. doi: 10.1210/en.2007-1695
44. Choi Y, Rosewell KL, Brannstrom M, Akin JW, Curry TE Jr., Jo M. FOS, a Critical Downstream Mediator of PGR and EGF Signaling Necessary for Ovulatory Prostaglandins in the Human Ovary. J Clin Endocrinol Metab (2018) 103(11):4241–52. doi: 10.1210/jc.2017-02532
45. Preston GA, Lyon TT, Yin Y, Lang JE, Solomon G, Annab L, et al. Induction of Apoptosis by C-Fos Protein. Mol Cell Biol (1996) 16(1):211–8. doi: 10.1128/mcb.16.1.211
46. Renaud SJ, Kubota K, Rumi MA, Soares MJ. The FOS Transcription Factor Family Differentially Controls Trophoblast Migration and Invasion. J Biol Chem (2014) 289(8):5025–39. doi: 10.1074/jbc.M113.523746
47. Ashworth CJ, Hoggard N, Thomas L, Mercer JG, Wallace JM, Lea RG. Placental Leptin. Rev Reprod (2000) 5(1):18–24. doi: 10.1530/ror.0.0050018
48. Delforce SJ, Lumbers ER, Morosin SK, Wang Y, Pringle KG. The Angiotensin II Type 1 Receptor Mediates the Effects of Low Oxygen on Early Placental Angiogenesis. Placenta (2019) 75:54–61. doi: 10.1016/j.placenta.2018.12.001
Keywords: in vitro fertilization-embryo transfer, placenta, differentially expressed genes, MiRNA-mRNA, next-generation sequencing
Citation: Yang S, Zheng W, Yang C, Zu R, Ran S, Wu H, Mu M, Sun S, Zhang N, Thorne RF and Guan Y (2021) Integrated Analysis of Hub Genes and MicroRNAs in Human Placental Tissues from In Vitro Fertilization-Embryo Transfer. Front. Endocrinol. 12:774997. doi: 10.3389/fendo.2021.774997
Received: 13 September 2021; Accepted: 22 October 2021;
Published: 11 November 2021.
Edited by:
Claus Yding Andersen, University of Copenhagen, DenmarkCopyright © 2021 Yang, Zheng, Yang, Zu, Ran, Wu, Mu, Sun, Zhang, Thorne and Guan. This is an open-access article distributed under the terms of the Creative Commons Attribution License (CC BY). The use, distribution or reproduction in other forums is permitted, provided the original author(s) and the copyright owner(s) are credited and that the original publication in this journal is cited, in accordance with accepted academic practice. No use, distribution or reproduction is permitted which does not comply with these terms.
*Correspondence: Rick F. Thorne, cmljay50aG9ybmVAbmV3Y2FzdGxlLmVkdS5hdQ==; Yichun Guan, bGlzYW1heWd1YW5AMTYzLmNvbQ==