
95% of researchers rate our articles as excellent or good
Learn more about the work of our research integrity team to safeguard the quality of each article we publish.
Find out more
ORIGINAL RESEARCH article
Front. Endocrinol. , 06 October 2021
Sec. Obesity
Volume 12 - 2021 | https://doi.org/10.3389/fendo.2021.728593
This article is part of the Research Topic Endocrine Adaptations Associated with Obesity: The Crosstalk Amongst Skeletal Muscle, Adipose tissue and Bone View all 6 articles
 Matthew D. Barberio1,2
 G. Lynis Dohm3Walter J. Pories4Natalie A. Gadaleta2Joseph A. Houmard5Evan P. Nadler6
 Monica J. Hubal1,7*
Introduction: Roux-en-Y gastric bypass (RYGB) is an effective treatment for type 2 diabetes mellitus (T2DM) that can result in remission of clinical symptoms, yet mechanisms for improved skeletal muscle health are poorly understood. We sought to define the impact of existing T2DM on RYGB-induced muscle transcriptome changes.
Methods: Vastus lateralis biopsy transcriptomes were generated pre- and 1-year post-RYGB in black adult females with (T2D; n = 5, age = 51 ± 6 years, BMI = 53.0 ± 5.8 kg/m2) and without (CON; n = 7, 43 ± 6 years, 51.0 ± 9.2 kg/m2) T2DM. Insulin, glucose, and HOMA-IR were measured in blood at the same time points. ANCOVA detected differentially expressed genes (p < 0.01, fold change < |1.2|), which were used to identify enriched biological pathways.
Results: Pre-RYGB, 95 probes were downregulated with T2D including subunits of mitochondrial complex I. Post-RYGB, the T2D group had normalized gene expression when compared to their non-diabetic counterparts with only three probes remaining significantly different. In the T2D, we identified 52 probes upregulated from pre- to post-RYGB, including NDFUB7 and NDFUA1.
Conclusion: Black females with T2DM show extensive downregulation of genes across aerobic metabolism pathways prior to RYGB, which resolves 1 year post-RYGB and is related to improvements in clinical markers. These data support efficacy of RYGB for improving skeletal muscle health, especially in patients with T2DM.
Approximately 9 in 10 individuals with type 2 diabetes mellitus (T2DM) are classified as overweight or obese and display peripheral insulin resistance (1). Roux-en Y gastric bypass (RYGB) weight-loss surgery is recognized as an effective intervention for the treatment and remission of T2DM in individuals with severe obesity (2, 3). As the primary site of glucose disposal in response to acute insulin action (4), skeletal muscle is likely a site of improved metabolic programming in response to intervention such as RYGB surgery (5).
Reduced skeletal muscle mitochondrial content and function in response to nutrient oversupply is a significant modifier of skeletal muscle insulin sensitivity in obesity and T2DM (6). Excess intracellular lipids and dysfunctional insulin receptor signaling leads to blunted expression of mitochondrial genes, including the master mitochondrial biogenesis transcriptional regulator peroxisome proliferator-activated receptor co-activator 1 alpha (PCG1α) (7–10). Improved mitochondrial function has been noted in humans following RYGB (11–13), but a limited number of studies have explored skeletal muscle gene expression profiles as far as 1 year post-surgery (5, 14, 15).
Previous studies exploring human skeletal muscle gene expression profiles following RYGB have identified changes in the expression of genes involved in insulin signaling (6), and inflammation (14), as well as mitochondrial and lipid metabolism (15). However, none of these studies specifically address the presence of T2DM on skeletal muscle gene expression compared to people with obesity but not overt T2DM. Previous studies have largely focused on Caucasian subjects despite black individuals accounting for ~15% of the bariatric surgery population (16). Furthermore, T2DM is more prevalent in black people in comparison to other races, underlining the need to study this population in greater detail to understand potential molecular drivers of this disparity. In the current study, we report the effects of T2DM on vastus lateralis global gene expression profiles prior to and 1 year following RYGB in black women with and without T2DM to determine the modifying effects of existing T2DM in RYGB-response.
Adult black females without (CON; n = 7) and with T2DM (T2D; n = 5) were recruited from an established bariatric surgery program at Vidant Medical Center (Greenville, NC); all subjects were classified with obesity. Institutional review boards at both East Carolina University and Children’s National Medical Center approved the study and written informed consent was obtained from all study participants. Criteria for inclusion included age between 25 and 60 years, BMI between 35 and 65 kg/m2, a negative pregnancy test, and (for T2D group) a diagnosis of T2DM in accordance with the criteria for the NIH Consortium for the Longitudinal Assessment of Bariatric Surgery (17).
Subjects were enrolled in the standard clinical protocol for bariatric surgery at Vidant Health. Anthropometric measures (age, height, weight, and BMI), fasting blood (antecubital) collection, and skeletal muscle biopsies were collected 2 weeks prior to (Pre) and 1-year post-surgery (Post). Whole blood was collected in plasma and serum separating tubes. BMI was calculated as kg/m2 and percent excess BMI loss (% Excess BMI Loss) was calculated as [(Pre BMI – Post BMI)/(Pre-BMI – 25)] × 100. Insulin was measured by immunoassay (Access Immunoassay System, Beckman Coulter, Fullerton, CA) and glucose with an oxidation reaction (YSI 2300, Yellow Springs, OH). The homeostasis model assessment (HOMA2) was calculated from plasma glucose and insulin levels (www.dtu.ox.ac.uk/homacalculator) (18).
Skeletal muscle biopsies were taken 2 weeks prior to and 1 year following RYGB, in a fasted state, from the vastus lateralis muscle of the non-dominant leg via standard Bergstrom needle biopsy (19). Approximately 100 to 200 mg of tissue was obtained with a triple pass and immediately flash frozen in liquid nitrogen. Approximately 20 to 30 mg of tissue was used for both RNA and DNA extraction protocols.
Skeletal muscle gene expression was analyzed from skeletal muscle biopsies taken pre- and post-RYGB via global microarray analysis (Affymetrix HU133 Plus 2.0 microarray; Affymetrix, Santa Clara, CA; Accession: GSE161643). Total RNA was isolated from skeletal muscle homogenates via the TRIzol (Invitrogen. Carlsbad, CA) method (20). Affymetrix instructions were followed for microarray processing. Briefly, 500 ng of total RNA was used with appropriate Poly-A controls for first- and second-strand cDNA synthesis. Biotin-labeled complementary RNA (cRNA) was synthesized using in vitro transcription of the second-strand cDNA with a T7 RNA polymerase. Approximately 30 μg of labeled cRNA was fragmented and hybridized to each microarray.
CEL files were generated from scanned microarrays and imported into Affymetrix Expression Console, where CHP files were generated using the PLIER (Probe Logarithmic Intensity Error) algorithm. PLIER is a mode-based signal estimator that takes advantage of numerous internal control probes of the microarray to differentiate between background and signal. Standard quality control methods were used to evaluate amplifications, thresholds for appropriate scaling factors, and RNA integrity (GAPDH 3’/5’ and HSAC07 3’/5’). Samples failing quality standards were reprocessed from original total RNA. Probe lists for statistical analysis (using the PLIER generated probe intensities) were also filtered for present/absent calls using the MAS5.0 algorithm in Expression Console. Probes that were determined present on 20 of 24 arrays (83.3%) were retained for statistical analysis. Resultant CHP files were imported into Partek Genomics Suite (Partek, Inc.; St. Louis, MO). Probe set intensities (PLIER) were log2-transformed for data normalization before statistical analyses.
Differences in gene expression were assessed via three-way analysis of covariance using a restricted maximum likelihood approach (Model: time point × group × time point*group + age + BMI) with contrasts between groups and time points conducted via Fisher’s least significant difference test (21). Significant probes were defined as p < 0.01 and resultant gene sets were uploaded to Ingenuity Pathway Analysis (IPA; Qiagen, Inc.) for probe set annotations and to query relationships between genes. The canonical pathway analysis tool was used to identify biological pathways that were overrepresented in our dataset via a right-handed Tukey’s t-test (22). We also utilized Gene Ontology (GO) Enrichment Analysis to determine categorization of the biological processes of significant gene lists (23, 24). GO Enrichment Analysis uses a Fisher’s exact test for classification and p-values for false discovery rate (FDR) are reported in the results.
Microarray results were confirmed with real-time polymerase chain reaction (qPCR). Due to RNA quantity and concentrations available following microarray analysis, a representative subset of n = 3 in the T2D group was used in qPCR analysis. RNA (100 ng) was reverse-transcribed into cDNA using SuperScript III Reverse Transcription (Invitrogen Corp.; Carlsbad, CA) following manufacturer protocols. PCR was performed in triplicate on an Applied Biosystems QuantStudio 3 Real-Time PCR Systems with Taqman Universal PCR Master Mix and commercially available TaqMan human gene expression assays (ThermoFisher Scientific; Waltham, MA) for hexokinase 2 (HK2; AssayID: Hs00606086_m1), NADH:ubiquinone oxidoreductase subunit B8 (NDUFB8; Hs00428204_m1), NADH:ubiquinone oxidoreductase subunit B7 (NDUFB7; Hs00958815_g1), NADH:ubiquinone oxidoreductase subunit A1 (NDUFA1; Hs00244980_m1), and 3-hydroxybutyrate dehydrogenase, type 1 (BDH1; Hs00366297_m1). Assays were performed in accordance with manufacturer instructions: 50°C for 2 min, 95° for 10 min, followed by 40 cycles of 95°C for 15 s followed by 60°C for 1 min. Assays were run with a multiplexed endogenous control (B2M). Fold changes were determined via the 2−ΔΔCt methodology.
Transcriptome and pathway statistical analyses are described above. Clinical data normality was assessed with Shapiro–Wilk tests and visualization of the distribution. If data were non-normally distributed, the data were log2-transformed and reassessed for normality. Differences between groups for anthropometric and clinical data were tested via two-sample t-test (age, height, % excess BMI Loss, % HOMA-2 Change) and two-way repeated measure ANOVA (group × time × group*time) for remaining measures. When appropriate, a Tukey’s test was used for pairwise comparison. Statistical analyses were performed using OriginLab Pro 2015 (OriginLab Corp, Northampton, MA).
Anthropometric and clinical characteristics are presented in Table 1. The T2D group was significantly (p = 0.03) older than subjects without diabetes. A time × group interaction (p = 0.03) was observed for changes in BMI. Analysis of percent of excess BMI loss indicated that CON lost significantly (p = 0.03) more excess BMI as compared to T2D. Blood glucose was significantly (p = 0.04) reduced in both groups 1-year following surgery with no significant (p = 0.06) difference between groups either pre- or post-surgery. A time × group interaction (p < 0.001) was observed for blood insulin. Post-hoc analysis identified that blood insulin was significantly reduced in T2D (p = 0.03) and CON (p = 0.01) diabetes following surgery. Furthermore, CON had significantly lower blood insulin pre (p = 0.007)- and post (p = 0.01)-surgery as compared to T2D. Main effects for time (p = 0.001) and group (p < 0.001) were observed for HOMA-IR, indicating CON had lower HOMA-IR pre- and post-surgery though both groups significantly improved following surgery. However, no difference (p = 0.70) was detected between groups for percent change in HOMA-IR following surgery.

Table 1 Clinical characteristics.
Following preliminary filtering for MAS5.0 present/absent (83.3% cutoff) left 25,839 probes for statistical analysis using PLIER generated probe intensity values. ANCOVA detected 114 significant (p < 0.01; Supplementary Table S1) probes for the main effect of time point, 61 significant (p < 0.01; Supplementary Table S2) probes for the main effect of group, and 376 significant (p < 0.01; Supplementary Table S3) probes for time × group interaction. The 376 significant probes from the time × group interaction were carried forward for pairwise comparisons.
Baseline pairwise comparison (Pre-RYGB T2DM vs. Pre-RYGB CON) resulted in 97 significant probes (Figures 1A, B, Supplementary Table S4), of which 95 had lower expression in T2D. We used multiple bioinformatics knowledge base tools to explore the biological context of our significant probe list. Using Gene Ontology Enrichment Analysis to categorize our probes based on biological processes, 82 of the 97 probes mapped to known genes and 52 of those were categorized under GO:0008152 Metabolic Process (FDR p = 1.72 × 10⁻²). Figure 1B depicts the most significant Gene Ontology terms from significant genes prior to surgery. IPA identified 11 enriched canonical biological pathways (Figures 1C, D), the majority of which are involved in oxidative metabolism. The top canonical pathways identified were “Mitochondrial Dysfunction” (p = 1.66 × 10⁻¹¹; 12 genes), “Oxidative Phosphorylation” (p = 4.45 × 10⁻¹¹; 10 genes), and “Sirtuin Signaling Pathway” (8.89 × 10⁻⁸; 11 genes). Genes involved in oxidative metabolism identified via Canonical Pathway Analysis in IPA are listed in Table 2. Differences in gene expression between groups pre-surgery for five genes (Figure 1E) were confirmed via qPCR.
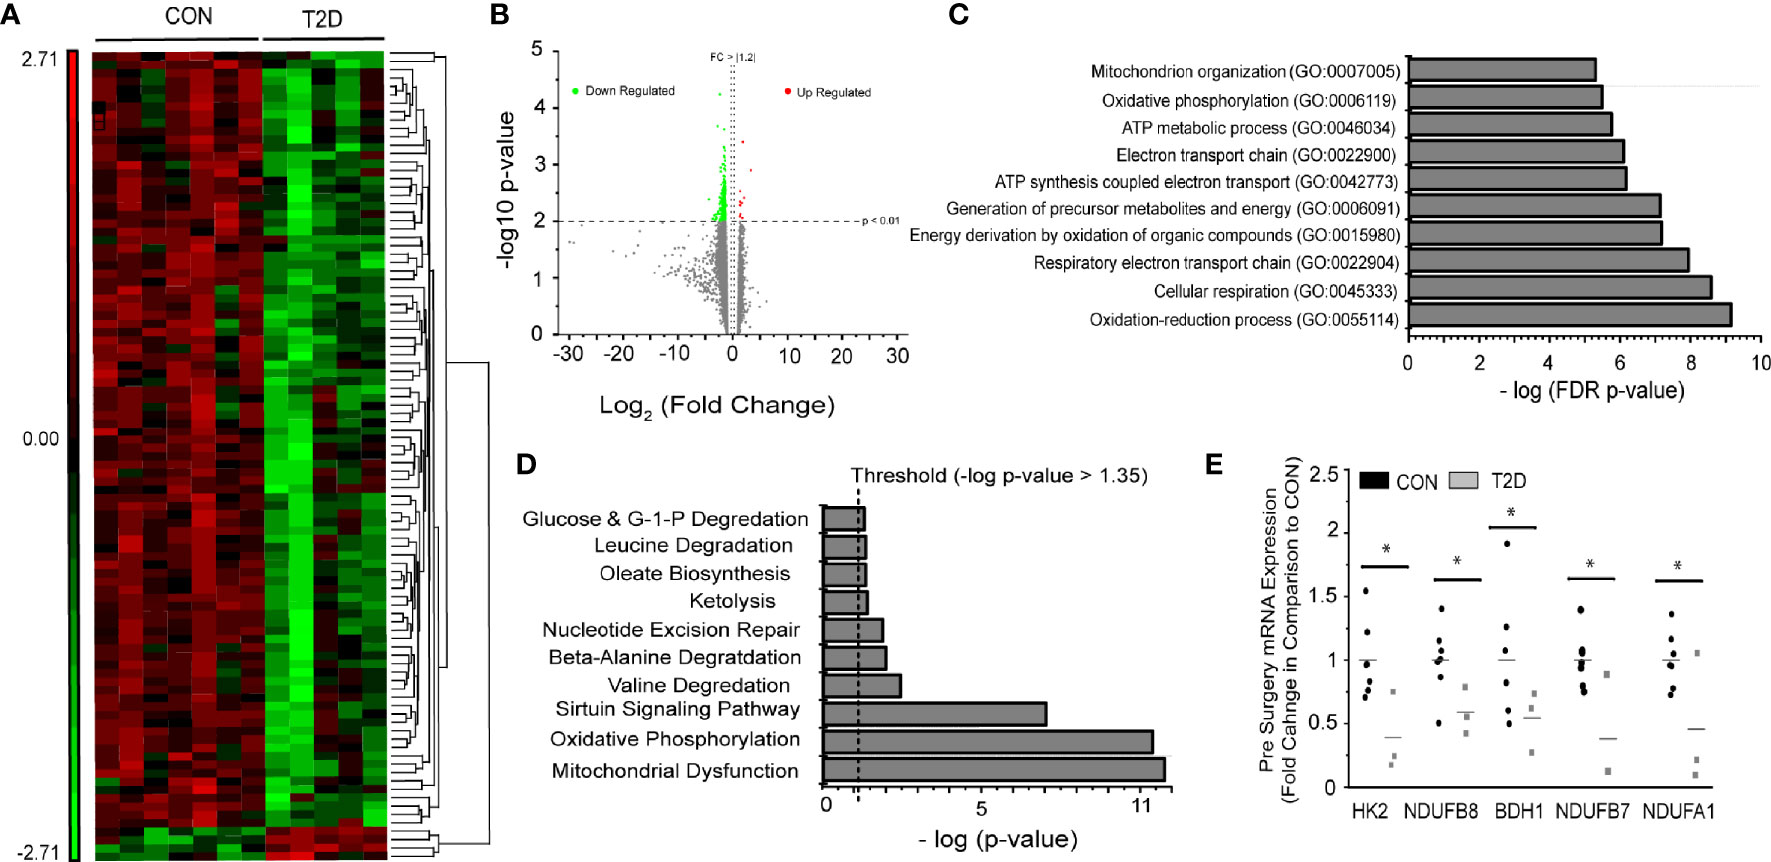
Figure 1 Pre-surgery skeletal muscle gene expression in T2D vs. CON. (A) Heat map (probe intensities) of 97 significantly (p < 0.01; FC > |1.2|) probes used for biological function and pathway analysis. (B) Volcano plot of 25,839 probes used for statistical analysis. Green (Down Regulated) and Red (Upregulated) of 97 significant (p < 0.01, FC > |1.2|) probes for Pre-Surgery skeletal muscle T2D vs. CON. (C) Gene Ontology Enrichment analysis for biological process of differentially expressed genes in individuals with and without diabetes pre-surgery. (D) Significant pathways from Ingenuity Pathway Analysis using the Canonical Pathway tool. Presented pathways are overrepresented with genes differentially regulated between those with and without diabetes. (E) Fold changes in select genes as determined via qPCR; *p < 0.05 students t-test.

Table 2 Baseline (Pre-RYGB) group differences in skeletal muscle gene expression for oxidative pathways.
Comparison of skeletal muscle gene expression profiles 1-year post-surgery resulted in only three significant probes that mapped to three genes: ring finger protein 6 (RNF6; p = 0.003, FC = 1.8 greater in individuals with diabetes vs. without), coiled-coil domain containing 90A (CCDC90A; p = 0.007, FC = 1.3), and guanine monophosphate synthetase (GMPS; p = 0.002, FC = −1.3). These data represent a “closing of the baseline gap” between T2D and CON skeletal muscle health post-surgery. Only CCDC90A (p = 0.002; FC = −1.2) was found to be significantly different in pre-surgery gene expression analysis.
We explored changes in skeletal muscle gene expression profiles pre- to post-surgery in individuals with diabetes and without diabetes (Figure 2A). Comparison of pre- to post-surgery gene expression changes identified 53 probes (Supplementary Table S5), mapping to 48 known genes. An increase in expression (FC > 1.2) was observed in 43 of the 48 known genes (Figures 2B, C). Only 11 genes were significantly altered pre- to post-surgery in individuals without diabetes. Gene Ontology Enrichment Analysis for Biological Process of genes with significant differential expression pre- to post-surgery in individuals with diabetes identified respiratory electron transport chain (FDR = 6.8 × 10⁻²) and oxidative phosphorylation (FDR = 4.18 × 10⁻²) as the only significant biological processes. Similarly, canonical pathway analysis again identified Oxidative Phosphorylation (5.19 × 10⁻⁸; 6 genes), Mitochondrial Dysfunction (1.15 × 10⁻⁶; 6 genes), and Sirtuin Signaling Pathway (3.3 × 10⁻³; 4 genes) as the top overrepresented pathways in the gene list (Figure 2D). Significant genes pre- to post-surgery involved in oxidative metabolism identified via Canonical Pathway Analysis in IPA are listed in Table 3. Increased expression of three genes (i.e., fold changes) in individuals with diabetes were confirmed via qPCR, but were not statistically different (Figure 2E).

Figure 2 Pre to post-surgery skeletal muscle gene expression. (A) Venn diagram of significant probes in individuals with diabetes and without diabetes, and overlap, pre-to-post surgery. (B) Volcano plot of 25,839 probes used for statistical analysis. Green (Down Regulated) and Red (Upregulated) of 53 significant (p < 0.01, FC > |1.2|) probes for Pre-to-Post surgery gene expression in T2D skeletal muscle. (C) Heat map (probe intensities) of 48 significant (p < 0.01, FC > |1.2|) probes pre-to-post surgery in individuals with diabetes. (D) Significant pathways from Ingenuity Pathway Analysis using the Canonical Pathway tool. Presented pathways are overrepresented with genes differentially regulated between pre-to-post surgery in individuals with diabetes. (E) Fold changes in select genes as determined via qPCR.
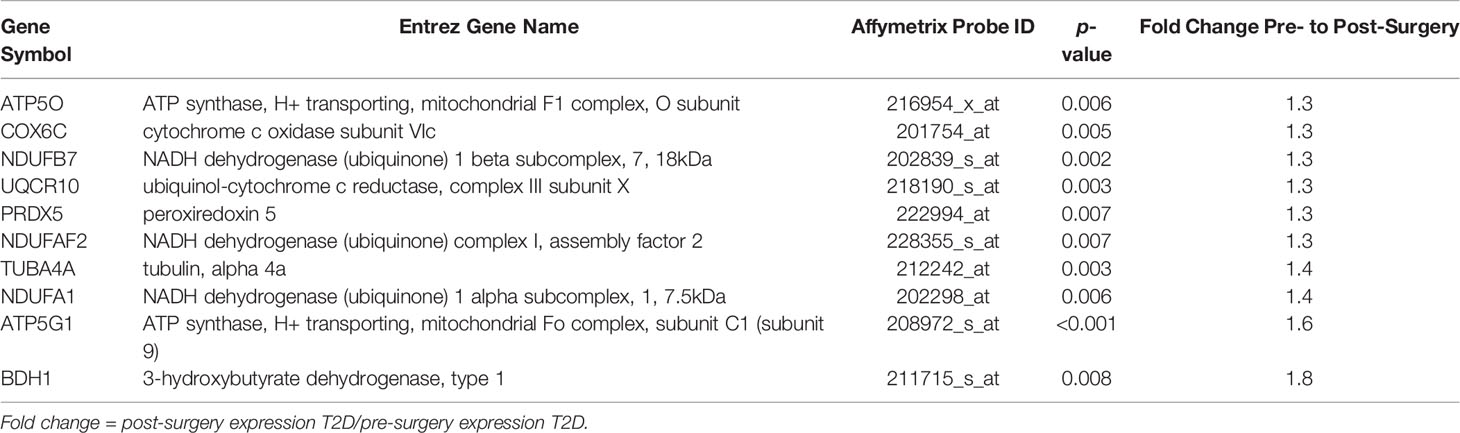
Table 3 Surgery-responsive changes in genes in oxidative pathways in the T2D group.
The purpose of the present study was to identify the effect of T2DM on skeletal muscle gene expression profiles before and after RYGB surgery in severely obese black women. Our data provide evidence that oxidative metabolism genes in women with T2DM are lower prior to RYGB compared to those without T2D, suggesting more dysfunction with the disease. One year following RYGB, skeletal muscle gene expression profiles of those with diabetes normalized compared to their non-diabetic counterparts, largely driven by significant increases in gene expression of electron transport chain genes. Mitochondrial function and perturbations in oxidative metabolism have been implicated in the development of insulin resistance and T2DM (6, 8, 10). RYGB is an effective strategy for significant reductions in excess weight and BMI, as well as the remission of T2DM, though mechanistic understanding of how this resolution occurs remains a work in progress (2, 3). Taken in conjunction with improvements in cardiometabolic profiles (decreased resting blood glucose, insulin, HOMA-2, weight, and BMI), coordinated increases in skeletal muscle oxidative metabolism gene expression appears to play, in part, a role in the remission of T2DM following RYGB surgery.
Individuals with T2DM show significant reductions in skeletal muscle oxidative metabolism gene expression prior to bariatric surgery (15, 25, 26). The current data indicate reductions in multiple subunits of mitochondrial complex I (NDUFB8, NDUFA1, NDUFB7, NDUFAF2, and NDUFB3) in individuals with T2DM prior to RYGB (Figure 3A). The role of complex I in the development and treatment of T2DM has been explored in various tissue and cells with conflicting conclusions. Chemical inhibition and gene silencing of complex I shows improved glucose consumption in HepG2 and C2C12 cells as well as improved glucose homeostasis in db/db mice (27) whereas complex I deficits result in metabolic inflexibility in the diabetic heart (28). Most recent evidence suggests that clinical dosage of metformin improves complex I activity (29) through activation of AMPK despite previous reports of supraphysiologic dosages causing inhibition (30). There is also evidence that complex I deficits restrict fetal skeletal muscle growth (31) and decrease mitochondrial efficacy in aging skeletal muscle (32). Expanded analysis (Supplementary Table S6) of skeletal muscle gene expression differences in those with and without diabetes prior to surgery shows consistent downregulation of a number of genes for mitochondrial complexes in individuals with diabetes (Figure 3A).
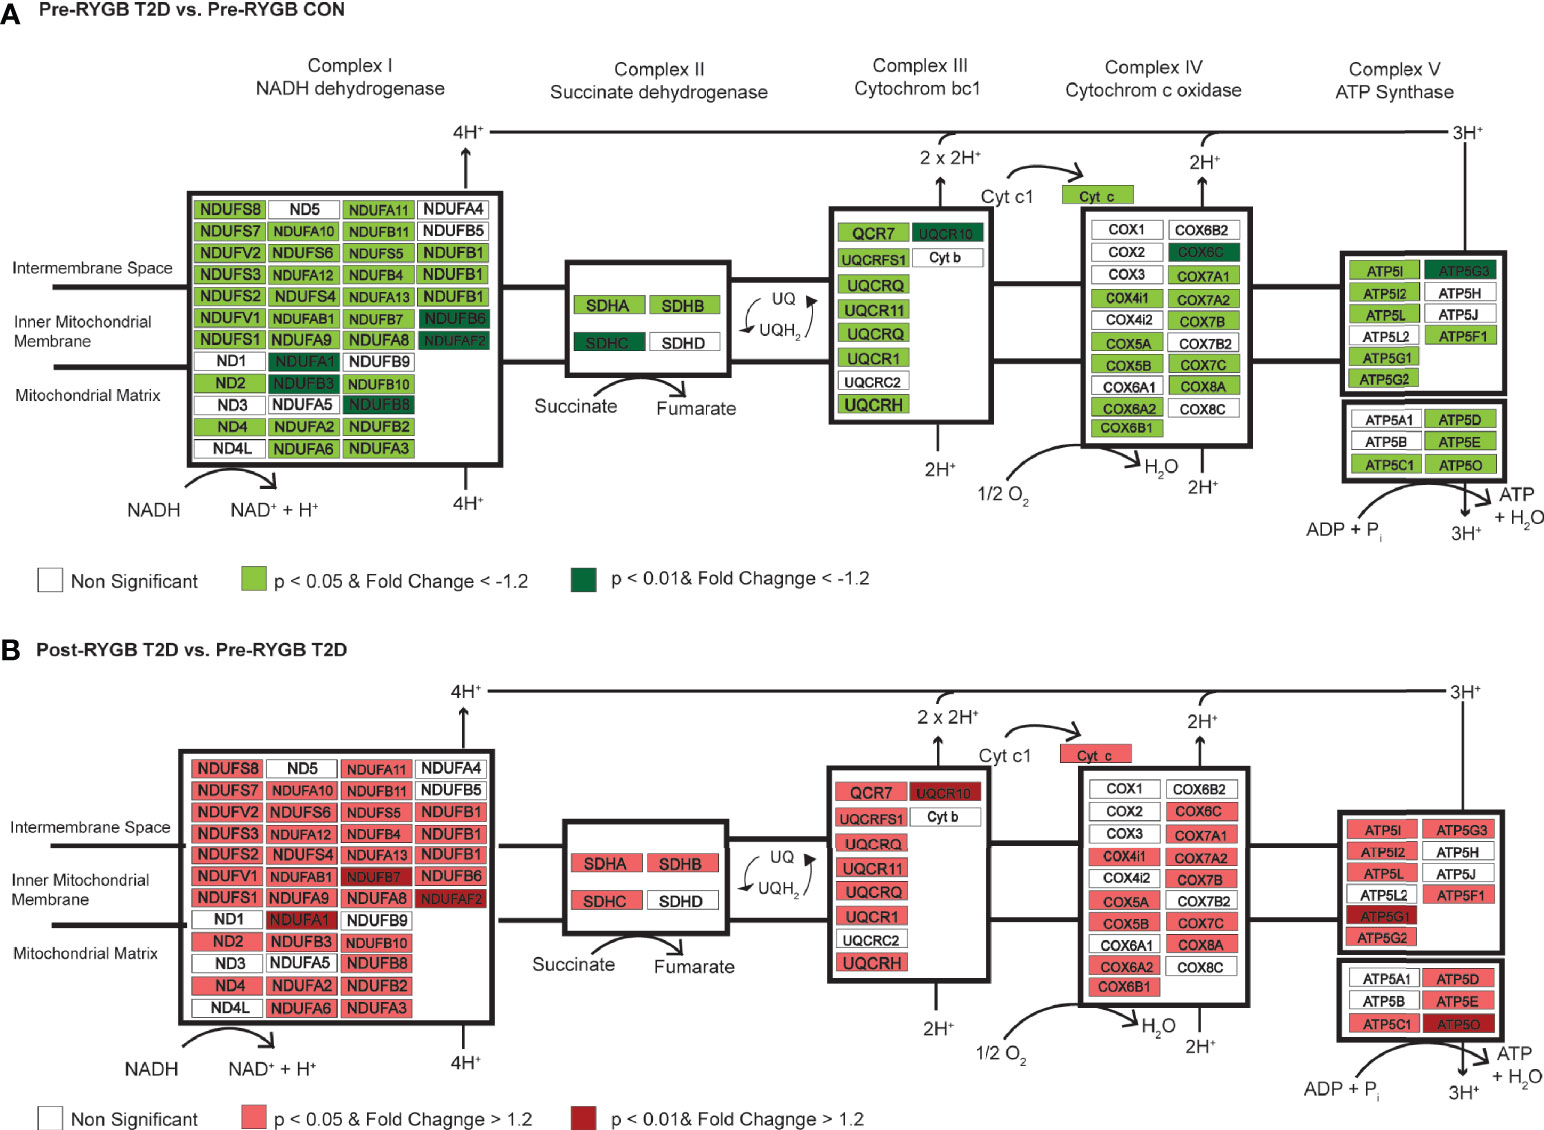
Figure 3 Differential regulation of genes of the mitochondrial complexes between individuals with and without diabetes and pre- to post-surgery in individuals with diabetes. (A) Differentially regulated genes in Complex I, II, III, IV, and ATP Synthase in skeletal muscle of individuals with and without diabetes prior to surgery. Using an expanded gene list to include genes with p < 0.05, FC > −1.2 (lighter red shading; Supplementary Table S6), we show consistent downregulation of genes in mitochondrial complexes in individuals with diabetes prior to surgery. Green shading indicates p < 0.01 and FC > −1.2. (B) Differentially regulated genes in Complex I, II, III, IV, and ATP Synthase in skeletal muscle of individuals with diabetes pre- to post-surgery. Using an expanded gene list to include genes with p < 0.05, FC > −1.2 (lighter green shading; Supplementary Table 6), we show consistent upregulation of genes in mitochondrial complexes 1 year post-surgery. Red shading indicates p < 0.01 and FC > 1.2.
We also show concurrent downregulation of key metabolic regulatory genes (Table 2) in individuals with diabetes prior to surgery. Hexokinase 2 (HK2; FC = −3.4), succinate dehydrogenase complex, subunit C (SDHC; FC = −3.1), isocitrate dehydrogenase 1 (IDH1; FC = −1.8), and pyruvate kinase muscle (PKM; FC = 1.5) were all downregulated in individuals with diabetes. Taken in conjunction with decreased gene expression of the mitochondrial complexes, black women with T2DM show coordinated downregulation of aerobic metabolism genes in comparison to their non-diabetic counterparts.
One year following RYGB, the T2D group had significant improvement in clinical profiles similar to CON: normalized glycemia, reduced hyperinsulinemia, improved HOMA-IR, and significant reduction in excess weight and BMI. Comparison of skeletal muscle gene expression profiles 1 year following RYGB surgery between those with and without diabetes resulted in only three differentially regulated probes between the groups. This indicates that RYGB, and the following lifestyle changes not accounted for here, resulted in skeletal muscle gene expression of individuals with diabetes normalizing to their non-diabetic counterparts. This occurred despite the individuals with T2D being slightly older, suggesting that this age difference was likely not responsible for the initial differences in gene expression. Similarly, the normalization indicates the robust effects of the surgery/weight loss. Further comparison of skeletal muscle expression profiles pre- to post-RYGB in individuals with T2DM showed that almost all (43 of 48) differentially regulated genes increased following surgery and biological interpretation of these genes identified their role in mitochondrial function and aerobic metabolism.
We identified significant upregulation (Table 3) of mitochondrial complex I genes (NDUFB8, NDUFAF2, and NDUFA1), ATP synthase subunits (ATP5O and ATP5G1), and cytochrome c oxidase subunit Vic (COX6C) in individuals with T2DM 1 year post-RYGB surgery. Skeletal muscle ETC protein content has been shown to be progressively diminished, including reductions in COX6C, in nondiabetic individuals with obesity and individuals with T2DM in comparison to lean counterparts (33). The degree to which these mitochondrial gene expression changes drive improved clinical phenotypes is indeterminable, but even changes in a small number of genes can have cascade-like effects on cellular signaling and function. For instance, they may be heavily involved in promoting epigenetic (e.g., DNA methylation) changes in muscle (15, 34). Gene expression changes 52 weeks following surgery was more strongly linked to epigenetic (DNA methylation) changes in skeletal muscle than 2 weeks post-surgery when insulin resistance had already resolved (15). Barres et al. (34) also showed that changes in expression of three genes was linked to changes in over 100 CpG methylation sites. Thus, the interpretation that gene expression changes in aerobic metabolism and mitochondrial function genes cannot be limited to improved mitochondrial function or flexibility driving improved phenotype (e.g., resolution of insulin resistance or T2DM). As with our pre-surgery analysis, expanded analysis (p < 0.05 and FC = |1.2|; Supplementary Table S6) shows consistent upregulation of a number of genes in all mitochondrial complexes 1 year following surgery in those with diabetes (Figure 3B).
Ketone bodies are important metabolic fuels produced in the liver and metabolized in the mitochondria of non-hepatic tissues (35). In our analysis, we show reduced expression of 3-hydroxybutyrate dehydrogenase, type (BDH1), an important catalyst of ketone metabolism, in skeletal muscle of T2D (Table 2), which was significantly upregulated 1 year following RYGB (Table 3). Expression of BDH1 in adipose tissue has been positively correlated to insulin sensitivity in ~9,000 Finnish men (36), but not associated with circulating ketone levels. Expression of BDH1 in skeletal muscle is modulated by PGC-1α (35), but its potential as a significant modifier of skeletal muscle metabolic function following surgery has not been explored to date. Given the role of β-hydroxybutyrate, the primary circulating ketone body, as a metabolic intermediate and its potential epigenetic signaling actions (37), more exploration into this gene and protein in the context of weight loss surgery is warranted.
In the present study, we explored skeletal muscle gene expression profiles of black women with and without T2DM prior to and 1 year following RYGB. The presence of T2DM resulted in coordinated downregulation of genes in aerobic metabolism and oxidative metabolic pathway, specifically, subunits for mitochondrial complex I and complex II, as well as other key metabolic regulatory genes. One year following surgery, skeletal muscle gene expression profiles of black women with T2DM had normalized to their non-diabetic counterparts, driven largely by improvements in genes involved in aerobic metabolism and mitochondrial function. Weight loss surgery is an incredibly effective treatment for weight loss and remission for T2DM, and changes in skeletal muscle gene expression may, in part, contribute to these phenotypic changes through improved metabolic and mitochondrial function as well as other cellular signaling functions such as epigenetic modifications. These genes and proteins should be further explored in the context of surgical weight loss and other lifestyle modification strategies to understand their role throughout the dynamic process of severe weight loss and improved metabolic phenotype.
The datasets presented in this study can be found in online repositories. The names of the repository/repositories and accession number(s) can be found in the article/Supplementary Material.
The studies involving human participants were reviewed and approved by East Carolina University and Children’s National Medical Center. The patients/participants provided their written informed consent to participate in this study.
MB and MH were involved in all aspects of this study and manuscript preparation. GD, WP, and JH were involved in study design, sample collection, analysis of results, and manuscript preparation. NG was involved in sample processing, data analysis, analysis of results, and manuscript preparation. EN was involved study design, analysis of results, and manuscript preparation. All authors contributed to the article and approved the submitted version
This project was supported by Award Number UL1TR000075 (MH) from the NIH National Center for Advancing Translational Sciences and T32AR065993 (MB) from the National Institute of arthritis and Musculoskeletal and Skin Diseases.
The authors declare that the research was conducted in the absence of any commercial or financial relationships that could be construed as a potential conflict of interest.
All claims expressed in this article are solely those of the authors and do not necessarily represent those of their affiliated organizations, or those of the publisher, the editors and the reviewers. Any product that may be evaluated in this article, or claim that may be made by its manufacturer, is not guaranteed or endorsed by the publisher.
The authors would like to acknowledge the participants for their commitment to this research study.
The Supplementary Material for this article can be found online at: https://www.frontiersin.org/articles/10.3389/fendo.2021.728593/full#supplementary-material
Supplementary Table 1 | Probes and statistics for the main effect of timepoint.
Supplementary Table 2 | Probes and statistics for the main effect of group.
Supplementary Table 3 | Probes and statistics for time x group interaction.
Supplementary Table 4 | Probes and statistics for baseline pairwise comparison (Pre-RYGB T2DM vs Pre-RYGB CON) of skeletal muscle gene expression.
Supplementary Table 5 | Probes and statistics for Pre-to-Post surgery skeletal muscle gene expression changes.
Supplementary Table 6 | Probes and statistics for expanded gene lists (p < 0.05) used biological pathway analysis.
1. Bramante CT, Lee CJ, Gudzune KA. Treatment of Obesity in Patients With Diabetes. Diabetes Spectr (2017) 30:237–43. doi: 10.2337/ds17-0030
2. Buchwald H, Estok R, Fahrbach K, Banel D, Jensen MD, Pories WJ, et al. Weight and Type 2 Diabetes After Bariatric Surgery: Systematic Review and Meta-Analysis. Am J Med (2009) 122:248–256 e245. doi: 10.1016/j.amjmed.2008.09.041
3. Brethauer SA, Aminian A, Romero-Talamas H, Batayyah E, Mackey J, Kennedy L, et al. Can Diabetes be Surgically Cured? Long-Term Metabolic Effects of Bariatric Surgery in Obese Patients With Type 2 Diabetes Mellitus. Ann Surg (2013) 258:628–636; discussion 636-627. doi: 10.1097/SLA.0b013e3182a5034b
4. Reaven GM, Chen YD. Role of Insulin in Regulation of Lipoprotein Metabolism in Diabetes. Diabetes Metab Rev (1988) 4:639–52. doi: 10.1002/dmr.5610040703
5. Park JJ, Berggren JR, Hulver MW, Houmard JA, Hoffman EP. GRB14, GPD1, and GDF8 as Potential Network Collaborators in Weight Loss-Induced Improvements in Insulin Action in Human Skeletal Muscle. Physiol Genomics (2006) 27:114–21. doi: 10.1152/physiolgenomics.00045.2006
6. Kelley DE, He J, Menshikova EV, Ritov VB. Dysfunction of Mitochondria in Human Skeletal Muscle in Type 2 Diabetes. Diabetes (2002) 51:2944–50. doi: 10.2337/diabetes.51.10.2944
7. Kim JY, Hickner RC, Cortright RL, Dohm GL, Houmard JA. Lipid Oxidation is Reduced in Obese Human Skeletal Muscle. Am J Physiol Endocrinol Metab (2000) 279:E1039–1044. doi: 10.1152/ajpendo.2000.279.5.E1039
8. Petersen KF, Dufour S, Befroy D, Garcia R, Shulman GI. Impaired Mitochondrial Activity in the Insulin-Resistant Offspring of Patients With Type 2 Diabetes. N Engl J Med (2004) 350:664–71. doi: 10.1056/NEJMoa031314
9. Huang H, Aminian A, Hassan M, Dan O, Axelrod CL, Schauer PR, et al. Gastric Bypass Surgery Improves the Skeletal Muscle Ceramide/S1P Ratio and Upregulates the AMPK/ SIRT1/ PGC-1alpha Pathway in Zucker Diabetic Fatty Rats. Obes Surg (2019) 29:2158–65. doi: 10.1007/s11695-019-03800-z
10. Ritov VB, Menshikova EV, He J, Ferrell RE, Goodpaster BH, Kelley DE. Deficiency of Subsarcolemmal Mitochondria in Obesity and Type 2 Diabetes. Diabetes (2005) 54:8–14. doi: 10.2337/diabetes.54.1.8
11. Fernstrom M, Bakkman L, Loogna P, Rooyackers O, Svensson M, Jakobsson T, et al. Improved Muscle Mitochondrial Capacity Following Gastric Bypass Surgery in Obese Subjects. Obes Surg (2016) 26:1391–7. doi: 10.1007/s11695-015-1932-z
12. Vijgen GH, Bouvy ND, Hoeks J, Wijers S, Schrauwen P, van Marken Lichtenbelt WD. Impaired Skeletal Muscle Mitochondrial Function in Morbidly Obese Patients is Normalized One Year After Bariatric Surgery. Surg Obes Relat Dis (2013) 9:936–41. doi: 10.1016/j.soard.2013.03.009
13. Nijhawan S, Richards W, O'Hea MF, Audia JP, Alvarez DF. Bariatric Surgery Rapidly Improves Mitochondrial Respiration in Morbidly Obese Patients. Surg Endosc (2013) 27:4569–73. doi: 10.1007/s00464-013-3125-y
14. Tamboli RA, Hajri T, Jiang A, Marks-Shulman PA, Williams DB, Clements RH, et al. Reduction in Inflammatory Gene Expression in Skeletal Muscle From Roux-En-Y Gastric Bypass Patients Randomized to Omentectomy. PloS One (2011) 6:e28577. doi: 10.1371/journal.pone.0028577
15. Gancheva S, Ouni M, Jelenik T, Koliaki C, Szendroedi J, Toledo FGS, et al. Dynamic Changes of Muscle Insulin Sensitivity After Metabolic Surgery. Nat Commun (2019) 10:4179. doi: 10.1038/s41467-019-12081-0
16. Kizy S, Jahansouz C, Downey MC, Hevelone N, Ikramuddin S, Leslie D. National Trends in Bariatric Surgery 2012-2015: Demographics, Procedure Selection, Readmissions, and Cost. Obes Surg (2017) 27:2933–9. doi: 10.1007/s11695-017-2719-1
17. Gourash WF, Ebel F, Lancaster K, Adeniji A, Koozer Iacono L, Eagleton JK, et al. Longitudinal Assessment of Bariatric Surgery (LABS): Retention Strategy and Results at 24 Months. Surg Obes Relat Dis (2013) 9:514–9. doi: 10.1016/j.soard.2013.02.012
18. Matthews DR, Hosker JP, Rudenski AS, Naylor BA, Treacher DF, Turner RC. Homeostasis Model Assessment: Insulin Resistance and Beta-Cell Function From Fasting Plasma Glucose and Insulin Concentrations in Man. Diabetologia (1985) 28:412–9. doi: 10.1007/BF00280883
19. Bergstrom J. Percutaneous Needle Biopsy of Skeletal Muscle in Physiological and Clinical Research. Scand J Clin Lab Invest (1975) 35:609–16. doi: 10.3109/00365517509095787
20. Rio DC, Ares M Jr, Hannon GJ, Nilsen TW. Purification of RNA Using TRIzol (TRI Reagent). Cold Spring Harb Protoc (2010) 2010:pdb prot5439. doi: 10.1101/pdb.prot5439
21. Thompson WA. The Problem of Negative Estimates of Variance Components. Ann Math Statist (1962) 33:273–89. doi: 10.1214/aoms/1177704731
22. Kramer A, Green J, Pollard J Jr, Tugendreich S. Causal Analysis Approaches in Ingenuity Pathway Analysis. Bioinformatics (2014) 30:523–30. doi: 10.1093/bioinformatics/btt703
23. Ashburner M, Ball CA, Blake JA, Botstein D, Butler H, Cherry JM, et al. Gene Ontology: Tool for the Unification of Biology. The Gene Ontology Consortium. Nat Genet (2000) 25:25–9. doi: 10.1038/75556
24. Mi H, Muruganujan A, Ebert D, Huang X, Thomas PD. PANTHER Version 14: More Genomes, A New PANTHER GO-Slim and Improvements in Enrichment Analysis Tools. Nucleic Acids Res (2019) 47:D419–26. doi: 10.1093/nar/gky1038
25. Coen PM, Hames KC, Leachman EM, DeLany JP, Ritov VB, Menshikova EV, et al. Reduced Skeletal Muscle Oxidative Capacity and Elevated Ceramide But Not Diacylglycerol Content in Severe Obesity. Obes (Silver Spring) (2013) 21:2362–71. doi: 10.1002/oby.20381
26. Szendroedi J, Schmid AI, Chmelik M, Toth C, Brehm A, Krssak M, et al. Muscle Mitochondrial ATP Synthesis and Glucose Transport/Phosphorylation in Type 2 Diabetes. PloS Med (2007) 4:e154. doi: 10.1371/journal.pmed.0040154
27. Hou WL, Yin J, Alimujiang M, Yu XY, Ai LG, Bao YQ, et al. Inhibition of Mitochondrial Complex I Improves Glucose Metabolism Independently of AMPK Activation. J Cell Mol Med (2018) 22:1316–28. doi: 10.1111/jcmm.13432
28. Vazquez EJ, Berthiaume JM, Kamath V, Achike O, Buchanan E, Montano MM, et al. Mitochondrial Complex I Defect and Increased Fatty Acid Oxidation Enhance Protein Lysine Acetylation in the Diabetic Heart. Cardiovasc Res (2015) 107:453–65. doi: 10.1093/cvr/cvv183
29. Wang Y, An H, Liu T, Qin C, Sesaki H, Guo S, et al. Metformin Improves Mitochondrial Respiratory Activity Through Activation of AMPK. Cell Rep (2019) 29:1511–1523 e1515. doi: 10.1016/j.celrep.2019.09.070
30. Owen MR, Doran E, Halestrap AP. Evidence That Metformin Exerts its Anti-Diabetic Effects Through Inhibition of Complex 1 of the Mitochondrial Respiratory Chain. Biochem J (2000) 348 Pt 3:607–14. doi: 10.1042/bj3480607
31. Pendleton AL, Antolic AT, Kelly AC, Davis MA, Camacho LE, Doubleday K, et al. Lower Oxygen Consumption and Complex I Activity in Mitochondria Isolated From Skeletal Muscle of Fetal Sheep With Intrauterine Growth Restriction. Am J Physiol Endocrinol Metab (2020) 319:E67–80. doi: 10.1152/ajpendo.00057.2020
32. Kruse SE, Karunadharma PP, Basisty N, Johnson R, Beyer RP, MacCoss MJ, et al. Age Modifies Respiratory Complex I and Protein Homeostasis in a Muscle Type-Specific Manner. Aging Cell (2016) 15:89–99. doi: 10.1111/acel.12412
33. Hwang H, Bowen BP, Lefort N, Flynn CR, De Filippis EA, Roberts C, et al. Proteomics Analysis of Human Skeletal Muscle Reveals Novel Abnormalities in Obesity and Type 2 Diabetes. Diabetes (2010) 59:33–42. doi: 10.2337/db09-0214
34. Barres R, Kirchner H, Rasmussen M, Yan J, Kantor FR, Krook A, et al. Weight Loss After Gastric Bypass Surgery in Human Obesity Remodels Promoter Methylation. Cell Rep (2013) 3:1020–7. doi: 10.1016/j.celrep.2013.03.018
35. Svensson K, Albert V, Cardel B, Salatino S, Handschin C. Skeletal Muscle PGC-1alpha Modulates Systemic Ketone Body Homeostasis and Ameliorates Diabetic Hyperketonemia in Mice. FASEB J (2016) 30:1976–86. doi: 10.1096/fj.201500128
36. Mahendran Y, Vangipurapu J, Cederberg H, Stancakova A, Pihlajamaki J, Soininen P, et al. Association of Ketone Body Levels With Hyperglycemia and Type 2 Diabetes in 9,398 Finnish Men. Diabetes (2013) 62:3618–26. doi: 10.2337/db12-1363
Keywords: skeletal muscle, bariatric (weight-loss) surgery, type 2 diabetes (T2D), gene expression, metabolism
Citation: Barberio MD, Dohm GL, Pories WJ, Gadaleta NA, Houmard JA, Nadler EP and Hubal MJ (2021) Type 2 Diabetes Modifies Skeletal Muscle Gene Expression Response to Gastric Bypass Surgery. Front. Endocrinol. 12:728593. doi: 10.3389/fendo.2021.728593
Received: 21 June 2021; Accepted: 13 September 2021;
Published: 06 October 2021.
Edited by:
Anna Prats-Puig, Euses University School of Health and Sport, SpainReviewed by:
Amanda Brandon, The University of Sydney, AustraliaCopyright © 2021 Barberio, Dohm, Pories, Gadaleta, Houmard, Nadler and Hubal. This is an open-access article distributed under the terms of the Creative Commons Attribution License (CC BY). The use, distribution or reproduction in other forums is permitted, provided the original author(s) and the copyright owner(s) are credited and that the original publication in this journal is cited, in accordance with accepted academic practice. No use, distribution or reproduction is permitted which does not comply with these terms.
*Correspondence: Monica J. Hubal, bWh1YmFsQGl1cHVpLmVkdQ==
Disclaimer: All claims expressed in this article are solely those of the authors and do not necessarily represent those of their affiliated organizations, or those of the publisher, the editors and the reviewers. Any product that may be evaluated in this article or claim that may be made by its manufacturer is not guaranteed or endorsed by the publisher.
Research integrity at Frontiers
Learn more about the work of our research integrity team to safeguard the quality of each article we publish.