Corrigendum: Upregulation of Mir342 in Diet-Induced Obesity Mouse and the Hypothalamic Appetite Control
Corrigendum: Upregulation of Mir342 in Diet-Induced Obesity Mouse and the Hypothalamic Appetite Control
 Dongxiao Zhang1
 Satoshi Yamaguchi1
 Xinhao Zhang1
 Boxuan Yang1
 Naoko Kurooka1Ryosuke Sugawara1
 Haya Hamed H. Albuayjan1
 Atsuko Nakatsuka1
 Jun Eguchi1Takeshi Y. Hiyama2Atsunori Kamiya2
 Jun Wada1*
- 1Department of Nephrology, Rheumatology, Endocrinology and Metabolism, Okayama University Graduate School of Medicine, Dentistry and Pharmaceutical Sciences, Okayama, Japan
- 2Department of Cellular Physiology, Okayama University Graduate School of Medicine, Dentistry and Pharmaceutical Sciences, Okayama, Japan
In obesity and type 2 diabetes, numerous genes are differentially expressed, and microRNAs are involved in transcriptional regulation of target mRNAs, but miRNAs critically involved in the appetite control are not known. Here, we identified upregulation of miR-342-3p and its host gene Evl in brain and adipose tissues in C57BL/6 mice fed with high fat-high sucrose (HFHS) chow by RNA sequencing. Mir342 (-/-) mice fed with HFHS chow were protected from obesity and diabetes. The hypothalamic arcuate nucleus neurons co-express Mir342 and EVL. The percentage of activated NPY+pSTAT3+ neurons were reduced, while POMC+pSTAT3+ neurons increased in Mir342 (-/-) mice, and they demonstrated the reduction of food intake and amelioration of metabolic phenotypes. Snap25 was identified as a major target gene of miR-342-3p and the reduced expression of Snap25 may link to functional impairment hypothalamic neurons and excess of food intake. The inhibition of miR-342-3p may be a potential candidate for miRNA-based therapy.
Introduction
microRNAs are non-coding RNAs with the length of 21-25 nucleic acids and repress the expression of hundreds of target mRNAs by the binding to complete or 1- or 2-bp mismatched complementary sequences on 3’-untranslated regions (UTR), mRNA cleavage, mRNA deadenylation, and subsequent translational repression (1). Numerous studies demonstrated that miRNAs play critical roles in fine-tuning of gene expression in various physiological and pathological states (2). Furthermore, miRNAs themselves are transcriptionally regulated, however, little is known about the structural features of miRNA promoters (3) and the accurate miRNA promotor identification is underway (2). In the disease states of obesity and diabetes, differential expression of miRNAs associated with regulation of target mRNAs would be critically involved in the pathogenesis and they are candidates for biomarkers and therapeutic targets. In fact, initial attempts were made to survey miRNA expression profile in pancreatic β cells caused by obesity, hyperglycemia, and dyslipidemia. In the islets of healthy and type 2 diabetes (T2D) organ donors, miR-7a, miR-130a/b, miR-152, and miR-184 were differentially expressed (4). The expression of microRNA is regulated by environmental, genetic, and epigenetic factors and their disturbance is critically involved in the pathogenesis of diabetes and its complications (5, 6). The promoter CpG islands of maternally expressed MEG3 and miRNA cluster was hypomethylated in T2D organ donors, and reduction of miRNAs caused upregulation of their target genes such as TP53INP1, which induced the apoptosis of pancreatic β cells (7). T2D loci were recently identified at clusters of miRNAs maternally expressed MEG3 and paternally expressed DLK1 (8). DLK1 is known to inhibit adipocyte differentiation and protect against obesity (9).
The further attempts were made to identify the miRNAs related to insulin resistance in obesity and T2D, and miRNAs profiling studies were extensively performed in adipose tissues, liver and muscle (6). Notably, miRNAs can be packaged in the extracellular vesicle such as exosomes, which transfer miRNAs between cells and mediate the interorgan crosstalk. Thus, the profile of circulating miRNAs was also vigorously performed (10). In our attempts to identify new therapeutic target of miRNAs, we surveyed expression profile in liver, muscle, white adipose tissues, and sera of C57BL/6JJcl mice fed with standard (STD) and high fat-high sucrose (HFHS) chow by RNA sequencing (GSE61959) (11). We identified unique miRNA gene, Mir342, and it is highly upregulated in brain and white adipose tissues by the feeding of HFHS chow in C57BL/6JJcl mice. Here, we report the benefits of the deletion of Mir342 gene in C57BL/6JJcl mice fed with HFHS chow, i.e., amelioration of obesity and T2D. Mir342 (-/-) mice fed with HFHS chow were characterized with reduced chow intake and reduced activation of neuropeptide Y (NPY) neurons in arcuate nuclei. We also investigated the expression of Evl, host gene of Mir342, and identified Snap25 as a target gene of miR-342-3p.
Materials And Methods
Animal Models
We obtained Sanger MirKO ES cell line Mir342 (Mir342tm1Wtsi) from MMRRC (Mutant Mouse Resource & Research Centers, University of California, Davis, USA). The insertion of the PGK_EM7_PuDtk_bGHpA cassette created a deletion of size 196 bp (109,896,794–109,896,990 of Chromosome 12 in NC_000078.5 Chromosome 12 Reference MGSCv37 C57BL/6J; 108,624,843-108,624,915 in NC_000078.7 Chromosome 12 Reference GRCm39 C57BL/6J). This deletion eliminates the DNA sequence for this microRNA. The cassette is composed of a loxP site followed by an F3 site followed by a PGK-puromycin-delta-tk cassette, a loxP site and finally an FRT site (12). The germline chimeric mice were prepared under the background of C57BL/6N. Targeted Mir342 was confirmed by 2 sets of primer pairs, 5’ common rev 5′-ATAGCATACATTATACGAAGTTATCACTGG-3′ and 5’ gene specific fwd (LR1) 5′-AGCTCACTTACATTTTATTTATTTTCTCCT-3′ (5,739 bp); 3’ common fwd 5′-TCTAGAAAGTATAGGAACTTCCATGGTC-3′ and 3’ gene specific rev (LR4) 5′-GTAGGCAAGAAGACATAATACAGAAAAG-3′ (3,232 bp). Wild-type Mir342 was detected by primers, LR1 and LR4 (8,789 bp). The male chimeric mice were mated with C57BL/6JJcl (CLEA Japan, Tokyo, Japan) to generate heterozygous Mir342 (+/-). By crossing Mir342 (+/-) C57BL/6JJcl mice, we generated male homozygous Mir342 (-/-) and wild-type Mir342 (+/+) littermates. Five-week-old mice were randomly assigned to standard diet (STD) group (MF, Oriental Yeast, Japan) or high fat high sucrose diet (HFHS) group (D12331, Research Diets, New Brunswick, NJ). At 24 weeks of age, we obtained various organs and they were subjected to following experiments.
Human Serum Samples
Human serum samples were collected from 65 patients with type 2 diabetes (T2D) in Okayama University Hospital and 45 subjects with normal fasting glucose (NFG, fasting glucose < 110 mg/dL). The patients with malignancies, treatment with steroids and immunosuppressants, and total pancreas resection were excluded. It was approved by Okayama University Graduate School of Medicine, Dentistry and Pharmaceutical Sciences and Okayama University Hospital, Ethics Committee (#1708-045).
3T3-L1 Cell Cultures
3T3-L1 pre-adipocytes were cultured in Dulbecco’s modified eagle’s medium (DMEM, 124951, Gibco). On day 0, the media were changed to the differentiation media of the DMEM supplemented with 10% FBS, 10 µg/ml insulin (I1882, Sigma), 1 µM DEX (D2915, Sigma) and 0.5 mM IBMX (I5879, Sigma). On day 2, the media were changed to DMEM supplemented with 10 µg/ml insulin and 10% FBS. The media were changed every day. Total RNA was isolated from 3T3-L1 cells during differentiation from day 1 to day 10 using RNeasy Mini kit (74106, Qiagen) and subjected to RT-qPCR.
Insulin Tolerance Test and Glucose Tolerance Test (ITT and GTT)
The 20-week-old mice (n=4 in each experimental group) were fasted for 16 hours in GTT and for 3 hours in ITT. They were then intraperitoneally injected with glucose solution (1 mg/g body weight) and human insulin (1 unit/kg in HFHS groups and 0.75 unit/kg in STD groups) for GTT and ITT, respectively. Serum Insulin and leptin levels were measured (Skylight Biotech, Tokyo, Japan).
Food Intake, Locomotor Activity, and Basal Metabolic Rate
At 16 weeks of age, daily food intake was measured and calculated; daily food intake [g/day/body weight (BW)] = [initial food weight (g) – leftover food weight (g)]/measurement period (days)/BW (g). The locomotor activity was recorded for 24 hours by the frequency of interrupting an infrared sensor (ACTIMO-100, Shinfactory, Fukuoka, Japan). O2/CO2 metabolism measuring system (MK-5000, Muromachi Kikai, Tokyo, Japan) were used to quantify oxygen consumption rate and carbon dioxide production for the estimation of V̇O2 and respiratory quotient (RQ). Four mice in each experimental group were examined.
Pair-Feeding Study
Mir342 (+/+) and Mir342 (-/-) mice (n=3 for free-feeding and n=5 for pair-feeding) were individually housed and fed with HFHS chow, body weight was measured every week. Food intake of free-fed mice were measured every 3 days. The equal amount of chow consumed by free-fed Mir342 (-/-) mice for 3 days was given to the pair-fed Mir342 (+/+) and Mir342 (-/-) mice.
Reverse Transcription-Quantitative Polymerase Chain Reaction
RNAs were extracted from frozen tissues and cultured 3T3-L1 cells with RNeasy Mini Kit (Qiagen). For brain tissues, the hypothalamus and ventral midbrain region were removed by free-hand dissection. The QIAamp Circulating Nucleic Acid Kit and the exoRNeasy Serum/Plasma Midi Kit (Qiagen) were used for the isolation of total RNAs from serum and exosomes. For gene expression analyses, cDNAs were prepared with High-Capacity RNA-to-cDNA Kit (Thermo Fisher Scientific). TaqMan gene expression primers, Evl (Mm00468405_m1), Snap25 (Mm01276449_m1), Cidea (Mm00432554_m1), Cox7a1 (Mm00438297_g1), Pparg (Mm00440940_m1), Il6 (Mm00446190_m1), Il1b (Mm00434228_m1), Tnf (Mm00443258_m1), Ifng (Mm01168134_m1), Lpl (Mm00434764_m1), Adipoq (Mm00456425_m1), Nhlh2 (Mm01959164_u1), Msi1 (Mm01203522_m1), Fat2 (Mm01295775_m1), Rplp0 (Mm00725448_s1), and Rn18s (Mm03928990_g1) were employed. For miRNA expression studies, cDNAs were prepared from total RNAs by TaqMan MicroRNA Reverse Transcription Kit (Life Technologies). MicroRNA primers, hsa-miR-342p (002260), snoRNA202 (001232), snoRNA234 (001234), and cel-miR-39 (000200) were used. Rplp0, Rn18s, snoRNA202, snoRNA234, and cel-miR-39 were served as the invariant controls. The RT-qPCR was performed using TaqMan Universal PCR Master mix II (no UNG) at a StepOne Plus Real-Time PCR system. The quantification was performed by the 2−ΔΔCT analysis method.
Western Blot Analysis
The brain and hypothalamic tissues from 24-week-old mice (n=3-4 in each experimental group) were homogenized in RIPA lysis buffer (radioimmunoprecipitation buffer) plus protease inhibitors. The samples were boiled in SDS-PAGE loading buffer, separated on 12% Mini-PROTEAN TGX Precast Protein Gels (Bio-Rad), and transferred to a PVDF Blotting Membrane (cytiva). After blocking with 5% nonfat milk for 1 hour at room temperature (RT), the blots were incubated with rabbit Anti-SNAP25 antibody (ab5666, Abcam, 1:1000), rabbit Anti-EVL antibody (ab204835, Abcam, 1:1000) overnight at 4°C. Rabbit anti-β-Actin antibody (4967S, Cell Signaling Technology) was used as a loading control. After washing three times with Tris-buffered saline (TBS), the blots were incubated with ECL Donkey Anti-Rabbit IgG, HRP-Conjugated Antibodies (NA934V, GE healthcare Life science, 1:10000) at RT for 1 hour. The blots were developed with Pierce ECL Western Blotting Substrate (TE261327, Thermo Fisher Scientific). The chemiluminescence was analyzed using ImageQuant LAS-4000 mini (FUJIFILM).
Morphometric Analysis for Adipocyte Size
Epidydimal and subdermal adipose tissues were fixed by 10% formalin, embedded with paraffin. The 5-μm paraffin sections were prepared and stained with PAS. The images were captured using an Olympus BX51 microscope. The size of the adipocytes was analyzed by the ImageJ software (National Institutes of Health). Epidydimal and subdermal adipose tissue were taken from 4 individual animals from each experimental group.
In Situ Hybridization
In situ hybridization for miRNA was performed using miRCURY LNA miRNA ISH Optimization Kit (FFPE) 4 (Qiagen) on formalin-fixed paraffin embedded (FFPE) tissue samples. The sections were deparaffinized in xylene, hydrated in a series of graded alcohols until water at RT, and followed by washing three times with phosphate-buffered saline (PBS). The slides were incubated for 30 minutes with 3 μg/ml of proteinase K at 37°C. After washing twice with PBS and dehydrated, the sections were hybridized for 2 hours with a gene specific probe (40 nM for double-DIG LNA Mir342 probe) and LNA Scramble-miR probe (double DIG labeled) at 55°C. LNA U6 snRNA probe (5’ DIG labeled) and LNA Scramble-miR probe was used for endogenous control. The sections were washed in stringent condition with 5×SSC, 1×SSC and 0.2× SSC for 10 minutes at 55°C. After the wash with PBS, the sections were blocked with Antibody blocking solution (PBS, 0.1% Tween, 2% Sheep serum, and 1% BSA) and incubated with Anti-Digoxigenin-AP Fab fragments (11093274910, Roche, 1:800) in Antibody Dilutant solution (PBS, 0.05% Tween, 1% Sheep serum, and 1% BSA) for 1 hour at RT. After washing by PBS, the sections were incubated with AP substrate, i.e. NBT/BCIP ready-to-use tablet (ROCHE) in 10 ml Milli-Q water and 0.2 mM Levamisole for 2 hours at 30°C. They were then incubated in KTBT buffer (50 mM Tris-Cl, 150 mM NaCl, 10 mM KCl, and 1% Triton X-100) twice for 5 min each to stop the reaction. Finally, the slides were counterstained, dehydrated, and mounted. The processed sections were visualized using an Olympus BX51 microscope.
Immunofluorescence
The mice (n=4-5 in each experimental group) were fasted for 16 hours and euthanized. The whole brain was taken after systemic perfusion with 4% paraformaldehyde (PFA). For STAT3 activation study, the intraperitoneal injection of mouse recombinant leptin (181030-10-4, FUJIFILM) (1 mg/kg body weight) was given 1 hour before euthanasia. The frozen coronal brain sections (-1.10 mm to -1.90 mm from bregma) were cut at 20-μm thick and fixed in 4% PFA for 15 min. For adipose tissues, 5-μm paraffin sections were first deparaffinized in xylene and hydrated in a series of graded alcohols until water. After antigen retrieval in HistoVT One (nacalai tesque) at 90°C for 15 min, the sections were first incubated in the avidin-biotin blocking kit and incubated with primary antibodies, rabbit Anti-EVL antibody (ab204835, Abcam, 1:250), rabbit Anti-pSTAT3 Antibody (9131, Cell Signaling Technology, 1:500), mouse Anti-NPY antibody (GTX60971, Gene Tex, 1:2000), goat Anti-POMC antibody (ab32893, Abcam, 1:4000), mouse Anti-Neun antibody (ab104224, Abcam,1:500), chicken Anti-GFAP antibody (ab4674, Abcam, 1:500), mouse Anti-IBA1 antibody (sc-32725, Santa Cruz, 1:500), mouse Anti-Myelin Basic Protein antibody (ab62631, Abcam, 1:500), chicken Anti-Tyrosine Hydroxylase antibody (ab76442, Abcam, 1:500) and rat Anti-F4/80 Antibody (ab6640, Abcam, 1:100) for 3 days at 4°C. After 3 times washing by PBS, the tissue sections were then incubated with secondary antibodies, Alexa 647-conjugated goat Anti-Rabbit IgG (ab150083, Abcam, 1:500), Alexa 488-conjugated goat Anti-Rat (ab150165, Abcam, 1:500), Alexa 488-conjugated goat Anti-Mouse (ab150117, Abcam, 1:500), Alexa 488-conjugated donkey Anti-Goat IgG (ab150129, Abcam, 1:500), Alexa 488-conjugated goat Anti-Chicken IgY (ab150173, Abcam, 1:500), Biotin-conjugated donkey Anti-Rabbit/Goat IgG (711-065-152, 705-065-147, Jackson ImmunoResearch, 1:500) for 1 hour at RT. Next, the sections were incubated with fluorescent streptavidin (SA-1200, Vector) for 1 hour at RT. Finally, the sections were mounted using ProLong Gold Antifade Mountant with DAPI (P36931, Thermo Fisher) and observed by an Olympus BX51 microscope. Images covering the whole arcuate nucleus of brain sections (438.6 μm x 330.2 μm = 0.14 mm2) were subjected to count cell numbers using Image J software. For quantification, the average cell count from 3 sections per animal was obtained.
Isolation of Stromal Vascular Fraction From White Adipose Tissues
SVF was isolated from epididymal adipose tissue of 24-week-old mice. Briefly, fresh mouse epididymal fat pads were minced and digested with collagenase type 1 (CLSS1, Worthington) in HBSS containing 10% FBS for 45 minutes at 37°C. The mixture was filtered through a nylon mesh (100 μm), then centrifuged at 400 g for 1 minute. The adipocyte fraction was obtained from the supernatant and the SVF from the pellet.
Identification of Mir342 Target mRNAs
The mRNA microarray was performed by GeneChip Mouse Gene 2.0 array using total RNA of epidydimal fat obtained from 16-week-old mice (3 individual animals from each group) and analyzed by Filgen (Nagoya, Japan). The raw data are available in Gene Expression Omnibus (GEO; https://www.ncbi.nlm.nih.gov/geo/) (GSE163880). TargetScan (http://www.targetscan.org/vert_72/), miRDB (http://www.mirdb.org/), Pictar (https://pictar.mdc-berlin.de/) and DIANA-microT v5.0 (https://bio.tools/DIANA-microT) and were used to identify potential target genes for Mir342.
Luciferase Reporter Assay
To quantitatively evaluate miRNA activity on cloned miRNA target sequence from 3’-untranslated region (3’-UTR) of Snap25, pmirGLO dual luciferase miRNA Target expression vector (E1330, Promega) was used. Firstly, the pmirGLO plasmid was linearized by double digestion with XhoI and SacI. The cDNAs of Snap25 wild type (WT) 3′-UTR and Snap25 mutant (MT) 3’-UTR were amplified by PCR and ligated with CIP treated pmirGLO Vector. The primers are Forward XhoI Snap25: 5’-GGGGGGCTCGAGACAAAGATGCTGGGAAGTGG-3′, Reverse SacI Snap25: 5’-GGGGGGGAGCTCCAAACCAACAGAGGAGACAG-3′, Reverse SacI mutant Snap25: 5’-GGGGGGGAGCTCCATGCTGTAATGATATTTAGCGCACAGTTTATC-3′. The seed sequence “TCTCACA” was mutated to “GCGCACA”. After transformation to E. coli JM109 cells, pmirGLO-Snap25 WT 3’-UTR, pmirGLO-Snap25 MT 3’-UTR, and pmirGLO no-insert control plasmids were isolated with EndoFree Plasmid Maxi Kit (12362, Qiagen). HEK293T cells were seeded at a density of 120,000 cells/mL, then co-transfected with Mir342 mimic (MSY0000590, Qiagen), Mir342 inhibitor (MIN0000590, Qiagen), negative control siRNA (1027280, Qiagen), inhibitor negative control (1027271, Qiagen), pmirGLO-Snap25 WT 3’-UTR, pmirGLO-Snap25 MT 3’-UTR, and pmirGLO no-insert control plasmids. Twenty-four hours after transfection, the cells were analyzed to measure luciferase activities using the Dual-Glo Luciferase Assay System and a GloMax 20/20 luminometer (Promega).
DNA Methylation Analysis
The methylation status of Evl and Mir342 genes was investigated (EpigenDx, http://www.epigendx.com/). NGS (next-generation sequencing) methylation assays were designed to interrogate the DNA methylation status of 103 CpG sites in the 5’ upstream to 3’UTR regions of the Mouse Evl gene. The CpG loci location or coordinates are based on Ensembl Gene ID ENSMUSG00000021262 and GRCm39 genomic build. Genomic DNA extracted from brain tissues of Mir342 (+/+) mice fed with HFHS or STD chow (n=3) were subjected to NGS methylation analysis. Bisulfite modification was carried out using EZ DNA Methylation-Direct Kit (D5020) according to the manufacturer’s protocol (Zymo Research). PCRs included 0.5 units of HotStarTaq (203205, Qiagen), 0.2 μM primers, and 3 μL of bisulfite-treated 200-500 ng DNA in a 20 μL reaction. All PCR products were verified using the Qiagen QIAxcel Advanced System (v1.0.6). Prior to library preparation, PCR products from the same sample were pooled and then purified using the QIAquick PCR Purification Kit columns or plates (28106, Qiagen). Libraries were prepared using a custom Library Preparation method created by EpigenDX. Next, libraries were purified using Agencourt AMPure XP beads (A63882, Beckman Coulter). Barcoded samples were then pooled in an equimolar fashion before template preparation and enrichment were performed in the Ion Chef system using Ion 520 & Ion 530 ExT Chef reagents (A30670, Thermo Fisher). Following this, enriched, template-positive libraries were sequenced on the Ion S5 sequencer using an Ion 530 sequencing chip (A27764). FASTQ files from the Ion Torrent S5 server were aligned to the local reference database using open-source Bismark Bisulfite Read Mapper with the Bowtie2 alignment algorithm. Methylation levels were calculated in Bismark by dividing the number of methylated reads by the total number of reads.
Statistical Analysis
All values were represented as the mean ± standard deviation (SD). Statistical analyses were conducted using IBM SPSS Statistics 23 and GraphPad Prism (version 8.0). Independent t-test, one-way ANOVA with Tukey test and two-way ANOVA with Bonferroni tests were used to determine the differences. For DNA methylation analysis, Fisher’s exact test was applied at each CpG site, and Mann–Whitney U test was used by NGS methylation assay. For correlation, non-parametric Spearman r coefficient was used. p<0.05 was considered statistically significant.
Results
Mir342 (-/-) Mice Are Resistant to Diet-Induced Obesity and Diabetes
To identify miRNAs which are critically involved in the disease process of metabolic syndrome and type 2 diabetes (T2D), we performed miRNA profiling of serum, liver and epididymal fat tissues in C57BL/6JJcl mice fed with standard (STD) and high fat-high sucrose (HFHS) chow (11). The Illumina RNA sequencing data are available in the Gene Expression Omnibus (GEO) under the accession number GSE61959. The miRNA genes with read number more than 2,000 were sorted by HFHS/STD ratios and we identified that Mir342 was ranked second with 9.5-fold up-regulation in epididymal adipose tissues of HFHS group (Figure 1A and Supplementary Table 1). In the patients with T2D (n=65), we found that serum concentrations of miR-342-3p showed positive and significant correlation with body weight (Figure 2). However, in NFG (n=45) and NFG + T2D (n=110), there were no significant correlations between miR-342-3p and body weight (Supplementary Figure 1). There were no significant differences of miR-342-3p levels in T2D with and without metformin (Supplementary Table 2). To further give a new insight and investigate the role of Mir342 in obesity and diabetes, we obtained Sanger MirKO ES cell line Mir342 (Mir342tm1Wtsi) from MMRRC (Mutant Mouse Resource & Research Centers) and generated Mir342 knockout mice [Mir342 (-/-)].
FIGURE 1
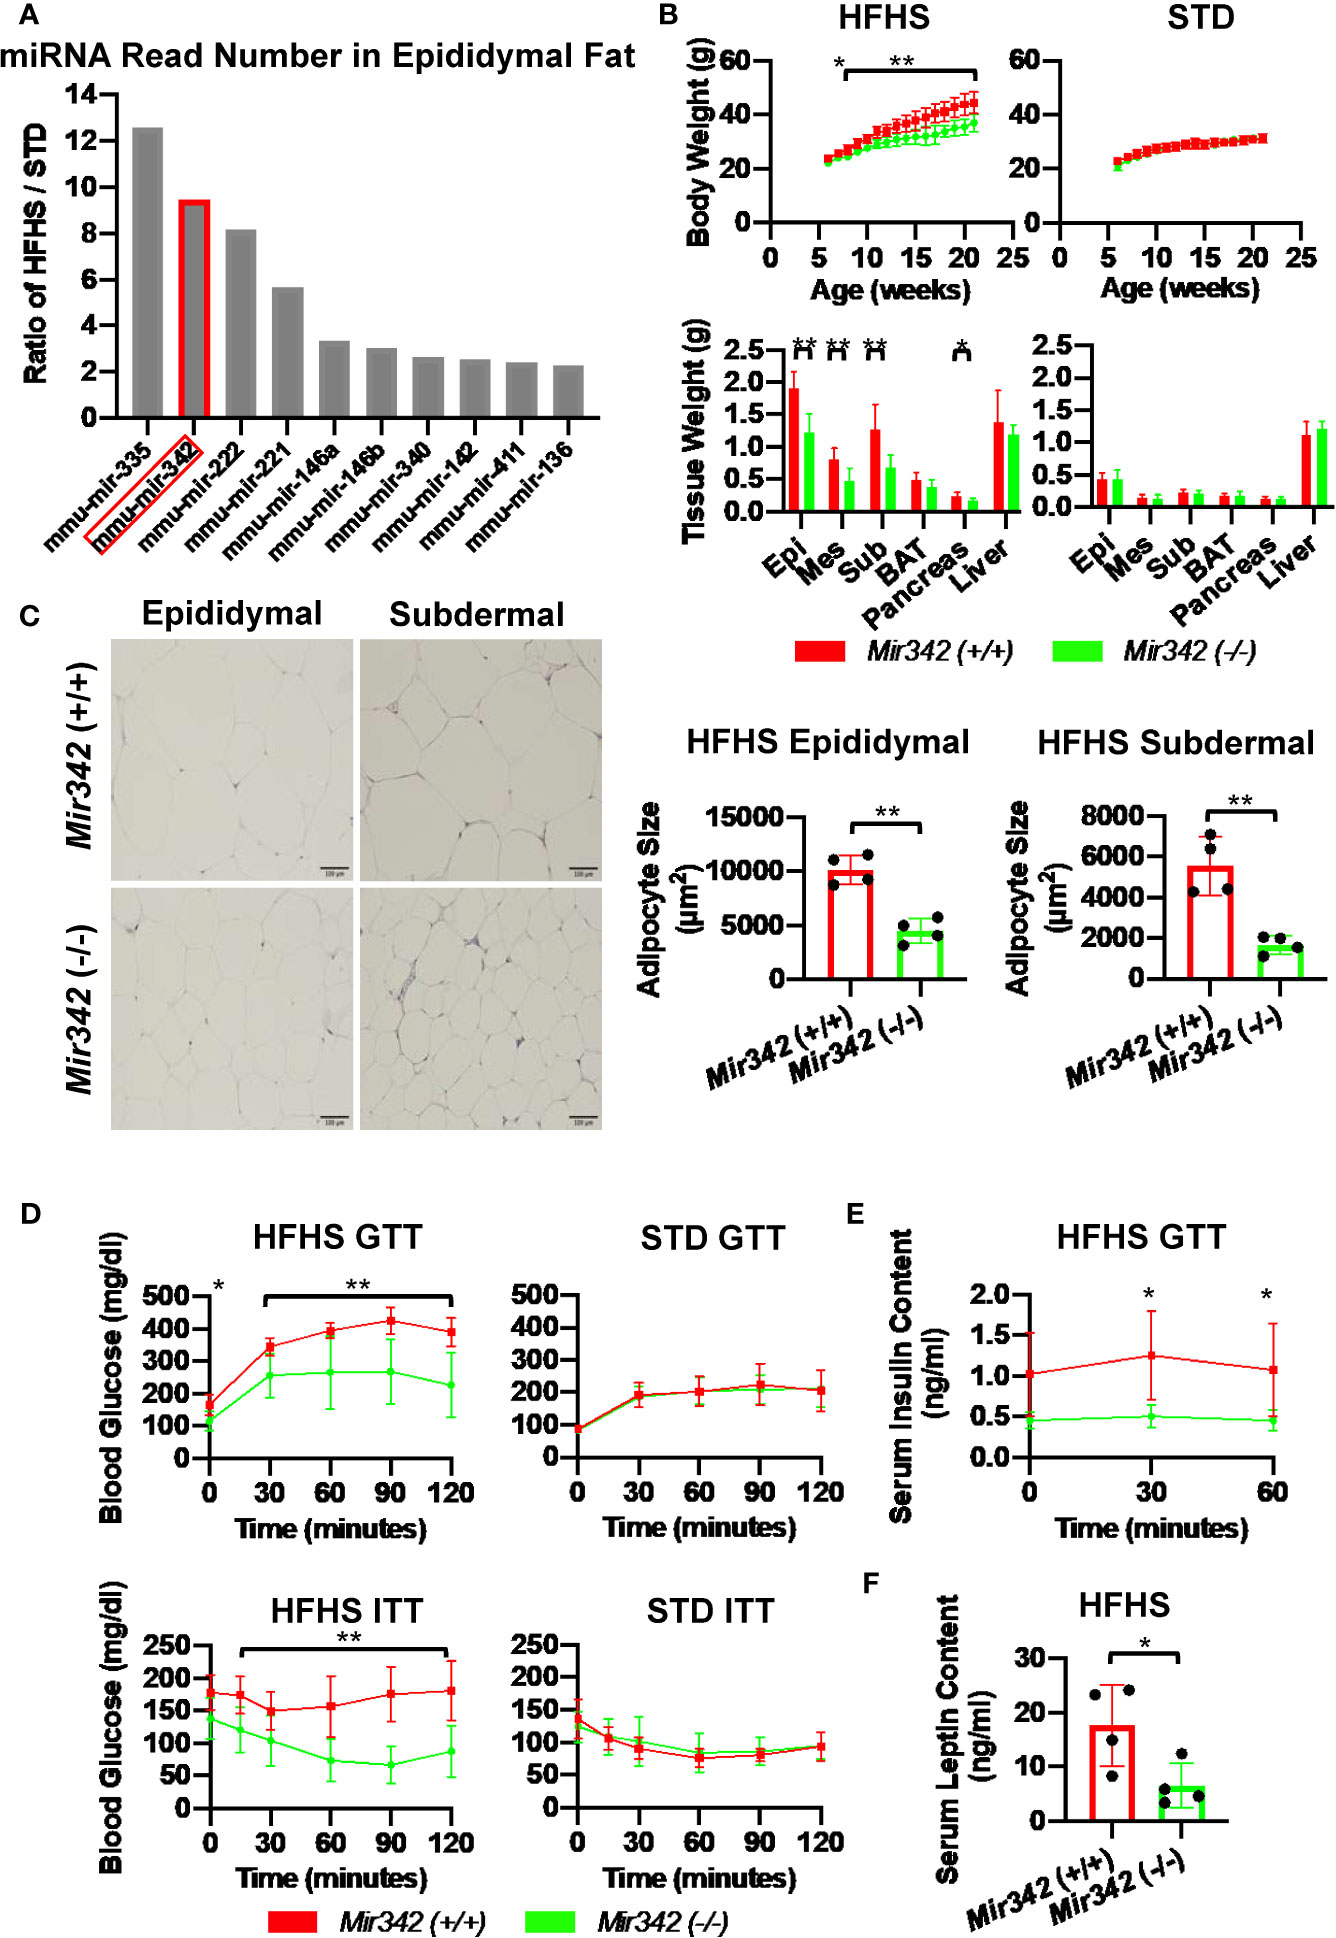
Figure 1 The metabolic phenotypes of Mir342 (-/-) and Mir342 (+/+) mice fed with high fat-high sucrose (HFHS) or standard (STD) chow. (A) The HFHS/STD ratio of miRNA read numbers in epididymal fat tissues. (B) Body and tissue weight of Mir342 (+/+) and Mir342 (-/-) mice fed with HFHS (n=7) or STD chow (n=8). (C) Adipocyte area in epididymal and subdermal adipose tissues (n=4). Quantitative analyses were carried out on PAS-stained paraffin sections. (D) Glucose tolerance test (GTT) and insulin tolerance test (ITT) of mice fed with HFHS (n=7) or STD chow (n=8). (E) Serum insulin levels in Mir342 (+/+) and Mir342 (-/-) mice fed with HFHS chow during GTT (n=4). (F) Fasting serum leptin levels in Mir342 (+/+) and Mir342 (-/-) mice fed with HFHS mice (n=4). Data shown as mean ± SD and analyzed by independent t-test or two-way ANOVA with Bonferroni tests (*p < 0.05; **p < 0.01).
FIGURE 2
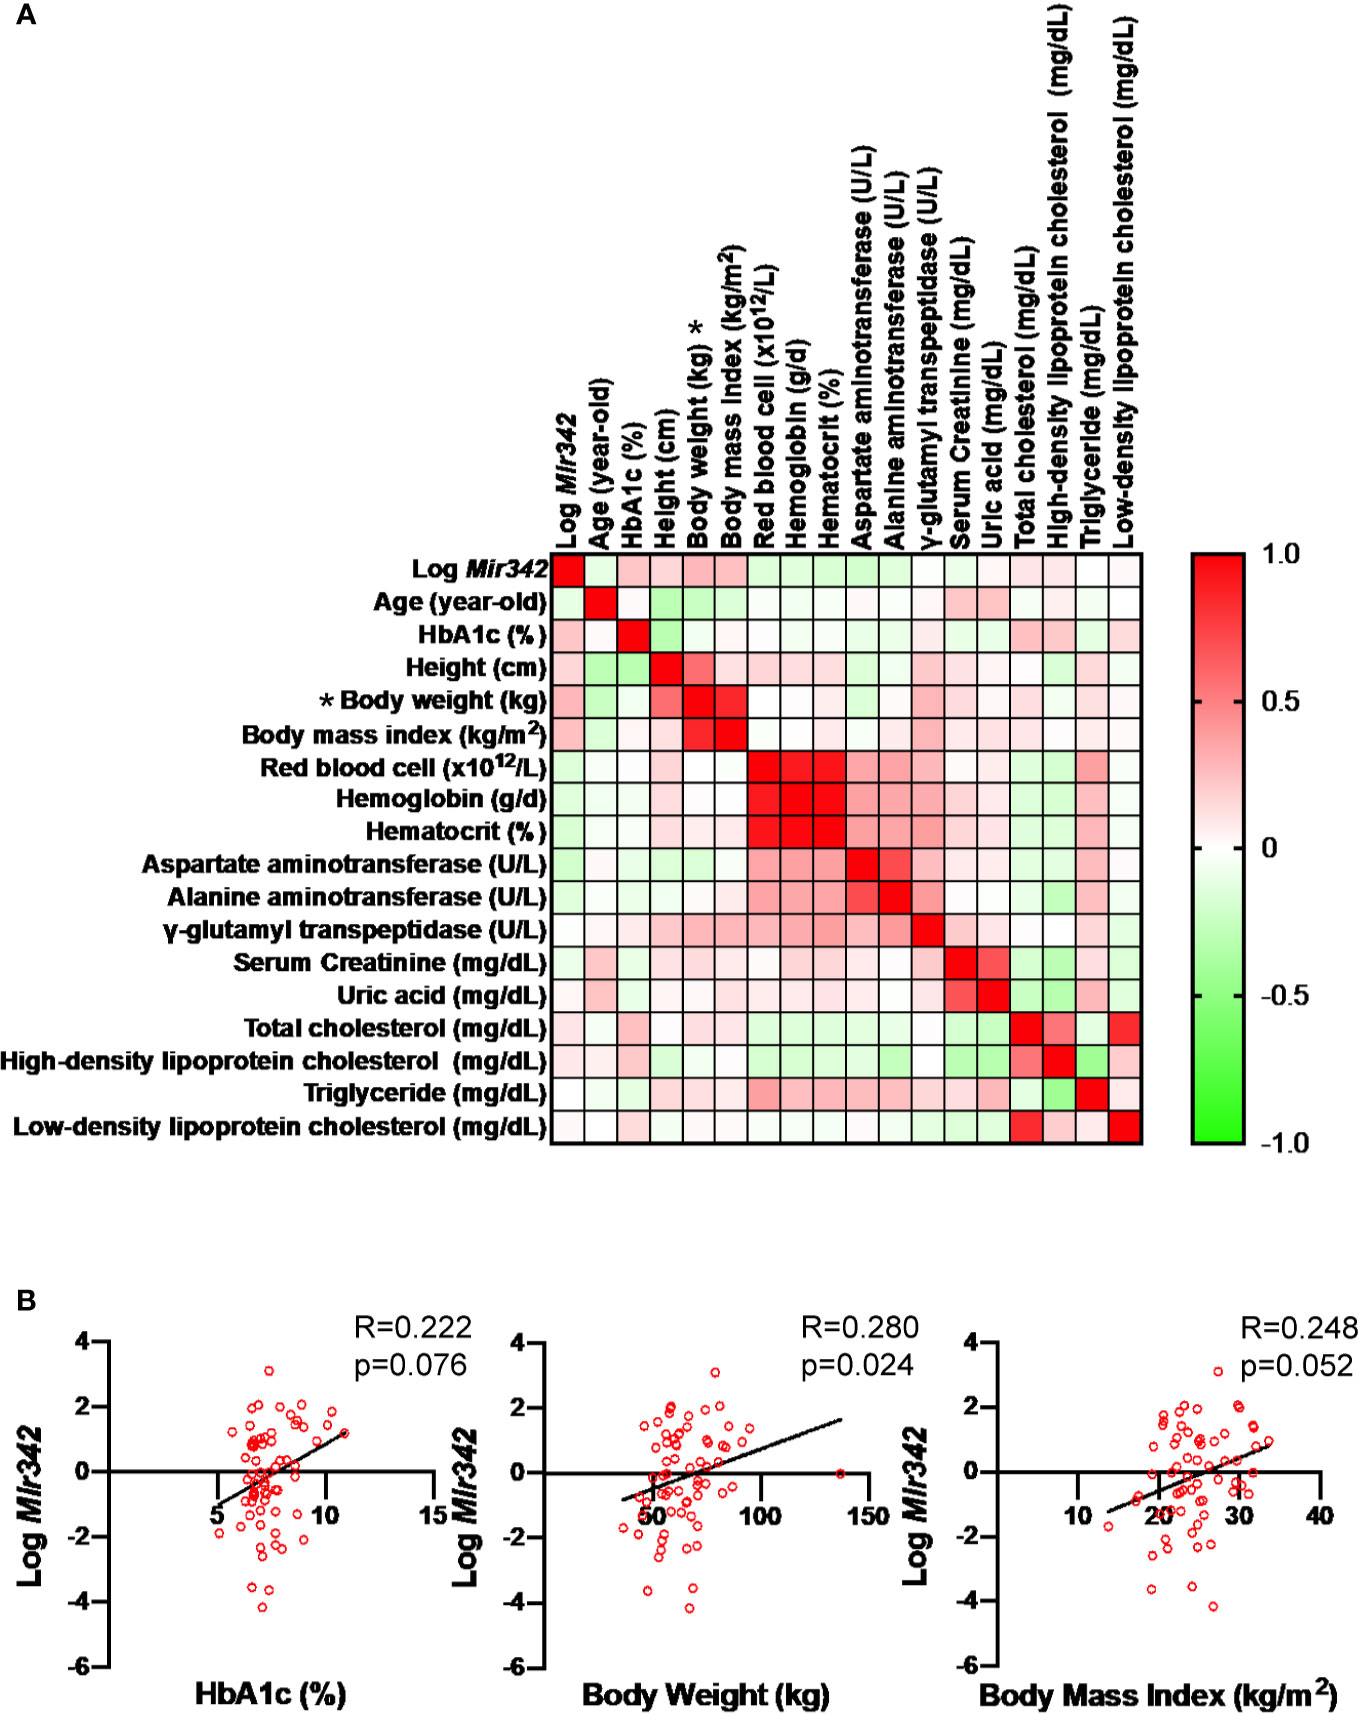
Figure 2 Correlation of serum mmu-mir-342-3p levels (Log Mir342) with various clinical parameters in the patients with type 2 diabetes (n=65). (A) In correlation matrix, Spearman’s rank correlation coefficient is shown. *P < 0.05. (B) The correlations between Log miR-342-3p (Log Mir342) with HbA1c (R=0.222, p=0.076), body weight (R=0.280, p=0.024) and body mass index (R=0.248, p=0.052).
Body weight of Mir342 (-/-) mice fed with HFHS chow was significantly reduced compared with Mir342 (+/+) mice. The weight of epididymal, subdermal and brown fat was also reduced in Mir342 (-/-) mice. The Mir342 (-/-) and Mir342 (+/+) mice fed with STD chow demonstrated no significant differences in their body and tissue weight (Figure 1B). The size of adipocytes in epididymal and subdermal adipose tissues derived from Mir342 (-/-) mice fed with HFHS chow was smaller compared with Mir342 (+/+) mice (Figure 1C). To investigate glucose homeostasis, we performed insulin tolerance test (ITT) and glucose tolerance test (GTT). The blood glucose levels of Mir342 (-/-) mice fed with HFHS chow were significantly reduced both in ITT and GTT (Figure 1D). In GTT, Mir342 (-/-) mice exhibited significantly lower serum insulin level at 30 and 60 minutes after the peritoneal injection of glucose solution (Figure 1E), indicating that insulin sensitivity was significantly improved in Mir342 (-/-) mice fed with HFHS chow. The levels of fasting serum leptin were also decreased in Mir342 (-/-) mice, suggesting improved leptin sensitivity (Figure 1F). To investigate whether reduced adiposity in Mir342 (-/-) mice was due to changes in energy intake or energy expenditure, we measured food intake, locomotor activity, and basal metabolic rates. Mir342 (-/-) mice at 16 weeks of age demonstrated reduced daily food intake under HFHS chow whereas no changes in STD chow (Figures 3A, B). To prove that increased food intake is the main cause of obesity, we performed pair-feeding experiments in mice fed with HFHS chow. The pair-fed Mir342 (+/+) mice demonstrated similar body weight with Mir342 (-/-) mice whereas significantly higher body weight and food consumption were demonstrated in free-fed Mir342 (+/+) mice after 12 weeks old (Figure 3C). The locomotor activity was recorded for over 24 hours, most of the activities were observed during the dark phase in all groups. The significantly increased activity was observed in Mir342 (-/-) mice under HFHS chow during 23:00-24:00; however, there were no significant differences during whole dark period (Supplementary Figures 2A, B). Dark-period oxygen consumption rate, V̇O2, was increased, while daily respiratory quotient (RQ) was reduced in Mir342 (-/-) mice fed with HFHS chow compared with Mir342 (+/+) mice (Supplementary Figures 2C, D). Since the changes in V̇O2 and RQ were rather mild, the data suggested that the reduction of food intake mainly contributed to the resistance to diet-induced obesity and diabetes in Mir342 (-/-) mice. There was no difference in the concentrations of miR-342-3p in both isolated exosome and total serum between Mir342 (+/+) fed with HFHS and STD chow (Supplementary Figure 3A). The gene expression of Cidea, Cox7a1, and Pparg was down regulated in brown adipose tissue of Mir342 (-/-) mice fed compared with Mir342 (+/+) mice fed with HFHS chow, while they were not altered in epididymal adipose tissue (Supplementary Figure 3B).
FIGURE 3
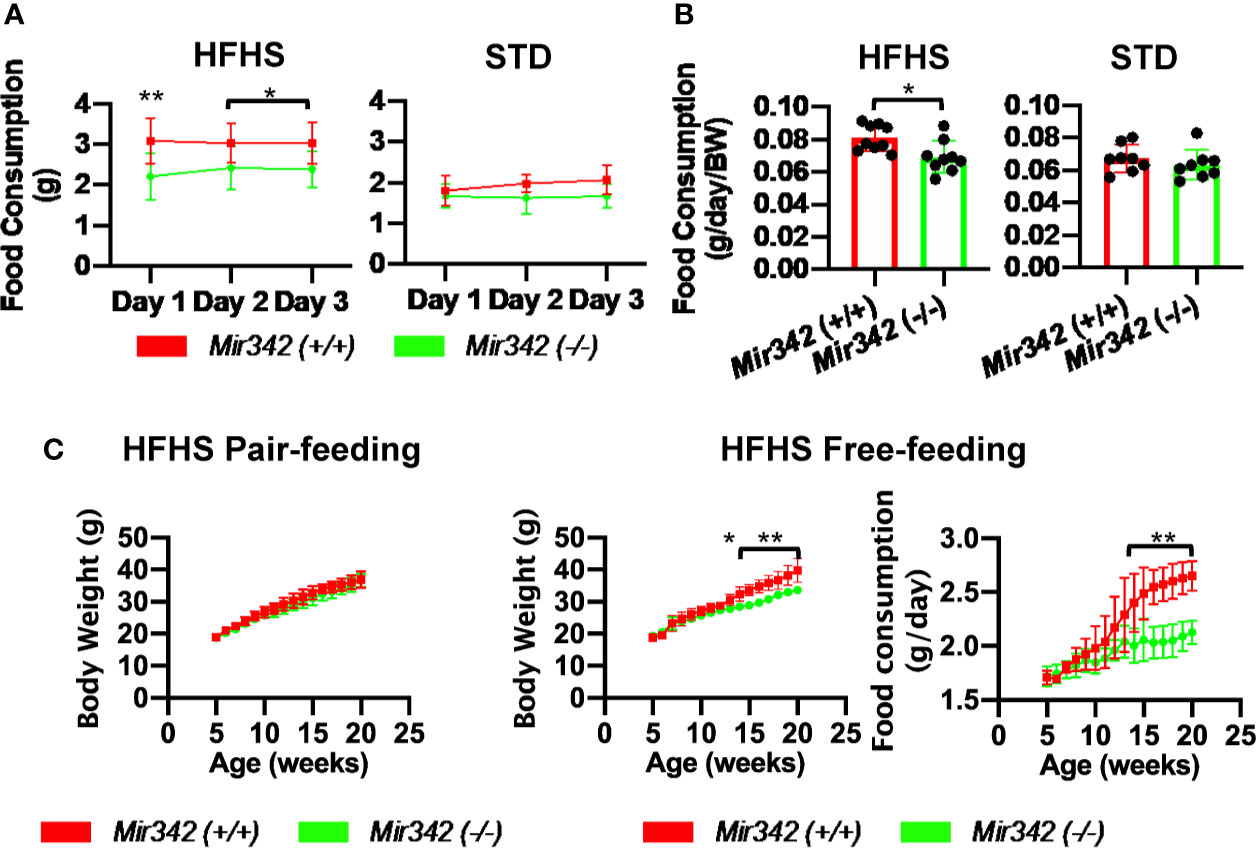
Figure 3 Food intake of Mir342 (-/-) and Mir342 (+/+) mice fed with high fat-high sucrose (HFHS) or standard (STD) chow. (A) Daily food intake over 3 consecutive days of mice fed with HFHS (n=9) or STD chow (n=8) at 18 weeks of age. (B) Average food intake over 3 days per g body weight of mice fed with HFHS (n=9) or STD chow (n=8). (C) Pair-feeding studies in Mir342 (+/+) and Mir342 (-/-) mice fed with HFHS chow (n=5). Free-feeding mice (n=3 in each group) were used as controls to match the food intake. Data shown as mean ± SD and analyzed by independent t-test or two-way ANOVA with Bonferroni tests (*p < 0.05; **p < 0.01).
Mir342 and Its Host Gene Evl Are Highly Expressed in Neurons Under HFHS Chow
Mir342 is located within an intron of the Evl (Enabled/vasodilator-stimulated phosphoprotein-like) gene, thus Evl is regarded as a host gene of Mir342 (Figure 4A). We further investigated Mir342 and Evl expression in various organs. miR-342-3p was abundantly expressed in spleen, brain and white adipose tissues and they were significantly upregulated in Mir342 (+/+) fed with HFHS compared with STD chow (Figure 4B). We further investigated the distribution of miR-342-3p in hypothalamus and ventral midbrain region, including ventral tegmental area and substantial nigra (Supplementary Figure 3C). miR-342-3p was upregulated by HFHS chow in both brain areas, and it was highly expressed in hypothalamus compared with midbrain region. The similar tissue distributions of Evl were observed and it was also significantly upregulated in brain and white adipose tissues in Mir342 (+/+) mice fed with HFHS chow (Figure 4C). Both expressions of Mir342 and Evl were regulated in parallel and rather accentuated in brain tissues compared with adipose tissues. In Mir342 (-/-) mice, the expression of miR-342-3p was absent in all tissues and mRNA expression of Evl was reduced in brain and adipose tissues compared with Mir342 (+/+) mice fed with HFHS chow without statistical significance (Figures 4B, C). The reduction of protein levels of EVL were confirmed by Western blot analyses using brain samples in Mir342 (-/-) mice fed with HFHS chow (Figure 4D and Supplementary Figure 4).
FIGURE 4
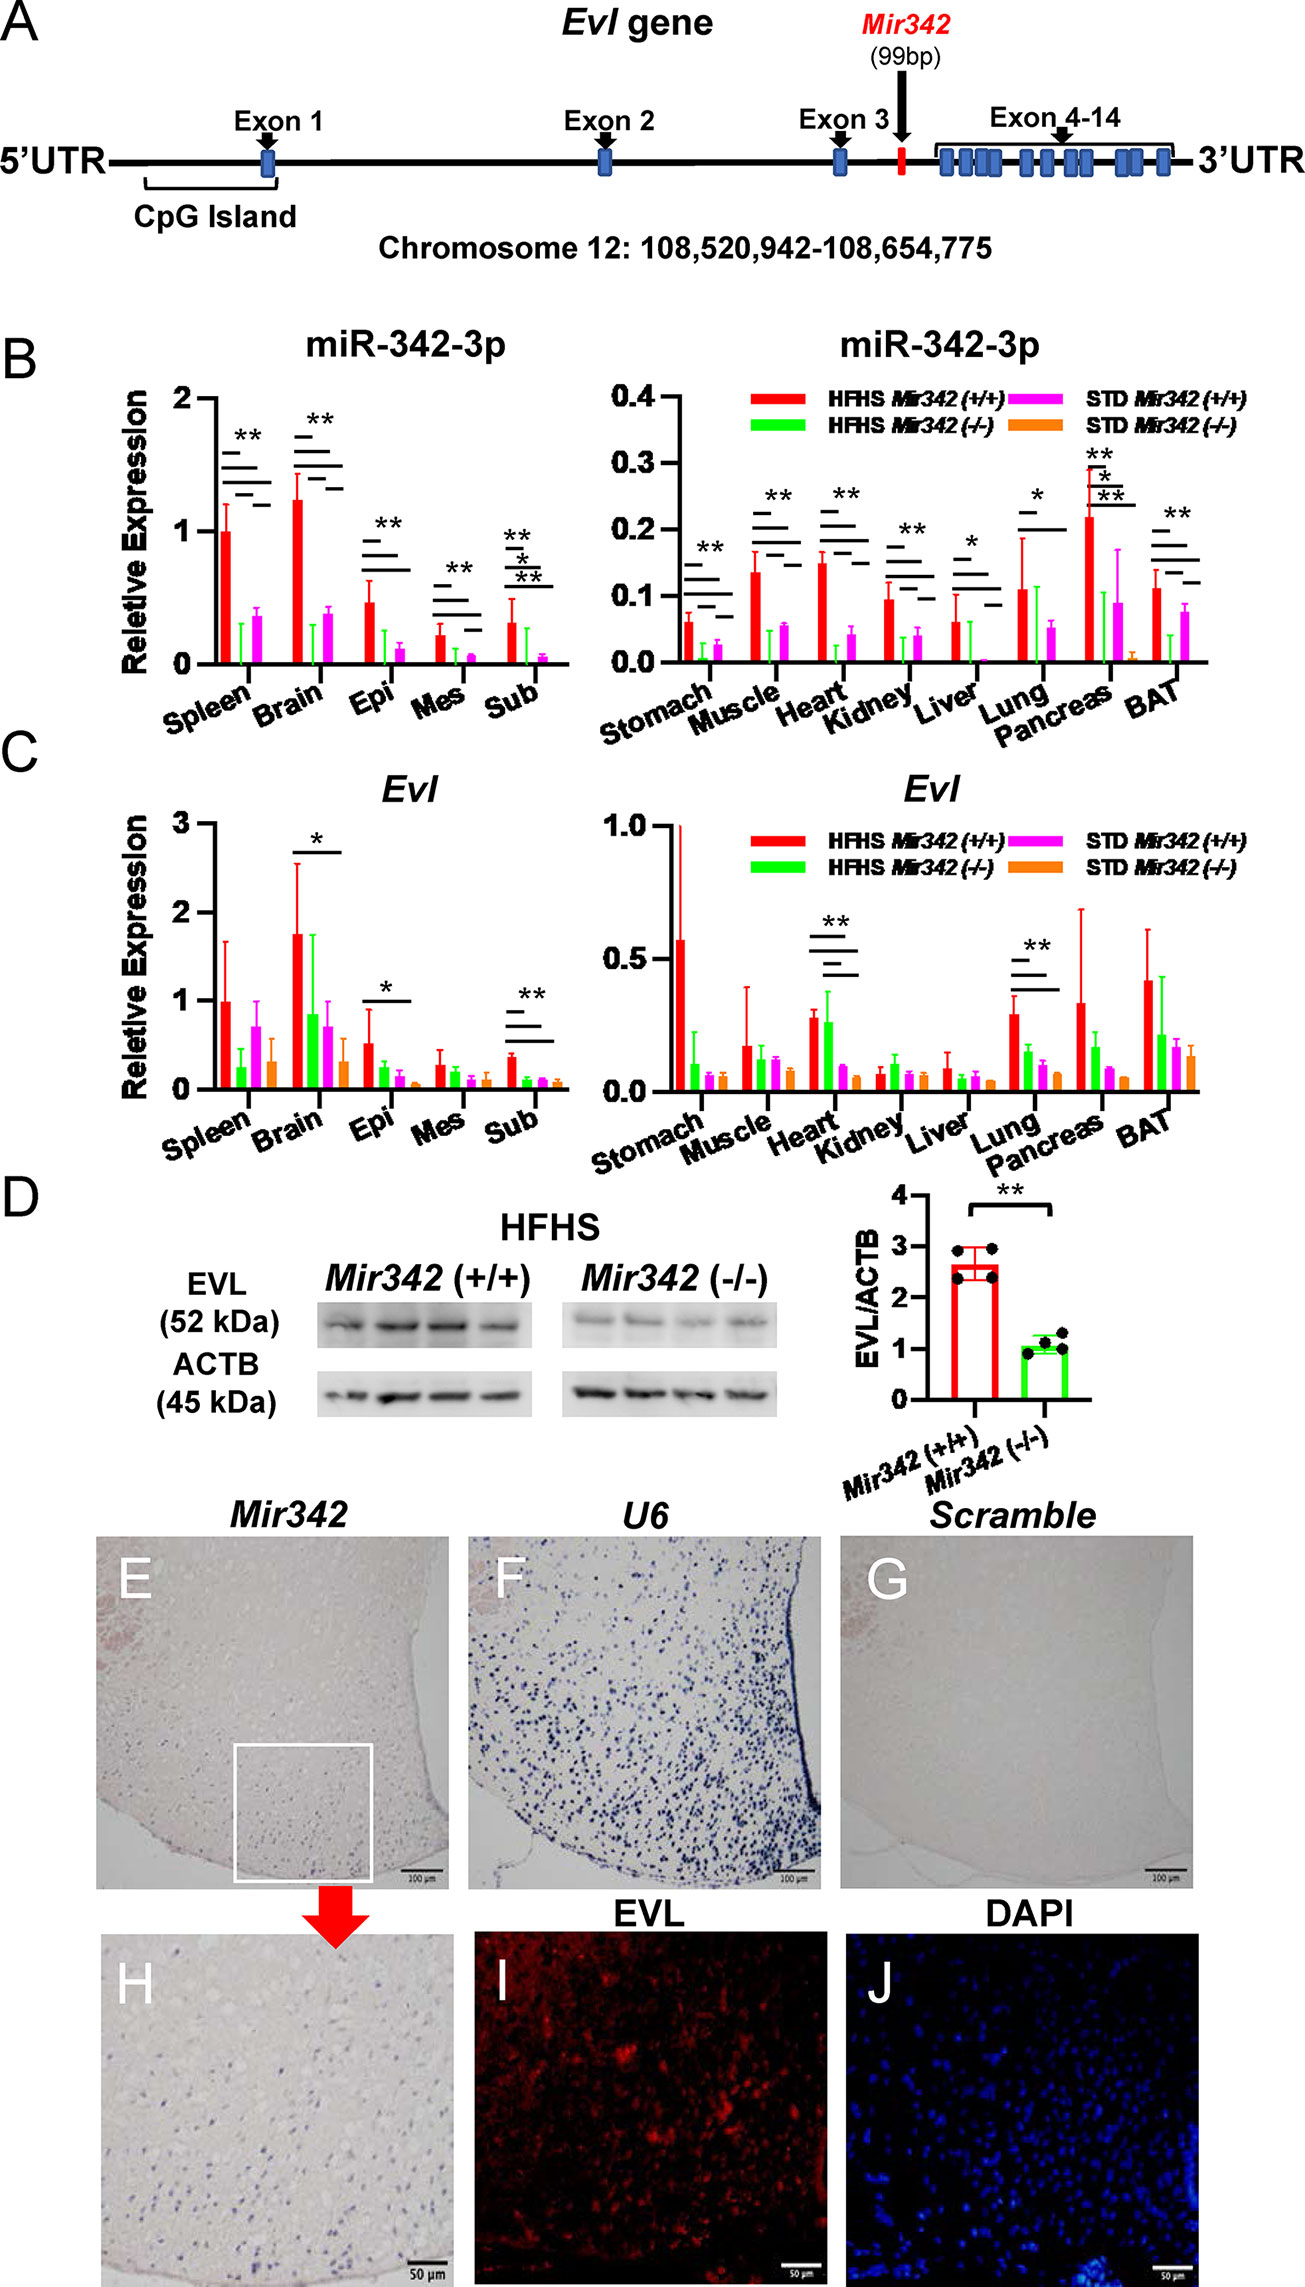
Figure 4 Expression of Mir342 and its host gene Evl. (A) Mir342 is an intronic miRNA in Evl (Enabled/Vasodilator-stimulated phosphoprotein) gene. (B, C) In various tissues, the expression of miR-342-3p is normalized by snoRNA202 and snoRNA234, while Evl is normalized by Rplp0 and Rn18s. HFHS Mir342 (+/+) (n=4), HFHS Mir342 (-/-) (n=3), STD Mir342 (+/+) (n=4) and STD Mir342 (-/-) mice (n=4). Bar=100 μm. Data are analyzed by one-way ANOVA with a Tukey test. (D) Western blot analyses and quantification of EVL protein levels of brain tissue normalized by β-actin (ACTB). Data are analyzed by independent t-test. (E–H) In in situ hybridization, the sections of hypothalamus from Mir342 (+/+) mice were hybridized with Mir342 probe (E; Mir342), U6 snRNA probe (F; U6), and Scramble-miR probe (G; Scramble). The inset in (E) is shown in panel (H). Immunostaining of EVL (red) in hypothalamus of Mir342 (+/+) mice (I) and nuclear staining of DAPI (blue) (J) are shown. Bars are 100 and 50 μm in panels (E, H), respectively. Data presented as means ± SD (*p < 0.05; **p < 0.01).
The expression of Evl is mainly regulated by the methylation status of CpG islands (13) and miRNA biogenesis is enhanced by DNA methylation in the regions flanking the miRNA coding sequence (14), we examined the DNA methylation status of 103 CpG sites ranging from the 5’ upstream to 3’UTR regions of the mouse Evl gene. The flanking regions of Mir342 (103,758-103,874 and 115,467-115,543 from TTS of Evl gene) were highly methylated. The immediate upstream (103,758-103,874 from TTS) of Mir342 demonstrated slightly increased methylation by HFHS chow (Supplementary Figure 5 and Supplementary Data) and it may be responsible for the upregulation of Mir342 by HFHS chow. In contrast, all samples of both STD and HFHS groups were demethylated throughout the CpG island located at 293-585 from TTS of Evl gene. The methylation status of CpG island was not responsible for the upregulation of Evl gene by HFHS chow.
Next, we investigated the localization of Mir342 in the cell fractions of epididymal adipose tissues. miR-342-3p was predominantly expressed in stromal vascular fraction (SVF), but lower in mature adipocytes (Supplementary Figure 6A). 3T3-L1 pre-adipocytes were induced to differentiate for 10 days, while Mir342 expression was continuously declined during differentiation (Supplementary Figure 6B). Double immunostaining demonstrated that EVL was colocalized with F4/80, indicating that adipose tissue macrophages express EVL (Supplementary Figures 6C–F). In cerebral cortex, EVL was colocalized with neuron marker (NeuN, neuronal nuclei), but EVL-positive cells were negative for the markers of dopaminergic neurons (TH, tyrosine hydroxylase), astrocytes (GFAP, glial fibrillary acidic protein), microglia (IBA1, ionized calcium binding adaptor molecule 1), and oligodendrocytes (MBP, myeline basic protein) (Supplementary Figure 7). In situ hybridization of Mir342 and immunostaining of EVL demonstrated that they showed similar distribution and their expressions were accentuated in arcuate nuclei in hypothalamus (Figures 4E–J). The data indicated that EVL and its intronic miRNA, Mir342, colocalized in cells and tissues, especially neurons in central nervous system, and their transcriptional activities were coregulated in a parallel manner.
NPY+EVL+ and NPY+pSTAT3+ Neurons Are Reduced in Mir342 (-/-) Mice
An important function of the hypothalamus is to control appetite and satiety. Neuropeptide Y (NPY) and proopiomelanocortin (POMC) neurons are main target of leptin and distribute in hypothalamus. The activation of POMC neurons decreases food intake whereas the activation of NPY neurons increases food intake. The activation of NPY and POMC neurons was investigated after the injection of leptin by double immunostainings of NPY, POMC and phosphorylated signal transducer and activator of transcription 3 (pSTAT3). We identified EVL-positive and EVL-negative NPY and POMC neuron populations in hypothalamus. The percentage of NPY+EVL+ cells in NPY+ neurons were significantly reduced in Mir342 (-/-) mice compared with Mir342 (+/+) mice in both STD and HFHS chow (Figure 5A and Supplementary Figures 8A, 9A). The total number of NPY+EVL+ neurons were significantly reduced in Mir342 (-/-) mice fed with HFHS chow (Figure 5A). Both percentage and number of activated NPY+pSTAT3+ neurons were significantly reduced in Mir342 (-/-) mice fed with HFHS chow (Figure 5B and Supplementary Figure 8B). No significant difference was obtained in the group of STD chow (Supplementary Figure 9B). In contrast, both percentage and total number of POMC+EVL+ were comparable in the two genotypes, and slight elevation was detected in percentage of POMC+pSTAT3+ neurons in Mir342 (-/-) mice (Figures 5C, D and Supplementary Figures 8C, D). However, there were no significant differences in POMC+EVL+ and POMC+pSTAT3+ neurons under STD chow (Supplementary Figures 9C, D). In Mir342 (-/-) mice fed with both STD and HFHS chow, total NPY+ neurons were reduced compared with Mir342 (+/+) mice, while POMC+ neurons were increased in HFHS chow (Figure 5E and Supplementary Figure 9E). Similar to the results of Western blot, EVL-positive cells were reduced in STD and HFHS chow, total pSTAT3+ cells were increased in Mir342 (-/-) mice in HFHS chow (Figure 5F and Supplementary Figure 9F). The results suggested that deficiency of Mir342 links to the reduced population and blunted activation of NPY orexigenic neurons, which result in reduced food intake and amelioration of obesity and diabetes under HFHS chow.
FIGURE 5
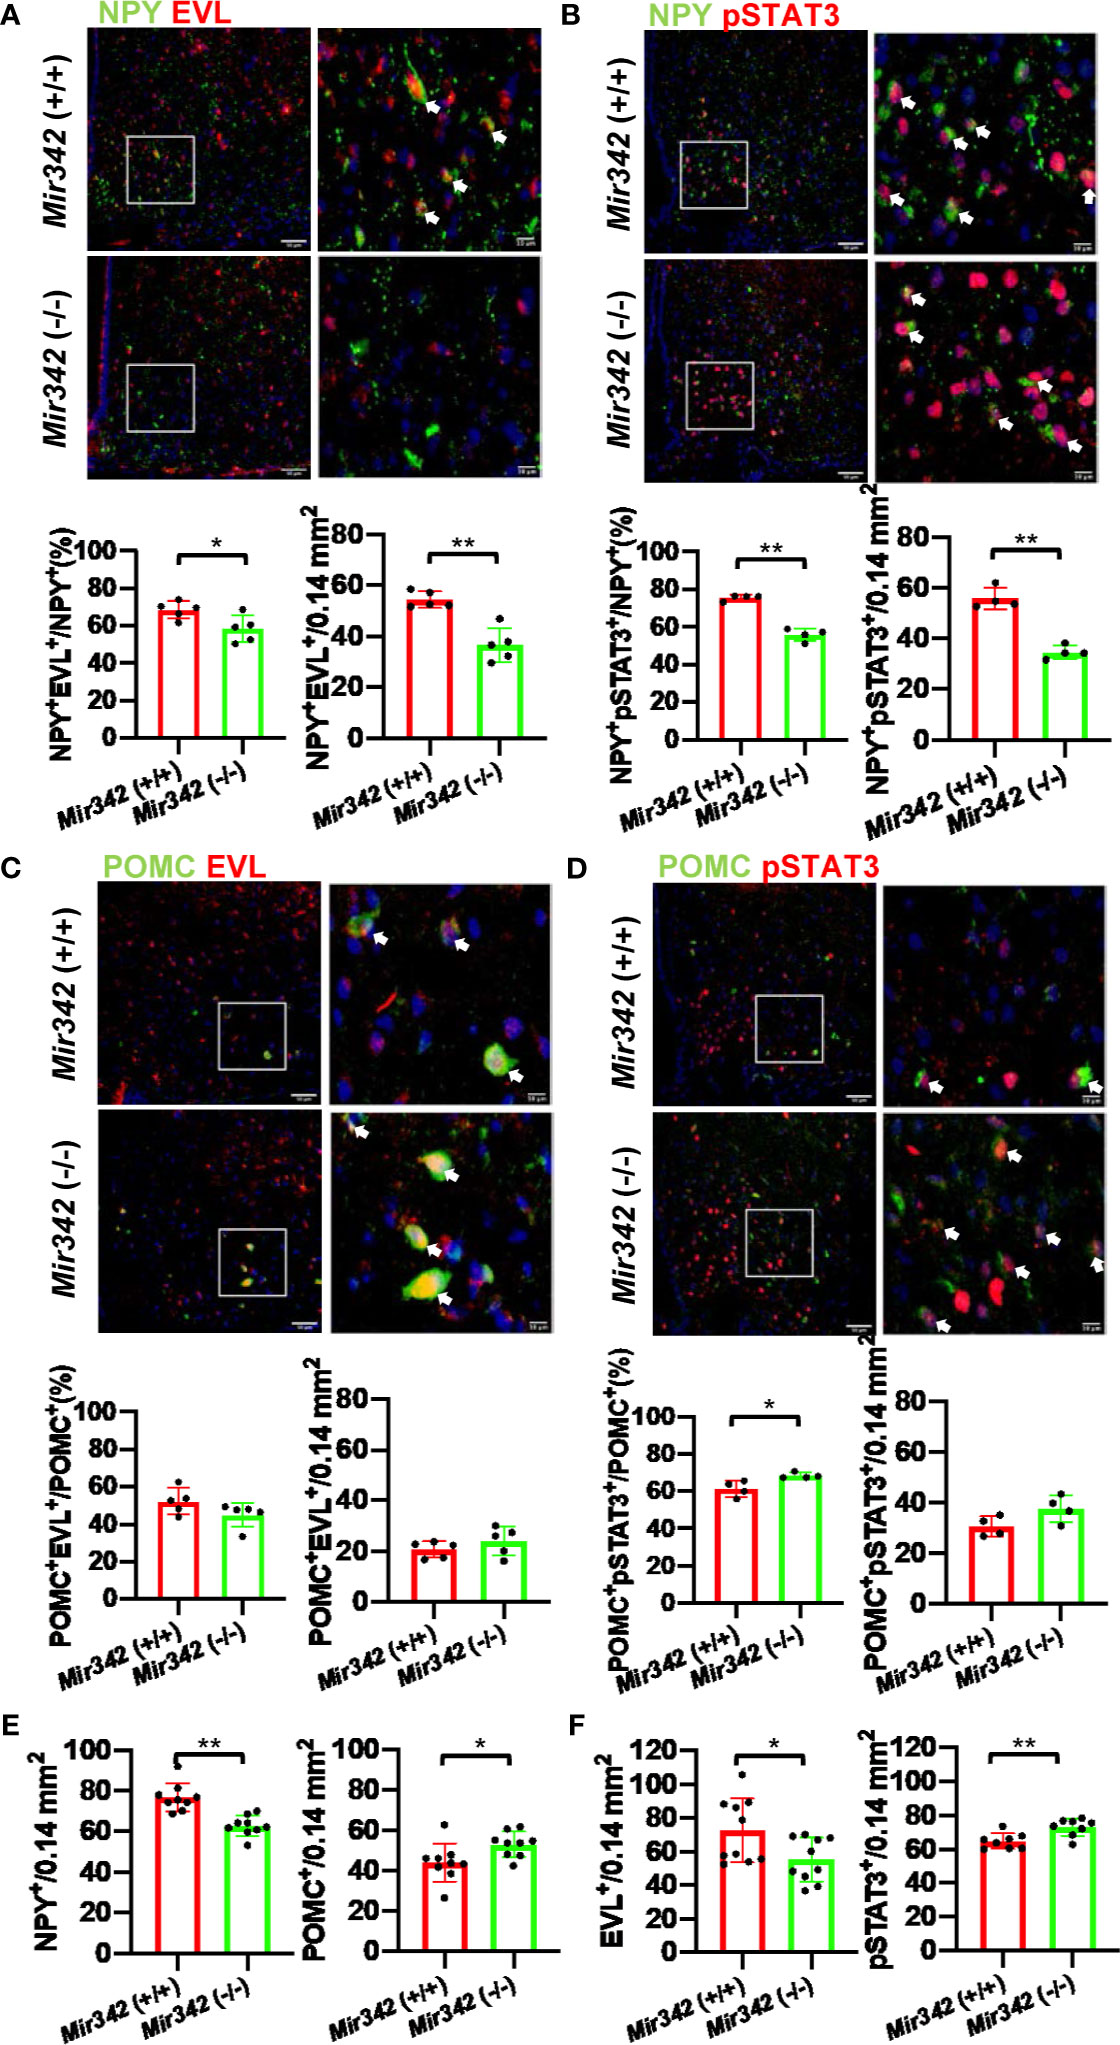
Figure 5 The activation of neuropeptide Y (NPY) and proopiomelanocortin (POMC) neurons by leptin injection. (A) Representative photographs of NPY (Green) and EVL (Red) double staining in arcuate nuclei from Mir342 (+/+) and Mir342 (-/-) mice fed with HFHS chow (n=5 each). The arrows indicate double-positive cells. The percentage and total numbers of NPY+EVL+ cells are shown. (B) NPY (Green) and pSTAT3 (Red) double staining in the mice fed with HFHS (n=4) after intraperitoneal injection of leptin (1 mg/kg body weight). The percentage and total numbers of NPY+pSTAT3+ cells are shown. (C) Double staining with POMC (Green) and EVL (Red) in Mir342 (+/+) and Mir342 (-/-) mice fed with HFHS chow (n=5). The percentage and total numbers of POMC+EVL+ cells are shown. (D) POMC (Green) and pSTAT3 (Red) double staining in the mice fed with HFHS (n=4) after intraperitoneal injection of leptin (1 mg/kg body weight). The percentage and total numbers of POMC+pSTAT3+ cells are shown. (E) Average cell numbers of NPY+ (n=9) and POMC+ (n=9) cells detected in hypothalamus of the mice fed with HFHS. (F) Average cell numbers of EVL+ (n=10) and pSTAT3+ (n=8) cells detected in hypothalamus of the mice fed with HFHS. Data shown as mean ± SD and analyzed by independent t-test (*p < 0.05; **p < 0.01).
Snap25 Is a Target of miR-342-3p
We further performed mRNA profiling by DNA microarray using total RNAs derived from epididymal fat tissues to identify the target genes (GSE163880). We compared 4 groups of Mir342 (+/+) and Mir342 (-/-) mice fed with STD and HFHS chow (Supplementary Tables 3–5). We selected the predicted target genes of miR-342-3p from TargetScan, miRDB, Pictar and DIANA-microT v5.0 (Supplementary Table 6). The results of gene chip demonstrated that Snap25 (synaptosomal-associated protein, 25kDa) was ranked as top among the genes upregulated in Mir342 (-/-) mice fed with both STD and HFHS chow (Supplementary Table 7). We performed RT-qPCR of top-ranked 3 mRNAs including Snap25, Fat2, and Msi1. In addition, we also check the expression of Nhlh2, since it was reported as hypothalamic basic helix-loop-helix transcription factor and the deletion of Nhlh2 in mice displays adult-onset obesity (15) (Figure 6). We confirmed that Snap25 mRNA increased in both brain and epididymal adipose tissues in Mir342 (-/-) mice fed with STD and HFHS chow (Figure 6A), while other 3 genes were not altered by the deletion of Mir342 in brain tissues (Figure 6D). Western blot analyses further confirmed that protein expression of SNAP25 was reduced in hypothalamus (Figure 6B and Supplementary Figure 4). Finally, luciferase reporter assay demonstrated that the transfection of Mir342 mimic reduced the luciferase activity of pmirGLO-Snap25 WT 3’-UTR. The luciferase activity of pmirGLO-Snap25 MT 3’-UTR was not altered by the co-transfection of Mir342 mimic (Figure 6C).
FIGURE 6
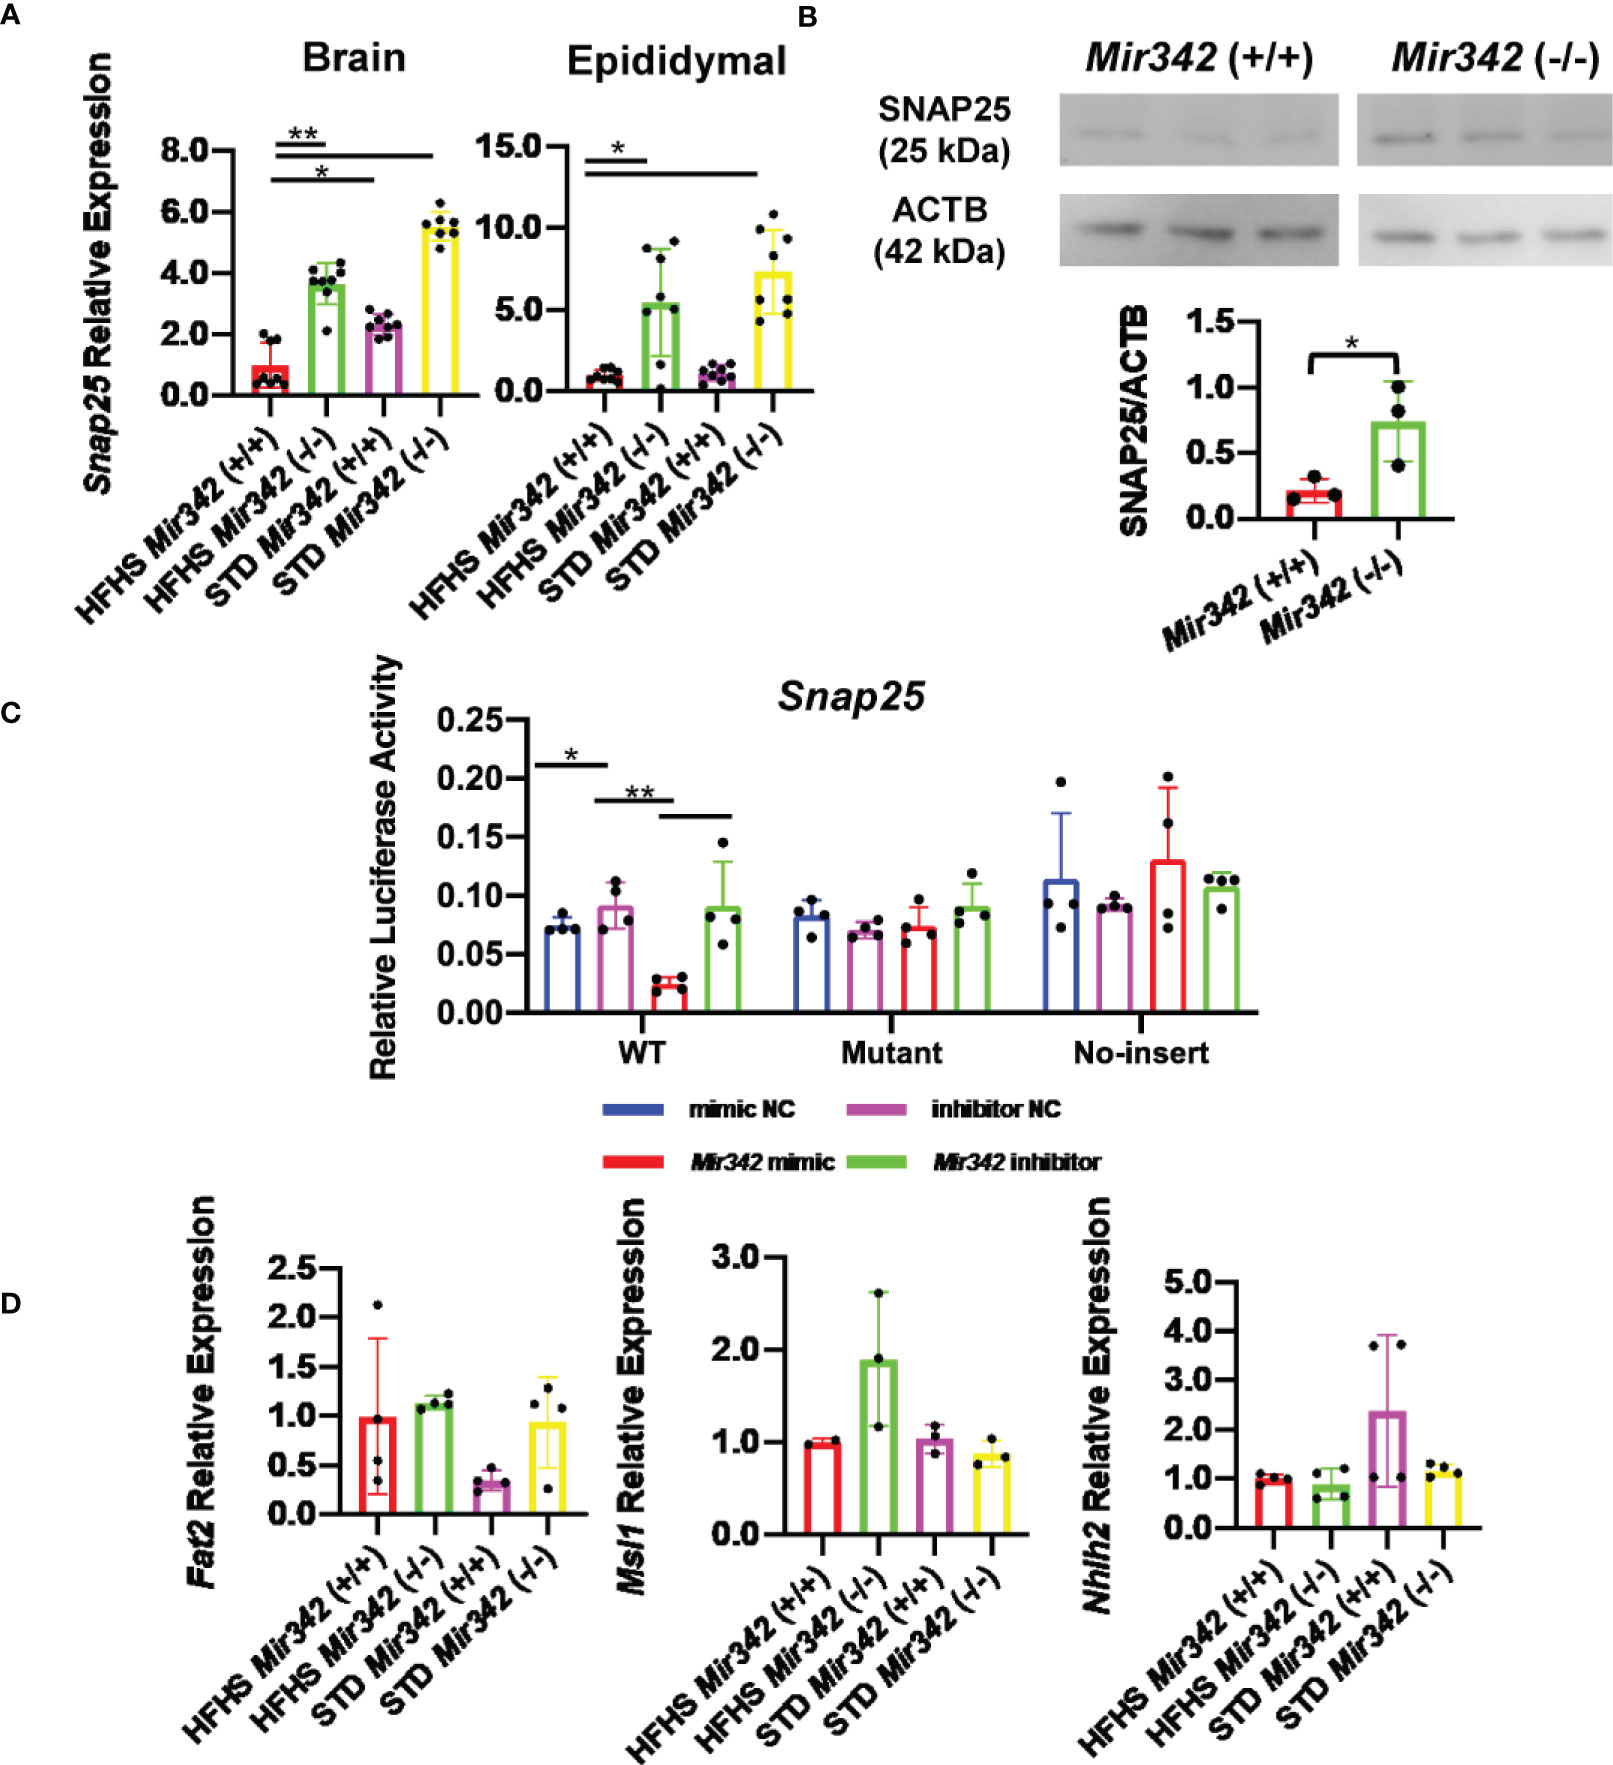
Figure 6 The expression and reporter assay of Snap25 (synaptosomal-associated protein, 25kDa). (A) Relative mRNA expression of Snap25 normalized by Rplp0 and Rn18s in brain and epididymal fat tissues detected by RT-qPCR. (B) Western blot analyses and quantification of SNAP25 protein levels in hypothalamus. (C) Dual-luciferase reporter assay. pmirGLO-Snap25 WT 3’-UTR, pmirGLO-Snap25 MT 3’-UTR, and pmirGLO no-insert control plasmids were cotransfected with Mir342 mimic, Mir342 inhibitor, negative control siRNA (mimic NC), inhibitor negative control (inhibitor NC) into HEK293T cells, respectively. (D) The expression of predicted target genes (Fat2, Msi1 and Nhlh2) in brain. Data are analyzed by independent t-test or one-way ANOVA with a Tukey test. All data are presented as mean ± SD (*p < 0.05; **p < 0.01).
Discussion
Mir342 was highly upregulated by HFHS chow in brain in mice, and the striking feature of Mir342 (-/-) mice fed with HFHS is that they were resistant to development of obesity and T2D. The food intake was reduced in Mir342 (-/-) mice fed with HFHS and the STAT3 activation of NPY orexigenic neurons was suppressed. By high throughput sequencing, arcuate and paraventricular nuclei were defined by abundant expression of Mirlet7, Mir7, Mir9, and Mir30 gene families (16), while Mirlet7a, Mir9, Mir30b, Mir100a, and Mir145 were altered by caloric restriction and high-fat diet in hypothalamus (17). The specific knockdown of Mir7 and knockout of Mir17-Mir92 in POMC neurons aggravated diet-induced obesity in females and males, respectively (18). In current investigation, we firstly demonstrate the expression of Mir342 in neurons in arcuate nucleus by in situ hybridization and functional relevance in control of appetite and satiety. Intriguingly, STD chow intake was not altered, while HFHS chow intake was reduced by the genetic deletion of Mir342. It suggested the roles of Mir342 and Evl in the appetite control for the lipid and sugar rich diet by the alter the development and activation of NPY/POMC progenitors (Supplementary Figure 10). We performed RT-qPCR for miR-342-3p in hypothalamus and ventral midbrain region including ventral tegmental area and substantial nigra; however, we did not check the status of dopaminergic neurons in ventral midbrain region in Mir342 (-/-) mice fed with HFHS. To further confirm whether the inhibition of miR-342-3p is a new therapeutic modality to control appetite and satiety in obesity, the experiments with neuron specific Mir342 knockout and transgenic mice, and direct injection of miR-342-3p mimic and antagomir are required.
Another major site of Mir342 expression is adipose tissue. The upregulated expression of Mir342 in white adipose tissue was reported in diet-induced obese mice (19) and ob/ob mice (20) and also in the patients with HIV-induced lipodystrophy (21). miR-342-3p promotes the adipogenesis in mesenchymal stem cells by suppressing CtBP2 and releasing C/EBPα from CtBP2 binding (22). In the female patients with T2D and impaired fasting glucose (IFG), miRNAs including miR-342-3p were upregulated and in silico enrichment analyses suggested the 11 top differentially expressed miRNAs possibly involved in oxidative stress, inflammation and insulin signaling (23). In our study, miR-342-3p was prominently expressed in SVF of epididymal adipose tissue and we were interested in the status of inflammation. However, the gene expression of Il6, Il1b and Tnf were not altered in epididymal adipose tissues.
Epigenetic silencing of MIR342 and its host gene EVL by DNA methylation was reported in colorectal cancer (13, 24, 25), multiple myeloma (26), and B cell lymphoma (27) from the patients. CpG island is located at the promotor region of EVL gene, while the expression of EVL and intronic miR-342-3p is coregulated in parallel. The DNA methylation of CpG island causes the reduction of miR-342-3p, which is resulted in failure to operate tumor suppressor function by inhibiting pro-survival autophagy by targeting MAP1LC3B and DNMT1 in B cell lymphoma (27). In various tissues of Mir342 (+/+) mice fed with HFHS chow, the expression of Evl and miR-342-3p upregulated in parallel and both genes demonstrated tight co-expression. EVL gene is suppressed in colon cancer cells and associated with a dense methylation of CpG island in the 5’-UTR region of EVL, which is known as tumor suppressor gene (13). In contrast to previous studies, genomic DNAs in Mir342 (+/+) mice fed with STD and HFHS were demethylated throughout the CpG island located at 293-585 from TTS of Evl gene. However, the flanking regions of Mir342 were highly methylated. It has been reported that miRNA biogenesis is enhanced by DNA methylation in the regions flanking the miRNA coding sequence (14). It suggested that transcriptional activity of Evl and Mir342 under HFHS chow are differentially regulated by site-specific DNA methylation in the brain. EVL also involves in the actin cytoskeleton formation and multiple actin-dependent process such as axonal morphogenesis and neurites formation (28). One can speculate that the upregulation of Evl in neurons and adipose tissue macrophages may alter the neuronal function and motility of macrophages by facilitating the actin cytoskeletal formation, respectively. However, in current investigation, the Evl expression was maintained in brain and adipose tissues from Mir342 (-/-) mice fed with HFHS chow, the roles of Evl in obesity and T2D remains unexplored.
In current investigation, we identified Snap25 as one of the major target genes of miR-342-3p. Snap25 is an important component of the soluble N-ethylmaleimide-sensitive factor attachment protein (SNARE) complex, contributes formation of 2 out of 4 α helices of the complex, and regulates the membrane fusion during the process of exocytosis (29). The SNARE-mediated fusion such as exocytic fusion and synaptic transmission involved vesicle-associated membrane protein-2 (VAMP2), SNAP25, and syntaxin-1, which are sufficient to fuse membranes in vitro experiments (30). Snap25 is developmentally regulated in neuroendocrine cells and SNAP25a precedes SNAP25b in the development of mouse brain, and SNAP25b becomes major splicing variant at the 2nd postnatal week (31). SNAP25b containing SNARE complexes demonstrate a higher degree of stability associated with increased numbers of pooled and primed vesicles (32). Snap25b deficient mice fed with HFHS diet demonstrated exacerbated hyperglycemia, liver steatosis, adipocyte hypertrophy, and reduced expression of pSTAT3 in hypothalamic samples (33), suggesting reduction of SNARE complex stability tightly linked to the obesity and diabetes phenotypes (29). In human studies, SNAP25 gene single nucleotide polymorphism (SNP, rs362551) associated with severity of metabolic syndrome and type 2 diabetes (34). In addition, SNAP25 interacting protein such as syntaxin-1 SNPs were also associated with obesity (35) and type 2 diabetes (36). Prominent upregulation of miR-342-3p and subsequent reduction of Snap25 expression in neurons in hypothalamus may link to the instability of SNARE complexes and impairment of neurotransmission.
Taken together, upregulation of Mir342 and its host gene Evl in brain and adipose tissues tightly links to the metabolic syndrome phenotype of HFHS chow induced obesity mice. Percentage activated NPY+pSTAT3+ neurons were reduced while POMC+pSTAT3+ neurons increased in Mir342 (-/-) mice, and they demonstrated the reduction of food intake and amelioration of metabolic phenotypes. We also identified that the major target gene of miR-342-3p is Snap25 and the functional impairment of SNARE complexes in arcuate nucleus neurons may link to the excess of food intake under HFHS chow. The future studies are necessary to validate the beneficial effects of miR-342-3p antagomir by proof of concept (POC) study using the disease animal models.
Limitation of Study
In this study, we demonstrated Mir342 and Evl are co-expressed in the central nervous system and adipose tissues, and they were highly upregulated by HFHS chow in C57BL/6JJcl mice. The functional roles of Mir342 in obesity were demonstrated in the study by investigating Mir342 (-/-) mice, however, the expression of Evl was maintained in Mir342 (-/-) mice and role of Evl in obesity and T2D remains elusive. We examined the expression of miR-342-3p in the sera, exosomes, and various tissues, however, inter-organ communication was not clearly demonstrated, since we did not inject the labeled miR-342-3p into the animal model. The transcriptional regulation of miRNAs is not fully understood, and we did not find out the transcription factors which regulated the expression of Mir342 and Evl. We mainly investigated the major mature form of Mir342, i.e., miR-342-3p, however, minor mature form of miR-342-5p may have a role in obesity and T2D.
Data Availability Statement
The raw data supporting the conclusions of this article will be made available by the authors, without undue reservation. RNA sequencing and mRNA microarray data generated in this study is available at GEO: GSE61959 and GSE163880.
Ethics Statement
The observational clinical study was approved by Okayama University Graduate School of Medicine, Dentistry and Pharmaceutical Sciences and Okayama University Hospital, Ethics Committee (#1708-045). The patients/participants provided their written informed consent to participate in this study. All animal experiments were approved by the Animal Care and Use Committee of the Department of Animal Resources, Advanced Science Research Center, Okayama University (OKU-2015547, 2016030, 2016203, 2018477, and 2018480).
Author Contributions
DZ, SY, TH, AK, and JW designed the project and experiments and wrote the manuscript. DZ, SY, XZ, BY, NK, RS, and HA performed animal experiments and analyzed and interpreted data. AN and JE performed culture experiments and molecular biology experiments. TH and AK performed immunohistochemistry of brain tissue. SY, NK, AN, JE, and JW designed clinical study using human serum samples. All authors contributed to the article and approved the submitted version.
Funding
This work was supported by a Grant-in-Aid for Scientific Research (B) 19H03675, Japan Agency for Medical Research and Development (AMED, grant no: 17ek0210095h0001, 20ek0109445h0001).
Conflict of Interest
JW receives speaker honoraria from Astra Zeneca, Daiichi Sankyo, MSD, Novartis, Tanabe Mitsubishi, Taisho Toyama and receives grant support from Baxter, Chugai, Dainippon Sumitomo, Ono, Teijin.
The remaining authors declare that the research was conducted in the absence of any commercial or financial relationships that could be construed as a potential conflict of interest.
Publisher’s Note
All claims expressed in this article are solely those of the authors and do not necessarily represent those of their affiliated organizations, or those of the publisher, the editors and the reviewers. Any product that may be evaluated in this article, or claim that may be made by its manufacturer, is not guaranteed or endorsed by the publisher.
Acknowledgments
We greatly appreciate Prof. Masato Asanuma, Dr. Ikuko Miyazaki, and Nami Isooka at Department of Medical Neurobiology, Okayama University Graduate School of Medicine, Dentistry and Pharmaceutical Sciences for the valuable discussion. We also thank Nami Isooka for excellent technical support. We acknowledge support from Central Research Laboratory, Okayama University Medical School; usage of BECKMAN COULTER XL 80, ABI PRISM3130, and producing paraffin blocks and sections.
Supplementary Material
The Supplementary Material for this article can be found online at: https://www.frontiersin.org/articles/10.3389/fendo.2021.727915/full#supplementary-material
References
1. Winter J, Jung S, Keller S, Gregory RI, Diederichs S. Many Roads to Maturity: microRNA Biogenesis Pathways and Their Regulation. Nat Cell Biol (2009) 11:228–34. doi: 10.1038/ncb0309-228
2. Perdikopanis N, Georgakilas GK, Grigoriadis D, Pierros V, Kavakiotis I, Alexiou P, et al. DIANA-Mirgen V4: Indexing Promoters and Regulators for More Than 1500 microRNAs. Nucleic Acids Res (2021) 49:D151–D9. doi: 10.1093/nar/gkaa1060
3. Schanen BC, Li X. Transcriptional Regulation of Mammalian miRNA Genes. Genomics (2011) 97:1–6. doi: 10.1016/j.ygeno.2010.10.005
4. Eliasson L, Regazzi R. Micro(RNA) Management and Mismanagement of the Islet. J Mol Biol (2020) 432:1419–28. doi: 10.1016/j.jmb.2019.09.017
5. La Sala L, Micheloni S, De Nigris V, Prattichizzo F, Ceriello A. Novel Insights Into the Regulation of miRNA Transcriptional Control: Implications for T2D and Related Complications. Acta Diabetol (2018) 55:989–98. doi: 10.1007/s00592-018-1149-4
6. Hashimoto N, Tanaka T. Role of miRNAs in the Pathogenesis and Susceptibility of Diabetes Mellitus. J Hum Genet (2017) 62:141–50. doi: 10.1038/jhg.2016.150
7. Kameswaran V, Bramswig NC, McKenna LB, Penn M, Schug J, Hand NJ, et al. Epigenetic Regulation of the DLK1-MEG3 microRNA Cluster in Human Type 2 Diabetic Islets. Cell Metab (2014) 19:135–45. doi: 10.1016/j.cmet.2013.11.016
8. Spracklen CN, Horikoshi M, Kim YJ, Lin K, Bragg F, Moon S, et al. Identification of Type 2 Diabetes Loci in 433,540 East Asian Individuals. Nature (2020) 582:240–5. doi: 10.1038/s41586-020-2263-3
9. Moon YS, Smas CM, Lee K, Villena JA, Kim KH, Yun EJ, et al. Mice Lacking Paternally Expressed Pref-1/Dlk1 Display Growth Retardation and Accelerated Adiposity. Mol Cell Biol (2002) 22:5585–92. doi: 10.1128/mcb.22.15.5585-5592.2002
10. Ji C, Guo X. The Clinical Potential of Circulating microRNAs in Obesity. Nat Rev Endocrinol (2019) 15:731–43. doi: 10.1038/s41574-019-0260-0
11. Higuchi C, Nakatsuka A, Eguchi J, Teshigawara S, Kanzaki M, Katayama A, et al. Identification of Circulating miR-101, miR-375 and miR-802 as Biomarkers for Type 2 Diabetes. Metabolism (2015) 64:489–97. doi: 10.1016/j.metabol.2014.12.003
12. Prosser HM, Koike-Yusa H, Cooper JD, Law FC. Bradley A. A Resource of Vectors and ES Cells for Targeted Deletion of microRNAs in Mice. Nat Biotechnol (2011) 29:840–5. doi: 10.1038/nbt.1929
13. Grady WM, Parkin RK, Mitchell PS, Lee JH, Kim YH, Tsuchiya KD, et al. Epigenetic Silencing of the Intronic microRNA hsa-miR-342 and Its Host Gene EVL in Colorectal Cancer. Oncogene (2008) 27:3880–8. doi: 10.1038/onc.2008.10
14. Glaich O, Parikh S, Bell RE, Mekahel K, Donyo M, Leader Y, et al. DNA Methylation Directs microRNA Biogenesis in Mammalian Cells. Nat Commun (2019) 10:5657. doi: 10.1038/s41467-019-13527-1
15. Good DJ, Porter FD, Mahon KA, Parlow AF, Westphal H, Kirsch IR. Hypogonadism and Obesity in Mice With a Targeted Deletion of the Nhlh2 Gene. Nat Genet (1997) 15:397–401. doi: 10.1038/ng0497-397
16. Amar L, Benoit C, Beaumont G, Vacher CM, Crepin D, Taouis M, et al. MicroRNA Expression Profiling of Hypothalamic Arcuate and Paraventricular Nuclei From Single Rats Using Illumina Sequencing Technology. J Neurosci Methods (2012) 209:134–43. doi: 10.1016/j.jneumeth.2012.05.033
17. Sangiao-Alvarellos S, Pena-Bello L, Manfredi-Lozano M, Tena-Sempere M, Cordido F. Perturbation of Hypothalamic microRNA Expression Patterns in Male Rats After Metabolic Distress: Impact of Obesity and Conditions of Negative Energy Balance. Endocrinol (2014) 155:1838–50. doi: 10.1210/en.2013-1770
18. Gao Y, Li J, Zhang Z, Zhang R, Pollock A, Sun T. MicroRNA miR-7 and miR-17-92 in the Arcuate Nucleus of Mouse Hypothalamus Regulate Sex-Specific Diet-Induced Obesity. Mol Neurobiol (2019) 56:7508–21. doi: 10.1007/s12035-019-1618-y
19. Chartoumpekis DV, Zaravinos A, Ziros PG, Iskrenova RP, Psyrogiannis AI, Kyriazopoulou VE, et al. Differential Expression of microRNAs in Adipose Tissue After Long-Term High-Fat Diet-Induced Obesity in Mice. PloS One (2012) 7:e34872. doi: 10.1371/journal.pone.0034872
20. Oger F, Gheeraert C, Mogilenko D, Benomar Y, Molendi-Coste O, Bouchaert E, et al. Cell-Specific Dysregulation of microRNA Expression in Obese White Adipose Tissue. J Clin Endocrinol Metab (2014) 99:2821–33. doi: 10.1210/jc.2013-4259
21. Squillace N, Bresciani E, Torsello A, Bandera A, Sabbatini F, Giovannetti C, et al. Changes in Subcutaneous Adipose Tissue microRNA Expression in HIV-Infected Patients. J Antimicrob Chemother (2014) 69:3067–75. doi: 10.1093/jac/dku264
22. Wang L, Xu L, Xu M, Liu G, Xing J, Sun C, et al. Obesity-Associated MiR-342-3p Promotes Adipogenesis of Mesenchymal Stem Cells by Suppressing CtBP2 and Releasing C/EBPalpha From CtBP2 Binding. Cell Physiol Biochem (2015) 35:2285–98. doi: 10.1159/000374032
23. Strycharz J, Wroblewski A, Zieleniak A, Swiderska E, Matyjas T, Rucinska M, et al. Visceral Adipose Tissue of Prediabetic and Diabetic Females Shares a Set of Similarly Upregulated microRNAs Functionally Annotated to Inflammation, Oxidative Stress and Insulin Signaling. Antioxidants (Basel) (2021) 10(1):101. doi: 10.3390/antiox10010101
24. Mokarram P, Kumar K, Brim H, Naghibalhossaini F, Saberi-firoozi M, Nouraie M, et al. Distinct High-Profile Methylated Genes in Colorectal Cancer. PloS One (2009) 4:e7012. doi: 10.1371/journal.pone.0007012
25. Yi JM, Dhir M, Van Neste L, Downing SR, Jeschke J, Glockner SC, et al. Genomic and Epigenomic Integration Identifies a Prognostic Signature in Colon Cancer. Clin Cancer Res (2011) 17:1535–45. doi: 10.1158/1078-0432.CCR-10-2509
26. Li Z, Wong KY, Chan GC, Chng WJ, Chim CS. Epigenetic Silencing of EVL/miR-342 in Multiple Myeloma. Transl Res (2018) 192:46–53. doi: 10.1016/j.trsl.2017.11.005
27. Zhang MY, Calin GA, Yuen KS, Jin DY, Chim CS. Epigenetic Silencing of miR-342-3p in B Cell Lymphoma and Its Impact on Autophagy. Clin Epigenetics (2020) 12:150. doi: 10.1186/s13148-020-00926-1
28. Menzies AS, Aszodi A, Williams SE, Pfeifer A, Wehman AM, Goh KL, et al. Mena and Vasodilator-Stimulated Phosphoprotein are Required for Multiple Actin-Dependent Processes That Shape the Vertebrate Nervous System. J Neurosci (2004) 24:8029–38. doi: 10.1523/JNEUROSCI.1057-04.2004
29. Irfan M, Daraio T, Bark C. SNAP-25 Puts SNAREs at Center Stage in Metabolic Disease. Neuroscience (2019) 420:86–96. doi: 10.1016/j.neuroscience.2018.07.035
30. Urbina FL, Gupton SL. SNARE-Mediated Exocytosis in Neuronal Development. Front Mol Neurosci (2020) 13:133. doi: 10.3389/fnmol.2020.00133
31. Bark IC, Hahn KM, Ryabinin AE, Wilson MC. Differential Expression of SNAP-25 Protein Isoforms During Divergent Vesicle Fusion Events of Neural Development. Proc Natl Acad Sci U S A (1995) 92:1510–4. doi: 10.1073/pnas.92.5.1510
32. Johansson JU, Ericsson J, Janson J, Beraki S, Stanic D, Mandic SA, et al. An Ancient Duplication of Exon 5 in the Snap25 Gene is Required for Complex Neuronal Development/Function. PloS Genet (2008) 4:e1000278. doi: 10.1371/journal.pgen.1000278
33. Valladolid-Acebes I, Daraio T, Brismar K, Harkany T, Ogren SO, Hokfelt TG, et al. Replacing SNAP-25b With SNAP-25a Expression Results in Metabolic Disease. Proc Natl Acad Sci U S A (2015) 112:E4326–35. doi: 10.1073/pnas.1511951112
34. Chen YL, Pei D, Hung YJ, Lee CH, Hsiao FC, Wu CZ, et al. Associations Between Genetic Variants and the Severity of Metabolic Syndrome in Subjects With Type 2 Diabetes. Genet Mol Res (2015) 14:2518–26. doi: 10.4238/2015.March.30.10
35. Romeo S, Sentinelli F, Cavallo MG, Leonetti F, Fallarino M, Mariotti S, et al. Search for Genetic Variants of the SYNTAXIN 1a (STX1A) Gene: The -352 a>T Variant in the STX1A Promoter Associates With Impaired Glucose Metabolism in an Italian Obese Population. Int J Obes (Lond) (2008) 32:413–20. doi: 10.1038/sj.ijo.0803743
Keywords: abdominal obesity, non-coding RNAs, adipose tissues, appetite regulation, hypothalamus
Citation: Zhang D, Yamaguchi S, Zhang X, Yang B, Kurooka N, Sugawara R, Albuayjan HHH, Nakatsuka A, Eguchi J, Hiyama TY, Kamiya A and Wada J (2021) Upregulation of Mir342 in Diet-Induced Obesity Mouse and the Hypothalamic Appetite Control. Front. Endocrinol. 12:727915. doi: 10.3389/fendo.2021.727915
Received: 20 June 2021; Accepted: 10 August 2021;
Published: 30 August 2021.
Edited by:
Marc Thibonnier, AptamiR Therapeutics Inc., United StatesReviewed by:
Yuko Maejima, Fukushima Medical University, JapanDenise D. Belsham, University of Toronto, Canada
Copyright © 2021 Zhang, Yamaguchi, Zhang, Yang, Kurooka, Sugawara, Albuayjan, Nakatsuka, Eguchi, Hiyama, Kamiya and Wada. This is an open-access article distributed under the terms of the Creative Commons Attribution License (CC BY). The use, distribution or reproduction in other forums is permitted, provided the original author(s) and the copyright owner(s) are credited and that the original publication in this journal is cited, in accordance with accepted academic practice. No use, distribution or reproduction is permitted which does not comply with these terms.
*Correspondence: Jun Wada, junwada@okayama-u.ac.jp