 Peik M. A. Brundin1,2,3*Britt-Marie Landgren4Peter Fjällström1Mohamed M. Shamekh2,5Jan-Åke Gustafsson2,6Anders F. Johansson1†Ivan Nalvarte2†
- 1Department of Clinical Microbiology, Infection and Immunology, and the Laboratory for Molecular Infection Medicine Sweden, Umeå University, Umeå, Sweden
- 2Department of Biosciences and Nutrition, Karolinska Institutet, Huddinge, Sweden
- 3Unit of Infectious Diseases, Department of Medicine, St Göran’s Hospital, Stockholm, Sweden
- 4Kvinnohälsan, Karolinska University Hospital, Huddinge, Sweden
- 5Department of Biochemistry, Faculty of Veterinary Medicine, Assiut University, Assiut, Egypt
- 6Center for Nuclear Receptors and Cell Signaling, University of Houston, Houston, TX, United States
Sex hormones are known to interact with the immune system on multiple levels but information on the types of sex hormone receptors (SHR) and their expression levels in immune cells is scarce. Estrogen, testosterone and progesterone are all considered to interact with the immune system through their respective cell receptors (ERα and ERβ including the splice variant ERβ2, AR and PGR). In this study expression levels of SHR genes in peripheral blood mononuclear cells (PBMCs) and cell subsets (CD4+ and CD8+ T-cells, CD56+ NK-cells, CD14+ monocytes and CD19+ B-cells) were analyzed using standard manual qPCR or a qPCR array (TLDA). Nine healthy individuals including men (n = 2), premenopausal (Pre-MP, n = 5) and postmenopausal (post-MP, n = 2) women were sampled for PBMCs which were separated to cell subsets using FACS. Ten Pre-MP women were longitudinally sampled for total PBMCs at different phases of the menstrual cycle. We found that ERα was most abundant and, unexpectedly, that ERβ2 was the dominant ERβ variant in several FACS sorted cell subsets. In total PBMCs, SHR (ERα, ERβ1, ERβ2, and AR) expression did not fluctuate according to the phase of the menstrual cycle and PGR was not expressed. However, several immune response genes (GATA3, IFNG, IL1B, LTA, NFKB1, PDCD1, STAT3, STAT5A, TBX21, TGFB1, TNFA) were more expressed during the ovulatory and mid-luteal phases. Sex hormone levels did not correlate significantly with gene expression of SHR or immune response genes, but sex hormone-binding globulin (SHBG), a steroid hormone transporting protein, was positively correlated to expression of ERβ1 gene. This study provides new insights in the distribution of ERs in immune cells. Furthermore, expression patterns of several immune response genes differ significantly between phases of the menstrual cycle, supporting a role for sex hormones in the immune response.
Introduction
Men and women are affected differently by infectious diseases, with higher male mortality and morbidity from infectious diseases (1). One major reason to this may be that the immune response differs between men and women (2). In general, women mount a stronger response than men towards pathogens and/or seem to clear the pathogen more effectively (2). Men are more prone to contract certain infectious diseases related to differences in behavior (3), but even when controlling for exposure, women seem to have a benefit (4). For specific infectious diseases (e.g., severe dengue fever) a strong immune response could be detrimental, and therefore be a disadvantage for women (3).
A growing body of evidence suggests that sex hormones may both augment and dampen the immune response (5). The female advantage in mortality to infectious diseases decreases from the 5th decade of life (1). As this coincides with the female menopause and decreasing levels of female sex hormones, it is plausible that estradiol (E2) and progesterone (P4) have roles in shaping the immune response (1, 2). Furthermore, autoimmune diseases are more common in women, a phenomenon also partly attributed to sex hormones (6).
The menstrual cycle involves fluctuation of P4 and E2 levels as well as follicle-stimulating hormone (FSH) and luteinizing hormone (LH). FSH stimulates the ovarian follicles to produce E2, which is necessary for the mid-cycle sharp surge of LH that initiates the ovulation. If fertilization does not occur, the corpus luteum breaks down and P4 levels drop. As the levels of hormones shift, so might the immune response, affecting the temporal severity of autoimmune and infectious diseases (7, 8).
Sex hormone receptors (SHRs) have been found in several non-reproductive tissues, and sex hormones may affect e.g., bone density, muscular growth and blood coagulation. Not surprisingly, sex hormone receptors have also been found in several types of immune cells (9). SHRs include estrogen receptor (ER)α, ERβ, androgen receptor (AR) and progesterone receptor (PGR), and belong to the steroid activated nuclear receptor family of transcription factors (10). These receptors are intracellular and may upon ligand stimulation bind directly to DNA sequences, or tether with transcription factors (e.g., NFκB, AP-1 and SP1) to mediate gene transcription of among other immune related genes, such as type I interferons (IFN-α and IFN-β) (5). The two subtypes ERα and ERβ are found in several splice variants (isoforms), the latter including ERβ1-5, of which several have been associated to disease development by e.g., antagonizing full-length ERα or ERβ (10–12).
In the present study, we sampled pre-menopausal (pre-MP) women over four phases of the menstrual cycle to analyze variation in serum hormone levels, expression of SHRs, and several key immune response genes in peripheral blood mononuclear cells (PBMCs). Our data demonstrate that the expression of several immune response genes changes over the menstrual cycle and that the ERβ splice variant, ERβ2 that cannot bind E2, may be more prominent in this process than full length ERβ (ERβ1). This study adds new evidence to the sex differences in immune response.
Materials and Methods
Participants
Healthy premenopausal women (pre-MP, n = 15), postmenopausal women (post-MP, n = 2) and men (n = 2) were included according to a protocol approved by the Central Ethical Review Board (Swedish Research Council, Stockholm, Dnr: Ö 24–2009), and body-mass index (BMI) and age were registered for all subjects. For women, parity, menstrual cycle length or years since initiation of menopause was noted. Exclusion criteria were (1) medication with hormonal replacement therapy, or contraceptives during the last three months (2), Regular medication with ASA, NSAIDs (e.g., ibuprofen and diclofenac), morphine, morphine-derivatives or cortisone compounds (3), pregnancy or childbirth within the last year and (4) irregular or perimenopausal bleeding.
Sampling Procedure
All the samples were collected at 8–10 a.m. The samples from menstruating females were collected during one menstrual cycle, early in the follicular phase (cycle day 1–3), during mid-follicular phase (day 8–10), and at the ovulatory phase day 12-15. The follicular size was measured by ultrasound. The day of the LH and FSH peaks was determined by using Ovustick (Monoclonal Antibodies, Mountain View, CA, USA) in urine from day 12 until the day after the LH peak and in the luteal phase (5–7 days after the day of the LH-Peak and FSH peak). Ovulation was confirmed when progesterone levels were above 22 nmol/mL. Similarly, the post-MP females and male participants were sampled once a week on the same weekday over four weeks. At every time-point, serum analysis was performed for hormones (S-estradiol, S-testosterone, S-progesterone, S-prolactin, S-FSH, S-LH, S-SHBG, S-TSH, S-T4) and blood cells complete blood count and differential count (lymphocytes, monocytes, neutrophils, basophils and eosinophils). Vacutainer CPT mononuclear cell preparation tubes (BD Biosciences, Franklin Lakes, NJ, USA) were used according to the manufacturer’s description to separate PBMCs from whole blood. PBMCs were slowly frozen in 20% DMSO and Heparin solution and kept at -135°C. Serum samples were drawn, left to coagulate at room temperature for 30 min, and then centrifuged for 10 min at maximum speed before storing at -20°C. The blood samples were drawn at Kvinnohälsan (Karolinska University Hospital, Huddinge) and analyzed at the Karolinska University Laboratory (KUL, Huddinge, Sweden) and analyzed as previously described (13). Separate serum samples were also drawn to estimate 5-α dihydrotestosterone, (performed at HUS-lab, Helsinki, Finland), using a liquid chromatography-tandem mass spectrometry method (LC-MS/MS).
Fluorescence-Activated Cell Sorting
Frozen PBMC samples from pre-MP (n = 5), post-MP (n = 2) and males (n = 2), collected at 4 different time-points (as described above) were prepared for cell storing using FACS. The samples were thawed in a 37°C water bath and diluted with ice-cold PBS followed by 2 washing steps with ice-cold PBS by centrifugation (300 x g, 5 min) at 4°C. The cell pellet was resuspended in 200 μL ice-cold PBS. The cell suspension was incubated in darkness with respective antibodies (CD3 PE-Cy 7, Cat No 341111; CD4 PerCP-Cy 5.5, Cat No 332772; CD8 APC-H7 RUO, Cat No 641400; CD56 PE (MY31), Cat No 345810; CD19 APC (SJ25C1), Cat No 345791, all from BD Biosciences (San Jose, CA, USA), and CD14 [DakoAgilent, Santa Clara, CA, USA)], for 15 minutes and diluted with 2 mL PBS before centrifugation (600 x g, 5 min) at 4°C. Unbound antibodies (supernatant) were discarded and the cell pellet was resuspended in 400 μL PBS followed by cell sorting using FACSAria (BD Biosciences). At least 30’000 cells were collected from each category before storing at -80°C.
RNA Extraction and cDNA Synthesis
RNA was extracted using the Qiagen RNeasy kit (Qiagen, Hilden, Germany) and cDNA synthesis performed using High-Capacity cDNA Reverse Transcription Kit (Thermo Fisher Scientific, Vilnius, Lithuania) with random hexamers, according to manufacturer’s instructions.
Manual qPCR on Sorted Cells and PBMCs
cDNA from both unsorted and FACS sorted PBMCs (CD4+ T-cells, CD8+ T-cells, CD56+ NK-cells, CD14+ monocytes and CD19+ B-cells) were used analyzed by qPCR using 0.5 µl cDNA, 300 nM forward and reverse primers (ERα: forward, 5’-GAATCTGCCAAGGAGACTCGC -3’; reverse, 5’-ACTGGTTGGTGGCTGGACAC-3’; ERβ1, forward, 5’- TCCATGCGCCTGGCTAAC -3’; reverse, 5’- CAGATGTTCCATGCCCTTGTTA -3’; ERβ2, forward, 5’- TCCATGCG
CCTGGCTAAC -3’; reverse, 5’- CCATCGTTGCTTCAGGCAA -3’; GR forward 5’-GAGCAGTGGAAGGACAGCA-3’; reverse,
5’-TTTCTTCGAATTTTATCGATGATGC-3’; GPER1, forward, 5’- TCACGGGCCACATTGTCAAC; reverse 5’- GTCTCCCCGAGAAAGCTGTAG-3’; and GAPDH: forward, 5’-CCCATCACCATCTTCCAG-3’; reverse, 5’-ATGACCTTGCCCACAGCC-3’), and SYBR green FAST PCR master mix according to manufacturer’s instructions (Applied Biosystems, Foster City CA, USA). The qPCRs were setup and run on a 7500 FAST real-time PCR system (Applied Biosystems, Foster City, CA, USA) and relative mRNA expression was analyzed using the ΔCt method relative to GAPDH expression.
Taqman Low Density PCR-Array Analysis
PBMC cDNA from Pre-MP women (n = 10) with complete set of samples representative for different phases of the menstrual cycle was mixed with TaqMan Fast Advanced master mix (Applied Biosystems) and RNase-free water. cDNA mix was loaded into each of the 8 loading ports of a Taqman low density Array (TLDA, Applied Biosystems). The array was sealed, centrifuged 2 minutes at 1800 x g, and the following qPCR performed on a 7900HT qPCR system (Applied Biosystems) with ABI software SDS v2.4 installed using standard TLDA array cycling. GAPDH was used as reference gene for ΔCT calculations using the ABI software RQmgr 1.2.1 followed by DataAssist v3.0 (Applied Biosystems). Each sample was analyzed in triplicates for each of the 30 genes assayed, including sex hormone receptors, proinflammatory markers as well as TH1-, TH2-, Treg- and TH17-related immunological markers (Supplemental Table 1). The qPCR results are presented as ΔCT values to allow linear model analyses on normal distributed values.
Statistical Analyses
Student’s t-test with Welch’s correction was used to compare the amount of ERα, ERβ1 and ERβ2 in the different PBMC cell subsets. Linear mixed modeling (LMM) was used to estimate the effect of sampling timepoints and gene expression similarly as described by us before (14). In brief, the R-package nlme was used for LMM analysis where timepoint was tested as fixed effect, and the expression of the various genes for each pre-MP individual was set as random effects, and p-values were calculated. Bonferroni correction was used to adjust the significance level of p-values relative to the number of repeated LMMs for the different genes studied. The repeated measures correlation test (15) was used to determine associations between gene-gene expressions and between gene expression and hormone levels.
Results
Clinical Characteristics
Brief characteristics of 19 unique individuals that donated blood samples for analysis by manual qPCR on FACS-sorted cells or a Taqman low density PCR array (TLDA) on total PBMCs are shown in Table 1.
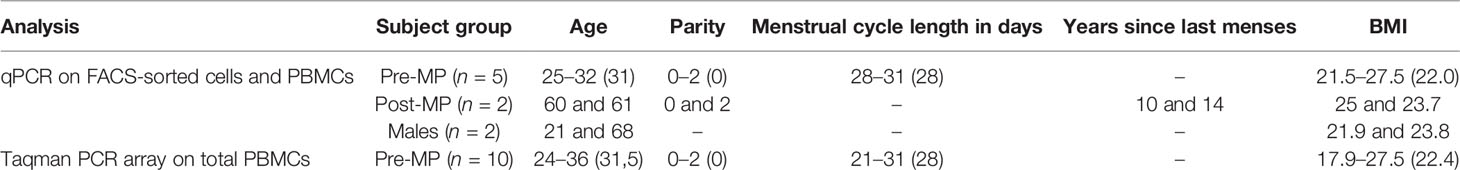
Table 1 Clinical characteristics of participants, range (median).
Distribution of ERs in PBMCs
To investigate the presence of ERs in CD4+ T-cells, CD8+ T-cells, CD56+ NK-cells, CD14+ monocytes and CD19+ B-cells, we sorted PBMCs from healthy pre-MP, post-MP, and males by FACS (n = 9). ERα (ESR1) expression was found in all cell types (Figures 1A–E). The ERβ1 (ESR2_ERb1, RefSeq NM_001437) transcript was found in very small amounts in all cell types except in B-cells. Similarly, the ERβ splice variant ERβ2 (ESR2_ERb2, RefSeq NM_001291712) was also most abundant in B-cells but was also found in higher amounts in (CD4+ and CD8+) T-cells and NK-cells compared to ERβ1 (Figures 1A–E). In monocytes ESR2_ERB1 and ESR2_ERB2 was either very low or not detected (Figure 1D). The membrane-associated ER, GPER1, was only expressed in CD8+ T-cells, CD14+ monocytes, and CD19+ B-cells in relatively high amount (Supplemental Figure 1A). For comparison, the expression of the glucocorticoid receptor (GR) was found highly expressed in all cell types (Supplemental Figure 1B). Although underpowered, we could not detect any significant differences in ER distribution between cell types and between pre-MP and post-MP/men (Supplemental Figure 2). Our data demonstrate that the ERβ splice variant ERβ2 (ESR2_ERb2) is present in higher abundance than the full-length ERβ1 in most PBMC cell types.
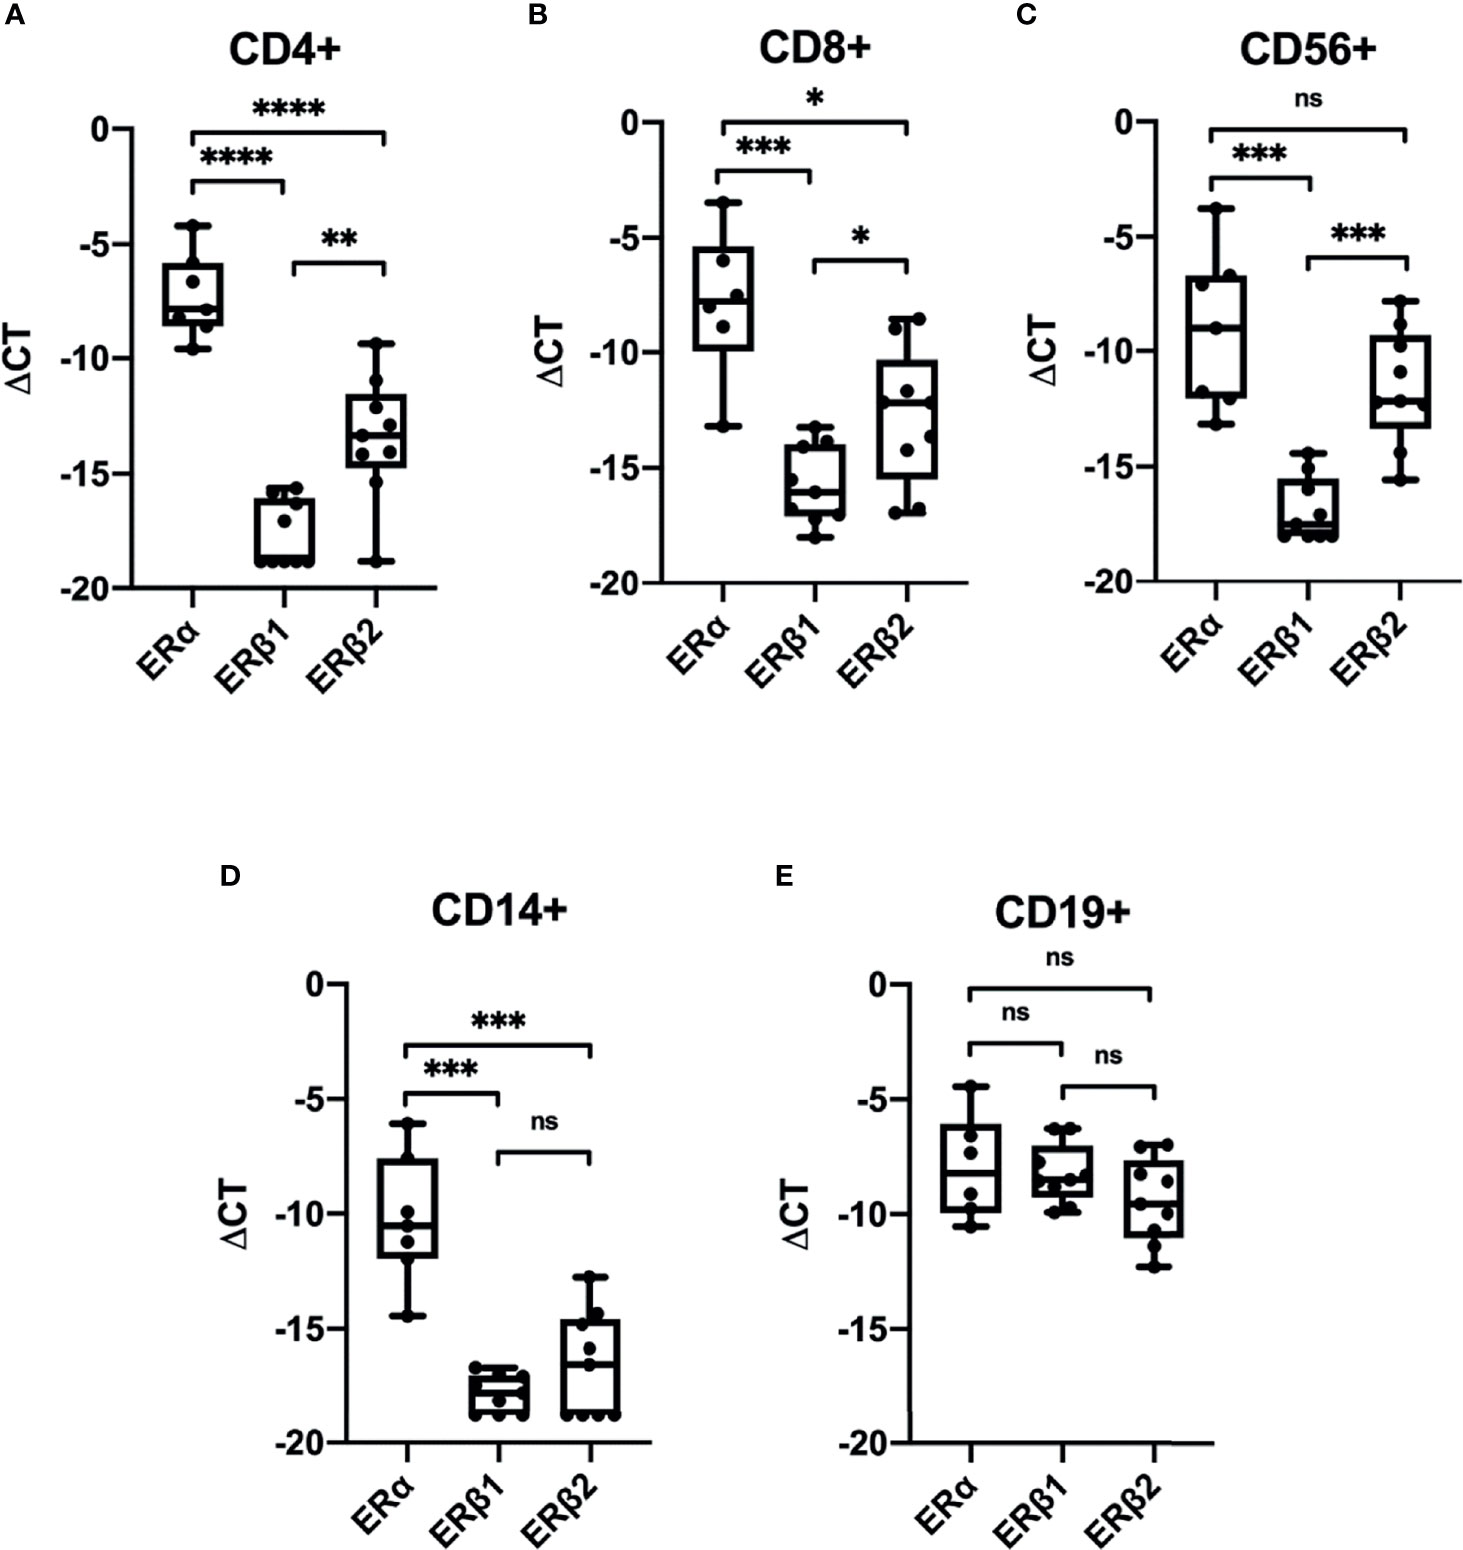
Figure 1 Expression of estrogen receptors in sorted PBMCs. Relative expression (ΔCT relative to GAPDH) of ERα (ESR1), ERβ1 (ESR2_ERb1) and ERβ2 (ESR2_ERb2) in CD4+ T-cells (A), CD8+ T-cells (B), CD56+ NK-cells (C), CD14+ monocytes (D), and CD19+ B-cells (E) from men, pre-MP and post-MP women (n = 6–9). P values were obtained using Welch’s t-test, *p < 0.05, **p < 0.01, ***p < 0.001, ****p < 0.0001, ns, not significant.
Effect of Menstrual Cycle on Sex Hormone Receptor and Inflammatory Gene Expression
We next analyzed the expression of SHRs, and selected genes associated with immune response (Supplemental Table 1) in PBMCs during the menstrual cycle. To this end, we longitudinally sampled PBMCs from healthy Pre-MP women (n = 10) at 4 time-points representing early follicular (EF), mid-follicular (MF), ovulatory (OV) and mid luteal (ML) phases during the menstrual cycle and used a TLDA for gene expression analysis. We chose to use PBMCs rather than sorted cells to better illustrate the pooled expression profile of effector cells in the blood. A generalized linear mixed model (GLMM) based on ΔCT was performed to analyze the expression levels (Supplemental Table 2). Serum hormone levels were measured to confirm the hormone phases (Supplemental Figure 3). We could not detect any difference in SHR gene expression during the menstrual cycle for AR, ESR1, ESR2_ERb1 or ESR2_ERb2 (CYP19A1, IL17 and PGR were not expressed and omitted from the GLMM). However, several immune related genes (GATA3, IFNG, IL1B, LTA, NFKB1, PDCD1, STAT3, STAT5A, TBX21, TGFB1, TNFA) varied in their expression patterns during the menstrual cycle with significant differences comparing MF with ML phases and MF with OV phases (Figure 2 and Supplemental Table 2). Interestingly, expression of both pro-inflammatory/TH1 response genes (IL1B, TNF, LTA, IFNG, NFKB1, TBX21, and PDCD1) and genes associated with TH2 response (STAT3, STAT5A, TGFB1, and GATA3) were significantly upregulated during OV and ML phases compared to the MF phase (Figure 2). No difference could be observed for GPER1 expression between the phases (Supplemental Figure 4A).
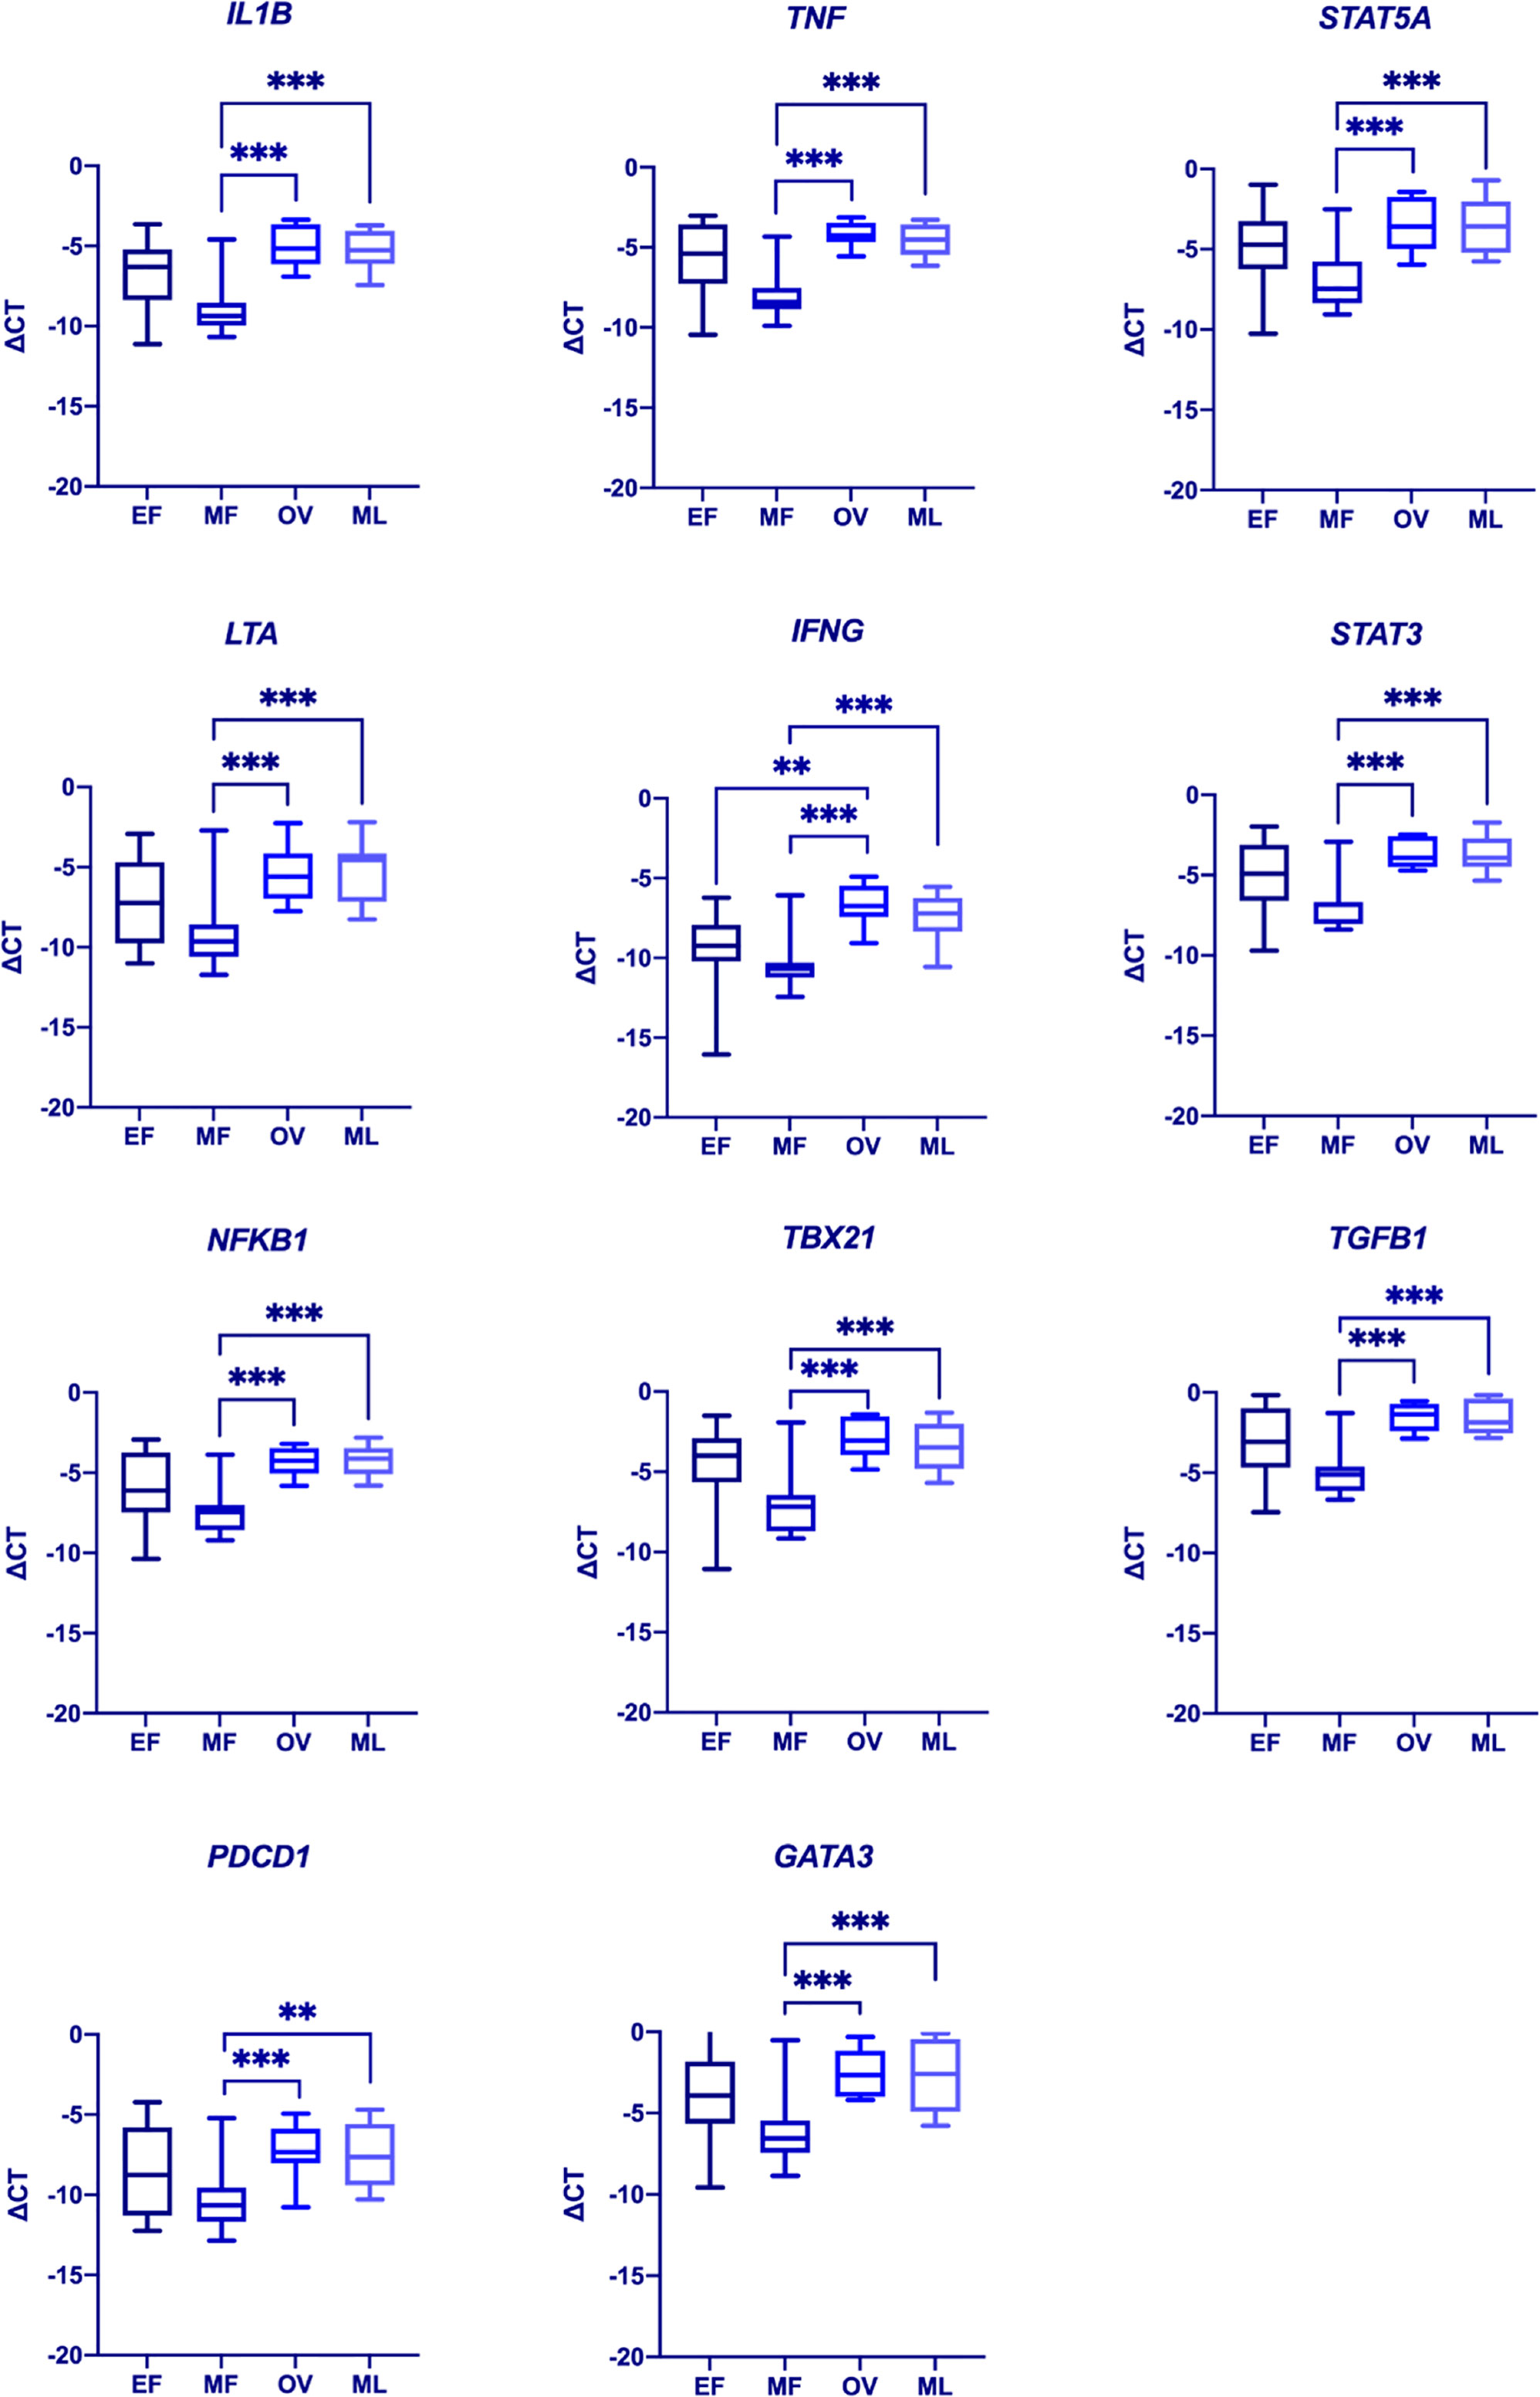
Figure 2 Differences in immune gene expression during the menstrual cycle. A generalized mixed model (GLMM, α = 0.002) was used to determine differences in gene expression between the various menstrual cycle phases (EF, early follicular phase; MF, mid follicular phase; Ov, ovulatory phase; ML, mid luteal phase). Significant differences could be observed for IL1B, TNF, STAT5A, LTA, IFNG, STAT3, NFKB1, TBX21, TGFB1, PDCD1, and GATA3. Data represent medians ±0.975 quartiles at df=9 in a t-distribution. Whiskers represent min and max values. **p = 0.001. ***p < 0.001. Complete list of p-values is included in Supplemental Table 2.
Correlation Between SHR and Inflammatory Response Gene Expression
To analyze if SHR expression was associated with specific sets of inflammatory response genes, we performed gene correlation analysis. AR and ESR2_ERb1 correlated poorly with most genes studied (Figure 3 and Supplemental Table 3). In contrast, ESR1 and ESR2_ERb2 had more similar correlation to each other and to most other genes studied. Most pronounced, ESR1 had significant correlation with both proinflammatory TH1 and TH2-response genes (Figure 3 and Supplemental Table 3).

Figure 3 A heatmap of repeated measures correlation coefficients between gene expressions in PBMCs from pre-MP women. Increased blue color represent increased correlation (r-value → 1) (n = 10, each sampled 4 times). Proinflammatory genes, SHR genes, and genes associated with TH1, and TH2 response are indicated. P-values are listed in Supplemental Table 3.
Correlation Between Hormone Levels and Immune Gene Expression in Pre-MP Women
Correlation of serum levels of follicle stimulating hormone (FSH), luteinizing hormone (LH), estrogen (E2), progesterone (P4), and testosterone (T), as well as sex hormone binding globulin (SHBG), with the expression of inflammatory markers was analyzed in pre-MP women (n = 10) (Figure 4 and Supplemental Table 4). Although we could not detect a significant correlation between any gene and hormone (at α = 0.00032), it is noteworthy that progesterone stood out with high r-numbers and/or low p-values to several genes (NFKB1 [r = 0.509, p = 0.00342], LTA [r = 0.504, p = 0.00381], STAT5A [r = 0.474, p = 0.00700], TGFB1 [r = 0.474, p = 0.00708], STAT3 [r = 0.472, p = 0.00737], GATA3 [r = 0.457, p = 0.00978], IL1B [r = 0.434, p = 0.0147], TNFA [r = 0.426, p = 0.0169], TBX21 [r = 0.400, p = 0.0257], IFNG [r = 0.387 p = 0.0315]). This is potentially interesting for further investigations since the progesterone receptor (PGR) expression in PBMCs could not be detected, as mentioned above. Additionally, our data indicate that the levels of SHBG correlates positively with ESR2_ERb1 (r = 0.617, p = 0.000215) (Figure 4 and Supplemental Table 4). No significant correlation could be observed for GPER1 expression and hormone levels (Supplemental Figure 4B).

Figure 4 Heat map of repeated measures correlation coefficients between serum hormone levels and selected gene expression (-ΔCT) in PBMCs from pre-MP women. Increased blue color represent increased correlation (r-value → 1), increased red color represent increased anti-correlation (r-value → -1), and white represent no correlation (r = 0) (n = 10, each sampled 4 times). P-values are listed in Supplemental Table 4 (α = 0.00032).
Discussion
In this study we identify that ERα is the predominant estrogen receptor in PBMCs and that the expression of the ERβ alternative splice variant ERβ2 generally is more abundant than the full-length ERβ1 variant in PBMCs. Further, we demonstrate that the expression of several immune-related genes fluctuates in relation to the menstrual cycle. Using FACS to sort out CD4+ T-cells, CD8+ T-cells, CD56+ NK-cells, CD14+ monocytes, and CD19+ B-cells from PBMCs, we could identify that CD19+ B-cells have high expression of all ERs studied (ERα, ERβ1, ERβ2, and GPER1). In contrast, CD14+ monocytes have very low expression of ERβ1 and ERβ2, but high ERα and GPER1 expression. In addition, GPER1 was only found in CD8+ T-cells, CD14+ monocytes, and CD19+ B-cells with an overall high expression in these cell types. Taken together, the findings provide new information to better understand the interplay between sex hormones and immune responses.
We show that ERβ2 is significantly more abundant than ERβ1 (full length) in most immune cell subsets. Phiel et al. did previously report presence of both ERα and ERβ in PBMC (9), but they did not discriminate between ERβ isoforms. Importantly, ERβ2 does not bind E2 but can dimerize with both ERα and ERβ1, to inhibit their transcriptional activity. Oppositely to the present study, it was earlier described that patients with chronic lymphocytic leukemia (CLL) had higher levels of ERβ2 in PBMCs compared to healthy donors where ERβ1 dominated (16). However, that study was performed by assessing ERβ2-protein staining (using immunocytochemistry, ICC), rather than quantifying absolute expression. In addition, the median age among CLL patients (68 years) and healthy donors (43 years) differed, so an age difference in ERβ1/ERβ2 distribution cannot be excluded. Although we did not analyze ERα splice variants, the study by Stygar and colleagues (17) detected some expression of ERα splice variants in PBMCs and that this expression could vary with the menstrual cycle. However, the samples used in that study were derived from 6 pre-MP women in the follicular phase, and 3 in the secretory phase (i.e., the individuals were not sampled repeatedly) so an inter-individual difference cannot be excluded. Clearly, more studies are needed to determine ERβ2’s role in relation to other ER variants, sex hormone levels, and age.
Furthermore, we show that the expression of several immune genes in bulk PBMCs (GATA3, IFNG, IL1B, LTA, NFKB1, PDCD1, STAT3, STAT5A, TBX21, TGFB1, TNFA) differed between phases of the menstrual cycle. We did not observe differences in SHR expression patterns between the phases, possibly this is linked to an important limitation of our study which is the low number of participants. In addition, the low amount of sample material prevented sorting out the cell populations for TLDA analysis by FACS. Nevertheless, differences in immune gene expression patterns were significant and we speculate that even more immune related genes could potentially be found by increasing the participant number. IFNG, TNFA and IL1B are all genes that encode proinflammatory responses. NFκB is an inducible transcription factor that can be regulated by steroid hormone signaling (18), and controls expression of several stress response genes and genes associated with development of innate immunity. Among NFκB target genes are regulators of inflammatory cytokines, cell survival, proliferation and cell surface proteins (18–20). NFκB activity has also been suggested to play a significant role for female fertility by participating in angiogenesis during corpus luteum formation, endometrial implantation and indeed also for the TH1-TH2 immune response shift seen during the menstrual cycle (important for the tolerance of the semi-allogenic blastocyst implantation) (21).
Additionally, we demonstrate that the expression of GATA3 and TBX21 are both fluctuating during the menstrual cycle. TBX21 (encoding for T-bet) and GATA3 are both key transcription factors for TH1 and TH2 immune response respectively. It should be noted that the distinction of TH-cells into TH1- and TH2-cells, although still widely in use, have been questioned since the discovery of further TH-subsets (as TH17 and Treg-cells) (22–24). Prior studies suggest that the immune response shifts from a TH1 to TH2 response over the menstrual cycle (7). Although the expression of GATA3 and TBX21 differs over the menstrual cycle, our data do not support a TH1-TH2 shift, as both GATA3 and TBX21 are highly expressed during the latter part of the cycle (OV and ML phases). LTA (TNF-β) is also related to TH1 response, as it is secreted from TH1 but not TH2 cells. A different experimental design including more participants (and more frequent sampling during the menstrual cycle) may reveal a more fine-tuned regulation of GATA3 and TBX21. The same expression pattern is seen with PDCD1 and TGFB1 which are significantly more expressed during OV and ML phases. PDCD1 and TGFB1 are both related to immune tolerance. PD-1 may have implications for development of autoimmunity, chronic infectious diseases and several types of cancer, and expression of its gene PDCD1 is related to sex hormones, particularly E2 (25). TGF-β, stimulates differentiation of CD4+ T-cells to Treg-cells and has an inhibitory effect on B-cell proliferation. Previous studies have showed a positive correlation between E2 and Treg numbers during the menstrual cycle (26).
Like the genes mentioned above, STAT3 and STAT5A are also significantly higher expressed during OV and ML phases. STAT5 has previously been associated with sex differences in liver metabolism (27) and pulmonary hypertension (28), both with a proposed neuroendocrine regulation through hypothalamus-growth hormone-STAT5 axis. In addition, STAT5 has an important role in the priming of CD4+ T-cells for TH1, TH2 and TH9 development (29). STAT3 has on the other hand been pointed out as factor of major importance in the pathogenesis of gastrointestinal bacterial infections and cancer development along with viral infectious diseases (HBV, HCV and HPV) which in turn may drive cancer development (30).
We further found that ERβ1 (ESR_ERB1) stood out as significantly positively correlated to SHBG levels. SHBG is a circulating glycoprotein synthesized and secreted by the liver, with a main function of transporting sex steroids, mainly testosterone, in the circulation, thereby modulating sex hormone bioavailability. In a study by Maggio et al. (31) on postmenopausal women, SHBG was negatively correlated to inflammatory markers such as C-reactive protein (CRP), IL-6 and soluble IL-6 receptor (sIL-6r). In the same study E2 was positively correlated to CRP and IL-6 (but not sIL-6r). It is possible that the opposite correlation between E2 and SHBG on inflammation might be due to increased expression of ERβ1 which oppose the action of ERα.
In this study, we could neither observe a general immunostimulatory nor an immunosuppressive signature that could be linked to the different phases of the menstrual cycle. Rather, both immunostimulatory and immunosuppressive response genes were upregulated during ovulation and the mid luteal phase. Generally, E2 is immunostimulatory while progesterone (P4) and testosterone have immunosuppressive properties (described in detail in e.g (2).,). Testosterone will e.g., decrease humoral immunity (increase B-cell apoptosis of immature B-cells). P4 will decrease hypermutation and class-switch of B-cells and E2 will decrease B-cell apoptosis, promote class-switching and hypermutation and increase the number of autoreactive antibodies (32).
An increase in P4 in the luteal phase is attributed a general suppressive effect on the innate immune response by e.g., decreasing the production of proinflammatory cytokines (33). In the present study, gene-hormone correlations were not clear-cut, the P4-levels might be involved in the regulation of several immune response genes, but our statistical evaluations did not provide a significant signal (Figure 4 and Supplemental Table 4). PGR is reportedly present in immune cells (34). Recent findings by Hierweger and coworkers (35), however, question its presence in T-cells suggesting that P4 may signal through the glucocorticoid receptor (GR) in these cells. The suggestion by Hierweger is in line with our data since PGR was not expressed in our material. Although GR was not part of our qPCR array, we could detect high GR levels in all sorted PBMCs (Supplemental Figure 1). Therefore, we hypothesize that any correlation of P4 with gene expression in PBMC is indirect, e.g., through GR. Future studies including GR could help answering these questions.
In conclusion, we demonstrate that several key immune related genes in PBMCs fluctuate in their expression according to the phase of the menstrual cycle. This includes both proinflammatory, TH1- and TH2-response genes. In addition, this paper illustrates that mRNA for ERβ2 is more abundant than ERβ1 in PBMCs, which suggests that ERβ2 may play a more prominent role than previously thought in the immune response. Our study provides evidence that the menstrual cycle can influence the immune response. Larger studies enrolling pre-MP women sampled over more timepoints of the menstrual cycle and including more ER splice variants and inflammatory genes in sorted PBMCs are warranted. In the end, such studies may provide information that allows for the development of personalized immune treatments to the benefit of both pre-MP women, post-MP women and men.
Data Availability Statement
The original contributions presented in the study are included in the article/Supplementary Material. Further inquiries can be directed to the corresponding author.
Ethics Statement
The studies involving human participants were reviewed and approved by Swedish Research Council (Dnr: Ö 24-2009). The patients/participants provided their written informed consent to participate in this study.
Author Contributions
PB: Conceived the study, performed the experiments, analyzed data, and wrote the manuscript. B-ML: Conceived the study, collected the patient material, analyzed data, and wrote the manuscript. PF: Analyzed the data and wrote the manuscript. MS: Performed the experiments. J-AG: Financed the experiments and contributed with laboratory equipment, and wrote the manuscript. AJ: Conceived the study, analyzed data, and wrote the manuscript. IN: Conceived the study, performed the experiments, analyzed data, and wrote the manuscript.
Funding
This study was supported by the Karolinska Institutet (FS-2018:0007), Region Västerbotten (RV-866221) and Folksams Forskningsstiftelse. J-AG is grateful to the Robert A. Welch Foundation for a grant (E-0004).
Conflict of Interest
The authors declare that the research was conducted in the absence of any commercial or financial relationships that could be construed as a potential conflict of interest.
The handling editor declared a shared affiliation with several of the authors, PB, B-ML, MS, J-AG, and IN, at time of review.
Publisher’s Note
All claims expressed in this article are solely those of the authors and do not necessarily represent those of their affiliated organizations, or those of the publisher, the editors and the reviewers. Any product that may be evaluated in this article, or claim that may be made by its manufacturer, is not guaranteed or endorsed by the publisher.
Acknowledgments
We thank the Bioinformatics and Expression Analysis Core Facility at the Karolinska Institutet for TLDA processing and analyses. Further, we thank midwife Margaretha Ström for collecting blood samples, Dr Zoi Papoutsi for handling and storage of samples, Anette Landström for assisting in lab work, and Dr. Chunyao Zhao for valuable comments on the design of the experiments.
Supplementary Material
The Supplementary Material for this article can be found online at: https://www.frontiersin.org/articles/10.3389/fendo.2021.721813/full#supplementary-material
References
1. Owens IP. Ecology and Evolution. Sex Differences in Mortality Rate. Science (2002) 297(5589):2008–9. doi: 10.1126/science.1076813
2. Klein SL, Roberts CW. Sex Hormones and Immunity to Infection. Heidelberg ; New York: Springer (2010). 319 p.
3. Guerra-Silveira F, Abad-Franch F. Sex Bias in Infectious Disease Epidemiology: Patterns and Processes. PloS One (2013) 8(4):1–13. doi: 10.1371/journal.pone.0062390
4. Daniels CW, Belosevic M. Serum Antibody Responses by Male and Female C57Bl/6 Mice Infected With Giardia Muris. Clin Exp Immunol (1994) 97(3):424–9. doi: 10.1111/j.1365-2249.1994.tb06105.x
5. Kovats S. Estrogen Receptors Regulate Innate Immune Cells and Signaling Pathways. Cell Immunol (2015) 294(2):63–9. doi: 10.1016/j.cellimm.2015.01.018
6. Khan D, Ansar Ahmed S. The Immune System Is a Natural Target for Estrogen Action: Opposing Effects of Estrogen in Two Prototypical Autoimmune Diseases. Front Immunol (2015) 6:635. doi: 10.3389/fimmu.2015.00635
7. Fish EN. The X-Files in Immunity: Sex-Based Differences Predispose Immune Responses. Nat Rev Immunol (2008) 8(9):737–44. doi: 10.1038/nri2394
8. Oertelt-Prigione S. Immunology and the Menstrual Cycle. Autoimmun Rev (2012) 11(6-7):A486–92. doi: 10.1016/j.autrev.2011.11.023
9. Phiel KL, Henderson RA, Adelman SJ, Elloso MM. Differential Estrogen Receptor Gene Expression in Human Peripheral Blood Mononuclear Cell Populations. Immunol Lett (2005) 97(1):107–13. doi: 10.1016/j.imlet.2004.10.007
10. Heldring N, Pike A, Andersson S, Matthews J, Cheng G, Hartman J, et al. Estrogen Receptors: How do They Signal and What are Their Targets. Physiol Rev (2007) 87(3):905–31. doi: 10.1152/physrev.00026.2006
11. Gustafsson JA, Strom A, Warner M. Update on ERbeta. J Steroid Biochem Mol Biol (2019) 191:105312. doi: 10.1016/j.jsbmb.2019.02.007
12. Leung YK, Mak P, Hassan S, Ho SM. Estrogen Receptor (ER)-Beta Isoforms: A Key to Understanding ER-Beta Signaling. Proc Natl Acad Sci (2006) 103(40):14977–. doi: 10.1073/pnas.0607492103
13. Burger HG, Robertson DM, Baksheev L, Collins A, Csemiczky G, Landgren B-M. The Relationship Between the Endocrine Characteristics and the Regularity of Menstrual Cycles in the Approach to Menopause. Menopause (2005) 12(3):267–74. doi: 10.1097/01.GME.0000147172.21183.86
14. Muller DC, Kauppi A, Edin A, Gylfe A, Sjostedt AB, Johansson A. Phospholipid Levels in Blood During Community-Acquired Pneumonia. PloS One (2019) 14(5):e0216379. doi: 10.1371/journal.pone.0216379
15. Bakdash JZ, Marusich LR. Repeated Measures Correlation. Front Psychol (2017) 8:456. doi: 10.3389/fpsyg.2017.00456
16. Yakimchuk K, Norin S, Kimby E, Hagglund H, Warner M, Gustafsson JA. Up-Regulated Estrogen Receptor Beta2 in Chronic Lymphocytic Leukemia. Leuk Lymphoma (2012) 53(1):139–44. doi: 10.3109/10428194.2011.605187
17. Stygar D, Westlund P, Eriksson H, Sahlin L. Identification of Wild Type and Variants of Oestrogen Receptors in Polymorphonuclear and Mononuclear Leucocytes. Clin Endocrinol (Oxf) (2006) 64(1):74–81. doi: 10.1111/j.1365-2265.2005.02420.x
18. Schmitz ML, Kracht M, Saul VV. The Intricate Interplay Between RNA Viruses and NF-kappaB. Biochim Biophys Acta (2014) 1843(11):2754–64. doi: 10.1016/j.bbamcr.2014.08.004
19. Dev A, Iyer S, Razani B, Cheng G. NF-kappaB and Innate Immunity. Curr Top Microbiol Immunol (2011) 349:115–43. doi: 10.1007/82_2010_102
20. Evans J, Salamonsen LA. Inflammation, Leukocytes and Menstruation. Rev Endocr Metab Disord (2012) 13(4):277–88. doi: 10.1007/s11154-012-9223-7
21. Faustmann G, Tiran B, Maimari T, Kieslinger P, Obermayer-Pietsch B, Gruber HJ, et al. Circulating Leptin and NF-kappaB Activation in Peripheral Blood Mononuclear Cells Across the Menstrual Cycle. Biofactors (2016) 42(4):376–87. doi: 10.1002/biof.1281
22. Steinman L. A Brief History of T(H)17, the First Major Revision in the T(H)1/T(H)2 Hypothesis of T Cell-Mediated Tissue Damage. Nat Med (2007) 13(2):139–45. doi: 10.1038/nm1551
23. Klein SL, Flanagan KL. Sex Differences in Immune Responses. Nat Rev Immunol (2016) 16(10):626–38. doi: 10.1038/nri.2016.90
24. Straub RH. The Complex Role of Estrogens in Inflammation. Endocr Rev (2007) 28(5):521–74. doi: 10.1210/er.2007-0001
25. Dinesh RK, Hahn BH, Singh RP. PD-1, Gender, and Autoimmunity. Autoimmun Rev (2010) 9(8):583–7. doi: 10.1016/j.autrev.2010.04.003
26. Arruvito L, Sanz M, Banham AH, Fainboim L. Expansion of CD4+CD25+and FOXP3+ Regulatory T Cells During the Follicular Phase of the Menstrual Cycle: Implications for Human Reproduction. J Immunol (2007) 178(4):2572–8. doi: 10.4049/jimmunol.178.4.2572
27. Waxman DJ, Holloway MG. Sex Differences in the Expression of Hepatic Drug Metabolizing Enzymes. Mol Pharmacol (2009) 76(2):215–28. doi: 10.1124/mol.109.056705
28. Sehgal PB, Yang YM, Miller EJ. Hypothesis: Neuroendocrine Mechanisms (Hypothalamus-Growth Hormone-STAT5 Axis) Contribute to Sex Bias in Pulmonary Hypertension. Mol Med (2015) 21(1):688–701. doi: 10.2119/molmed.2015.00122
29. Owen DL, Farrar MA. STAT5 and CD4 (+) T Cell Immunity. F1000Res (2017) 6:32. doi: 10.12688/f1000research.9838.1
30. Lu R, Zhang YG, Sun J. STAT3 Activation in Infection and Infection-Associated Cancer. Mol Cell Endocrinol (2017) 451:80–7. doi: 10.1016/j.mce.2017.02.023
31. Maggio M, Ceda GP, Lauretani F, Bandinelli S, Corsi AM, Giallauria F, et al. SHBG, Sex Hormones, and Inflammatory Markers in Older Women. J Clin Endocrinol Metab (2011) 96(4):1053–9. doi: 10.1210/jc.2010-1902
32. Sakiani S, Olsen NJ, Kovacs WJ. Gonadal Steroids and Humoral Immunity. Nat Rev Endocrinol (2013) 9(1):56–62. doi: 10.1038/nrendo.2012.206
33. Hall OJ, Klein SL. Progesterone-Based Compounds Affect Immune Responses and Susceptibility to Infections at Diverse Mucosal Sites. Mucosal Immunol (2017) 10(5):1097–107. doi: 10.1038/mi.2017.35
34. Kadel S, Kovats S. Sex Hormones Regulate Innate Immune Cells and Promote Sex Differences in Respiratory Virus Infection. Front Immunol (2018) 9:1653. doi: 10.3389/fimmu.2018.01653
Keywords: menstrual cycle, estrogen receptor, progesterone, sex hormone, immune response, estrogen
Citation: Brundin PMA, Landgren B-M, Fjällström P, Shamekh MM, Gustafsson J-Å, Johansson AF and Nalvarte I (2021) Expression of Sex Hormone Receptor and Immune Response Genes in Peripheral Blood Mononuclear Cells During the Menstrual Cycle. Front. Endocrinol. 12:721813. doi: 10.3389/fendo.2021.721813
Received: 07 June 2021; Accepted: 07 September 2021;
Published: 22 September 2021.
Edited by:
Rongrong Fan, Karolinska Institutet (KI), SwedenReviewed by:
George Notas, University of Crete, GreeceIain J. McEwan, University of Aberdeen, United Kingdom
Copyright © 2021 Brundin, Landgren, Fjällström, Shamekh, Gustafsson, Johansson and Nalvarte. This is an open-access article distributed under the terms of the Creative Commons Attribution License (CC BY). The use, distribution or reproduction in other forums is permitted, provided the original author(s) and the copyright owner(s) are credited and that the original publication in this journal is cited, in accordance with accepted academic practice. No use, distribution or reproduction is permitted which does not comply with these terms.
*Correspondence: Peik M. A. Brundin, peik.brundin@umu.se
†These authors have contributed equally to this work