 Zhuo Gao
 Aishwarya S
 Xiao-mei Li1
 Xin-lun Li
 Li-na Sui
- 1Department of Nephrology, Air Force Medical Center, Beijing, China
- 2Department of Bioinformatics, Stella Maris College (Autonomous), Chennai, India
Globally, nearly 40 percent of all diabetic patients develop serious diabetic kidney disease (DKD). The identification of the potential early-stage biomarkers and elucidation of their underlying molecular mechanisms in DKD are required. In this study, we performed integrated bioinformatics analysis on the expression profiles GSE111154, GSE30528 and GSE30529 associated with early diabetic nephropathy (EDN), glomerular DKD (GDKD) and tubular DKD (TDKD), respectively. A total of 1,241, 318 and 280 differentially expressed genes (DEGs) were identified for GSE30258, GSE30529, and GSE111154 respectively. Subsequently, 280 upregulated and 27 downregulated DEGs shared between the three GSE datasets were identified. Further analysis of the gene expression levels conducted on the hub genes revealed SPARC (Secreted Protein Acidic And Cysteine Rich), POSTN (periostin), LUM (Lumican), KNG1 (Kininogen 1), FN1 (Fibronectin 1), VCAN (Versican) and PTPRO (Protein Tyrosine Phosphatase Receptor Type O) having potential roles in DKD progression. FN1, LUM and VCAN were identified as upregulated genes for GDKD whereas the downregulation of PTPRO was associated with all three diseases. Both POSTN and SPARC were identified as the overexpressed putative biomarkers whereas KNG1 was found as downregulated in TDKD. Additionally, we also identified two drugs, namely pidorubicine, a topoisomerase inhibitor (LINCS ID- BRD-K04548931) and Polo-like kinase inhibitor (LINCS ID- BRD-K41652870) having the validated role in reversing the differential gene expression patterns observed in the three GSE datasets used. Collectively, this study aids in the understanding of the molecular drivers, critical genes and pathways that underlie DKD initiation and progression.
Introduction
Diabetes is a major global health crisis projected to affect 642 million people by 2040 (1). According to the statistics from the World Health Organization (WHO), the rapid rise in the population prevalence in low- and middle- income countries led to the dramatic rise in the number of diabetic patients from 108 million in 1980 to 422 million in 2014. Unfortunately, nearly 40 percent of all diabetic patients develop serious diabetic kidney disease (DKD) (2). The dangerous liaison between diabetes and DKD is well-established. Currently, diabetes is one of the leading causes of both end-stage renal disease (ESRD) and chronic kidney disease (CKD) (3, 4). According to one study, the mortality due to the DKD rose by 94 percent between 1990 and 2012 (5).
In 2015, the Global Burden of Disease (GBD) assessed 1.2 million deaths and 19 million disability-adjusted life-years attributed to the hostile ailments of diabetes directly related to the reduced glomerular filtration rates (6, 7). According to the data from the WHO, nearly 100 million Chinese people are currently suffering from diabetes (8). Several studies reported the prevalence and risk of CKD and DKD in Chinese residents. Liu et al. conducted a cross-sectional survey including 23,869 clinical samples to measure the prevalences and risk factors associated with CKD and DKD in a Chinese rural population (9). In participants with diabetes, the overall prevalence of CKD was more than 35 percent. The Chinese cohort study conducted from 2003 through 2015 implicated a higher mortality rate and shorter life expectancy in the patients suffering from DKD. Taken together, there is an urgent need to develop the methods for early detecting the progression of kidney diseases in diabetic patients.
Based on anatomical distinction between the different sections of human kidney, the DKD which is also commonly known as diabetic nephropathy (DN) are subdivided into glomerular or tubular (10). Henceforth, the diseases associated with the glomerular and tubular region will be called glomerular diabetic kidney diseases (GDKDs) and tubular kidney diseases (TDKDs). The GDKDs are characterized by reduced glomerular filtration capacity, and the deposition of immune leading into the damage of the glomerular basement membrane (11) whereas the TDKDs are characterized by the dysfunctions of transporters and channels in the renal tubular system, and the destructions of the normal tubular tissues (12).
The diagnosis of the DKD has posed a challenge due to the complicated etiopathology and comorbidity associated with other related diseases. Identification of both prognostic and diagnostics biomarkers to monitor the initiation and progression of DKD has been recommended (13). Several diagnostic biomarkers mainly identified by monitoring the morphological changes in diabetic kidney were reported. The marker of tubular damage such as neutrophil gelatinase-associated lipocalin (NGAL), alpha-1-microglobulin, kidney injury molecule-1 (KIM-1), N-acetyl-beta-D-glucosaminidase, angiotensinogen, uromodulin, liver-type fatty acid-binding protein (L-FABP), and transferrin were also reported (14). However, the prognosis of the disease is still poorly understood. To this end, gene expression profiling can aid tremendous value in identifying the putative prognosis biomarkers.
The integrated use of differential gene expression (DEG) analysis and bioinformatics approaches have been advocated in early detection and monitoring of disease progression. It has also been used in identifying the chemical perturbagens capable of intervening the critical molecular pathways in diseased conditions. For example, the genomics and transcriptomics data profiling has helped in elucidating the pathogenesis of diabetes (15–17) and in identifying potential new mechanisms in DN (18, 19). However, there are only a few studies that shed light on the potential pathogenesis mechanism and cross-talks between GDKD, TDKD and early diabetic nephropathy (EDN). For example, Woroniecka et al. conducted the transcriptomics profiling of GDKD and TDKD on human kidney samples (20). The integration of multiple genomics data and their reanalysis offers a great avenue to identify certain disease-related biomarkers and help overcome the pitfalls of single cohort study, poor reproducibility and consistency (21).
In the current study, we analyzed the gene expression profiles of EDN (GSE111154) (22), GDKD (GSE30528) (20) and TDKD (GSE30529) (20) accessed from the NCBI‐Gene Expression Omnibus database (NCBI‐GEO). We identified the differentially expressed genes (DEGs) and further examined the molecular factors that drive the DKD pathogenesis using an integrated bioinformatics approach. We further conducted the drug perturbation analysis using the LINCS L1000 data repository (23) to study the effect of small-molecules and identified the potential drug candidates which have the ability to induce and reverse the transcription profile signatures.
Materials and Methods
Dataset and Identification of DEGs
The high throughput gene expression profile datasets of EDN (GSE111154) (22), GDKD (GSE30528) and TDKD (GSE30529) (20) were obtained from NCBI-GEO (24). The datasets GSE30528 and GSE30529 were the subseries of GSE30122 and based on the GPL571 platform- HG-U133A_2 Human Genome Affymetrix array. GSE111154 was based on the platform GPL17586- [HTA-2_0] Affymetrix Human Transcriptome Array 2.0. The GDKD dataset had 9 samples and 13 samples collected from the glomerular tissues of DKD and normal patients, respectively. The TDKD dataset had 10 samples and 12 samples collected from tubular tissues of DKD and normal patients, respectively. The EDN dataset consisted of 4 clinical samples of the early DN and 4 non-diabetic control samples obtained from the kidney tissues and blood. The GEO2R module of the bioconductor package was used to identify DEG. The datasets were standardized, normalized by TPM (Transcripts Per Kilobase Million) and log transformed to identify DEGs with respect to the diseased vs control samples. In this study, the genes with log2FC > 1.5 and P value < 0.05 were defined as DEGs (25, 26). The datasets were examined both individually and in groups to identify the genes unique to the respective diseases. Volcano plots and heatmap clusters of the DEGs were plotted using the ggplot modules of R package 3.5.8 and R studio 1.4.1106 (27).
Gene Ontology and Pathway Enrichment Analysis
The functions of the candidate DEGs were annotated using the DAVID gene annotation tool (https://david-d.ncifcrf.gov/) (28). The annotations were evaluated for three sub-ontologies viz. biological process (BP), molecular functions (MF) and cellular components (CC). The pathways enrichment analysis was performed using the Kyoto Encyclopedia of Genes and Genomes (KEGG) (29, 30) and REACTOME (31) databases. The interrelation analysis of the molecular pathways were conducted using the ClueGo (version 2.5.7) (32) implemented in Cytoscape software (version 3.8.2) (33). In this work, we have plotted the clusters based on the Benjamini Hochberg statistical significance including enrichment/depletion hypergeometric tests and a kappa score cutoff of 3 (21).
Protein-Protein Interaction (PPI) Network Establishment and Modular Analysis
The DEG-encoded proteins and their interactions amongst each other were established using the STRING database (http://stringdb.org/) (34). The PPI-network was created and evaluated using the Cytoscape software. Additionally, the significant interactions within the PPI-network were screened using MCODE plugin (35) implemented in Cytoscape software. The selections were made based on the highest MCODE score, degrees and the number of nodes. In this work, the significant clusters were selected based on the network scoring degree cutoff of 2. The parameters to find the clusters were optimized to the haircut option with K- score cutoff of 2 and node score cutoff of 0.2.
Validation of Hub Genes
The expression levels of the hub genes in various tissues were investigated using the expression atlas platform (https://www.ebi.ac.uk/gxa/home) (36). The presence and absence of the genes were considered as the biomarker for the kidney diseases based on the standard expression levels of the genes in the renal and associated systems. The protein expression levels of the hub genes were also identified from the protein atlas database (www.proteinatlas.org). The tissue pathology, transcript expression of hub genes as identified from Genotype tissue Expression dataset (GTEx) and their cell specific protein expression from human proteome atlas (HPA) in normal cells of glomeruli, and tubules were predicted.
Confirmation of Hub Genes
The hub genes identified needed confirmation and hence a single-cell transcriptome data of early diabetic nephropathy (37) from Humphreys Lab (http://humphreyslab.com/SingleCell/) was analyzed with the data visualization tool. The dataset with GEO accession GSE131882 had an integrated single-nuclear (sn) RNA data that included 3 control and 3 early diabetes samples from podocytes (PODO), proximal convoluted tubules (PCT), cells of the loop of Henle (LOH), connecting tubule cells (CNT), distal convoluted duct cells (DCT), principal cells of collecting duct (CTP), glomerular endothelial cells (EDC), intercalated cell B from collecting duct (CTB), intercalated cell A from the collecting duct (CTA), parietal epithelial cells (PEC), messenger cells and immune cells (38). The hub genes were compared to the snRNA dataset to confirm their potential effect. Their expression in diabetic nephropathy vs healthy human donor was predicted through Nephroseq v5 tool (https://nephroseq.org). The cut off thresholds were p value of 0.05, and log2FC of 1.5 to filter out the expression patterns of the putative candidate biomarker genes.
Drug Perturbation Analysis
We have conducted the transcriptomic signature similarity search on the identified DEGs using L1000FWD web server (http://www.lincsproject.org/LINCS/dmoa). The potential drug candidates which mimicked and reversed the gene expression signatures were ranked based on the similarity score close to 1 and -1 (39).
Results
Identification of DEGs in DKD
We obtained the gene expression profiles of diseased and controlled samples of GDKD, TDKD and EDN from the GSE30528, GSE30529 and GSE111154 datasets and identified the DEGs using the GEO2R package. Upon setting the cut-off criterion as log2FC > 1.5 and P < 0.05, we identified 1,241, 318 and 280 DEGs from GSE30528, GSE30529 and GSE111154, respectively. The overlapping DEGs between the three datasets were also identified (Figure 1A) The volcano plots of the DEGs of each dataset are shown in Figure 1B. The heat map of the DEGs based on Hierarchical clustering between patients with DKD and healthy controls are shown in Figure 1C. We have identified 44 upregulated and 23 downregulated genes overlapped between the EDN and GDKD, 188 upregulated and 5 downregulated genes were found overlapped between the GDKD and TDKD, and 52 upregulated genes were found commonly between the EDN and TDKD. Interestingly, two upregulated genes SULF1 and DCN, and one downregulated gene PTPRO were observed as common to the three datasets (Figure 1A). The overall statistics are shown in Table 1.
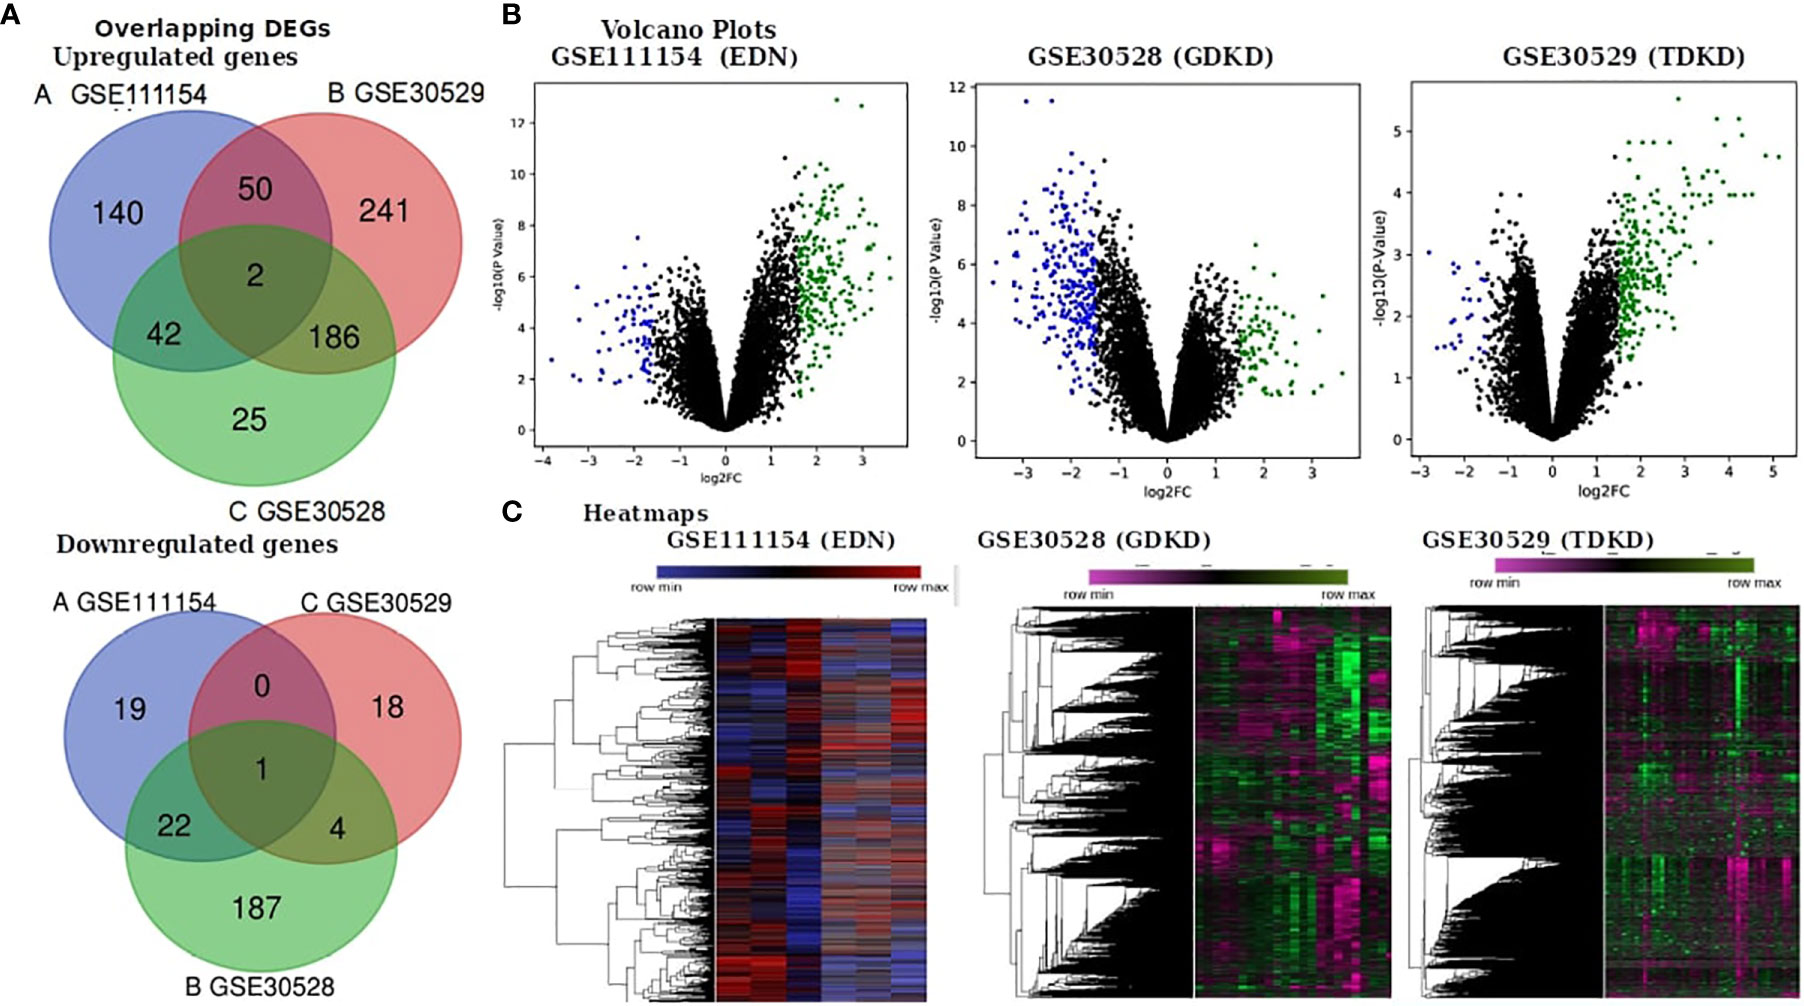
Figure 1 Identification of differentially expressed genes (DEGs) in the three datasets (EDN: GSE111154, GDKD: GSE30528 and TDKD: GSE30529). (A) Venn diagrams representing commonly changed DEGs in the three datasets. (B) Respective volcano plot of the three datasets. Red and blue plots represent up- and downregulated genes, respectively (log2FC > 1.5 and P value < 0.05). Black plots represent the remaining genes with no significant difference. (C) Heatmap of the top 500 DEGs are shown.

Table 1 Identification of the commonly changed DEGs in the three datasets.
GO Term Enrichment Analysis of DEGs
Gene ontology enrichment is significant to elucidate the mechanisms of differentially expressed genes and we performed DEG GO analysis using the DAVID (https://david-d.ncifcrf.gov/) gene annotation tool. Three sub-ontologies viz. BP, MF and CC were examined. The DEGs of the respective datasets were examined and based on the P- value, the top 10 best ranked gene annotations were considered for further analysis (40). The GO annotations for the up- and downregulated genes are shown in Supplementary Figures 1 and 2, respectively. As shown in Supplementary Figure 1 illustrating the BP term, the upregulated genes were mainly enriched in extracellular matrix organization, regulation of cell migration, response to cytokine stimulation, regulation of coagulation and glomerular epithelial cell differentiation; downregulated genes were largely enriched in regulation of glomerular filtration, chemotaxis and cellular response to vascular endothelial growth factors. For MF, enrichment of upregulated genes were mainly involved in the metalloendopeptidase inhibitor activity, tau protein binding, integrin binding and prostaglandin E receptor activity, and that of downregulated genes were mainly in the filamin binding, VEGF (Vascular Endothelial Growth Factor) receptor binding and CMP alpha 2-3 sialyltransferase and immunoglobulin binding mechanisms. For CC, enrichment of upregulated genes were primarily in the phagocytic vesicles and granular lumen and the downregulated genes mainly in secretory vesicles, exocytic vesicles, platelet alpha granules and endolysosomes. We have also performed the GO term enrichment analysis for the overlapped genes (Supplementary Table 1).
Signaling Pathway Enrichment Analysis
KEGG and REACTOME pathway enrichment analyses of the DEGs (both up- and downregulated) were performed (Supplementary Figure 3). The significantly upregulated pathways were identified to be the hemostasis, aggregation and activation of platelets, collagen formation and complement cascade activation. Enrichment of downregulated DEGS was mostly in vascular endothelial growth factor receptor dimerization, VEGF- ligand interactions, defective B3GALTL (Beta 3-Glucosyltransferase) and pathways associated with O-glycosylation. We further performed the interrelational analysis of pathways by examining KEGG processes of up- and downregulated DEGs in ClueGO. Interestingly, the upregulated DEGs were primarily associated with the complement activation, collagen formation, collagen biosynthesis, humoral immune response, regulation of prostaglandin, perception of neurofibrillary tangle, cold stimulus and nephron morphogenesis (Figure 2). The downregulated DEGs were primarily associated with the regulation of axon guidance, endothelial cell chemotaxis, vascular endothelial growth factor signaling, MAP kinase signaling, protein kinase activity, glomerular filtration, collagen biosynthesis, formation of fibrin clots and coagulation (Figure 3).
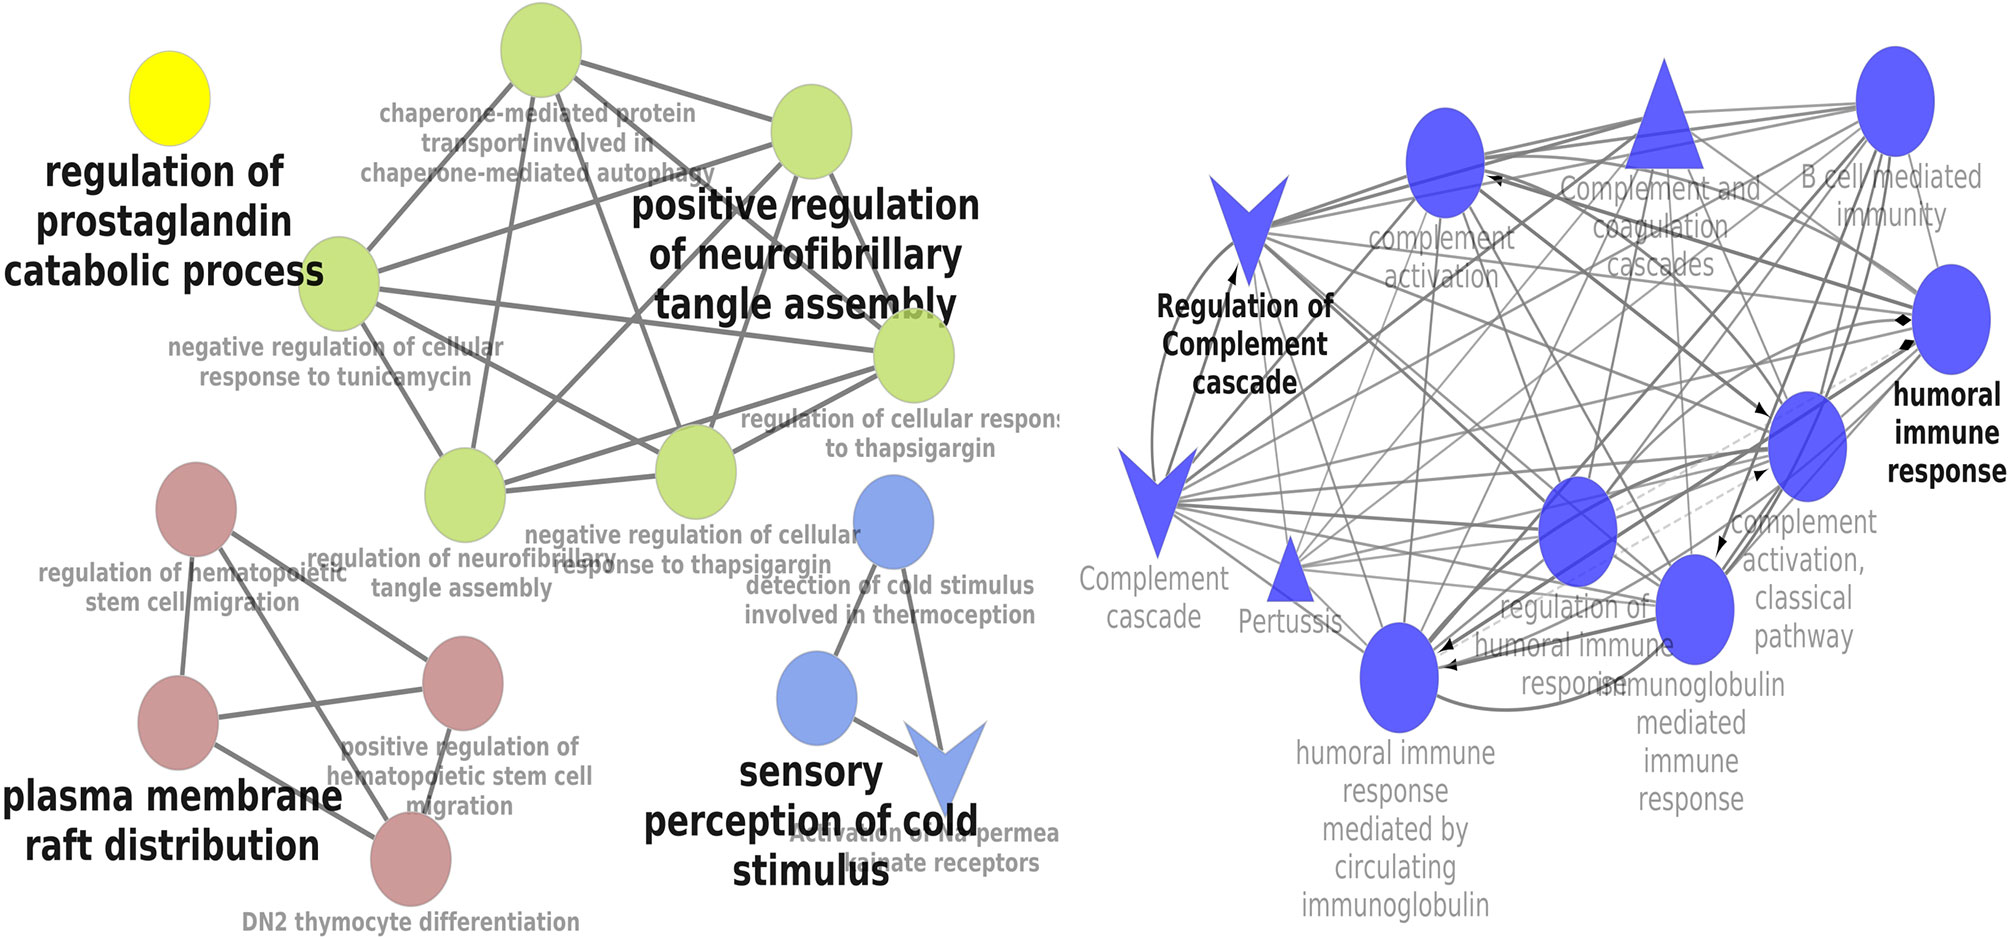
Figure 2 Interrelation analysis of pathways upregulated DEGs by examining KEGG processes in ClueGO.
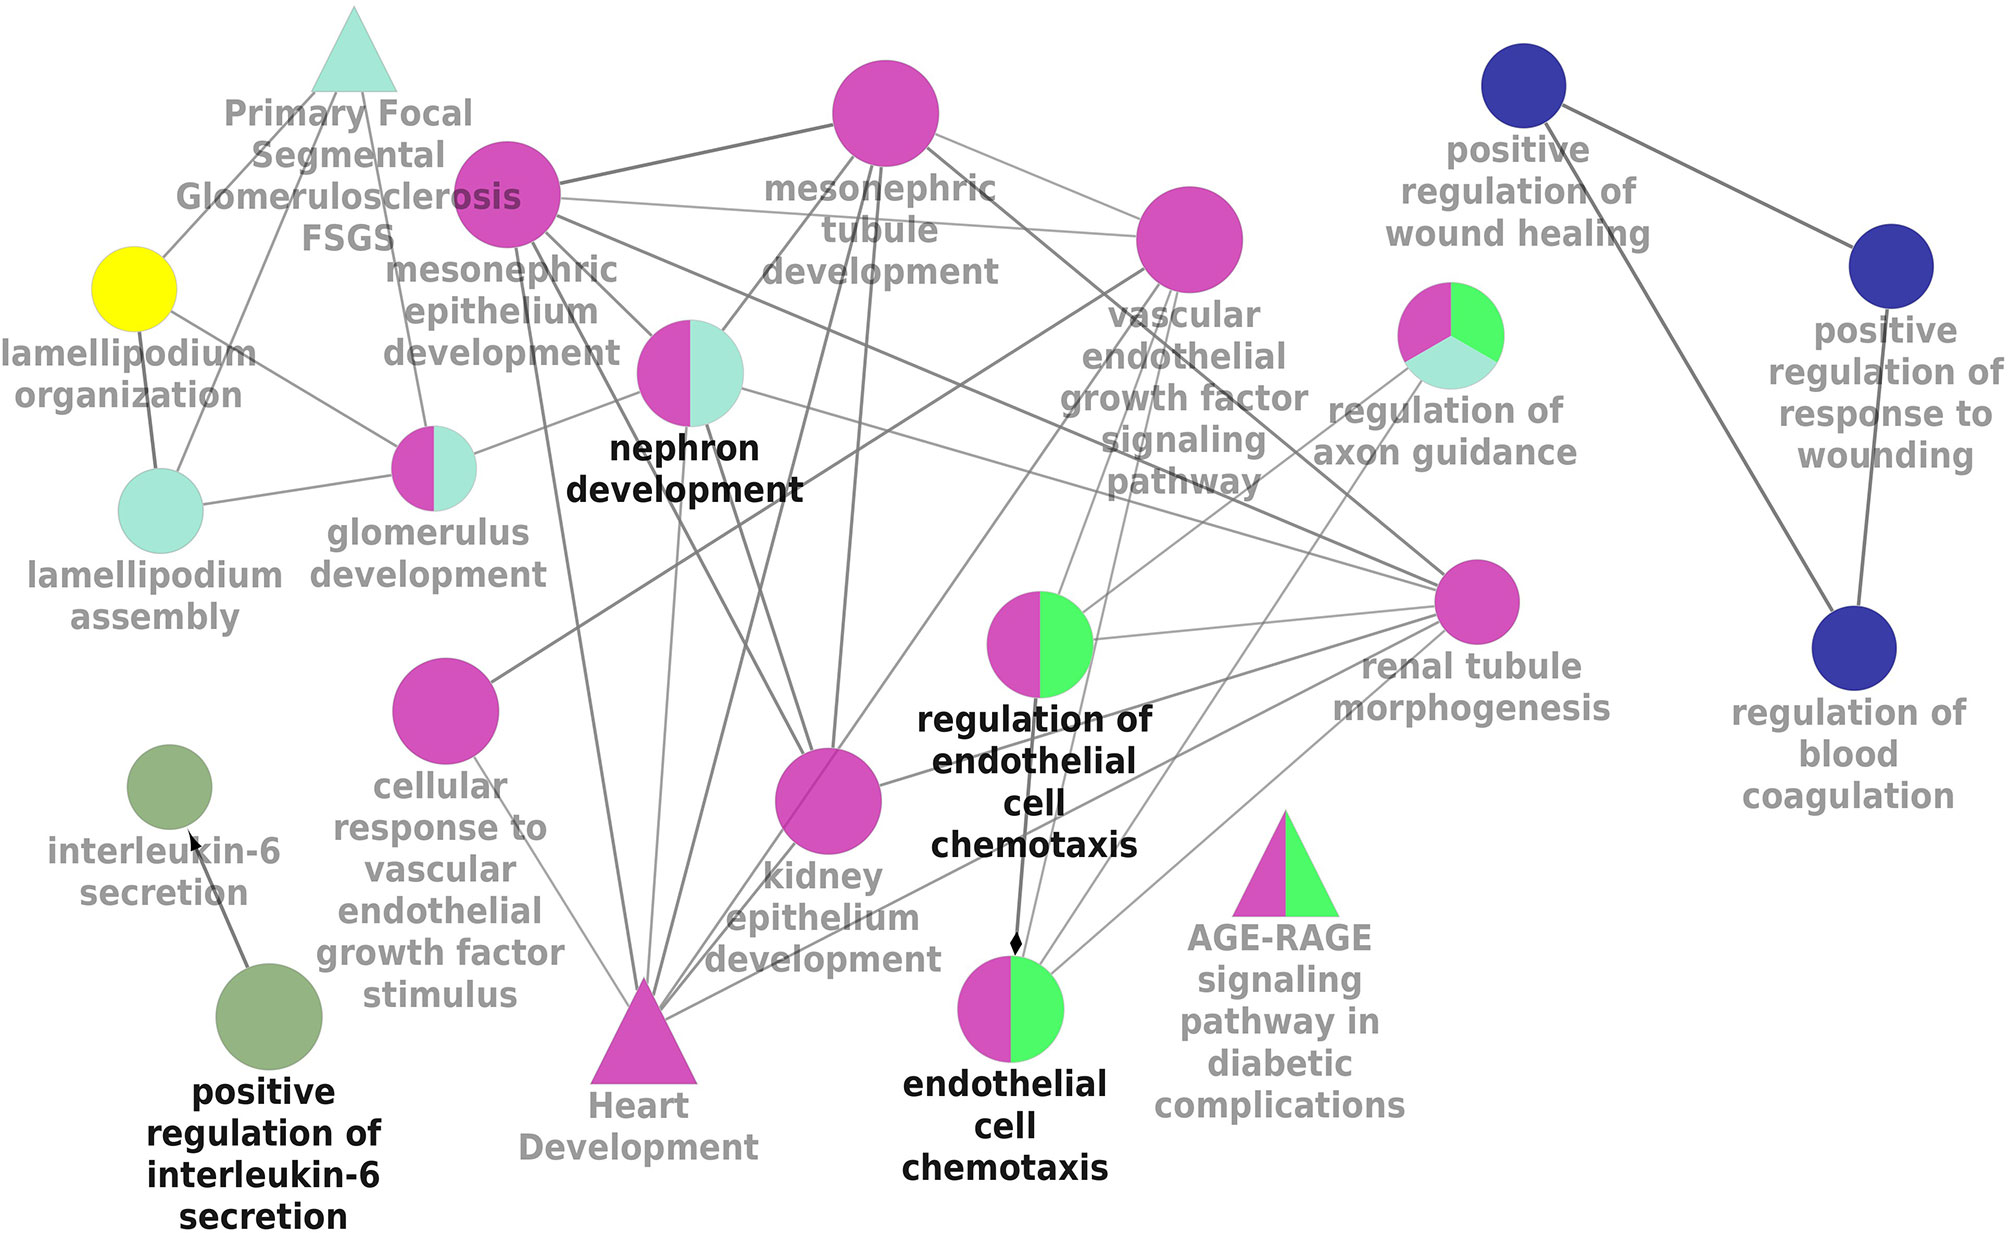
Figure 3 Interrelation analysis of pathways downregulated DEGs by examining KEGG processes in ClueGO.
PPI Network Construction and Identification of Hub Genes
We have investigated the integrated pathways and PPI of the DEGs using the STRING database and Cytoscape software. The overall interactions were further validated with the MCODE module (shown in Figure 4). Significant PPI clusters for up- and downregulated DEGs were identified with the maximum score of 13.286 and 6.25, respectively. The PPI cluster of the upregulated DEGs included 15 nodes with 94 degrees. The PPI cluster of the downregulated DEGs included 7 nodes with 25 degrees along with two subclusters containing 2 nodes and 2 degrees each with a score of 3.32. CTGF (Cellular Communication Network Factor 2), IGFBP5 (Insulin Like Growth Factor Binding Protein 5) and LOX (Lysyl Oxidase) were identified as two upregulated hub genes for EDN. THBS2 (Thrombospondin 2), LUM, COL6A3 (Collagen Type VI Alpha 3 Chain), FN1 and VCAN were identified as four upregulated hub genes for GDKD. FSTL1 (Follistatin Like 1), TIMP1 (TIMP Metallopeptidase Inhibitor 1), POSTN, SPARC and COL3A1 (Collagen Type III Alpha 1 Chain) were identified as five upregulated hub genes for TDKD. VEGFA, PLCE1 (Phospholipase C Epsilon 1), BMP2 (Bone Morphogenetic Protein 2) and FGF1 (Fibroblast Growth Factor 1) were identified as four downregulated hub genes for EDN. HRG (Histidine Rich Glycoprotein) was identified as the downregulated hub gene for GDKD. Interestingly, two most significant candidate genes viz. DCN (encodes decorin) and PTPRO (encodes receptor-type tyrosine-protein phosphatase O) were found common for the respective up- and downregulated DEGs in all three datasets. Non overlapping upregulated gene COL1A2 (Collagen Type VI Alpha 2 Chain) and downregulated THY1 (Thy-1 Cell Surface Antigen), KNG1, EGF and THBS1 were also identified from the string interactions.
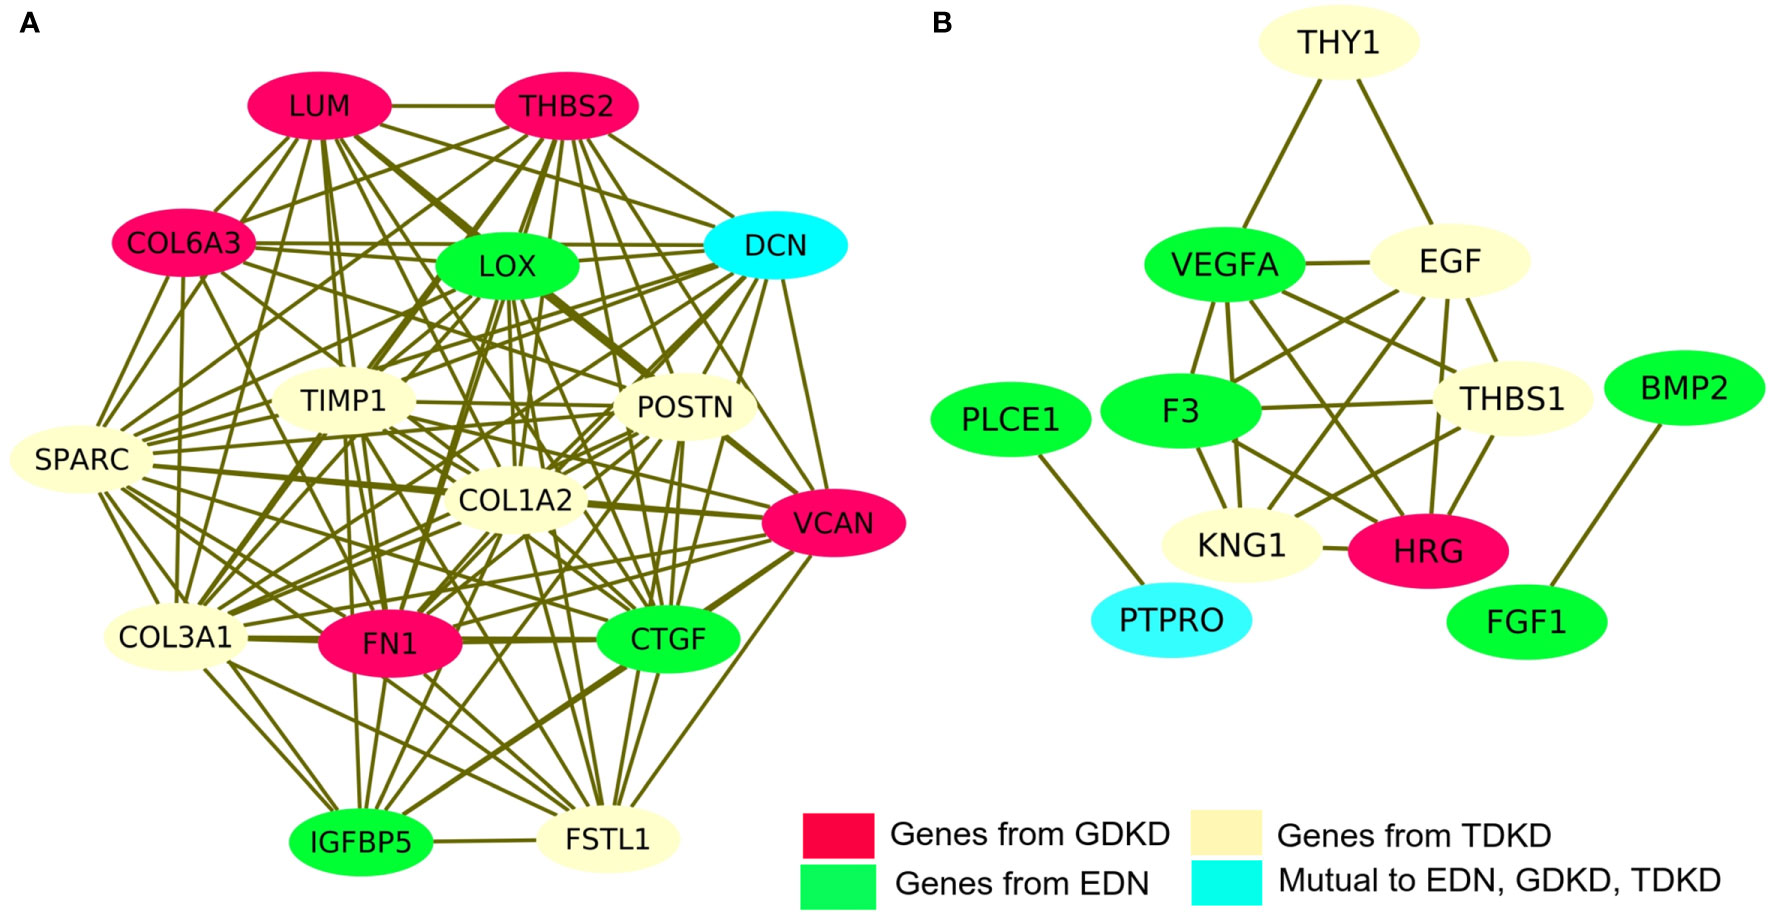
Figure 4 Protein–protein interaction (PPI) network of DEGs and module analysis. (A) Identification of a significant module based on the degree of importance examined for upregulated DEGs. (B) Identification of a significant module based on the degree of importance examined for downregulated DEGs. The representations are as follows: the potential genes unique to EDN, GDKD, and TDKD are shown in green, pink and cream colors respectively. The cyan color represents the common gene noticed in all three datasets for the respective up- and downregulated DEGs.
Validation of Hub Genes
The hub genes were validated based on the comparison between the standard expression levels from the Genotype tissue expression (GTEx) dataset and the fold change as a measure of Transcripts per kilobase million (TPM) with a maximum of 11,749 TPM. Analysis of the distribution of the hub genes revealed that they were significantly expressed in both left and right cortex tissues of the kidney. As per the GTEx dataset, higher expression levels of PTPRO, NPHS1, VCAN, COL6A3, THBS1 and FN1 were found in the cortex and pelvis of both the kidneys. Medium expressions of KNG1, LOX, THY1, THBS2, PLCE1 and VEGFA and lower expressions of HRG were identified in the renal tissues (Figure 5). Validation was further extended with the prediction of the tissue specific expression rates as per GTEx data set and cell specific expression rates from Human Protein Atlas maps and are represented in Table 2.
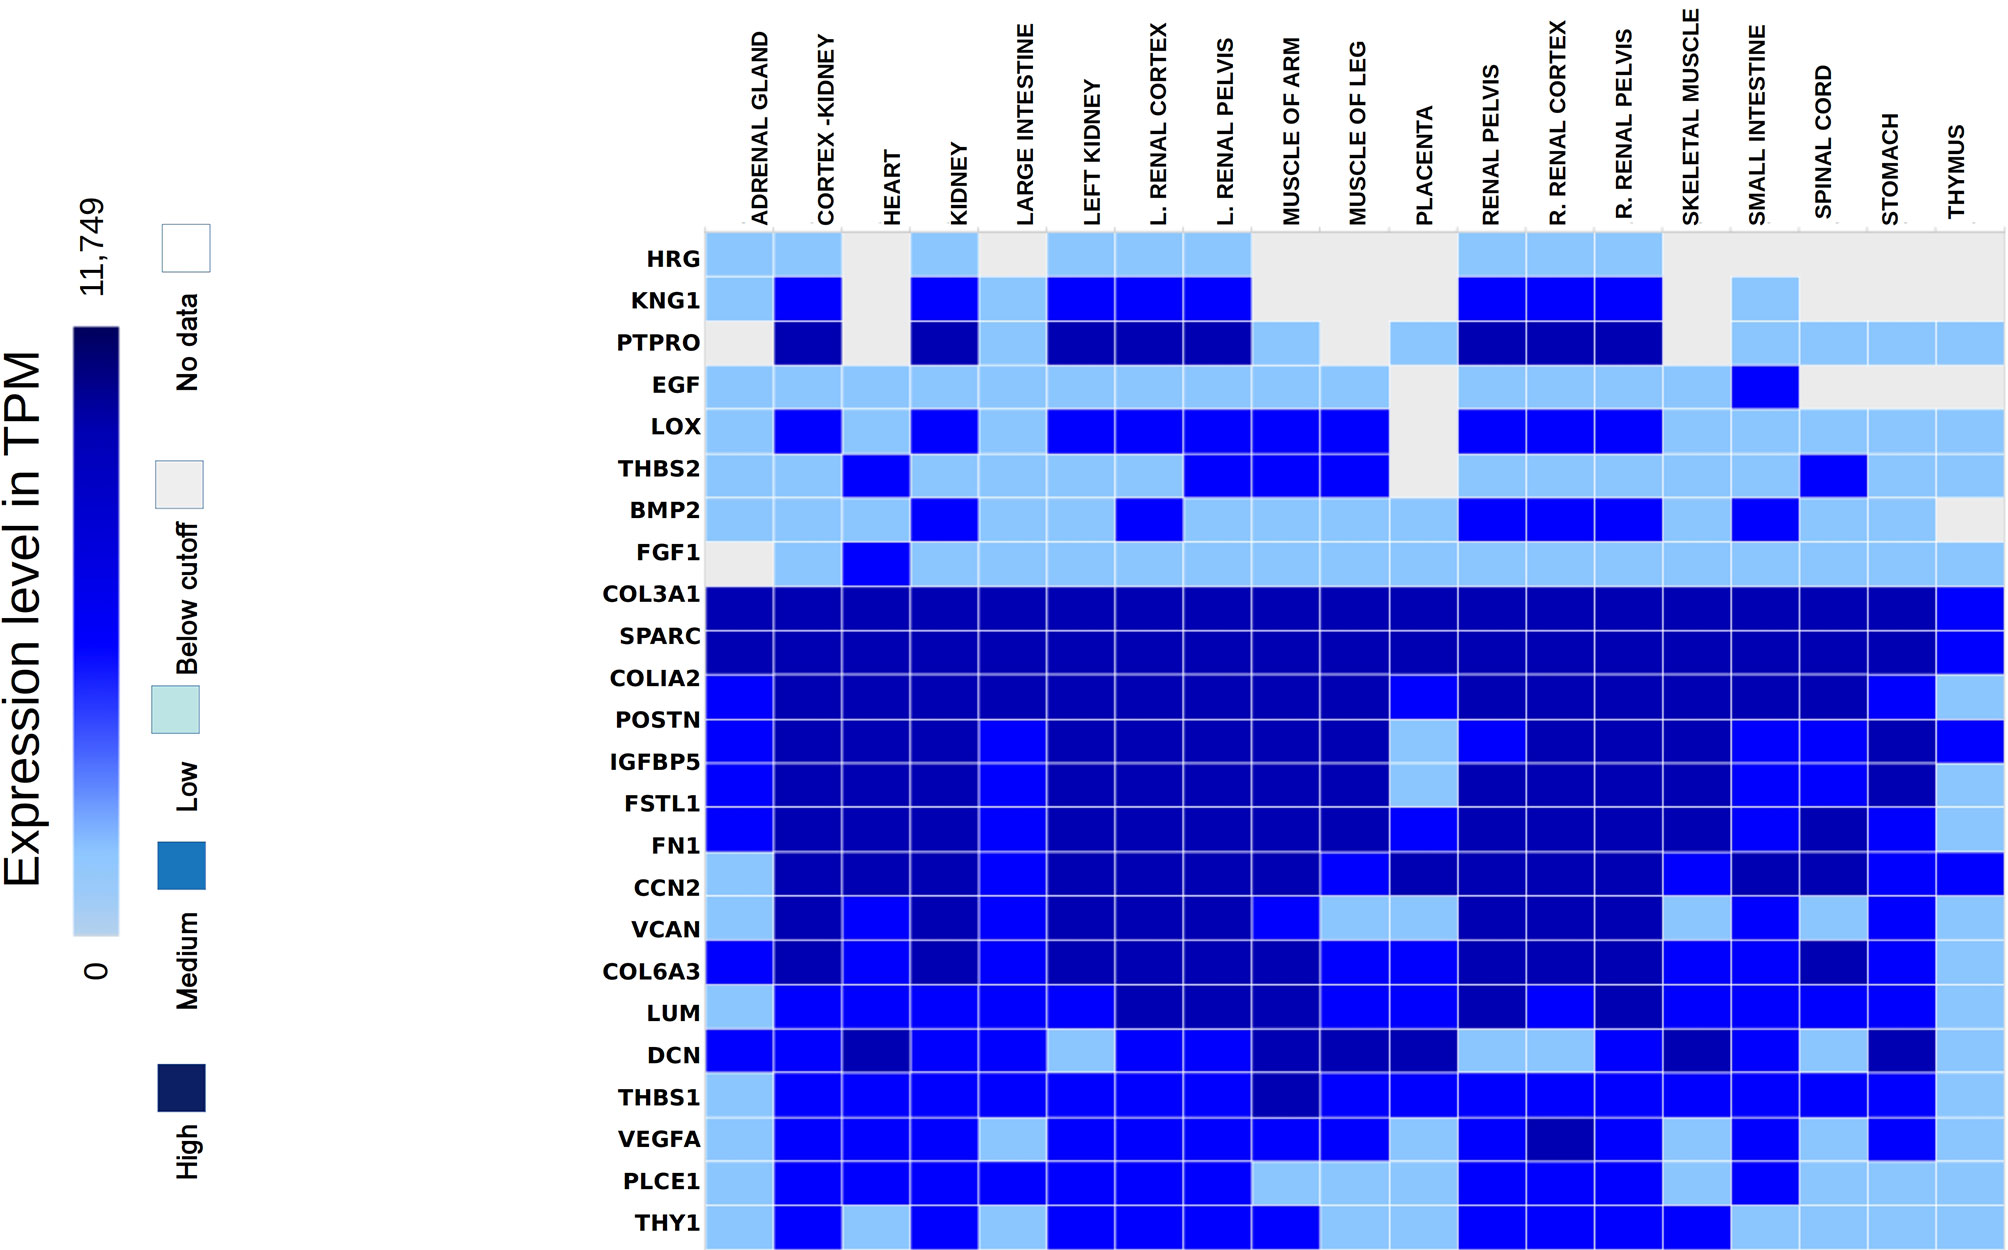
Figure 5 Hub genes identified from the expression atlas based on their transcripts per kilobase million expression level in the renal system.
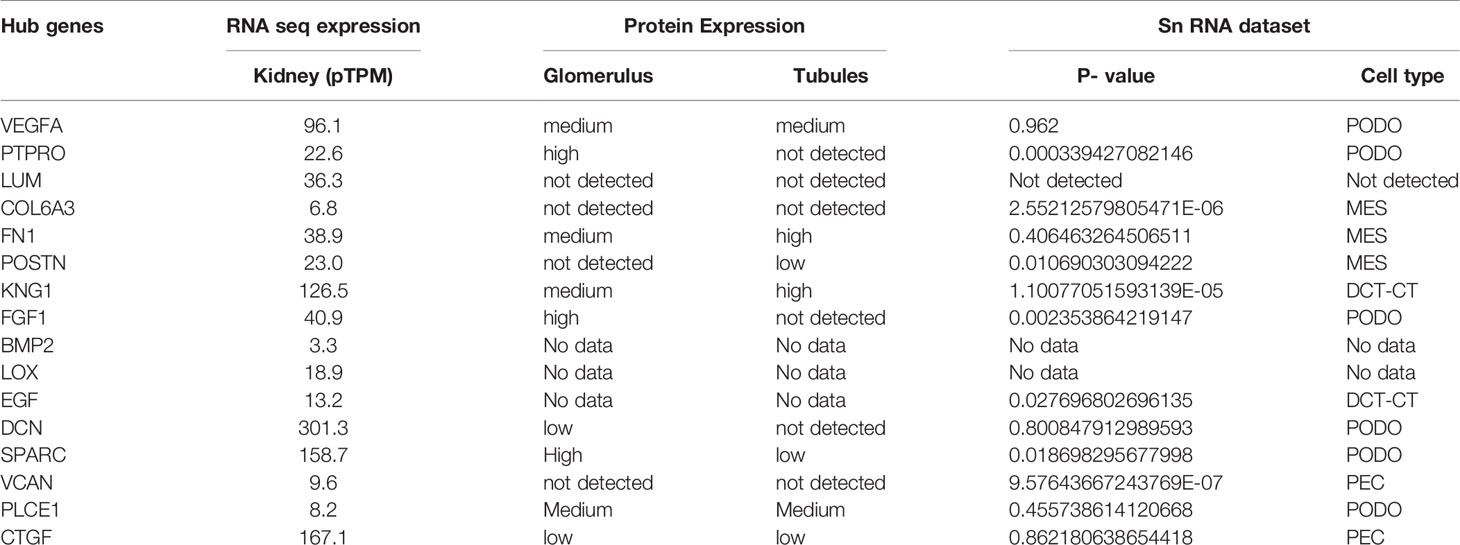
Table 2 Expression levels of the hub genes identified from GTEx and HPA data.
Mean TPM of DCN was higher in kidneys with an expression rate of 301.3, followed by SPARC with a value of 158.7. Their expression rates were the highest in the urinary bladder with 1509.2 pTPM and 345.8 pTPM for DCN and SPARC respectively. DCN was identified as a renal cancer prognostic marker with lower levels of its protein identified in glomeruli cells of normal kidneys whereas higher levels of SPARC was predicted in glomeruli and lower levels in tubuli cells of normal kidneys. Higher protein expressions of PTPRO and FGF1 were detected in glomerulus and not in tubuli. PTPRO and FGF1 were already established prognostic biomarkers of renal cancers. Higher protein expression levels of FN1 and KNG1 were identified in normal tubular kidneys and medium levels in glomerulus and bladder tissues. Expressions of LUM, VCAN, COL6A3 were not detected in the normal glomerular, tubular and bladder tissues.
From the overall analysis of hub genes and expression analysis, overexpression of FN1, LUM, VCAN could be the potential prognostic biomarkers of GDKD. Downregulation of KNG1 and upregulation of POSTN and SPARC could be significant biomarkers of TDKD. Upregulated CTGF represents a potential biomarker of EDN. The below cutoff expression (represented in transcripts per kilobase million or TPM) of PTPRO could represent any of the three diseased conditions such as early diabetic nephropathy, glomerular and tubular diabetic kidney diseases. Although the DCN is normally expressed in kidney tissue, high traces of its expression was also found in other organs such as heart and muscles. Thus, despite its significant expression in upregulated DEGs of all three datasets, it cannot be proposed as a suitable biomarker for DKD.
Comparison of Hub Genes With snRNA Transcriptome Dataset
The hub genes were compared with the snRNA transcriptome dataset to infer their potentiality. The genes SPARC, THBS1, EGF, PTPRO, FGF1, POSTN, and COL6A3 were identified to be significantly enriched in the PODO, MES, DCT, PODO, MES, PEC, and MES samples respectively with significant p-value (38) as seen in Table 2. LUM, BMP2 and LOX were not detected. VEGFA, FN1, KNG1, FGF1, DCN, VCAN and CTGF were identified in PODO, MES, DCT-CT, PODO, PODO, PEC and PEC respectively. As seen in the Figure 6, Nephroseq v5 webserver predicted the over expression of FN1, SPARC, LUM, VCAN, and POSTN with fold change of 2.808, 1.655, 6.25, 1.77, and 3.324 in diabetic nephropathy respectively. Under expression of PTPRO and KNG1 with fold change of -3.308 and -1.618 respectively were reported in diabetic nephropathy in comparison with healthy living donors. These results correlated with the identified putative biomarkers of GDKD, TDKD and EDN except that of CTGF, where it has an under expression (fold change of -4.728) in diabetic nephropathy in contrast to the earlier predictions.
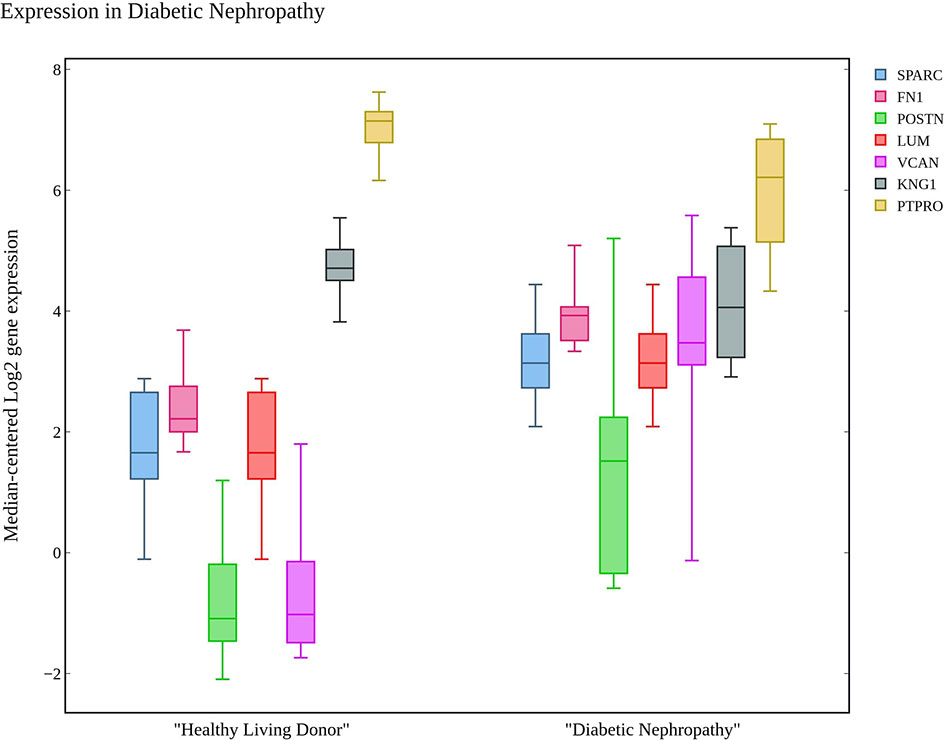
Figure 6 The box plot of seven candidate genes that exhibit the over and under expression rates in diabetic nephropathy in comparison with healthy living donors.
Drug Perturbation of the Transcriptome Data
Further, we identified the small-molecules chemical perturbagens. The large publicly available gene expression datasets from LINCS were explored to first identify the signature genesets for kidney disease. Subsequently, we identified the 50 different drug perturbation signatures for the overlapping DEGs. We filtered out the similar and opposite signatures for the DEGs from the human renal epithelial cell line HA1E (41). Drugs with similar gene signatures represent the ones strikingly mimic the current gene expression patterns whereas the opposite gene signature patterns represent the ones capable of reversing the observed current expression profiles (42). In this study, the top drugs were ranked based on the similarity scores. Two drugs viz. pidorubicine, a topoisomerase inhibitor (LINCS ID- BRD-K04548931) and Polo-like kinase inhibitor (LINCS ID- BRD-K41652870) were identified from the opposite signatures. Both the drugs were validated to be effective on the renal epithelium cell line with the similarity score of -0.9812 and -0.9516, respectively. The details of the drug perturbation analysis is presented in Table 3. The transcriptomic signatures and the action of the drugs BRD-K04548931 and BRD-K41652870 on renal epithelium cell lines (HA1E) are shown in Supplementary Figure 3.
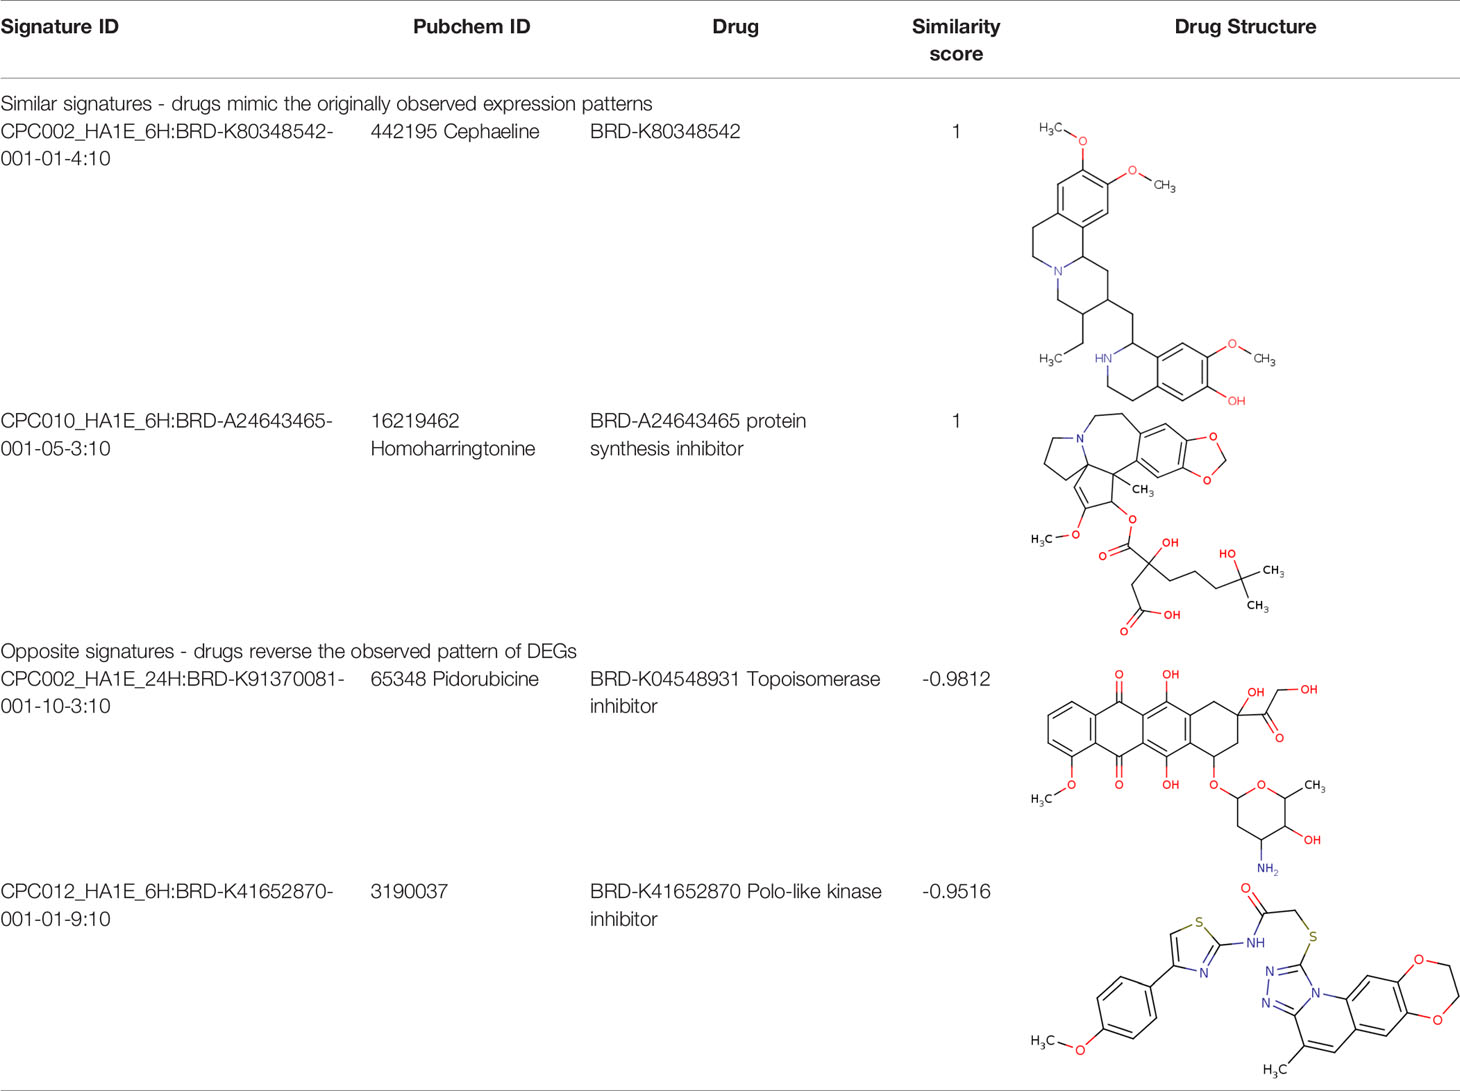
Table 3 Drug perturbation analysis of the overlapped DEGs.
Discussion
Currently, due to the aggressive comorbidities associated with the DKD poses an enormous challenge in their diagnosis. The identification of the better biomarkers are urgently needed to improve diagnosis. Niewczas et al. recently examined the proteomic profiling of circulating proteins (19) in type 1 and type 2 diabetes patients. They identified an extremely robust inflammatory signature, consisting of 17 proteins enriched for TNF Receptor Superfamily members with a 10-year risk of end-stage renal disease. Mitrofanova et al., reported that SMPDL3b modulates insulin receptor signaling in DKD (43). Bjornstad et al., recently reported the relationships between markers of tubular injury and intrarenal hemodynamic function in adults with and without type 1 diabetes (44). Hirao et al., reported the discovery of a useful biomarker for EDN discovery by proteomics analysis of urine proteomes of DM patients without microalbuminuria and healthy volunteers (45). Cheung et al. performed an exome-chip association analysis in Chinese subjects with type 2 diabetes (46). They noticed elevated circulating pigment epithelium-derived factor levels were associated with increased risks of DN and sight-threatening diabetic retinopathy. Collectively, the identification of novel markers for prognosis and diagnosis of DKD is an active area of research.
In this work, we aimed to reanalyze the omics molecular profiles available in the public databases to identify the prognosis biomarkers and small-molecules chemical perturbagens of the DKD. Similar approaches have been advocated in previous studies. In the current study, we integrated gene expression patterns of three stages of DKD viz. EDN, GDKD and TDKD. We obtained three datasets of gene expression patterns from NCBI-GEO: GSE111154 with samples affected by EDN along with healthy control, GSE30528 with samples from the affected GDKD along with healthy control, and finally GSE30529 containing samples affected with TDKD along with healthy control.
A total of 280 up- and 27 downregulated DEGs were identified and the subsequent analysis was carried out on them. Gene annotations of DEGs revealed the upregulations of biological processes such as cell migration, cytokine stimulation, and glomerular epithelial cell differentiation. Downregulated molecular functions being metallopeptidase inhibitor, VEGFA receptor binding and integrin binding ability. Cellular components like phagocytic vesicles and granular lumen were found in higher levels. Pathways enrichment analysis disclosed potential activation and aggregation of platelets, collagen fiber formation, hemostasis and activated complement cascade. Pathways involving the vascular endothelial growth factor dimerization and its interaction with ligands were substantially deferred from the normal occurrences. The subsequent inter-relational analysis supported the above findings. Strikingly, reduced developments of glomeruli and nephrons were noticed in all three diseased conditions. The determination of PPI networks allowed us to narrow down the DEGs to identify potential biomarkers.
We compared the gene expression levels of the identified hub genes. FN1 (responsible for cell adhesion), LUM and VCAN (veriscan) (involved in cytokine activity and signaling pathways) could be the putative upregulated biomarkers of GDKD. We predicted the lower expression of KNG1 (kininogen1) responsible for elevated cytosolic calcium levels and fibrin clots can be a putative prognostic biomarker for TDKD. Upregulation of POSTN (peristin) and SPARC (secreted protein acidic and cysteine rich) could also be putative biomarkers of TDKD. PTPRO (protein tyrosine phosphatase receptor O) responsible for the chemotaxis and regulation of glomerular filtration was proposed as an attractive downregulated candidate biomarker for all three diseases. The genes FN1, and PTPRO were reported by the Online Mendelian Inheritance in Man (OMIM) database to be associated with glomerulopathy, renal fibrosis and nephrotic syndrome, respectively (47). Correlation of expression of the candidate genes were obtained in comparison to the snRNA datasets, except that of CTGF which had a contradictory under expression in diabetic nephropathy Thus, the identified key candidate genes - FN1, SPARC, VCAN, LUM, POSTN, KNG1 and PTPRO can be considered further for the investigation in clinical research. Finally the two drugs viz. pidorubicine, a topoisomerase inhibitor (LINCS ID- BRD-K04548931) and Polo-like kinase inhibitor (LINCS ID- BRD-K41652870) were also identified using the induced transcriptional gene signature database. These drugs were known to have the validated role in reversing the differential gene expression patterns observed in all three datasets (48).
Though the study has integrated gene enrichment, pathways, tissue and cell specific expression analysis in the identification of hub genes for diabetic kidney conditions, there exists few limitations as well. There are advanced sc-RNA and bulk sequencing technologies available, yet the current study relied upon the affymetrix microarray datasets to infer the diabetic kidney disease pathogenesis for three reasons: first, majority of the diabetic kidney disease datasets were based on affymetrix platform, secondly, the human transcriptome data were limited and finally, the datasets without any treatment conditions were a little. The present study needs extensive clinical validation of the proposed candidate genes and drug perturbations. Thus the field demands more research and the current research opens up novel directions to explore the biomarkers and pathology of diabetic kidney diseases. Comparison of the hub genes with the sn-RNA sequence data added confirmation and correlated with the main findings of the study.
In conclusion, we have investigated the potential biomarkers/key candidate genes for DKD using the integrated bioinformatics analysis. We identified seven candidate genes FN1, LUM, VCAN, KNG1, POSTN, SPARC and PTPRO significantly associated with the progression of DKD, and further investigation of these genes in clinical research is warranted. Furthermore, the results of this study increase our understanding of the molecular drivers, critical genes and pathways that underlie DKD initiation and progression. Identification of the small-molecules chemical perturbagens further validate their potentials as therapeutic targets.
Data Availability Statement
The original contributions presented in the study are included in the article/Supplementary Material. Further inquiries can be directed to the corresponding author.
Author Contributions
ZG designed the study, curated the datasets, analyzed the computational results and wrote the original draft. AS helped in the acquisition, analysis and interpretation of the datasets, and wrote the revised manuscript. XML, XLL and LS helped in the datasets analysis and wrote the original manuscript. All authors contributed to the article and approved the submitted version.
Funding
This work is funded by the Everest Project of Air Force Medical University (NO: 2020ZFB002).
Conflict of Interest
The authors declare that the research was conducted in the absence of any commercial or financial relationships that could be construed as a potential conflict of interest.
Publisher’s Note
All claims expressed in this article are solely those of the authors and do not necessarily represent those of their affiliated organizations, or those of the publisher, the editors and the reviewers. Any product that may be evaluated in this article, or claim that may be made by its manufacturer, is not guaranteed or endorsed by the publisher.
Supplementary Material
The Supplementary Material for this article can be found online at: https://www.frontiersin.org/articles/10.3389/fendo.2021.721202/full#supplementary-material
Supplementary Figure 1 | Gene Ontology (GO) term enrichment analysis of upregulated genes in the three datasets (EDN: GSE111154, GDKD: GSE30528 and TDKD: GSE30529). GO analysis of the upregulated genes were examined for three sub-ontologies (biological process, molecular function, and cellular component).
Supplementary Figure 2 | Gene Ontology (GO) term enrichment analysis of downregulated genes in the three datasets (EDN: GSE111154, GDKD: GSE30528 and TDKD: GSE30529). GO analysis of the downregulated genes were examined for three sub-ontologies (biological process, molecular function, and cellular component).
Supplementary Figure 3 | Signaling pathway enrichment analysis of overlapped DEGs. from KEGG and REACTOME pathways.
References
1. International Diabetes Federation. Diabetes Atlas. Belgium: Federation International du Diabete (2003).
2. Alicic RZ, Rooney MT, Tuttle KR. Diabetic Kidney Disease: Challenges, Progress, and Possibilities. Clin J Am Soc Nephrol (2017) 12(12):2032–45. doi: 10.2215/CJN.11491116
3. Cameron JS. The Discovery of Diabetic Nephropathy: From Small Print to Centre Stage. J Nephrol (2006) 19 Suppl 10:S75–87.
4. Collins AJ, Foley RN, Gilbertson DT, Chen S-C. United States Renal Data System Public Health Surveillance of Chronic Kidney Disease and End-Stage Renal Disease. Kidney Int Suppl (2015) 5(1):2–7. doi: 10.1038/kisup.2015.2
5. Lozano R, Naghavi M, Foreman K, Lim S, Shibuya K, Aboyans V, et al. Global and Regional Mortality From 235 Causes of Death for 20 Age Groups in 1990 and 2010: A Systematic Analysis for the Global Burden of Disease Study 2010. Lancet (London England) (2012) 380(9859):2095–128. doi: 10.1016/S0140-6736(12)61728-0
6. Murray CJL, Barber RM, Foreman KJ, Abbasoglu Ozgoren A, Abd-Allah F, Abera SF, et al. Global, Regional, and National Disability-Adjusted Life Years (Dalys) for 306 Diseases and Injuries and Healthy Life Expectancy (HALE) for 188 Countries, 1990-2013: Quantifying the Epidemiological Transition. Lancet (London England) (2015) 386(10009):2145–91. doi: 10.1016/S0140-6736(15)61340-X
7. GBD 2015 DALYs and HALE Collaborators. Global, Regional, and National Disability-Adjusted Life-Years (Dalys) for 315 Diseases and Injuries and Healthy Life Expectancy (HALE), 1990-2015: A Systematic Analysis for the Global Burden of Disease Study 2015. Lancet (London England) (2016) 388(10053):1603–58. doi: 10.1016/S0140-6736(16)31460-X
8. Ma RCW. Epidemiology of Diabetes and Diabetic Complications in China. Diabetologia (2018) 61(6):1249–60. doi: 10.1007/s00125-018-4557-7
9. Duan J, Wang C, Liu D, Qiao Y, Pan S, Jiang D, et al. Prevalence and Risk Factors of Chronic Kidney Disease and Diabetic Kidney Disease in Chinese Rural Residents: A Cross-Sectional Survey. Sci Rep (2019) 9(1):10408. doi: 10.1038/s41598-019-46857-7
10. Liyanage T, Ninomiya T, Jha V, Neal B, Patrice HM, Okpechi I, et al. Worldwide Access to Treatment for End-Stage Kidney Disease: A Systematic Review. Lancet (London England) (2015) 385(9981):1975–82. doi: 10.1016/S0140-6736(14)61601-9
11. Levin A, Tonelli M, Bonventre J, Coresh J, Donner J-A, Fogo AB, et al. Global Kidney Health 2017 and Beyond: A Roadmap for Closing Gaps in Care, Research, and Policy. Lancet (London England) (2017) 390(10105):1888–917. doi: 10.1016/S0140-6736(17)30788-2
12. López-Novoa JM, Rodríguez-Peña AB, Ortiz A, Martínez-Salgado C, López Hernández FJ. Etiopathology of Chronic Tubular, Glomerular and Renovascular Nephropathies: Clinical Implications. J Trans Med (2011) 9:13. doi: 10.1186/1479-5876-9-13
13. Tonelli M, Muntner P, Lloyd A, Manns BJ, Klarenbach S, Pannu N, et al. Risk of Coronary Events in People With Chronic Kidney Disease Compared With Those With Diabetes: A Population-Level Cohort Study. Lancet (London England) (2012) 380(9844):807–14. doi: 10.1016/S0140-6736(12)60572-8
14. Zhang R, Zhuang L, Li M, Zhang J, Zhao W, Ge X, et al. Arg913Gln of SLC12A3 Gene Promotes Development and Progression of End-Stage Renal Disease in Chinese Type 2 Diabetes Mellitus. Mol Cell Biochem (2018) 437(1–2):203–10. doi: 10.1007/s11010-017-3120-z
15. Li E, Luo T, Wang Y. Identification of Diagnostic Biomarkers in Patients With Gestational Diabetes Mellitus Based on Transcriptome Gene Expression and Methylation Correlation Analysis. Reprod Biol Endocrinol (2019) 17(1):112. doi: 10.1186/s12958-019-0556-x
16. Lu J-M, Chen Y-C, Ao Z-X, Shen J, Zeng C-P, Lin X, et al. System Network Analysis of Genomics and Transcriptomics Data Identified Type 1 Diabetes-Associated Pathway and Genes. Genes Immun (2019) 20(6):500–8. doi: 10.1038/s41435-018-0045-9
17. Santiago JA, Bottero V, Potashkin JA. Transcriptomic and Network Analysis Highlight the Association of Diabetes at Different Stages of Alzheimer’s Disease. Front Neurosci (2019) 13:1273. doi: 10.3389/fnins.2019.01273
18. Fan Y, Yi Z, D’Agati VD, Sun Z, Zhong F, Zhang W, et al. Comparison of Kidney Transcriptomic Profiles of Early and Advanced Diabetic Nephropathy Reveals Potential New Mechanisms for Disease Progression. Diabetes (2019) 68(12):2301–14. doi: 10.2337/db19-0204
19. Niewczas MA, Pavkov ME, Skupien J, Smiles A, Md Dom ZI, Wilson JM, et al. A Signature of Circulating Inflammatory Proteins and Development of End-Stage Renal Disease in Diabetes. Nat Med (2019) 25(5):805–13. doi: 10.1038/s41591-019-0415-5
20. Woroniecka KI, Park ASD, Mohtat D, Thomas DB, Pullman JM, Susztak K. Transcriptome Analysis of Human Diabetic Kidney Disease. Diabetes (2011) 60(9):2354–69. doi: 10.2337/db10-1181
21. Yan H, Zheng G, Qu J, Liu Y, Huang X, Zhang E, et al. Identification of Key Candidate Genes and Pathways in Multiple Myeloma by Integrated Bioinformatics Analysis. J Cell Physiol (2019) 234(12):23785–97. doi: 10.1002/jcp.28947
22. Sircar M, Rosales IA, Selig MK, Xu D, Zsengeller ZK, Stillman IE, et al. Complement 7 Is Up-Regulated in Human Early Diabetic Kidney Disease. Am J Pathol (2018) 188(10):2147–54. doi: 10.1016/j.ajpath.2018.06.018
23. Musa A, Tripathi S, Dehmer M, Emmert-Streib F. L1000 Viewer: A Search Engine and Web Interface for the LINCS Data Repository. Front Genetics 10 (2019) 10:557. doi: 10.3389/fgene.2019.00557
24. Clough E, Barrett T. The Gene Expression Omnibus Database. Methods Mol Biol (Clifton N.J.) (2016) 1418:93–110. doi: 10.1007/978-1-4939-3578-9_5
25. Tang H, Zhang Y. Identification and Bioinformatics Analysis of Overlapping Differentially Expressed Genes in Depression, Papillary Thyroid Cancer and Uterine Fibroids. Exp Ther Med (2018) 15(6):4810–6. doi: 10.3892/etm.2018.6023
26. Zhao P, Hu W, Wang H, Yu S, Li C, Bai J, et al. Identification of Differentially Expressed Genes in Pituitary Adenomas by Integrating Analysis of Microarray Data. Int J Endocrinol (2015) 2015:164087. doi: 10.1155/2015/164087
27. Wickham H. Ggplot2: Elegant Graphics for Data Analysis. New York: Springer-Verlag (2009). doi: 10.1007/978-0-387-98141-3
28. Dennis G, Sherman BT, Hosack DA, Yang J, Gao W, Lane HC, et al. DAVID: Database for Annotation, Visualization, and Integrated Discovery. Genome Biol (2003) 4(5):P3. doi: 10.1186/gb-2003-4-5-p3
29. Kanehisa M, Furumichi M, Tanabe M, Sato Y, Morishima K. KEGG: New Perspectives on Genomes, Pathways, Diseases and Drugs. Nucleic Acids Res (2017) 45(D1):D353–61. doi: 10.1093/nar/gkw1092
30. Kanehisa M, Goto S. KEGG: Kyoto Encyclopedia of Genes and Genomes. Nucleic Acids Res (2000) 28(1):27–30. doi: 10.1093/nar/28.1.27
31. Fabregat A, Sidiropoulos K, Viteri G, Forner O, Marin-Garcia P, Arnau V, et al. Reactome Pathway Analysis: A High-Performance in-Memory Approach. BMC Bioinf (2017) 18(1):142. doi: 10.1186/s12859-017-1559-2
32. Bindea G, Mlecnik B, Hackl H, Charoentong P, Tosolini M, Kirilovsky A, et al. Cluego: A Cytoscape Plug-in to Decipher Functionally Grouped Gene Ontology and Pathway Annotation Networks. Bioinf (Oxford England) (2009) 25(8):1091–3. doi: 10.1093/bioinformatics/btp101
33. Otasek D, Morris JH, Bouças J, Pico AR, Demchak B. Cytoscape Automation: Empowering Workflow-Based Network Analysis. Genome Biol (2019) 20(1):185. doi: 10.1186/s13059-019-1758-4
34. Szklarczyk D, Morris JH, Cook H, Kuhn M, Wyder S, Simonovic M, et al. The STRING Database in 2017: Quality-Controlled Protein-Protein Association Networks, Made Broadly Accessible. Nucleic Acids Res (2017) 45(D1):D362–8. doi: 10.1093/nar/gkw937
35. Bader GD, Hogue CW. An Automated Method for Finding Molecular Complexes in Large Protein Interaction Networks. BMC Bioinf (2003) 4(1):2. doi: 10.1186/1471-2105-4-2
36. Papatheodorou I, Moreno P, Manning J, Fuentes AM-P, George N, Fexova S, et al. Expression Atlas Update: From Tissues to Single Cells. Nucleic Acids Res (2020) 48(D1):D77–83. doi: 10.1093/nar/gkz947
37. Wilson PC, Wu H, Kirita Y, Uchimura K, Ledru N, Rennke HG, et al. The Single-Cell Transcriptomic Landscape of Early Human Diabetic Nephropathy. Proc Natl Acad Sci USA (2019) 116(39):19619–25. doi: 10.1073/pnas.1908706116
38. Wei Y, Gao X, Li A, Liang M, Jiang Z. Single-Nucleus Transcriptomic Analysis Reveals Important Cell Cross-Talk in Diabetic Kidney Disease. Front Med (2021) 8:657956. doi: 10.3389/fmed.2021.657956
39. Stathias V, Turner J, Koleti A, Vidovic D, Cooper D, Fazel-Najafabadi M, et al. LINCS Data Portal 2.0: Next Generation Access Point for Perturbation-Response Signatures. Nucleic Acids Res (2020) 48(D1):D431–9. doi: 10.1093/nar/gkz1023
40. Sun Y, Yuan K, Zhang P, Ma R, Zhang Q-W, Tian X-S. Crosstalk Analysis of Pathways in Breast Cancer Using a Network Model Based on Overlapping Differentially Expressed Genes. Exp Ther Med (2015) 10(2):743–8. doi: 10.3892/etm.2015.2527
41. Lu X, Arbiser JL, West J, Hoedt-Miller M, Sheridan A, Govindarajan B, et al. Tumor Necrosis Factor-Related Apoptosis-Inducing Ligand can Induce Apoptosis in Subsets of Premalignant Cells. Am J Pathol (2004) 165(5):1613–20. doi: 10.1016/S0002-9440(10)63418-9
42. Szalai B, Subramanian V, Holland CH, Alföldi R, Puskás LG, Saez-Rodriguez J. Signatures of Cell Death and Proliferation in Perturbation Transcriptomics Data—From Confounding Factor to Effective Prediction. Nucleic Acids Res (2019) 47(19):10010–26. doi: 10.1093/nar/gkz805
43. Mitrofanova A, Mallela SK, Ducasa GM, Yoo TH, Rosenfeld-Gur E, Zelnik ID, et al. SMPDL3b Modulates Insulin Receptor Signaling in Diabetic Kidney Disease. Nat Commun (2019) 10(1):2692. doi: 10.1038/s41467-019-10584-4
44. Bjornstad P, Singh SK, Snell-Bergeon JK, Lovshin JA, Lytvyn Y, Lovblom LE, et al. The Relationships Between Markers of Tubular Injury and Intrarenal Haemodynamic Function in Adults With and Without Type 1 Diabetes: Results From the Canadian Study of Longevity in Type 1 Diabetes. Diabetes Obes Metab (2019) 21(3):575–83. doi: 10.1111/dom.13556
45. Hirao Y, Saito S, Fujinaka H, Miyazaki S, Xu B, Quadery AF, et al. Proteome Profiling of Diabetic Mellitus Patient Urine for Discovery of Biomarkers by Comprehensive MS-Based Proteomics. Proteomes (2018) 6(1):9. doi: 10.3390/proteomes6010009
46. Cheung CYY, Lee C-H, Tang CS, Xu A, Au K-W, Fong CHY, et al. Genetic Regulation of Pigment Epithelium-Derived Factor (PEDF): An Exome-Chip Association Analysis in Chinese Subjects With Type 2 Diabetes. Diabetes (2019) 68(1):198–206. doi: 10.2337/db18-0500
47. Caridi G, Trivelli A, Sanna-Cherchi S, Perfumo F, Ghiggeri GM. Familial Forms of Nephrotic Syndrome. Pediatr Nephrol (Berlin Germany) (2010) 25(2):241–52. doi: 10.1007/s00467-008-1051-3
Keywords: diabetic nephropathy, gene ontology, prognosis, biomarkers, differential gene expressions, diabetic kidney disease
Citation: Gao Z, S A, Li X-m, Li X-l and Sui L-n (2021) Identification of Key Candidate Genes and Chemical Perturbagens in Diabetic Kidney Disease Using Integrated Bioinformatics Analysis. Front. Endocrinol. 12:721202. doi: 10.3389/fendo.2021.721202
Received: 06 June 2021; Accepted: 18 August 2021;
Published: 07 September 2021.
Edited by:
Animesh Acharjee, University of Birmingham, United KingdomReviewed by:
Prasoon Agarwal, Royal Institute of Technology, SwedenCarel Le Roux, University College Dublin, Ireland
Copyright © 2021 Gao, S, Li, Li and Sui. This is an open-access article distributed under the terms of the Creative Commons Attribution License (CC BY). The use, distribution or reproduction in other forums is permitted, provided the original author(s) and the copyright owner(s) are credited and that the original publication in this journal is cited, in accordance with accepted academic practice. No use, distribution or reproduction is permitted which does not comply with these terms.
*Correspondence: Zhuo Gao, Z2Fvemh1bzA1MTNAc2luYS5jb20=