 Xiao-cong Liu
 Yu Huang
 Kenneth Lo
- Department of Cardiology, Guangdong Cardiovascular Institute, Guangdong Provincial People’s Hospital, Guangdong Academy of Medical Sciences, Guangzhou, China
Objective: Measuring the body mass index (BMI) or waist circumference (WC) alone is insufficient for assessing possible health risks due to obesity. This study aimed to investigate whether the quotient of WC and BMI can be used as a proxy of the high-risk phenotype of obesity.
Methods: Data for analysis were derived from the National Health and Nutrition Examination Survey (NHANES 1999-2014). The Waist-BMI Ratio was defined as WC divided by BMI. The associations between Waist-BMI Ratio and mortality were estimated using Cox regression models. Restricted cubic spline and two-piecewise linear regression models were used to identify non-linear relationships. The discriminative abilities of different anthropometric measures were compared using receiver operating characteristic curves (ROC).
Results: This study is based on data from 35557 adults (51.1% female, mean age 44.9 years). During an average follow-up of 101.8 months, 3680 participants died, including 807 of cardiovascular causes. In fully adjusted models, Waist-BMI Ratio was independently associated with overall (hazard ratio [HR], 1.78; 95% confidence interval [CI], 1.48-2.13) and cardiovascular (HR, 1.77; 95% CI, 1.25-2.52) mortality. Spline analyses revealed that dose-response relationships existed between Waist-BMI Ratio and death. The mortality risk rises dramatically above the cut-off point of the Waist-BMI Ratio (HR, 3.22; 95% CI, 2.43-4.26 for overall mortality and HR, 3.07; 95% CI, 1.71-5.52 for cardiovascular mortality). ROC curve analysis suggested that Waist-BMI Ratio was a better discriminator of mortality (AUC 0.637 for overall and 0.639 for cardiovascular mortality) than BMI, WC, and waist-to-height ratio (Delong’s test all P <0.001).
Conclusions: Waist-BMI Ratio was independently associated with overall and cardiovascular mortality in a J-shaped pattern, offering an immense potential risk marker for obesity in the clinical setting.
Introduction
Obesity has been recognized as one of the three gravest threats to human health and survival (1). It is responsible for 40% of cases of cardiovascular disease, most cases of type 2 diabetes, and more than 10% of gastrointestinal as well as urogenital cancer (2). Although increasing attention is being given to the problem, the prevalence of overweight and obesity has doubled since 1980 around the world and has shown a continuous increase in most countries (3). To reverse this growth and reduce the healthcare burden, accurate assessments of obesity are essential in order to identify high-risk individuals and thus implement appropriate behavior modifications and early therapeutic intervention.
Although multiple methods have been developed to assess obesity, each method has its own strengths and weaknesses. Imaging-based methods, such as dual x-ray absorptiometry and magnetic resonance imaging, can offer precise assessments and body fat quantifications (4). However, these technologically complex methods are too expensive and time-consuming for regular screening. The body mass index (BMI) is a simple anthropometric measure that has been routinely used to identify overweight individuals and estimate body fat (5). Nevertheless, BMI fails to describe body fat distribution and distinguish lean mass from fat mass, which has sparked the controversy related to “obesity paradox” (6–8). Prior studies have demonstrated that visceral adipose tissue (VAT) has an adverse impact on the cardiovascular and metabolic systems (4, 9), while certain types of peripheral fat could actually be metabolically, immunologically, and mechanically protective, and act as a cushion for potential health shocks (10, 11). Waist circumference (WC) and waist-to-height ratio (WtHR) are more accurate anthropometric measures of VAT but there are limitations with the use of either measure alone (12, 13).
Integration of BMI with WC/WtHR in clinical assessment has been recommended, as it may be able to discriminate the higher-risk phenotype of obesity (14, 15); it has been generally implemented by BMI stratification or introducing both variables into regression models. Studies have revealed that WC is positively correlated with mortality after adjustment for BMI, and patients with higher WtHR and lower BMI are at the highest risk of developing cardiovascular events (16–18). However, no study has yet focused on whether the quotient of WC and BMI (Waist-BMI Ratio) can be used to distinguish the high-risk phenotype of obesity. In this study, we evaluated the relationship of the Waist-BMI Ratio with cause-specific mortality and compared its predictive capacity with traditional anthropometric measures, including BMI, WC, and WtHR.
Materials and Methods
Study Design and Participants
The study population was drawn from the National Health and Nutrition Examination Survey (NHANES). The NHANES is a national, cross-sectional, multistage, probability sampling survey used to provide representative samples of the non-institutionalized US resident population (19). The survey protocols were approved by the ethics review board of the National Center for Health Statistics, and informed consent was obtained from all participants. Our analysis involved all participants who were ≥ 18 years old from NHANES 1999-2000 to NHANES 2013-2014. After excluding those with missing data and with cancer at baseline, the final study size comprised 35557 individuals (Figure 1).

Figure 1 Study cohort.
Anthropometric Measurements
Height, weight, and waist circumference were measured by trained personnel following a standard protocol (19). Waist circumferences were measured at the uppermost lateral border of the right ilium to the nearest 1 millimeter. BMI was calculated as weight in kilograms divided by height in meters squared. Waist-to-height ratio was calculated as waist circumference in centimeters divided by height in centimeters. Waist-BMI Ratio was defined as waist circumference in centimeters divided by BMI:
Outcomes
Mortality status for NHANES participants was ascertained through probabilistic record matching with the National Death Index (20). The primary outcome of this study was overall mortality and the secondary outcome was cardiovascular mortality, assessed via underlying causes of death with International Classification of Diseases, 10th Revision (ICD-10) codes I00–I09, I11, I13, I20–I51, and I60–I69 (21).
Covariates
Demographic information including age, gender, and race/ethnicity (categorized as non-Hispanic white, non-Hispanic black, other Hispanic, Mexican American, and other) was collected by standard questionnaires. Past medical history, prescription medication use, and smoking status were self-reported. Blood pressure was measured by trained personnel. Lipid profile data were derived from laboratory measurements. The estimated glomerular filtration rate (eGFR) was calculated using the Modification of Diet in Renal Disease formula (22). Cardiovascular disease (CVD) was defined as self-reported coronary artery disease, angina, heart attack, or stroke. Diabetes was defined as a self-reported history of diabetes, diabetes medication use, fasting blood glucose level of at least 7.0 mmol/L, or a hemoglobin A1c (HbA1c) level of at least 6.5% (23). Hypertension was defined as a self-reported history of hypertension, receiving blood pressure control medication, systolic blood pressure of at least 140 mmHg, or diastolic blood pressure of at least 90 mmHg (24).
Statistical Analysis
To account for the complex survey design of NHANES, appropriate sampling weights were used to reconstitute data on the US non-institutionalized population. Participants were divided into quintile groups by the Waist-BMI Ratio. The mean or percentage, with standard error (SE), was provided by quintile groups. The linear trend for baseline characteristics was tested by linear or logistic regression whenever appropriate. Kaplan-Meier survival analyses were performed to evaluate the incidence rate of mortality among Waist-BMI Ratio groups, and discrepancies among groups were evaluated by log-rank test. Three sets of Cox proportional hazard models were constructed to evaluate associations with mortality from the date of medical examination to the date of either death or censoring (December 31, 2015), whichever came first. Tests for linear trends were also performed, by entering the mean value of each quintile group of Waist-BMI Ratio as a continuous variable. Restricted cubic regression splines were employed to examine the associations of different anthropometric measures with mortality. We used a two-piecewise linear regression model to evaluate the nonlinear relationships between Waist-BMI Ratio and mortality, and the optimal cut-off points were set by testing all possible values and selecting the cut-off values with the highest likelihood. The difference between one-line linear regression models and two-piecewise linear regression models was assessed by means of logarithmic likelihood ratio tests. To compare the effects of different anthropometric measures, we used the receiver operating characteristic (ROC) curve and the area under the ROC curve (AUC) to identify the ability of baseline BMI, WC, WtHR, and Waist-BMI Ratio to predict mortality events. The statistical significance of the differences in AUC was calculated with Delong’s test. All analyses were conducted in R version 4.0.3 (R Foundation for Statistical Computing), including the rms, survey, pROC, and survminer packages. Two-sided P < 0.05 was regarded as a significant difference.
Results
Baseline Characteristics
Data were analyzed for 35557 adults from the continuous NHANES survey (1999–2014); 51.1% were females, and the mean age was 44.9 years. Baseline characteristics stratified by Waist-BMI Ratio are presented in Table 1. Briefly, during the average follow-up period of 101.8 months, 3680 deaths were recorded and 807 of them were attributed to cardiovascular disease. The ranges of Waist-BMI Ratio were: Q1: 1.80-3.20; Q2: 3.20-3.39; Q3: 3.39-3.56; Q4:3.56-3.75; Q5: 3.75-5.56. Individuals in the upper Waist-BMI Ratio quintiles tended to be older, male, and have higher rates of smoking and CVD. High density lipoprotein (HDL) cholesterol levels and mortality risk tended to be higher with the increase of Waist-BMI Ratio while eGFR and WtHR were decreased with increasing Waist-BMI Ratio quintiles (all P for trend < 0.001).

Table 1 Baseline characteristics according to Waist-BMI Ratio quintiles.
The Association of Waist-BMI Ratio and Other Anthropometric Measures With Overall and Cardiovascular Mortality
As shown in Table 2, the crude incidence rate per 1000 person-years of overall and cardiovascular mortality rose dramatically with increasing Waist-BMI Ratio categories. Kaplan-Meier curves for mortality showed significant differences among the Waist-BMI Ratio quintile groups (Figure 2, both log-rank P < 0.001). After adjustment for all covariables, including age, gender, race, smoking, systolic blood pressure, HDL-cholesterol, total cholesterol, eGFR, hypertension, diabetes, CVD, antihypertensive drugs, hypoglycemic agents, lipid-lowering drugs, and antiplatelet drugs, Waist-BMI Ratio was positively associated with overall (hazard ratio [HR], 1.78; 95% confidence interval [CI], 1.48-2.13; P < 0.001) and cardiovascular (HR, 1.77; 95% CI, 1.25-2.52; P = 0.001) mortality as a continuous linear variable. When using the lowest Waist-BMI Ratio quintile (Q1) as the reference, significant association with overall death can be seen for the upper quintile (HR, 1.40; 95% CI, 1.17-1.67; P < 0.001). However, the relationship between the highest Waist-BMI Ratio quintile (Q5) and cardiovascular death was not significant (HR, 1.34; 95% CI, 0.95-1.88; P = 0.094).
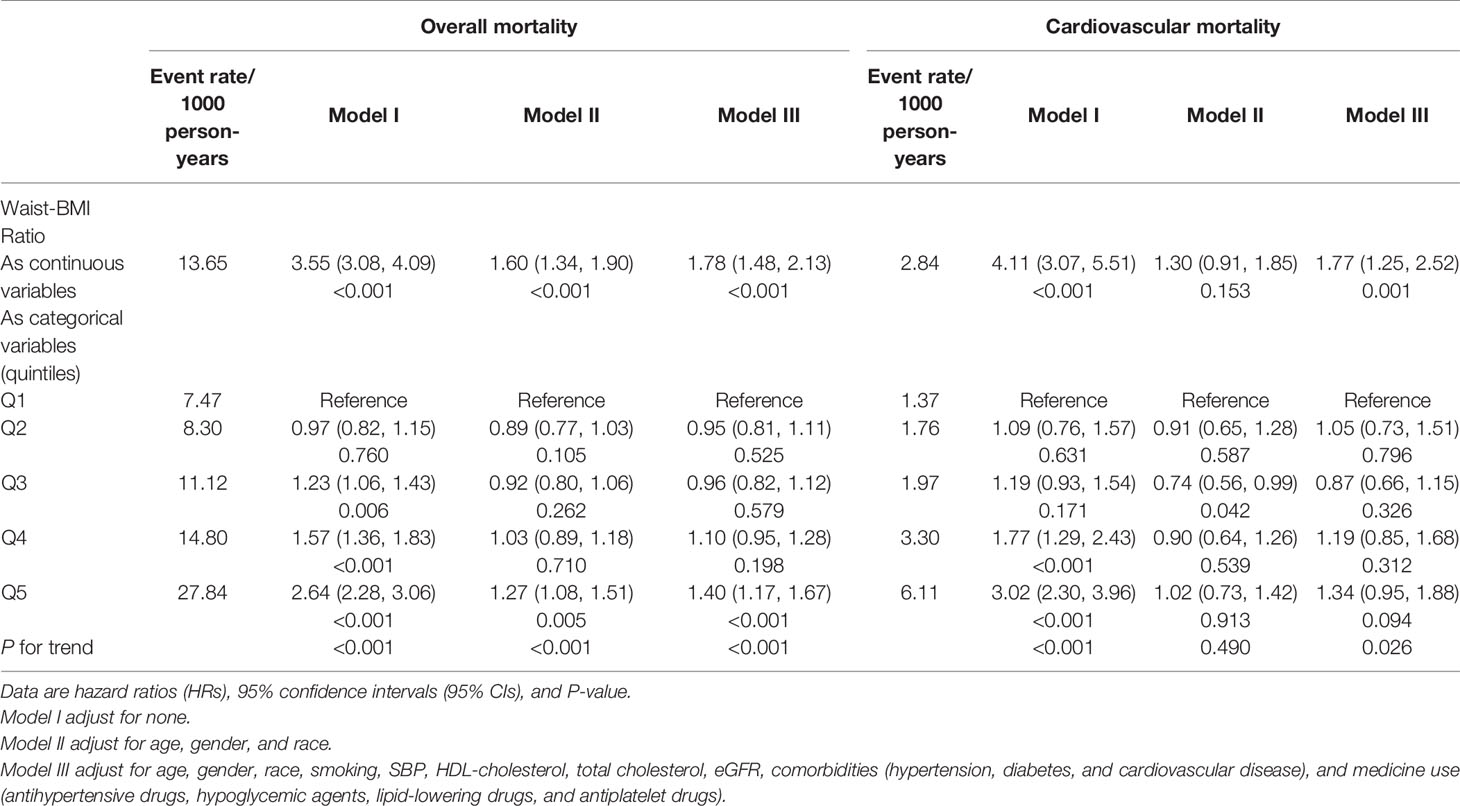
Table 2 Multivariate Cox regression analysis of Waist-BMI Ratio with cause-specific mortality.
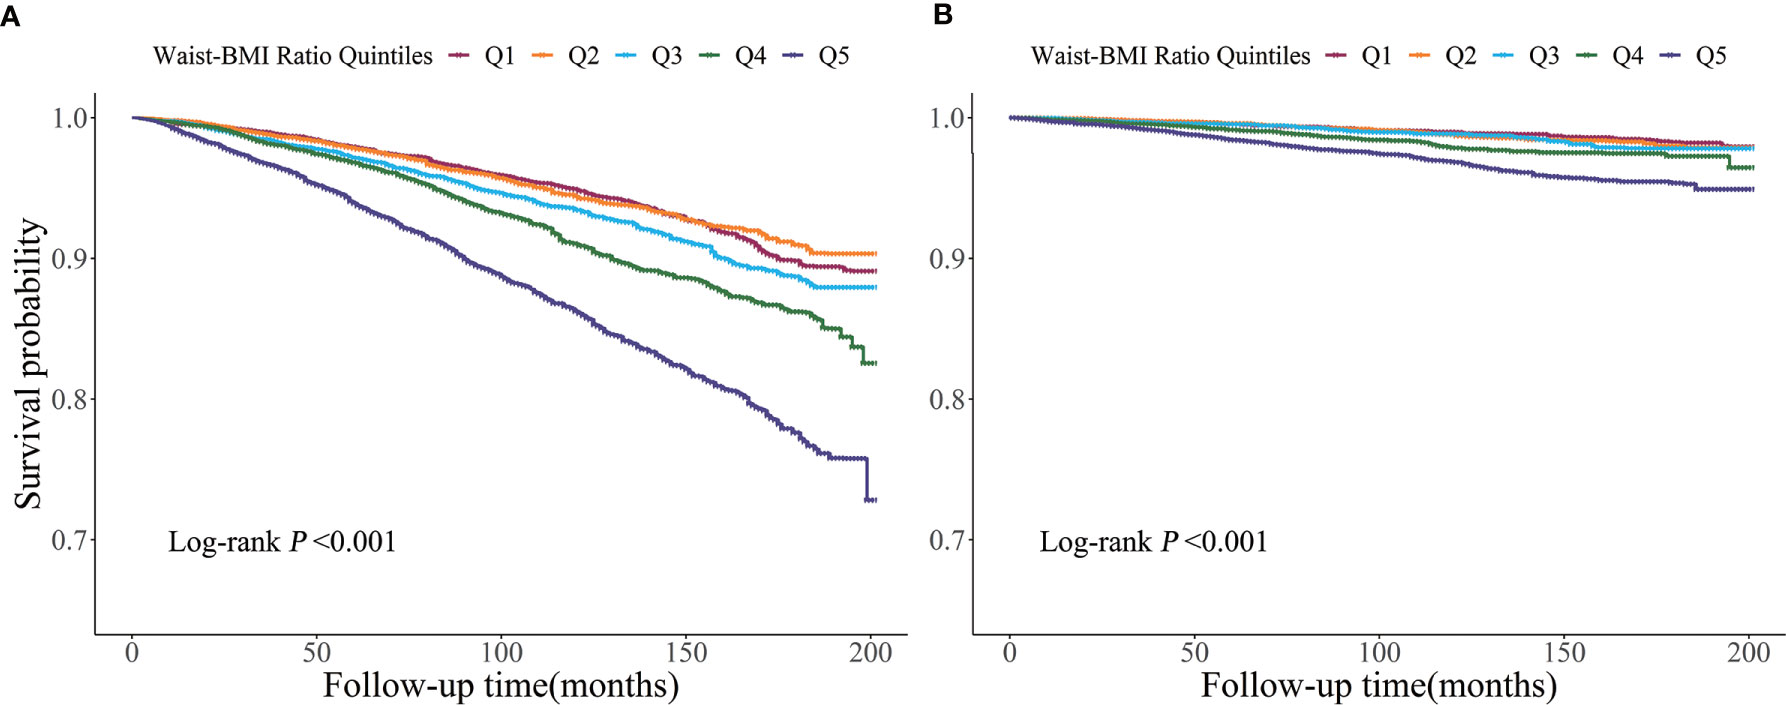
Figure 2 Kaplan-Meier survival curve for overall (A) and cardiovascular (B) mortality by Waist-BMI Ratio quintiles.
Restricted cubic splines (Figure 3) demonstrated a J-shaped relationship of Waist-BMI Ratio with overall (non-linear P < 0.001) and cardiovascular mortality (non-linear P =0.017), while other anthropometric measures, including BMI, WC, and WtHR, showed asymmetrical U-shaped relationships with mortality (all non-linear P < 0.001). Significant differences were detected between the linear regression models and the two-piecewise regression models (log-likelihood ratio test P<0.001 for overall mortality and P=0.008 for cardiovascular mortality). The cut-off points were estimated by piecewise regression models to be at a Waist-BMI Ratio of 3.72 for overall mortality and 3.66 for cardiovascular mortality (Table 3). Above the cut-off points, the risk of overall and cardiovascular death rose steeply with the increase of Waist-BMI Ratio (HR, 3.22; 95% CI, 2.43-4.26; P < 0.001 and HR, 3.07; 95% CI, 1.71-5.52; P < 0.001, respectively). Nonetheless, no significant association was found below the cut-off points (HR, 1.16; 95% CI, 0.93-1.44; P = 0.188 and HR,1.00; 95% CI, 0.58-1.73; P = 0.999, respectively).

Figure 3 Spline analyses of overall (A, C, E, G) and cardiovascular (B, D, F, H) mortality by Waist-BMI Ratio (A, B), body mass index (C, D), waist circumference (E, F), and Waist-Height Ratio (G, H) and the probability distribution histogram is represented in the background. (Spline analyses were adjusted for age, gender, race, smoking, SBP, HDL-cholesterol, total cholesterol, eGFR, hypertension, diabetes, and cardiovascular disease, antihypertensive drugs, hypoglycemic agents, lipid-lowering drugs, and antiplatelet drugs).
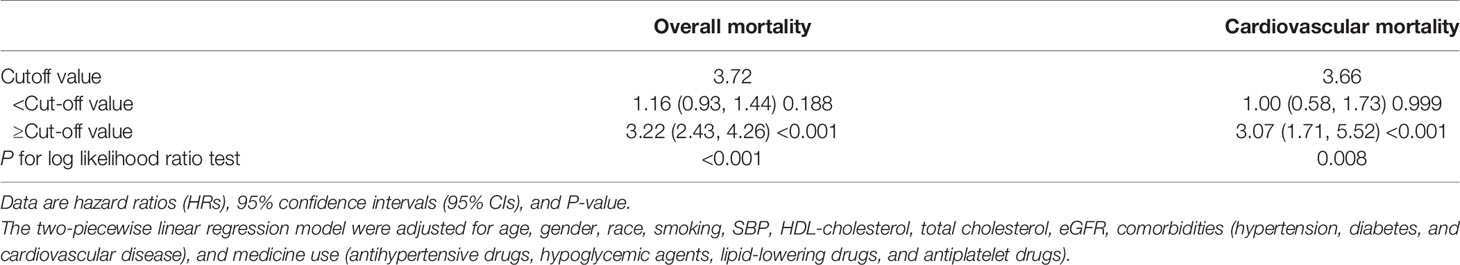
Table 3 The results of two-piecewise linear regression model between Waist-BMI Ratio and cause-specific mortality.
The Predictive Value of Waist-BMI Ratio and Other Anthropometric Measures in Overall and Cardiovascular Mortality
The ROC curve analysis comparing the predictive ability of different anthropometric measures demonstrated that Waist-BMI Ratio was the strongest predictor of overall mortality (AUC, 0.637; 95% CI, 0.627-0.647). As shown in Figure 4, the AUC of BMI, WC, and WtHR for predicting overall mortality were 0.523 (95% CI, 0.513-0.533), 0.552 (95% CI, 0.543-0.562), and 0.572 (95% CI, 0.562-0.581), respectively. Similar results were observed for cardiovascular death. When compared with other indexes, Waist-BMI Ratio showed significantly better performance (AUC, 0.643; 95% CI, 0.623-0.663) than BMI (AUC, 0.516; 95% CI, 0.496-0.535), WC (AUC, 0.566; 95% CI, 0.547-0.585), and WtHR (AUC, 0.582; 95% CI, 0.564-0.601) in predicting cardiovascular death (all P for difference in AUC < 0.001). The optimal value of the Waist-BMI Ratio was 3.60 for predicting overall mortality, with a sensitivity of 53.8% and a specificity of 67.4%; as the optimal value was 3.64 for predicting cardiovascular mortality, with a sensitivity of 53.4% and specificity of 69.6%.
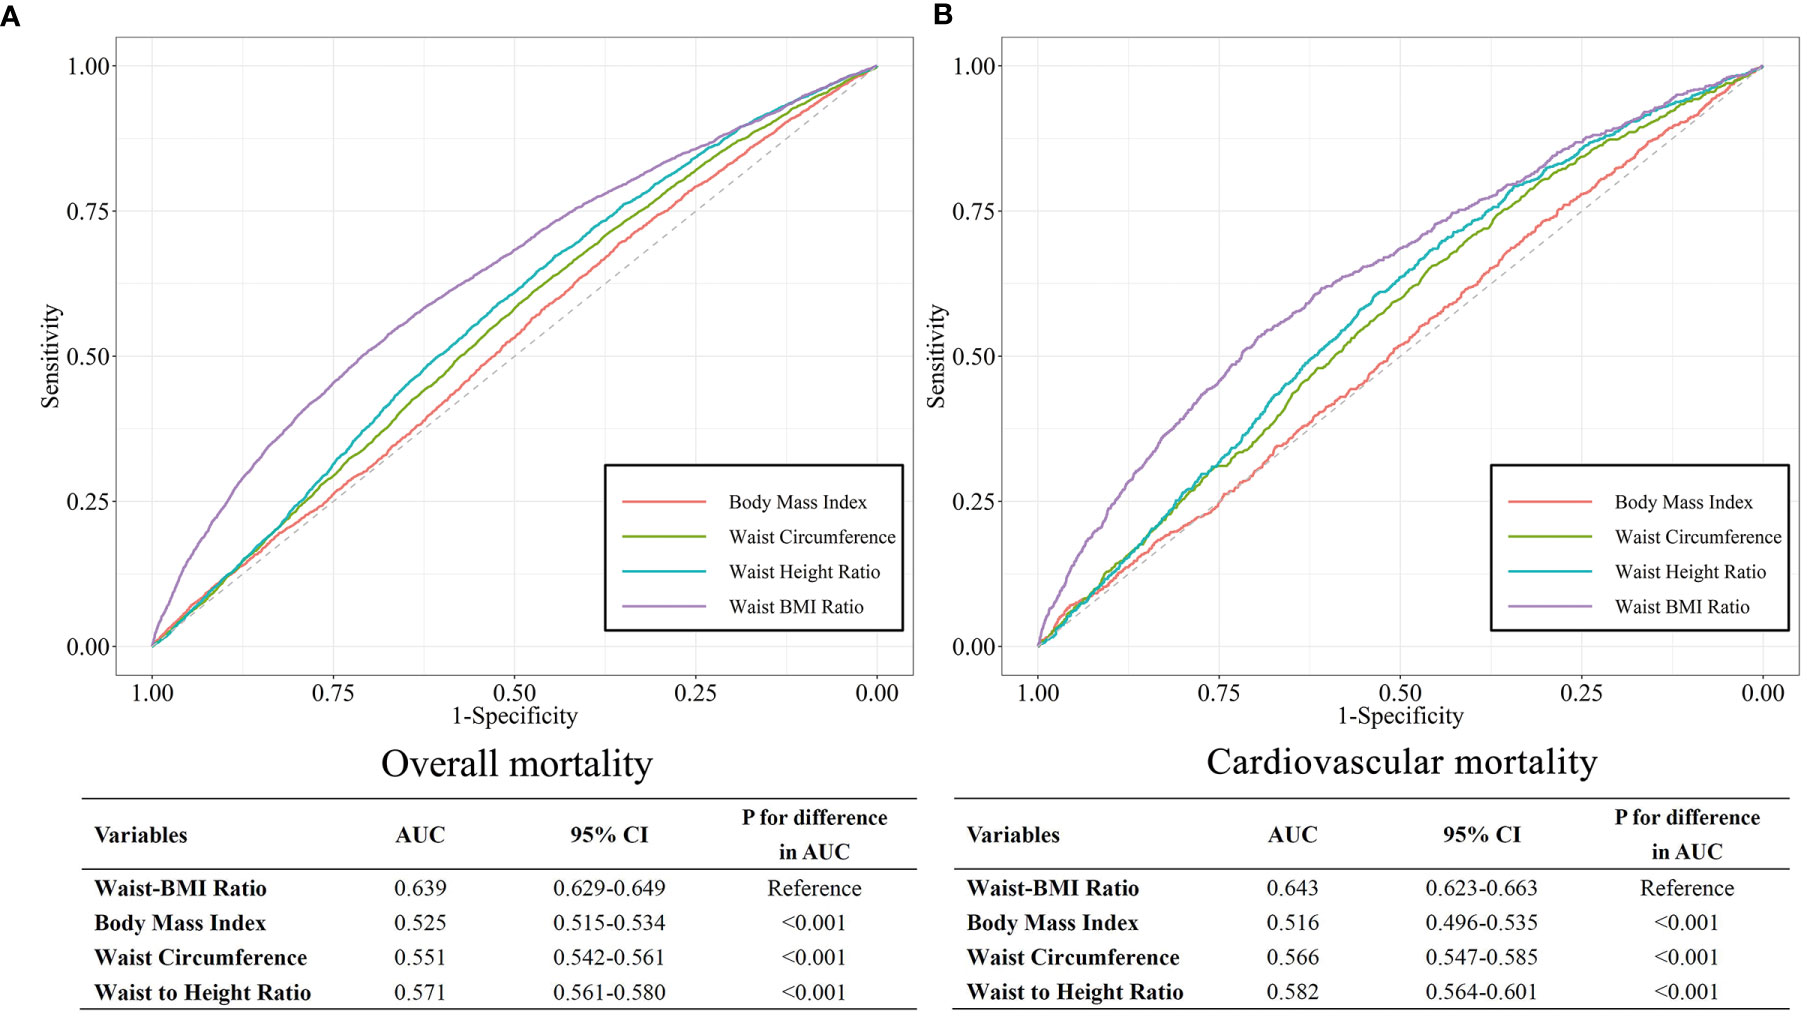
Figure 4 ROC curves for Body mass index, Waist circumference, Waist to Height Ratio, and Waist-BMI Ratio for predicting overall (A) and cardiovascular (B) mortality.
Discussion
In this study, we retrospectively investigated the relationship between a newly defined anthropometric measure and mortality. The results demonstrated that the Waist-BMI Ratio was positively associated with overall and cardiovascular mortality in a J-shaped pattern. Compared with traditional obesity indices, the Waist-BMI Ratio can more adequately predict the risk of death and could be a valuable indicator of the higher-risk phenotype of obesity.
For decades, BMI has been used as an indicator of obesity and has been introduced into various predictive models as a cardiovascular risk factor (25–27). However, a proportion of people with normal BMI have a series of metabolic risk factors, and may be described as “metabolically with obesity but of normal weight” (28), while some individuals with obesity seem to be protected from or more resistant to the development of metabolic abnormalities, and are known as “metabolically healthy but with obesity” (29). One of the reasons may lie in the inability to describe visceral fat and ectopic fat deposition (8), because information from a single anthropometric measure cannot provide sufficient insights into body fat distribution (12). Adverse metabolic effects of excess body fat, including insulin resistance and dyslipidemia, are mainly linked to dysfunctional abdominal subcutaneous adipose tissue and visceral adipose tissue accumulation (9). Experimental models have shown that visceral adipose tissue produces potentially proinflammatory adipokines and macrophage signals, which may be involved in myocardial hypertrophy, fibrosis, and injury (30).
A meta-analysis has revealed that BMI fails to identify half of individuals with excess body fat (31). Chanchal et al. found that the joint use of BMI and WtHR could be conducive to recognizing patients with the highest risk of the composite outcomes (16). A Consensus Statement from the IAS and ICCR Working Group claimed that, although waist circumference is closely linked to overall and cardiovascular death, the full strength of these associations is revealed only after adjustment for BMI (12). However, as a statistical term, “adjustment” might not be easy to understand and use in clinical applications, which limits the combination of WC and BMI. Clinicians have been recommended to evaluate WC variation among patients with similar BMI values, whereas the current obesity-risk classification system still uses the same WC threshold values for all BMI categories (32, 33).
Consistent with previous studies, our present analysis illustrated that individuals in the upper Waist-BMI Ratio quantile, which corresponds to individuals with high WC but low BMI, had the highest risk of mortality. Moreover, patients with low absolute BMI and WC are prone to a higher risk of mortality (34, 35). Studies have indicated that underweight is correlated with undernutrition, inflammation, and other underlying wasting diseases that potentially explain the enhanced risk of death (11, 36, 37). Therefore, U-shape relationships and an “obesity paradox” have often been reported (6, 38). This flaw is circumvented by using Waist-BMI Ratio as an adiposity indicator and thus J-shape relationships were observed. Meanwhile, people of normal weight generally pay less attention to their health indices and do not take preventive measures against obesity-related diseases. Compared with costly and time-consuming imaging-based methods, anthropometric methods such as the Waist-BMI Ratio form a more convenient, comprehensible, and even home self-testing monitoring system for early identification of high-risk individuals and for disease prevention.
Our study had several notable advantages. First, the study was based on the NHANES dataset, a nationally representative survey with rigorous methodology and comprehensive quality control procedures; the large sample size was sufficient to provide good statistical power. Second, our analysis was adjusted for study weights and the complex survey design to reduce estimation errors. Third, the newly defined parameter was easily obtained and calculated, with a clear and unilateral risk threshold. Nevertheless, several limitations pertain to our study. First, we were unable to obtain accurate information about body composition. Therefore, we could not calculate the correlation coefficient between Waist-BMI Ratio and abdominal or visceral adipose tissue. Second, definitive causal inferences cannot be drawn because of the observational nature of this study. Third, although our analyses controlled for important confounding variables, the possibility of residual confounding variables remains. For example, we were unable to adjust for alcohol consumption and physical activity level due to missing covariate data. Fourth, death certificates may not precisely represent the real cause of death. Fifth, NHANES data are representative of the United States population, thus probably limiting the applicability of our results to other regions and ethnic populations.
Conclusion
As a newly defined anthropometric measure, Waist-BMI Ratio was independently associated with overall and cardiovascular mortality after mutual adjustment. Compared with other traditional anthropometric measures, Waist-BMI Ratio had a better predictive ability and a more certain risk threshold value for mortality. Because it is convenient, easy to access, and virtually free cost, Waist-BMI Ratio can be used as a valuable indicator for the high-risk phenotype of obesity.
Data Availability Statement
Publicly available datasets were analyzed in this study. This data can be found here: https://www.cdc.gov/nchs/nhanes/index.htm.
Ethics Statement
The studies involving human participants were reviewed and approved by the Institutional Review Board of the Centers for Disease Control and Prevention (Protocol 98–12, 2005–06 and 2011–17). The patients/participants provided their written informed consent to participate in this study.
Author Contributions
Conceptualization, XCL and YQH. Methodology, XCL. Validation, YQF, YQH and JYC. Formal Analysis, XCL. Investigation, KL. Resources, YQF. Data Curation, XCL. Writing — Original Draft Preparation, XCL. Writing – Review and Editing, YH. Visualization, XCL. Supervision, JYC. Project Administration, YQF. Funding Acquisition, YQF. All authors contributed to the article and approved the submitted version.
Funding
This research was funded by the National Key Research and Development Program of China (No. 2017YFC1307603), the Science and Technology Plan Program of Guangzhou (No. 201803040012), the Key Area R&D Program of Guangdong Province (No. 2019B020227005), Guangdong Provincial People’s Hospital Clinical Research Fund (Y012018085), the Fundamental and Applied Basic Research Foundation Project of Guangdong Province (2020A1515010738), and the Climbing Plan of Guangdong Provincial People’s Hospital (DFJH2020022).
Conflict of Interest
The authors declare that the research was conducted in the absence of any commercial or financial relationships that could be construed as a potential conflict of interest.
Acknowledgments
We are grateful to Dr. YS Liu for her invaluable advices that helped improve this article.
References
1. Swinburn BA, Kraak VI, Allender S, Atkins VJ, Baker PI, Bogard JR, et al. The Global Syndemic of Obesity, Undernutrition, and Climate Change: The Lancet Commission Report. Lancet (2019) 393:791–846. doi: 10.1016/s0140-6736(18)32822-8
2. Kumanyika S, Dietz WH. Solving Population-Wide Obesity - Progress and Future Prospects. N Engl J Med (2020) 383:2197–200. doi: 10.1056/NEJMp2029646
3. Collaborators TGO. Health Effects of Overweight and Obesity in 195 Countries Over 25 Years. N Engl J Med (2017) 377:13–27. doi: 10.1056/NEJMoa1614362
4. Neeland IJ, Poirier P, Despres JP. Cardiovascular and Metabolic Heterogeneity of Obesity: Clinical Challenges and Implications for Management. Circulation (2018) 137:1391–406. doi: 10.1161/circulationaha.117.029617
5. World Health Organization. Obesity. Available at: https://www.who.int/health-topics/obesity (Accessed January 15, 2021).
6. Antonopoulos AS, Oikonomou EK, Antoniades C, Tousoulis D. From the BMI Paradox to the Obesity Paradox: The Obesity-Mortality Association in Coronary Heart Disease. Obes Rev (2016) 17:989–1000. doi: 10.1111/obr.12440
7. Iliodromiti S, Celis-Morales CA, Lyall DM, Anderson J, Gray SR, Mackay DF, et al. The Impact of Confounding on the Associations of Different Adiposity Measures With the Incidence of Cardiovascular Disease: A Cohort Study of 296 535 Adults of White European Descent. Eur Heart J (2018) 39:1514–20. doi: 10.1093/eurheartj/ehy057
8. Elagizi A, Kachur S, Lavie CJ, Carbone S, Pandey A, Ortega FB, et al. An Overview and Update on Obesity and the Obesity Paradox in Cardiovascular Diseases. Prog Cardiovasc Dis (2018) 61:142–50. doi: 10.1016/j.pcad.2018.07.003
9. Piche ME, Poirier P, Lemieux I, Despres JP. Overview of Epidemiology and Contribution of Obesity and Body Fat Distribution to Cardiovascular Disease: An Update. Prog Cardiovasc Dis (2018) 61:103–13. doi: 10.1016/j.pcad.2018.06.004
10. Tchkonia T, Thomou T, Zhu Y, Karagiannides I, Pothoulakis C, Jensen Michael D, et al. Mechanisms and Metabolic Implications of Regional Differences Among Fat Depots. Cell Metab (2013) 17:644–56. doi: 10.1016/j.cmet.2013.03.008
11. Liu XC, Liu L, Yu YL, Huang JY, Chen CL, Lo K, et al. The Association of Subscapular Skinfold With All-Cause, Cardiovascular and Cerebrovascular Mortality. Risk Manag Healthc Policy (2020) 13:955–63. doi: 10.2147/rmhp.S262300
12. Ross R, Neeland IJ, Yamashita S, Shai I, Seidell J, Magni P, et al. Waist Circumference as a Vital Sign in Clinical Practice: A Consensus Statement From the IAS and ICCR Working Group on Visceral Obesity. Nat Rev Endocrinol (2020) 16:177–89. doi: 10.1038/s41574-019-0310-7
13. Khoury M, Manlhiot C, McCrindle BW. Role of the Waist/Height Ratio in the Cardiometabolic Risk Assessment of Children Classified by Body Mass Index. J Am Coll Cardiol (2013) 62:742–51. doi: 10.1016/j.jacc.2013.01.026
14. Wharton S, Lau DCW, Vallis M, Sharma AM, Biertho L, Campbell-Scherer D, et al. Obesity in Adults: A Clinical Practice Guideline. CMAJ (2020) 192:E875–E91. doi: 10.1503/cmaj.191707
15. Clinical Guidelines on the Identification, Evaluation, and Treatment of Overweight and Obesity in Adults–The Evidence Report. National Institutes of Health. Obes Res (1998) 6 Suppl 2:51s–209s. doi: 10.1002/j.1550-8528.1998.tb00690.x
16. Chandramouli C, Tay WT, Bamadhaj NS, Tromp J, Teng TK, Yap JJL, et al. Association of Obesity With Heart Failure Outcomes in 11 Asian Regions: A Cohort Study. PloS Med (2019) 16:e1002916. doi: 10.1371/journal.pmed.1002916
17. Janssen I, Katzmarzyk PT, Ross R. Body Mass Index Is Inversely Related to Mortality in Older People After Adjustment for Waist Circumference. J Am Geriatr Soc (2005) 53:2112–8. doi: 10.1111/j.1532-5415.2005.00505.x
18. Cerhan JR, Moore SC, Jacobs EJ, Kitahara CM, Rosenberg PS, Adami HO, et al. A Pooled Analysis of Waist Circumference and Mortality in 650,000 Adults. Mayo Clin Proc (2014) 89:335–45. doi: 10.1016/j.mayocp.2013.11.011
19. Centers for Disease Control and Prevention. Nhanes - National Health and Nutrition Examination Survey Homepage (2020). Available at: https://www.cdc.gov/nchs/nhanes/index.htm (Accessed March 15, 2020).
20. National Center for Health Statistics. The Linkage of National Center for Health Statistics Survey Data to the National Death Index—2015 Linked Mortality File (LMF): Methodology Overview and Analytic Considerations. Centers for Disease Control and Prevention (2019) Geneva,Switzerland:World Health Organization. Available at: https://www.cdc.gov/nchs/data/datalinkage/LMF2015_Methodology_Analytic_Considerations.pdf (Accessed March 15, 2020).
21. Liu X-C, He G-D, Lo K, Huang Y-Q, Feng Y-Q. The Triglyceride-Glucose Index, An Insulin Resistance Marker, Was Non-Linear Associated With All-Cause and Cardiovascular Mortality in the General Population. Front Cardiovasc Med (2021) 7:628109. doi: 10.3389/fcvm.2020.628109
22. Inker LA, Schmid CH, Tighiouart H, Eckfeldt JH, Feldman HI, Greene T, et al. Estimating Glomerular Filtration Rate From Serum Creatinine and Cystatin C. N Engl J Med (2012) 367:20–9. doi: 10.1056/NEJMoa1114248
23. Chamberlain JJ, Johnson EL, Leal S, Rhinehart AS, Shubrook JH, Peterson L. Cardiovascular Disease and Risk Management: Review of the American Diabetes Association Standards of Medical Care in Diabetes 2018. Ann Intern Med (2018) 168:640–50. doi: 10.7326/m18-0222
24. Chobanian AV, Bakris GL, Black HR, Cushman WC, Green LA, Izzo JL Jr, et al. The Seventh Report of the Joint National Committee on Prevention, Detection, Evaluation, and Treatment of High Blood Pressure: The JNC 7 Report. JAMA (2003) 289:2560–72. doi: 10.1001/jama.289.19.2560
25. Wu Y, Liu X, Li X, Li Y, Zhao L, Chen Z, et al. Estimation of 10-Year Risk of Fatal and Nonfatal Ischemic Cardiovascular Diseases in Chinese Adults. Circulation (2006) 114:2217–25. doi: 10.1161/CIRCULATIONAHA.105.607499
26. Hajifathalian K, Ueda P, Lu Y, Woodward M, Ahmadvand A, Aguilar-Salinas CA, et al. A Novel Risk Score to Predict Cardiovascular Disease Risk in National Populations (Globorisk): A Pooled Analysis of Prospective Cohorts and Health Examination Surveys. Lancet Diabetes Endocrinol (2015) 3:339–55. doi: 10.1016/s2213-8587(15)00081-9
27. Hippisley-Cox J, Coupland C, Brindle P. Development and Validation of QRISK3 Risk Prediction Algorithms to Estimate Future Risk of Cardiovascular Disease: Prospective Cohort Study. BMJ (2017) 357:j2099. doi: 10.1136/bmj.j2099
28. Hinnouho GM, Czernichow S, Dugravot A, Nabi H, Brunner EJ, Kivimaki M, et al. Metabolically Healthy Obesity and the Risk of Cardiovascular Disease and Type 2 Diabetes: The Whitehall II Cohort Study. Eur Heart J (2015) 36:551–9. doi: 10.1093/eurheartj/ehu123
29. Primeau V, Coderre L, Karelis AD, Brochu M, Lavoie ME, Messier V, et al. Characterizing the Profile of Obese Patients Who Are Metabolically Healthy. Int J Obes (Lond) (2011) 35:971–81. doi: 10.1038/ijo.2010.216
30. Murase T, Hattori T, Ohtake M, Abe M, Amakusa Y, Takatsu M, et al. Cardiac Remodeling and Diastolic Dysfunction in DahlS.Z-Lepr(fa)/Lepr(fa) Rats: A New Animal Model of Metabolic Syndrome. Hypertens Res (2012) 35:186–93. doi: 10.1038/hr.2011.157
31. Okorodudu DO, Jumean MF, Montori VM, Romero-Corral A, Somers VK, Erwin PJ, et al. Diagnostic Performance of Body Mass Index to Identify Obesity as Defined by Body Adiposity: A Systematic Review and Meta-Analysis. Int J Obes (Lond) (2010) 34:791–9. doi: 10.1038/ijo.2010.5
32. Despres JP. Excess Visceral Adipose Tissue/Ectopic Fat the Missing Link in the Obesity Paradox? J Am Coll Cardiol (2011) 57:1887–9. doi: 10.1016/j.jacc.2010.10.063
33. World Health Organisation. Obesity: Preventing and Managing the Global Epidemic: Report of a WHO Consultation (World Health Organisation Technical Report Series 894). Geneva, Switzerland: WHO (2000).
34. Bhaskaran K, dos-Santos-Silva I, Leon DA, Douglas IJ, Smeeth L. Association of BMI With Overall and Cause-Specific Mortality: A Population-Based Cohort Study of 3·6 Million Adults in the UK. Lancet Diabetes Endocrinol (2018) 6:944–53. doi: 10.1016/s2213-8587(18)30288-2
35. Chen Y, Yang Y, Jiang H, Liang X, Wang Y, Lu W. Associations of BMI and Waist Circumference With All-Cause Mortality: A 22-Year Cohort Study. Obesity (Silver Spring) (2019) 27:662–9. doi: 10.1002/oby.22423
36. Wirth R, Streicher M, Smoliner C, Kolb C, Hiesmayr M, Thiem U, et al. The Impact of Weight Loss and Low BMI on Mortality of Nursing Home Residents - Results From the Nutrition Day in Nursing Homes. Clin Nutr (2016) 35:900–6. doi: 10.1016/j.clnu.2015.06.003
37. Nakajima K, Yamaoka H, Morita K, Ebata M, Eguchi S, Muneyuki T, et al. Elderly People With Low Body Weight May Have Subtle Low-Grade Inflammation. Obesity (Silver Spring) (2009) 17:803–8. doi: 10.1038/oby.2008.596
Keywords: body mass index, waist circumference, waist-BMI ratio, obesity, mortality
Citation: Liu XC, Huang Y, Lo K, Huang YQ, Chen JY and Feng YQ (2021) Quotient of Waist Circumference and Body Mass Index: A Valuable Indicator for the High-Risk Phenotype of Obesity. Front. Endocrinol. 12:697437. doi: 10.3389/fendo.2021.697437
Received: 19 April 2021; Accepted: 10 May 2021;
Published: 31 May 2021.
Edited by:
Mostafa Qorbani, Alborz University of Medical Sciences, IranReviewed by:
Hoda Zahedi, Tehran University of Medical Sciences, IranMahdi Shadnoush, Shahid Beheshti University of Medical Sciences, Iran
Copyright © 2021 Liu, Huang, Lo, Huang, Chen and Feng. This is an open-access article distributed under the terms of the Creative Commons Attribution License (CC BY). The use, distribution or reproduction in other forums is permitted, provided the original author(s) and the copyright owner(s) are credited and that the original publication in this journal is cited, in accordance with accepted academic practice. No use, distribution or reproduction is permitted which does not comply with these terms.
*Correspondence: Ying-qing Feng, ZnlxMTgxOUAxNjMuY29t