 Qiongyue Zhang1,2*†‡
 Qing Miao1†
 Yehong Yang1†
 Jiaying Lu3Huiwei Zhang3Yonghao Feng1
 Wei Wu1Xiaoming Zhu1
 Boni Xiang1
 Quanya Sun1
 Yihui Guan3Yiming Li1*
 Chuantao Zuo3*‡Hongying Ye1*‡
- 1Division of Endocrinology and Metabolism, Department of Internal Medicine, Huashan Hospital, Shanghai Medical College, Fudan University, Shanghai, China
- 2Shanghai Key Laboratory of Metabolic Remodeling and Health, Institute of Metabolism & Integrative Biology, Fudan University, Shanghai, China
- 3Positron Emission Tomography (PET) Center, Huashan Hospital, Shanghai Medical College, Fudan University, Shanghai, China
Introduction: Brown adipose tissue (BAT) becomes the favorite target for preventing and treating metabolic diseases because the activated BAT can produce heat and consume energy. The brain, especially the hypothalamus, which secretes Neuropeptide Y (NPY), is speculated to regulate BAT activity. However, whether NPY is involved in BAT activity’s central regulation in humans remains unclear. Thus, it’s essential to explore the relationship between brain glucose metabolism and human BAT activity.
Methods: A controlled study with a large sample of healthy adults used Positron emission tomography/computed tomography (PET/CT) to noninvasively investigate BAT’s activity and brain glucose metabolism in vivo. Eighty healthy adults with activated BAT according to the PET/CT scan volunteered to be the BAT positive group, while 80 healthy adults without activated BAT but with the same gender, similar age, and BMI, scanning on the same day, were recruited as the control (BAT negative). We use Statistical parametric mapping (SPM) to analyze the brain image data, Picture Archiving & Communication System (PACS), and PET/CT Viewer software to calculate the semi-quantitative values of brain glucose metabolism and BAT activity. ELISA tested the levels of fasting plasma NPY. The multiple linear regression models were used to analyze the correlation between brain glucose metabolism, the level of NPY, and the BAT activity in the BAT positive group.
Results: (1) Compared with controls, BAT positive group showed significant metabolic decreases mainly in the right Insula (BA13a, BA13b) and the right claustrum (uncorrected P <0.01, adjusted BMI). (2) The three brain regions’ semi-quantitative values in the BAT positive group were significantly lower than the negative group (all P values < 0.05). (3) After adjusting for age, gender, BMI, and outside temperature, there was a negative correlation between brain metabolic values and BAT activity (all P values < 0.05). However, after further adjusting for NPY level, there were no significant differences between the BA13b metabolic values and BAT activity (P>0.05), while the correlation between the BA13a metabolic values and BAT activity still was significant (P< 0.05).
Conclusions: Regional brain glucose metabolism is closely related to healthy adults’ BAT activity, which may be mediated by NPY.
Introduction
Brown adipose tissue (BAT) has been well recognized as a significant thermogenic tissue to maintain the body temperature in rodents and newborn humans because of its high expression of uncoupling protein 1 (UCP1) (1). Besides, recent studies have proved that BAT can be activated and also present in adults, which are detected by 18F-fluorodeoxyglucose (18F-FDG) positron emission tomography/computed tomography (PET/CT) (2, 3). Stimulating BAT activity is expected to be a new approach to treat obesity and other metabolic diseases (4, 5), but the precise regulatory mechanism of BAT activity is still unclear.
The central nervous system (CNS) is the core of regulating energy metabolism, which may be related to heat generation and energy consumption of BAT (6), especially the hypothalamus, which is involved in the regulation of BAT activity (7). The hypothalamus is the center of feeding behavior, body temperature regulation, and metabolism control (8). As the region of information integration in the brain, the insular cortex (Insula) regulates temperature, pain, appetite, and energy metabolism, which has a fibrous connection with the hypothalamus (9). The claustrum is a small region subcortical structure and contiguous the insula. Mammal species studies have shown that there are networks between the insula and claustrum, which may influence many aspects of the brain’s function together (10, 11).
Previous invasive methods of studying the structure and function of CNS do not apply to the human body. Emerging molecular functional imaging technology PET/CT is mainly used to diagnose and evaluate tumors, infectious diseases (12), and central nervous system diseases (13), such as lung cancer (14), lymphoma (15), etc. al. Since detection of 18F-FDG uptake is the gold standard for reflecting BAT activity, PET/CT imaging has become the most common platform for investigating the human BAT (16). Studies have shown that PET/CT can not only detect the activity of adult BAT (17), but also evaluate the glucose metabolism in specific brain regions (18) and can noninvasively semi-quantitative analyze the brain structure and function. So far, most PET/CT studies focused on oncology patients (19) or with a small sample (20). In several retrospective studies, the prevalence of activated BAT ranged from 1.3% to 6.7%, while our previous retrospective study found that there were 410 of the 31088 subjects (1.32%) identified by PET/CT scanning as activated BAT (21). In our cross-sectional study, the BAT positive rate was 1.77%(105/5945). Moreover, adults with activated BAT were younger, had lower BMI, higher insulin sensitivity, and better lipid profiles than those without activated BAT positive (22).
In view of many factors, such as disease status, age, gender, temperature, and environment, may affect brain metabolism and BAT activity. Therefore, we adopted the 18F-FDG PET/CT imaging technology and the Statistical Parametric Mapping (SPM) software, enlarged the sample size, and recruited healthy adults who came to the PET center for the purpose of physical examination in order to precisely explore the relationship between the brain glucose metabolism and healthy adult BAT activity. In addition, this controlled study not only analyzed the relationship between brain glucose metabolism and BAT activity but also verified whether the Neuropeptide Y(NPY), which was secreted by the hypothalamus, was involved in brain glucose metabolism to regulate BAT’s activity. To provide clues and basis for revealing the mechanism of central regulation of BAT activity.
Materials and Methods
Subjects and Workflow
About six thousands of individuals underwent a whole-body imaging scan using 18F-FDG PET/CT in the PET Center of Huashan Hospital Affiliated with Fudan University from September 2009 to March 2011. Eighty healthy adults with activated BAT detected by PET/CT scan were recruited as the BAT positive group after reviewing the medical history, physical examination, and tested fasting blood sample. Each BAT positive subject was matched to a healthy adult without activated BAT detected by PET/CT scan on the same day, with the same gender and similar age ( ± 5 years). Furthermore, in the BAT positive group, there were 15 subjects who volunteered to stay at thermoneutrality (28°C, two hours, in the climate chamber) and then re-examined PET/CT scan to confirm that BAT was undetected within two weeks, and took a fasting blood test for the level of NPY. All subjects were healthy Chinese adults (aged between 20-50 with BMI < 30), and had no history of diabetes, hypertension, heart disease, severe infection, chronic liver or kidney disease, or cancers, and did not take any regular medications (especially adrenergic receptor blockers, antidepressants, or psychiatric drugs, et al.). Pregnant women and subjects with implantable medical electronic devices should be excluded. The workflow of the study is shown in Figure 1. The Ethics Committee approved the study design of Huashan Hospital at Fudan University. All of the subjects volunteered for scientific research and signed informed consent. The trial was already registered at Clinical Trials.gov (NCT01387438).
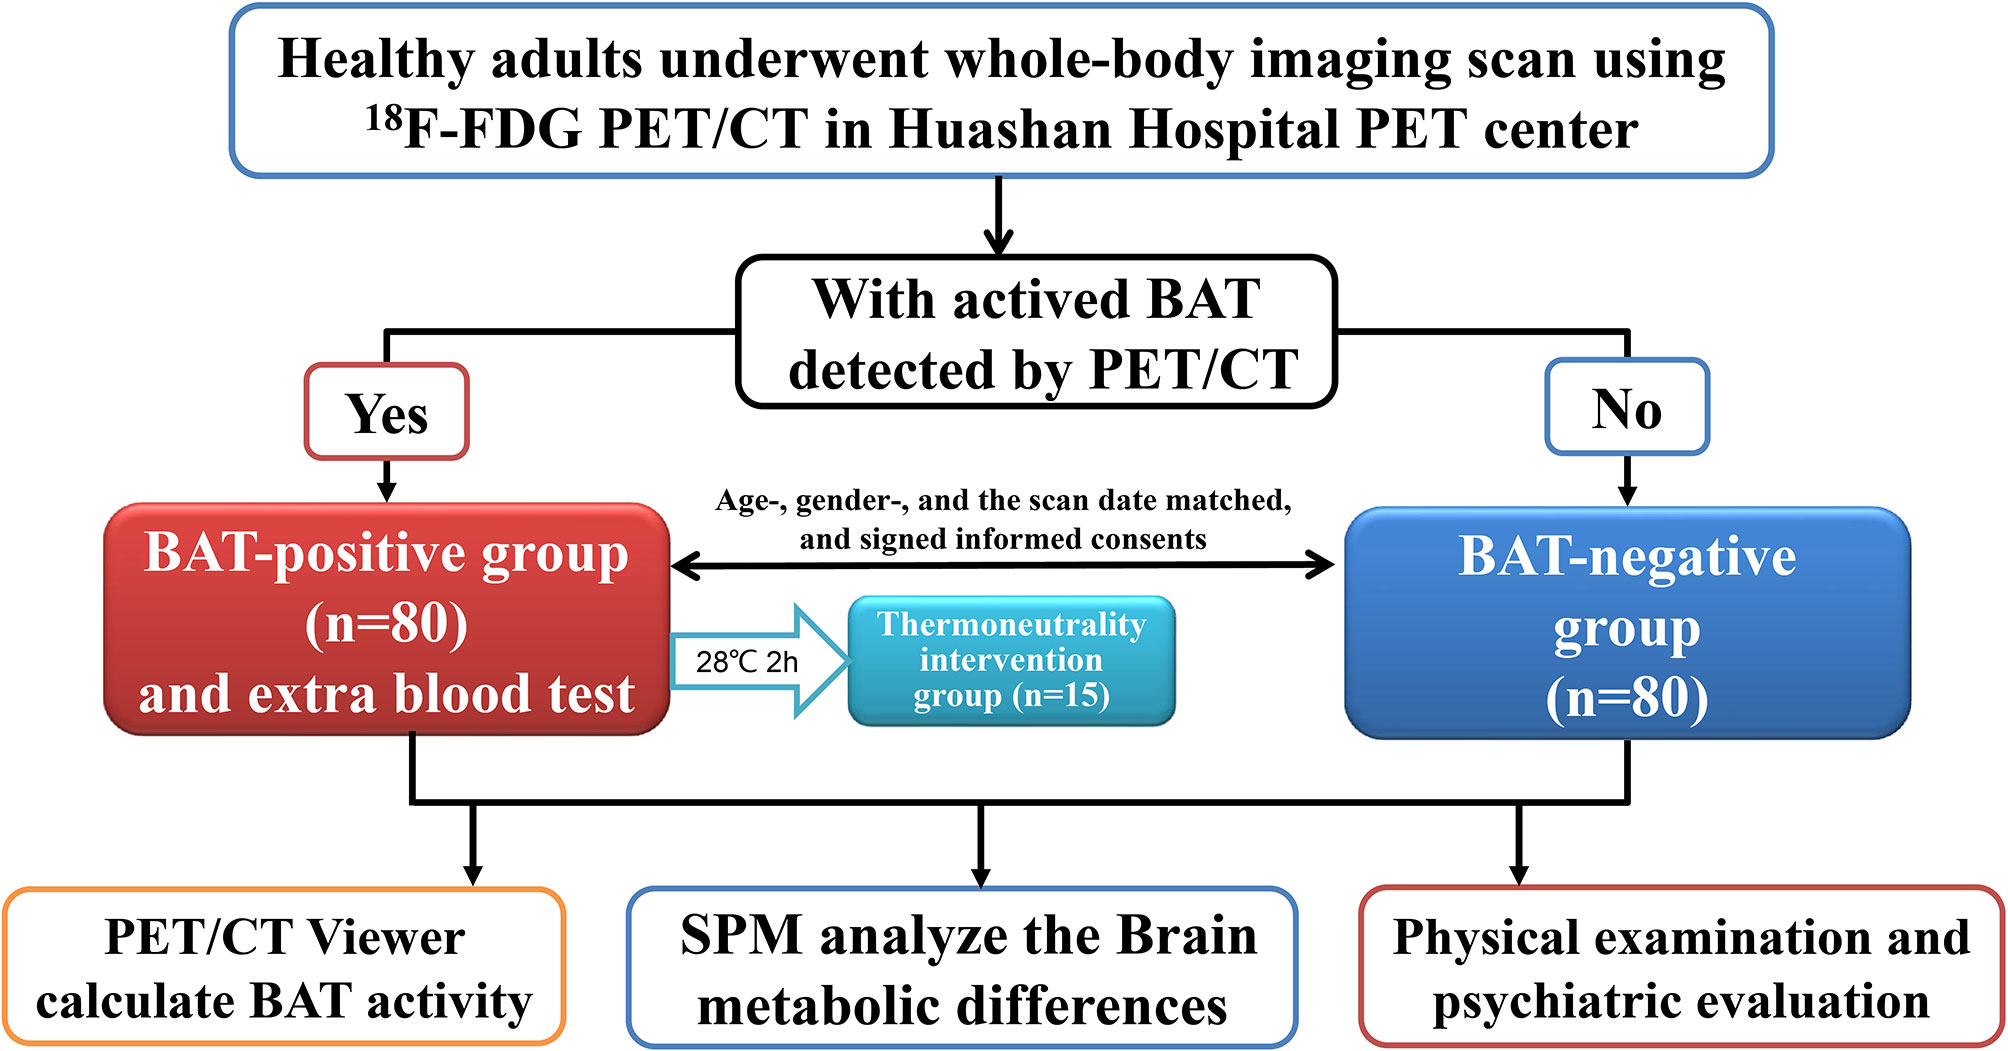
Figure 1 Subjects and Workflow. Flowchart of the PET/CT study: This research is a cross-sectional control study with a large sample. Subjects were divided into two groups according to 18F-FDG uptake of BAT detected by PET-CT. Eighty healthy adults with activated BAT detected by PET/CT scan were recruited as the BAT positive group, while each BAT positive subject was matched to a healthy adult without activated BAT detected by PET/CT scan on the same day, with the same gender, and similar age ( ± 5 years), who became the BAT negative control group. There were 15 BAT positive subjects who volunteered to stay in thermoneutrality(28°C, two hours), repeat the PET/CT scan, and take a blood test for the NPY level. Every subject performed the whole-body PET/CT scan, the physical examination, and the blood test.
Medical Assessment and Blood Sample Collection
Demographics and clinical data, including age, gender, body mass index (BMI), medical history, medication utilization, diagnosis, and daily average outdoor temperature, were obtained from all subjects (shown in Table 1). The blood samples were drawn in the fasting and resting state, and the fast blood glucose (FBG) levels were measured using an automatic biochemical analyzer (Hitachi 7600, Japan) before the PET/CT scan. The concentrations of NPY in the BAT positive group were determined by enzyme-linked immunosorbent assay (Raybiotech, American) after the PET/CT scan. The other medical assessment, such as the heart rate, systolic blood pressure (SBP), diastolic blood pressure (DBP), was performed on the two groups.
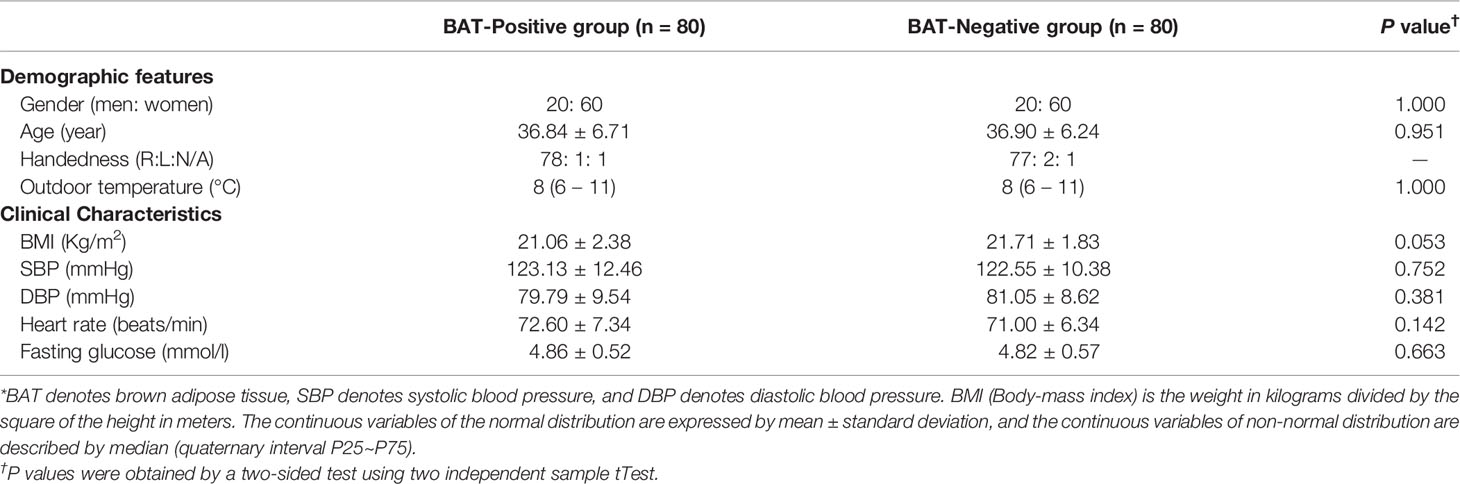
Table 1 Characteristics of the subjects with activated BAT (BAT Positive) and without 18F-FDG BAT uptake (BAT Negative)*.
PET/CT Scan and Imaging Processing
All subjects fasted for at least 8 hours before performing the whole-body PET/CT scan (PET/CT Biograph 64, SIEMENS) at room temperature, which was maintained at 21~23°C. According to the PET/CT scanning protocol, the PET tracer (18F-FDG) was administered intravenously with a dose of 5.55-7.40MBq/kg. Then the subjects rested for 45 minutes until imaging began. After a CT transmission scan for attenuation correction, PET scans were acquired and reconstructed with the three-dimensional (3D) reprojection method. Commonly, transmission and emission modes are used alternately to scan brain images. The peak voltage was 120kV, the electric current was 300mA, the scanning time for each bed is 1.5 minutes, and the collection time is at least 10 minutes. The body’s emission scan was 2 minutes per bed position, and five to six bed positions per subject were needed to cover the BAT areas. Brain PET images were reconstructed by - the ordered subset expectation maximization method and Hanning filtering with matrix 168×168×148 and pixel 2.04mm×2.04mm×1.5mm, giving a transaxial and axial cut-off frequency of 0.5. The Leonardo workstation of Siemens fused the images. Both PET and CT images were reconstructed in transaxial, coronal, and sagittal images with a slice thickness of 3 mm. BAT positive was defined, and BAT activity was calculated according to the standard of Cypess et al. (23): 1) the CT value was adipose tissue (-250 to -50 Hounsfield units), 2) the diameter of the area is greater than 4mm, 3) the maximum of 18F-FDG Standardized uptake value (SUVmax) of BAT exceeds 2.0g/ml. All studies in patients and healthy subjects were performed in a resting state in a quiet and dimly lit room.
Statistical Analysis
Image Data Preprocess
SPM8 software was used to analyze the locations of brain regions with different metabolic between the BAT positive and negative groups, and also to measure the glucose metabolism of different brain regions and the semi-quantitative value of BAT’s activity. Firstly, PET scans were spatially normalized to Montreal Neurological Institute (MNI) space, by using the default PET template in SPM8 software (Wellcome Department of Imaging Neuroscience, Institute of Neurology, London, UK, Version 8) applied in MATLAB 8.4.0 (Mathworks Inc, Sherborn, MA). Then, in order to increase the signal-to-noise ratio for statistical analysis, the normalized PET scans were smoothed by a Gaussian filter of 10 mm full width at half maximum over a 3D space. Voxel-wise analysis was performed to detect regional differences in mean glucose metabolism between two groups by SPM8 software. A two-sample t-test according to the general linear model at each voxel and the mean signal differences over the whole brain were removed by analysis of covariance in each individual subject. And BMI was included as the covariate. The threshold was set as P<0.01 (uncorrected) over whole brain regions with an extent threshold was empirically chosen to be more than two times of the expected voxels per cluster estimated in the SPM run. Significant regions were localized by Talairach-Daemon software (Research Imaging Center, University of Texas Health Science Center, San Antonio, TX, USA). The SPM map for altered glucose metabolism was overlaid on a standard T1-weighted MRI brain template in stereotaxic space. Next, a spherical volume of interest (VOI), four mm in radius within the image space, centered at the peak voxel of clusters significant in SPM analysis, were constructed to quantify metabolic changes in specific regions (Figure 2). We subsequently calculated the individual values of each region as a relative measure of regional cerebral metabolism [VOI value/whole-brain value] using ScAnVP freely available (http://www.feinstein-neuroscience.org at Center for Neuroscience, the Feinstein Institute for Medical Research, Manhasset, NY) in MATLAB.
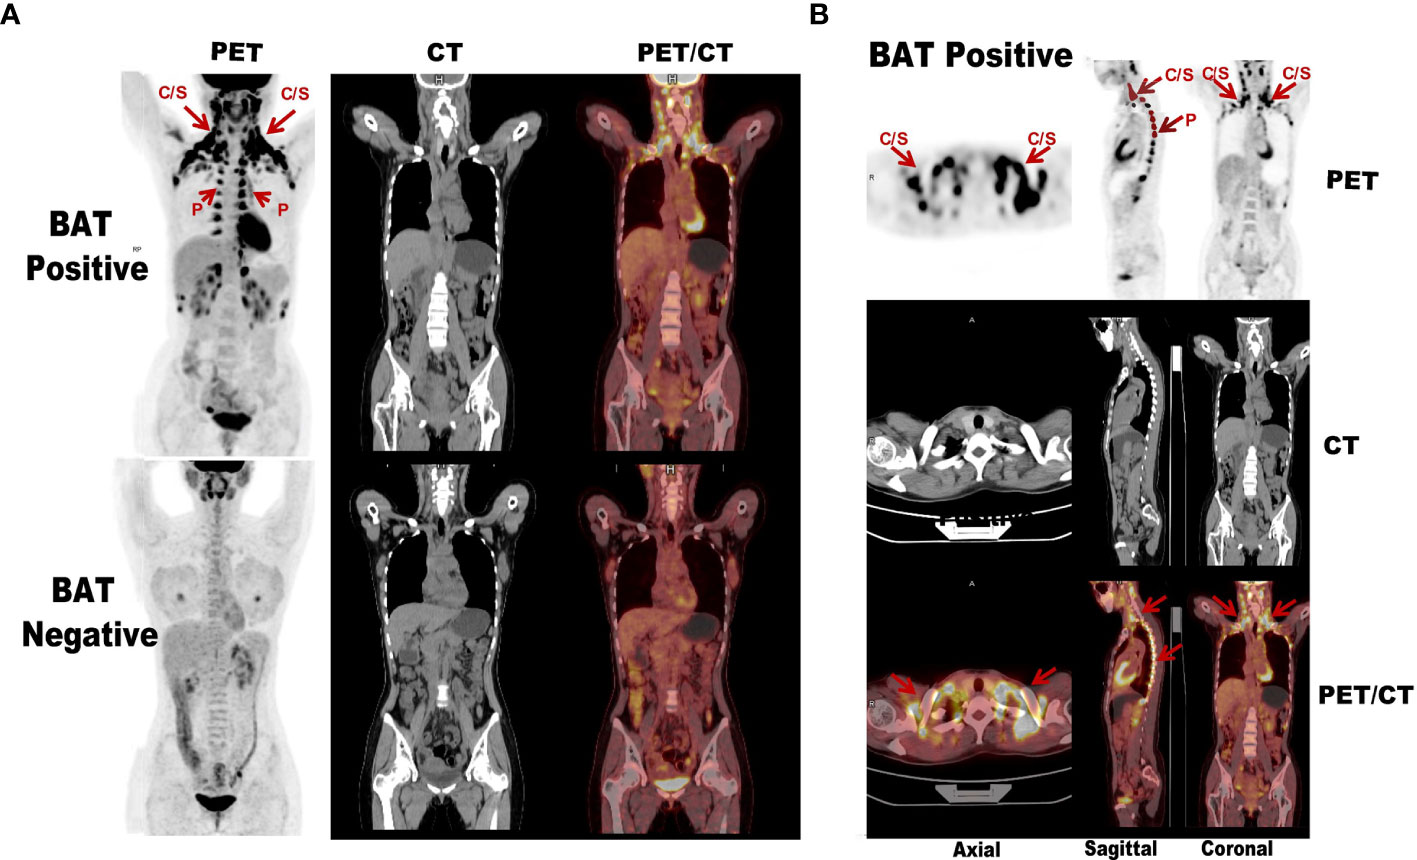
Figure 2 Comparison diagram of subjects with and without activated BAT assessed by 18F-FDG PET/CT. (A) The above images shows extended BAT uptake of 18F-FDG in cervical, supraclavicular, axillary, and paravertebral regions in healthy adult. The below images The below image of the other subject with the same gender, similar age and BMI in whom PET/CT was performed in the same day shows no BAT uptake of 18F-FDG in the same regions. (B) The subject with activated BAT mainly located in the central axis areas such as the cervical-supraclavicular and paravertebral on the PET maximum intensity projection. “C/S” means cervical/supraclavicular and “P” denotes paravertebral (red arrows).
Clinical Data Analysis
SPSS software (Spss Inc., Chicago, IL, USA, version 20.0) was used to analyze the differences in clinical data and semi-quantitative values of brain regions between the BAT positive and negative groups. The Kolmogorov-Smimov test was performed first. Continuous variables of the normal distribution were described by Means ± standard deviation (SD), and Student’s t-test was used to compare the differences between the two groups. Data that are not normally distributed are represented as medians (interquartile intervals), and logarithmic conversion is performed before further analysis. Multiple linear regression models were used to analyze the correlation between the semi-quantitative value of brain region and BAT activity and to adjust for possible confounding factors such as age, BMI, gender, outdoor temperature, and the plasma NPY level. All P values were two-tailed, and the values less than 0.05 are considered to be statistically significant.
Results
Baseline and Characteristics
A total of 80 healthy subjects with detected BAT by PET-CT scan were enrolled into the BAT-positive group, and 80 subjects with well-matched gender (P=1.000), outdoor temperature (P=1.000), and age (P=0.951) and handedness (P=1.000) without detected BAT by PET-CT scan were served as the BAT negative control group. Clinical characteristics between the two groups, such as BMI (21.06 ± 2.38 vs. 21.71 ± 1.83, P = 0.053), SBP(P = 0.752), DBP (P = 0.381), heart rate (P = 0.234), and FBG (P = 0.663) were not statistically different (Table 1).
Differences in Brain Glucose Metabolism Between the BAT Positive Group and the BAT Negative Group
The voxel-wise analysis found that there were differences in three brain regions between the BAT positive group and the BAT negative group (Figure 3, and Table 2). As shown in Figure 4, compared with the BAT negative control group, the local glucose metabolic activities of the right Insula (BA13a, Z =3.08), the right Insula (BA13b, Z =3.05), and the right claustrum (Z =3.16) in the BAT positive group were lower (uncorrected P<0.01, threshold K≥321.6 voxels, adjusting for BMI) (Table 2). Then, the semi-quantitative values of glucose metabolism in the three different brain regions were further calculated and analyzed as continuous variables, shown in Table 3. Compared with BAT negative controls, the BAT positive subjects’ semi-quantitative metabolic activities of brain regions in the right Insula(BA13a, BA13b) and right claustrum were significantly decreased (Figure 4 and Table 3).
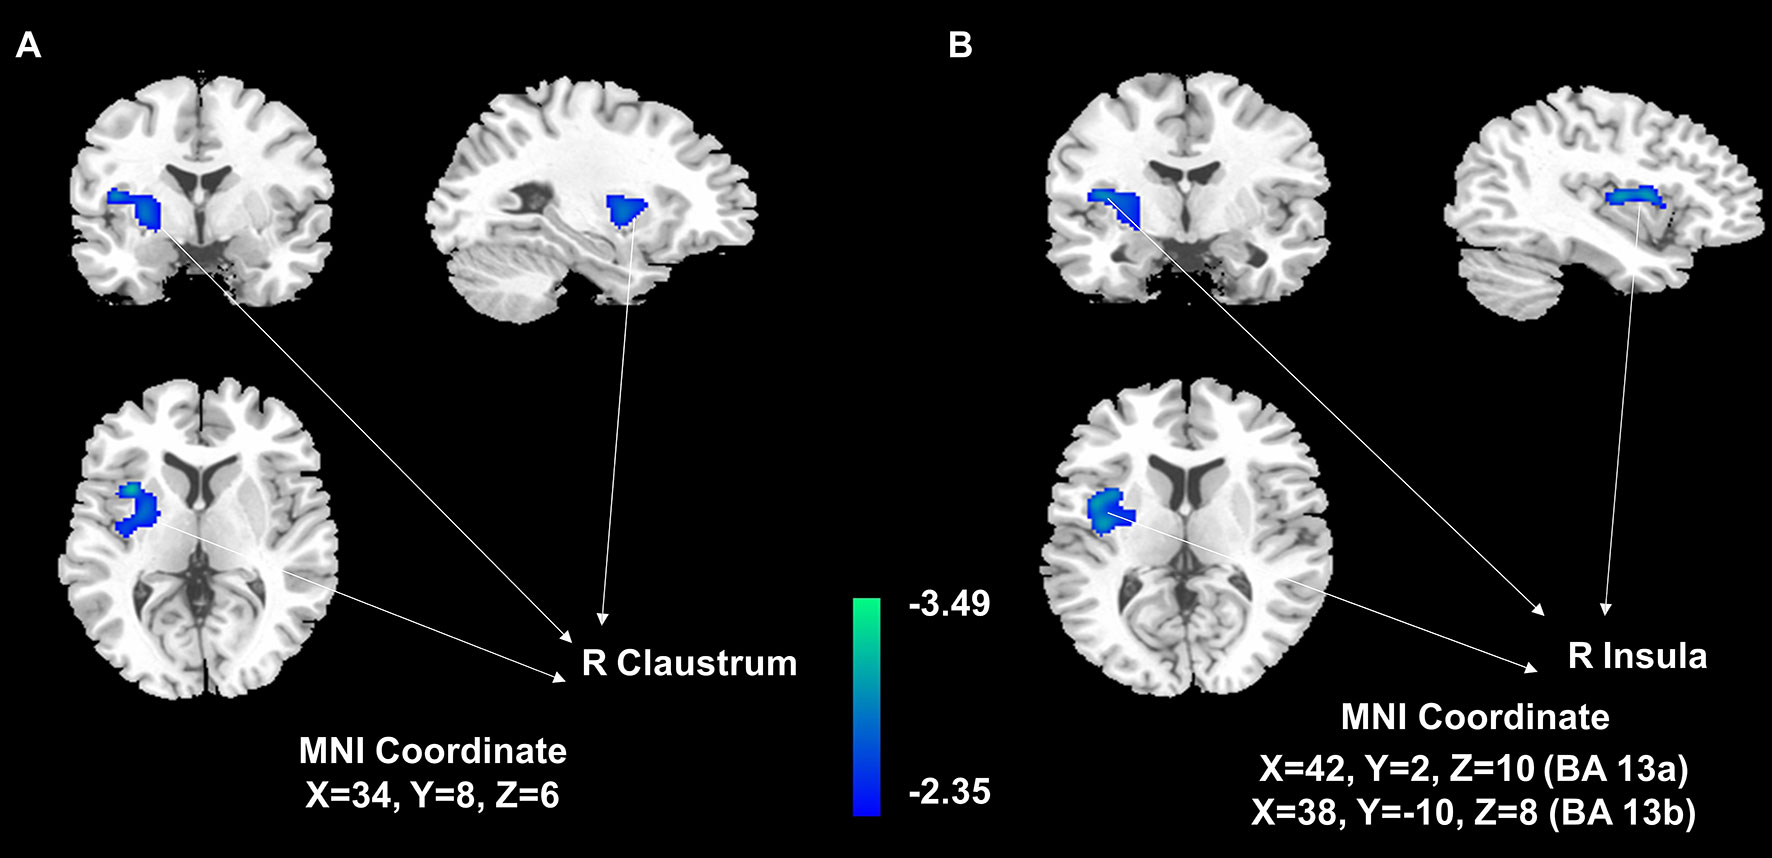
Figure 3 Areas of significant differences of glucose metabolism in subjects with activated BAT, compared with controls. Statistical Parametric Mapping (SPM) results: It is displayed on a T1 template overlaid with magnetic resonance images at the threshold of uncorrected P<0. 01, threshold K>321.6, and the gray-scale figures are a T1 structural MRI that are representative of MNI space. The blue areas represent relatively hypometabolic regions of decreased 18F-FDG uptake in the right claustrum (A) and right Insula (B) in BAT-positive subjects than in negative control subjects.
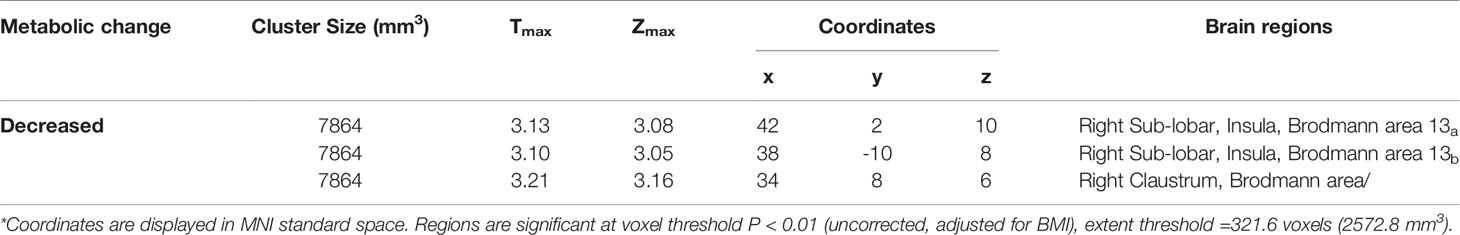
Table 2 Areas of significant differences of glucose metabolism in subjects with activated BAT (BAT-positive group), compared with controls (BAT-negative group)*.
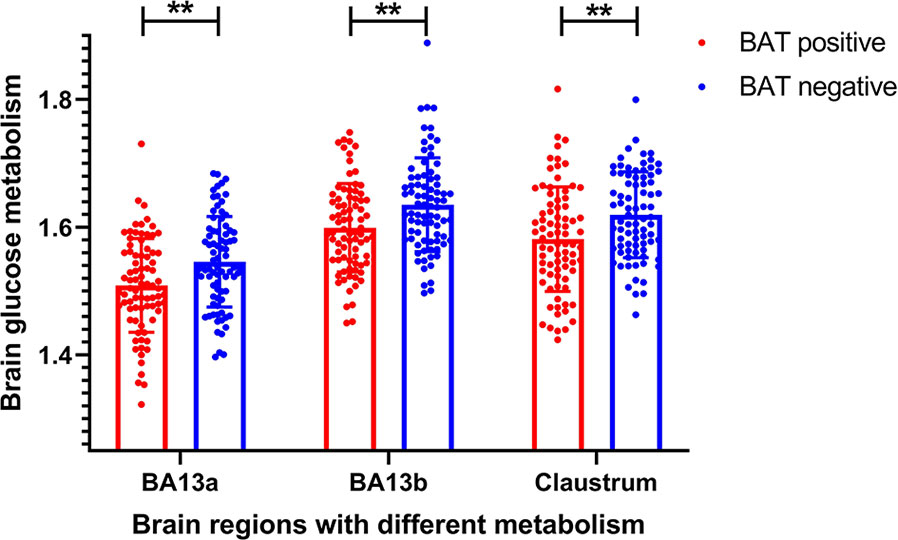
Figure 4 Differences of semi-quantitative metabolic values of brain regions between BAT positive group and BAT negative group. The semi-quantitative metabolic values of three brain region in BAT positive group were significantly lower than these in BAT negative group (BA13a P = 0.001; BA13b P = 0.002; Right claustrum P = 0.002). BA denotes the Brodmann area. P values are based on Independent-Samples tTest. ** denotes P value < 0.01.
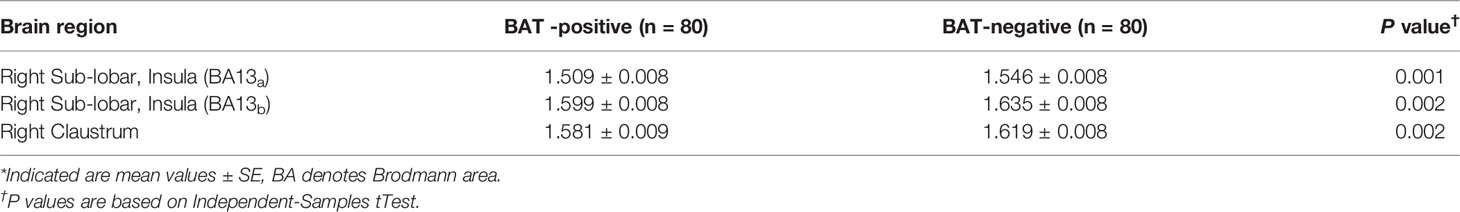
Table 3 The semi-quantitative values of brain regions with significant metabolic differences between BAT positive group and BAT negative group*.
Correlation Analysis of Brain Glucose Metabolism and BAT Activity
As shown in Figure 5, there was a negative correlation between the BAT activity and the average outdoor temperature on the examination day in the BAT positive group (r = -0.366, P = 0.001). And more importantly, the semi-quantitative values of the three different brain regions were both negatively correlated with BAT Activity in the BAT positive group (BA13a r = -0.293, P = 0.008; BA13b r = -0.374, P = 0.001; right claustrum r = -0.279, P = 0.012).
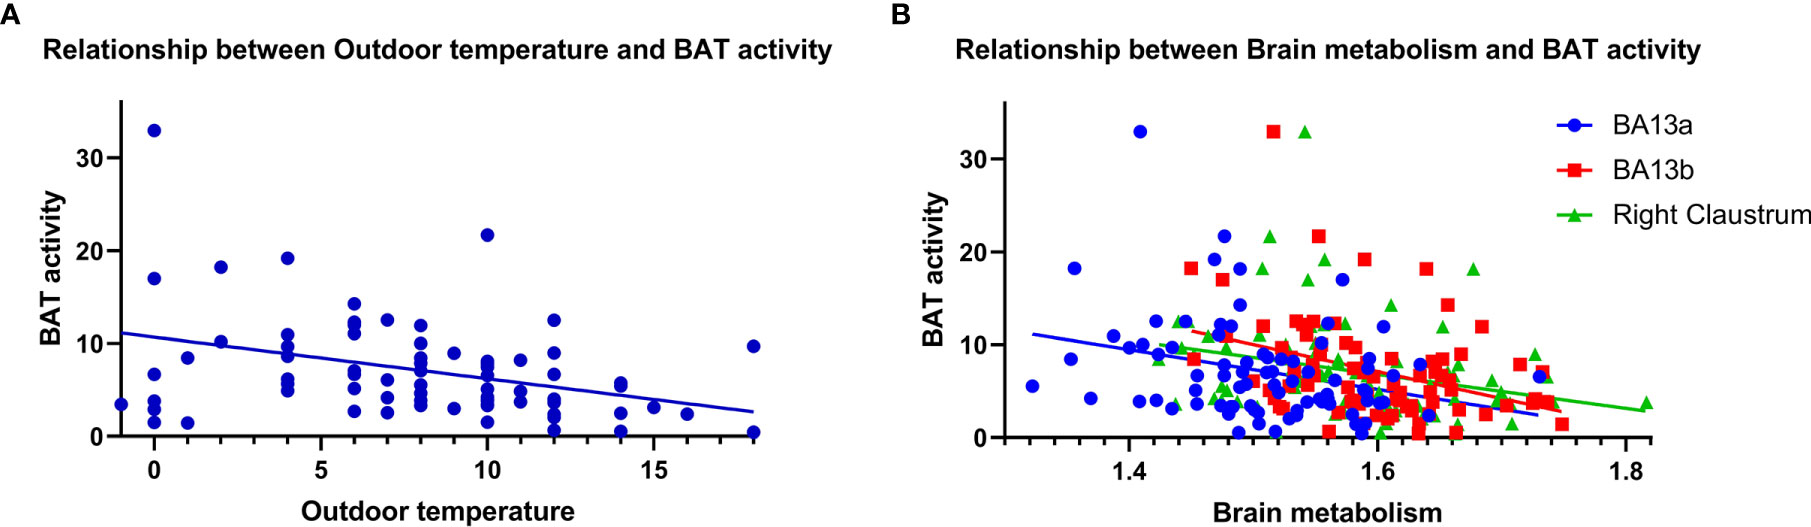
Figure 5 Correlation analysis of brain semi-quantitative metabolism values and average outdoor temperature with BAT activity. BAT activity was negatively correlated with average outdoor temperature [(A), r = -0.366, P = 0.001] and semi-quantitative values of brain metabolism. [(B), BA13a r = -0.293, P = 0.008; BA13b r = -0.374, P = 0.001; right claustrum r = -0.279, P = 0.012].
Multiple Linear Regression Analysis of Brain Glucose Metabolism, NPY Level, and BAT Activity
In order to reduce the interference of confounding factors, multiple linear regression models were used to analyze the correlation between variables in the BAT positive group. The BAT activity was taken as the dependent variable, and the semi-quantitative metabolic values of the three brain regions, as well as the plasma NPY level in the BAT positive group, were analyzed as the independent variable.
As shown in Table 4, after adjusting for age, gender, BMI, and outside temperature in the regression model 1 and 2, the semi-quantitative metabolic values of right insula and claustrum areas were still significantly negatively correlated with BAT activity. While adjusting for the NPY level in the regression model 3, the correlation between the semi-quantitative values of brain metabolism (BA13a and right claustrum) and the BAT activity was statistically negative (P = 0.025, P = 0.027). It was suggested that the correlation between the other brain region’s semi-quantitative value and BAT activity was affected by NPY levels. However, NPY level was negatively correlated with BAT activity. This negative correlation was still statistically significant even after adjusting for the three brain regions’ semi-quantitative values in the last model (P <0.001), which indicated that the level of NPY was an independent factor affecting BAT activity. The NPY levels of 15 BAT positive subjects were lower than their negative controls’, which also increased after thermoneutrality (Figure 6).
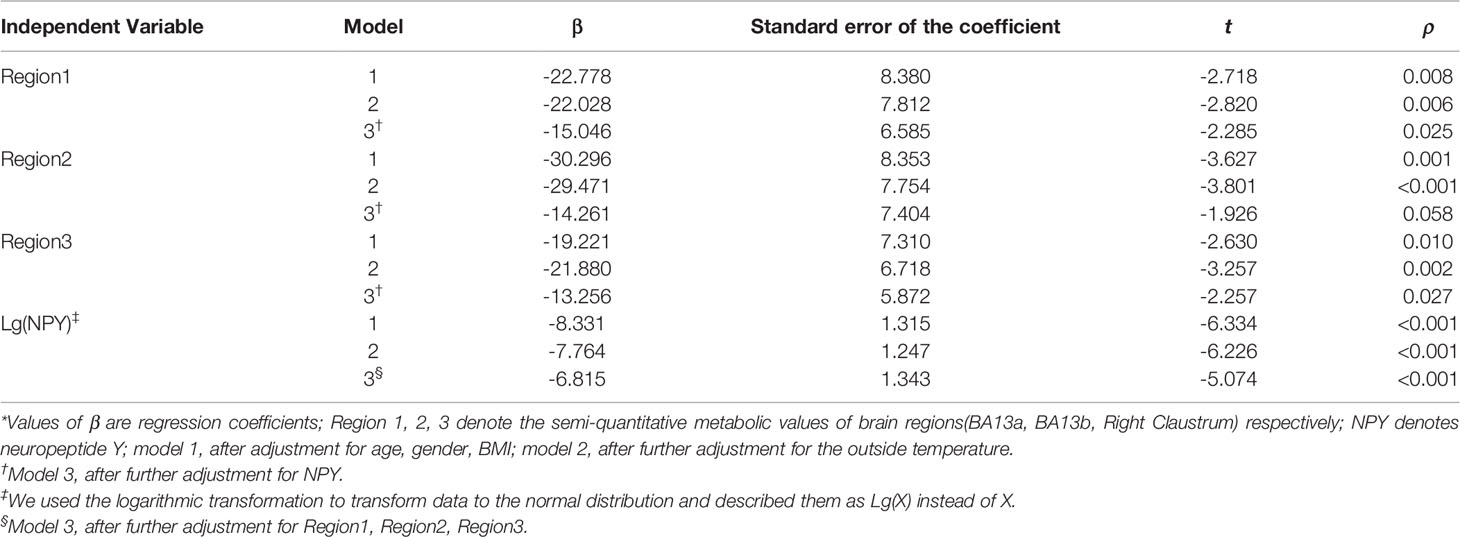
Table 4 Multiple linear regression models for associations of brain glucose metabolism and NPY with the activity of BAT*.
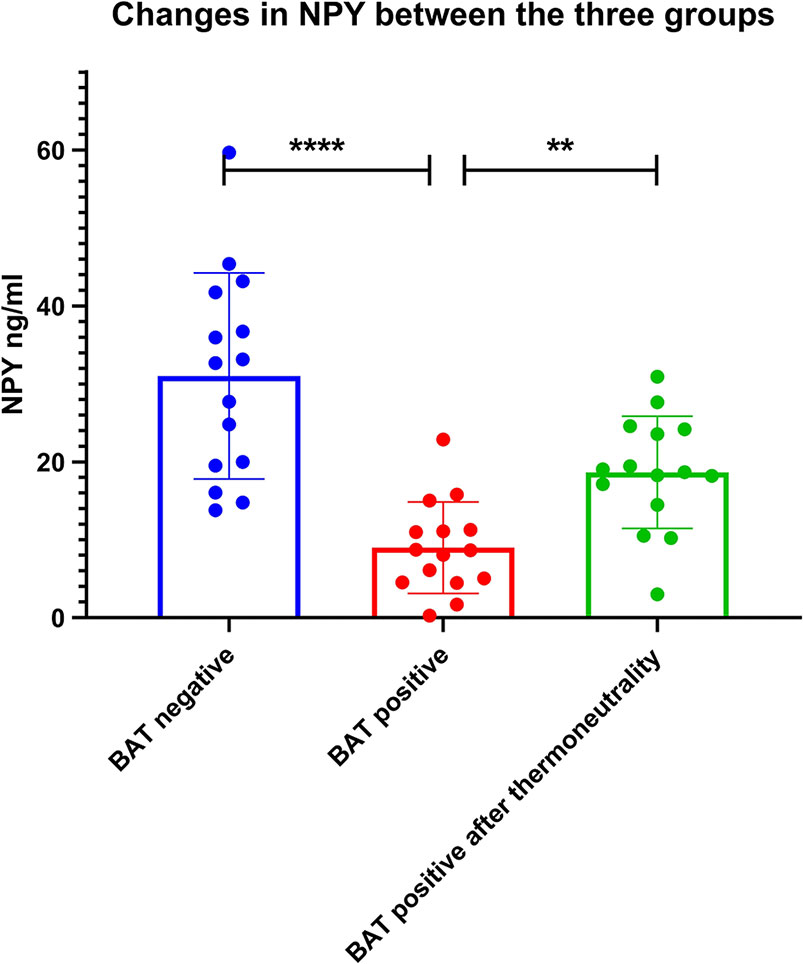
Figure 6 Changes in NPY between the three groups. The NPY levels of 15 BAT positive subjects were lower than their negative controls’ (P < 0.001), which also increased after thermoneutrality (P = 0.003). ** denotes P value < 0.01, **** denotes P value < 0.001.
Discussion
This research carried out a controlled study in healthy people with a large sample size to explore BAT activity’s central regulatory mechanism noninvasively and in-vivo and minimizing distractions. Advanced molecular functional imaging PET-CT technology was used to semi-quantitatively analyze the relationship between brain glucose metabolism and BAT activity. Moreover, the plasma NPY level of multiple groups (BAT negative group, BAT positive group, and BAT positive group after thermal neutral intervention) was further detected by Elisa. It provides a new clue to study the central regulatory mechanism of BAT activity.
It is known that the CNS is involved in maintaining energy metabolism and substance metabolism homeostasis, especially the hypothalamus area, which plays an essential role in this process (24). Even though animal studies have shown that knockdown of NPY expression in the dorsomedial hypothalamus could stimulate BAT activity (25), there is no direct evidence that the hypothalamus regulates BAT activity in healthy adults. Our results show apparent metabolic differences in brain regions (such as right insula and claustrum) between BAT positive subjects and their negative controls, but do not show the glucose metabolism values of the hypothalamus region are different between the two groups, which is consistent with the conclusion of the Taiwan study of cancer patients (26). Our research group has also analyzed the changes in brain glucose metabolism in the BAT positive subjects before and after the thermoneutrality intervention, and the metabolic changes in the hypothalamus region were not statistically significant either (18). It may be the hypothalamus region is relatively small, and the PET/CT imaging resolution is limited, so it is difficult to find the area with a difference of less than 2mm. Thus, the possibility of false negatives is likely to exist. The central neuroendocrine regulation is a complex network, and the hypothalamus may play an indirect role through the combination of other fibers or the brain structure.
In this study, SPM8 software and 18F-FDG PET/CT related image analysis software were used to further calculate the three brain regions’ semi-quantitative values with metabolic differences and BAT activity. Results show that the semi-quantitative values of the brain regions in the right sub-lobar insula and right claustrum of the BAT positive group were significantly lower than those of the negative group (Figures 3, 4 and Table 3), which not only analyzed the spatial structure but also semi-quantitatively found that the metabolism of specific brain regions was negatively correlated with BAT activity. These computation results are statistically significant and highly reliable.
Confounding factors such as tumor diseases, age, gender, and temperature can directly influence the glucose metabolism of the human brain and the activity of the BAT (23, 27, 28). Therefore, 160 healthy adults were recruited as this research’s subjects, whether activated BAT detected by PET/CT scan is divided into BAT positive group and negative control group, in accordance with the 1:1 matching of gender and scan date. Demographic characteristics (such as age, gender, hand dominance, and average outdoor temperature) of the two groups were not significantly different, as well as clinical data (such as blood pressure, heart rate, fasting glucose, and BMI) (Table 1).
To further reduce the interference of confounding factors, this study establishes the multivariate linear regression models to adjust for age, gender, BMI, and the average outdoor temperature. Despite adjusting for these factors, the semi-quantitative metabolism values of the right insula and claustrum were still negatively correlated with BAT activity. Nevertheless, after further correction of NPY level, only partial right insula and claustrum metabolism values were significantly negatively correlated with BAT activity. These results indicated that the brain glucose metabolism was closely related to BAT activity, which was not affected by age, gender, BMI, and outdoor temperature, but might be affected by the level of NPY.
Although there was no significant metabolic difference in the hypothalamus region between the two groups, in the multiple linear regression models, the level of NPY was consistently negatively correlated with BAT activity after successively adjusting for age, gender, BMI, outdoor mean temperature, and the semi-quantitative values of the three brain regions. The results of this study highly suggested that the level of hypothalamic neuroendocrine factor NPY was closely related to BAT activity and was not affected by other factors. NPY is made up of 36 amino acids, is one of the most critical neuroendocrine factors, mainly secreted by the hypothalamus, stimulates the appetite. While the permeability of the blood-brain barrier is different between individuals, the hypothalamic arcuate nucleus of NPY content is the most abundant. The circulating NPY level is closely related to the central brain source of NPY and can be integrated into the metabolic response of the central and peripheral nervous systems. Our clinical study revealed that under a fasting state, NPY was negatively correlated with BAT activity, and these brain regions might regulate the activity of BAT through the action of NPY. The NPY levels of 15 BAT positive subjects were lower than their negative controls’, which also increased after thermoneutrality intervention. This changing trend of NPY further confirms the negative correlation between NPY and BAT activity.
In this study, the classical Brodmann area (BA) based on the neuroanatomical cellular structure was used to represent the distribution locations of metabolic different brain regions (29). Our study identified the three brain regions of BA13a, BA13b, and right claustrum, which are parts of the right sub-lobar insula and belong to the limbic system. The insula is the only cortex of the human brain hidden deep in the cerebral tissue, in the shape of an inverted triangle, about the size of a “plum”. The insular lobe is involved in many physiological processes such as emotional and psychological regulation, visceral and somatosensory, motion control, etc. (30–32). The insular lobe receives physiological signals (such as temperature, visceral sensation, pain, etc.) that the body senses and then integrates information and transmits it to related structures in the brain. The structure and fiber connections around the insula are the material basis for successfully completing the “bridge” work of the insula. The anterior part of the insula is connected to the anterior lobe of the brain and the posterior portion to the temporal and parietal lobes. In addition, the insular lobe can also be closely associated with the surrounding brain tissue through the superior longitudinal tract, hooklike tract, frontal occipital tract, and other white matter fibers (33, 34). Both the insular lobe (which belongs to the cortical structure) and the hypothalamus (which belongs to the subcortical structure) are components of the limbic system and share a common molecular biomarker, limbic system-associate membrane protein(LAMP). It has a unique function in a specific area and also plays a holistic role through a complex network of peripheral structures, fibrous connections, and loops that interact with other tissues in the brain (35).
As the center of body temperature regulation, the hypothalamus can stimulate BAT activity to produce heat through the sympathetic nervous system, and the insula is the signal receiving station and integration center of the body to the external temperature. Therefore, when the human body is stimulated by ambient temperature, the metabolism of the insula region of the cerebral cortex changes, and the integrated signal is transmitted to the hypothalamus through fiber connections, thereby regulating the thermogenic activity of BAT. However, after the adjustment of outdoor temperature in the multiple linear regression model, it was still found that the metabolism of brain regions was related to BAT activity, suggesting that there were some regulatory mechanisms independent of temperatures, such as mental factors and visceral sensation factors.
There are still some limitations to this study. As a single-center, cross-sectional study, it was observed that glucose metabolism was closely related to BAT activity in some brain regions, but the causal relationship could not be fully explained. Further mechanism studies using transgenic animals are expected. This study focused on the hypothalamic region and NPY, while it is not known that other neuroendocrine factors may be involved in the central regulation of BAT activity. There are still many mysteries in the regulation mechanism of BAT activity, especially in the CNS regulation mechanism. We hope to conduct in-depth research on the mechanism of central regulation of metabolism in vivo through micro PET/CT of animals.
Conclusion
This study revealed that the glucose metabolism in some brain regions (such as the insula-claustrum region) was closely related to BAT activity, and NPY mostly excreted from the hypothalamus may play an essential role in it. This is a new clue added to the central regulation of energy metabolism, which provides valuable experience for opening up new research methodology.
Data Availability Statement
The data analyzed in this study is subject to the following licenses/restrictions: The data may be related to the privacy of clinical subjects. Requests to access these datasets should be directed tocWlvbmd5dWVfemhhbmdAZnVkYW4uZWR1LmNu.
Ethics Statement
The studies involving human participants were reviewed and approved by the ethics committees of Huashan Hospital, Fudan University in Shanghai. The patients/participants provided their written informed consent to participate in this study.
Author Contributions
HY, CZ, QZ, YL, and YY designed this study. QZ, QM, YY, WW, QS, BX, JL, and HZ contributed to the recruitment and conducted experiments. QZ and QM wrote the paper. XZ, YF, JL and HZ analyzed data and revised the article. HY, CZ, YL and YG supervised the study. All authors contributed to the article and approved the submitted version.
Funding
This work was supported by grants from the National Key Research and Development Program of China (2019YFA0801900, 2016YFC1305105), the National Natural Science Foundation of China (81800691, 81670751, 81770840, 81971641, and 81671239), China Postdoctoral Science Foundation (2021M690680), the Shanghai Committee of Science and Technology, China (No. 10JC1401002), the Research project of Shanghai Health Commission (2020YJZX0111), Shanghai Municipal Commission of Health and Family Planning (20144Y0070, 20164Y0041), Clinical Research Plan of SHDC (SHDC2020CR1038B).
Conflict of Interest
The authors declare that the research was conducted in the absence of any commercial or financial relationships that could be construed as a potential conflict of interest.
Acknowledgments
We sincerely thank the volunteers who participated in this study, the staff from the PET Center at Shanghai Huashan Hospital for facilitating the assessment of subjects, and the Center of Laboratory Medicine Huashan Hospital for their technical assistance.
References
1. Cannon B, Nedergaard J. Brown Adipose Tissue: Function and Physiological Significance. Physiol Rev (2004) 84(1):277–359. doi: 10.1152/physrev.00015.2003
2. van Marken Lichtenbelt WD, Vanhommerig JW, Smulders NM, Drossaerts JM, Kemerink GJ, Bouvy ND, et al. Cold-Activated Brown Adipose Tissue in Healthy Men. N Engl J Med (2009) 360(15):1500–8. doi: 10.1056/NEJMoa0808718
3. Virtanen KA, Lidell ME, Orava J, Heglind M, Westergren R, Niemi T, et al. Functional Brown Adipose Tissue in Healthy Adults. N Engl J Med (2009) 360(15):1518–25. doi: 10.1056/NEJMoa0808949
5. Seale P, Lazar MA. Brown Fat in Humans: Turning Up the Heat on Obesity. Diabetes (2009) 58(7):1482–4. doi: 10.2337/db09-0622
6. Whittle AJ, López M, Vidal-Puig A. Using Brown Adipose Tissue to Treat Obesity - the Central Issue. Trends Mol Med (2011) 17(8):405–11. doi: 10.1016/j.molmed.2011.04.001
7. Waterson MJ, Horvath TL. Neuronal Regulation of Energy Homeostasis: Beyond the Hypothalamus and Feeding. Cell Metab (2015) 22(6):962–70. doi: 10.1016/j.cmet.2015.09.026
8. Henningsen JB, Scheele C. Brown Adipose Tissue: A Metabolic Regulator in a Hypothalamic Cross Talk? Annu Rev Physiol (2021) 83:279–301. doi: 10.1146/annurev-physiol-032420-042950
9. Livneh Y, Ramesh RN, Burgess CR, Levandowski KM, Madara JC, Fenselau H, et al. Homeostatic Circuits Selectively Gate Food Cue Responses in Insular Cortex. Nature (2017) 546(7660):611–6. doi: 10.1038/nature22375
10. Qadir H, Krimmel SR, Mu C, Poulopoulos A, Seminowicz DA, Mathur BN. Structural Connectivity of the Anterior Cingulate Cortex, Claustrum, and the Anterior Insula of the Mouse. Front Neuroanat (2018) 12:100. doi: 10.3389/fnana.2018.00100
11. Reser D, Picard F. Editorial: Structure and Function of the Insula-Claustrum Region. Front Neuroanat (2020) 14:14. doi: 10.3389/fnana.2020.00014
12. Steinberg J, Thomas A, Iravani A. F-Fluorodeoxyglucose PET/CT Findings in a Systemic Inflammatory Response Syndrome After COVID-19 Vaccine. Lancet (London England) (2021) 397(10279):e9. doi: 10.1016/S0140-6736(21)00464-5
13. Rusthoven CG, Doebele RC. Management of Brain Metastases in ALK-Positive Non-Small-Cell Lung Cancer. J Clin Oncol (2016) 34(24):2814–9. doi: 10.1200/JCO.2016.67.2410
14. Fischer B, Lassen U, Mortensen J, Larsen S, Loft A, Bertelsen A, et al. Preoperative Staging of Lung Cancer With Combined PET-CT. New Engl J Med (2009) 361(1):32–9. doi: 10.1056/NEJMoa0900043
15. Johnson P, Federico M, Kirkwood A, Fosså A, Berkahn L, Carella A, et al. Adapted Treatment Guided by Interim Pet-CT Scan in Advanced Hodgkin’s Lymphoma. New Engl J Med (2016) 374(25):2419–29. doi: 10.1056/NEJMoa1510093
16. Chen KY, Cypess AM, Laughlin MR, Haft CR, Hu HH, Bredella MA, et al. Brown Adipose Reporting Criteria in Imaging Studies (BARCIST 1.0): Recommendations for Standardized Fdg-Pet/Ct Experiments in Humans. Cell Metab (2016) 24(2):210–22. doi: 10.1016/j.cmet.2016.07.014
17. Kim K, Huang S, Fletcher LA, O’Mara AE, Tal I, Brychta RJ, et al. Whole Body and Regional Quantification of Active Human Brown Adipose Tissue Using 18f-FDG Pet/Ct. J Vis Exp (2019) 146. doi: 10.3791/58469
18. Miao Q, Zhao XL, Zhang QY, Zhang ZY, Guan YH, Ye HY, et al. Stability in Brain Glucose Metabolism Following Brown Adipose Tissue Inactivation in Chinese Adults. AJNR Am J Neuroradiol (2012) 33(8):1464–9. doi: 10.3174/ajnr.A3006
19. Pace L, Nicolai E, Basso L, Garbino N, Soricelli A, Salvatore M. Brown Adipose Tissue in Breast Cancer Evaluated by [(18)F] FDG-PET/CT. Mol Imaging Biol (2020) 22(4):1111–5. doi: 10.1007/s11307-020-01482-z
20. Fischer JGW, Maushart CI, Becker AS, Muller J, Madoerin P, Chirindel A, et al. Comparison of [(18)F]FDG PET/CT With Magnetic Resonance Imaging for the Assessment of Human Brown Adipose Tissue Activity. EJNMMI Res (2020) 10(1):85. doi: 10.1186/s13550-020-00665-7
21. Zhang Z, Cypess AM, Miao Q, Ye H, Liew CW, Zhang Q, et al. The Prevalence and Predictors of Active Brown Adipose Tissue in Chinese Adults. Eur J Endocrinol (2014) 170(3):359–66. doi: 10.1530/EJE-13-0712
22. Zhang Q, Ye H, Miao Q, Zhang Z, Wang Y, Zhu X, et al. Differences in the Metabolic Status of Healthy Adults With and Without Active Brown Adipose Tissue. Wiener Klin Wochenschrift (2013) 125(21-22):687–95. doi: 10.1007/s00508-013-0431-2
23. Cypess AM, Lehman S, Williams G, Tal I, Rodman D, Goldfine AB, et al. Identification and Importance of Brown Adipose Tissue in Adult Humans. New Engl J Med (2009) 360(15):1509–17. doi: 10.1056/NEJMoa0810780
24. Zhang W, Cline MA, Gilbert ER. Hypothalamus-Adipose Tissue Crosstalk: Neuropeptide Y and the Regulation of Energy Metabolism. Nutr Metab (Lond) (2014) 11:27. doi: 10.1186/1743-7075-11-27
25. Chao PT, Yang L, Aja S, Moran TH, Bi S. Knockdown of NPY Expression in the Dorsomedial Hypothalamus Promotes Development of Brown Adipocytes and Prevents Diet-Induced Obesity. Cell Metab (2011) 13(5):573–83. doi: 10.1016/j.cmet.2011.02.019
26. Huang YC, Hsu CC, Huang P, Yin TK, Chiu NT, Wang PW, et al. The Changes in Brain Metabolism in People With Activated Brown Adipose Tissue: A PET Study. Neuroimage (2011) 54(1):142–7. doi: 10.1016/j.neuroimage.2010.07.058
27. Lee HY, Chung JK, Jeong JM, Lee DS, Kim DG, Jung HW, et al. Comparison of FDG-PET Findings of Brain Metastasis From Non-Small-Cell Lung Cancer and Small-Cell Lung Cancer. Ann Nucl Med (2008) 22(4):281–6. doi: 10.1007/s12149-007-0104-1
28. Willis MW, Ketter TA, Kimbrell TA, George MS, Herscovitch P, Danielson AL, et al. Age, Sex and Laterality Effects on Cerebral Glucose Metabolism in Healthy Adults. Psychiatry Res (2002) 114(1):23–37. doi: 10.1016/s0925-4927(01)00126-3
29. Zilles K, Amunts K. Centenary of Brodmann’s Map–Conception and Fate. Nat Rev Neurosci (2010) 11(2):139–45. doi: 10.1038/nrn2776
30. Naqvi NH, Bechara A. The Hidden Island of Addiction: The Insula. Trends Neurosci (2009) 32(1):56–67. doi: 10.1016/j.tins.2008.09.009
31. Ruiz S, Lee S, Soekadar SR, Caria A, Veit R, Kircher T, et al. Acquired Self-Control of Insula Cortex Modulates Emotion Recognition and Brain Network Connectivity in Schizophrenia. Hum Brain Mapp (2013) 34(1):200–12. doi: 10.1002/hbm.21427
32. Menon V, Uddin LQ. Saliency, Switching, Attention and Control: A Network Model of Insula Function. Brain Struct Funct (2010) 214(5-6):655–67. doi: 10.1007/s00429-010-0262-0
33. Cauda F, D’Agata F, Sacco K, Duca S, Geminiani G, Vercelli A. Functional Connectivity of the Insula in the Resting Brain. Neuroimage (2011) 55(1):8–23. doi: 10.1016/j.neuroimage.2010.11.049
34. Kang Y, Williams LE, Clark MS, Gray JR, Bargh JA. Physical Temperature Effects on Trust Behavior: The Role of Insula. Soc Cognit Affect Neurosci (2011) 6(4):507–15. doi: 10.1093/scan/nsq077
Keywords: brown adipose tissue, positron-emission tomography and computed tomography, brain glucose metabolism, neuropeptide Y, statistical parametric mapping
Citation: Zhang Q, Miao Q, Yang Y, Lu J, Zhang H, Feng Y, Wu W, Zhu X, Xiang B, Sun Q, Guan Y, Li Y, Zuo C and Ye H (2021) Neuropeptide Y Plays an Important Role in the Relationship Between Brain Glucose Metabolism and Brown Adipose Tissue Activity in Healthy Adults: A PET/CT Study. Front. Endocrinol. 12:694162. doi: 10.3389/fendo.2021.694162
Received: 12 April 2021; Accepted: 11 June 2021;
Published: 09 July 2021.
Edited by:
Riccarda Granata, University of Turin, ItalyReviewed by:
Paolo Magni, University of Milan, ItalyXiaodan Lu, The People’s Hospital of Jilin Province, China
Copyright © 2021 Zhang, Miao, Yang, Lu, Zhang, Feng, Wu, Zhu, Xiang, Sun, Guan, Li, Zuo and Ye. This is an open-access article distributed under the terms of the Creative Commons Attribution License (CC BY). The use, distribution or reproduction in other forums is permitted, provided the original author(s) and the copyright owner(s) are credited and that the original publication in this journal is cited, in accordance with accepted academic practice. No use, distribution or reproduction is permitted which does not comply with these terms.
*Correspondence: Hongying Ye, eWVob25neWluZ0BodWFzaGFuLm9yZy5jbg==; Chuantao Zuo, enVvY2h1YW50YW9AZnVkYW4uZWR1LmNu; Yiming Li, eWltaW5nbGkuZnVkYW5AZ21haWwuY29t; Qiongyue Zhang, cWlvbmd5dWVfemhhbmdAZnVkYW4uZWR1LmNu
†These authors have contributed equally to this work and share first authorship
‡These authors have contributed equally to this work and share last authorship