 Yujiao Deng1,2†
 Na Li2†
 Ying Wu2
 Meng Wang2
 Si Yang2
 Yi Zheng2Xinyue Deng3
 Dong Xiang4
 Yuyao Zhu2
 Peng Xu2
 Zhen Zhai2Dai Zhang2
 Zhijun Dai3Jie Gao1*
- 1Department of Nephrology, The Second Affiliated Hospital of Xi’an Jiaotong University, Xi’an, China
- 2Department of Oncology, The Second Affiliated Hospital of Xi’an Jiaotong University, Xi’an, China
- 3Department of Breast Surgery, The First Affiliated Hospital, College of Medicine, Zhejiang University, Hangzhou, China
- 4Celilo Cancer Center, Oregon Health Science Center Affiliated Mid-Columbia Medical Center, The Dalles, OR, United States
Background: Chronic kidney disease (CKD) is a public health problem largely caused by diabetes. The epidemiology of diabetes mellitus–related CKD (CKD-DM) could provide specific support to lessen global, regional, and national CKD burden.
Methods: Data were derived from the GBD 2019 study, including four measures and age-standardized rates (ASRs). Estimated annual percentage changes and 95% CIs were calculated to evaluate the variation trend of ASRs.
Results: Diabetes caused the majority of new cases and patients with CKD in all regions. All ASRs for type 2 diabetes–related CKD increased over 30 years. Asia and Middle socio-demographic index (SDI) quintile always carried the heaviest burden of CKD-DM. Diabetes type 2 became the second leading cause of CKD and CKD-related death and the third leading cause of CKD-related DALYs in 2019. Type 2 diabetes–related CKD accounted for most of the CKD-DM disease burden. There were 2.62 million incident cases, 134.58 million patients, 405.99 thousand deaths, and 13.09 million disability-adjusted life-years (DALYs) of CKD-DM worldwide in 2019. Age-standardized incidence (ASIR) and prevalence rate (ASPR) of type 1 diabetes–related CKD increased, whereas age-standardized death rate (ASDR) and DALY rate decreased for females and increased for males. In high SDI quintile, ASIR and ASPR of type 1 diabetes–related CKD remained the highest, with the slowest increase, whereas the ASDR and age-standardized DALY rate remained the lowest there. In high SDI quintile, ASIR of type 2 diabetes–related CKD was the highest, with the lowest increasing rate. In addition, type 2 diabetes–related CKD occurred most in people aged 80-plus years worldwide. The main age of type 2 diabetes–related CKD patients was 55–64 years in Asia and Africa. The prevalence, mortality, and DALY rate of type 2 diabetes–related CKD increased with age. As for incidence, there was a peak at 80 years, and after age of 80, the incidence declined. CKD-DM-related anemia was mainly in mild to moderate grade.
Conclusions: Increasing burden of CKD-DM varied among regions and countries. Prevention and treatment measures should be strengthened according to CKD-DM epidemiology, especially in middle SDI quintile and Asia.
Introduction
Chronic kidney disease (CKD) remains a public health problem (1), which increases and affects over 75 million people worldwide (2, 3). At present, people suffer from CKD more than osteoarthritis, diabetes, or depression (4). CKD is ranked as the 12th leading cause of mortality (5) and was listed in 2013 as one of the top 10 causes of reduced life expectancy or disability-adjusted life-years (DALYs) (3). The burden of kidney disease varies greatly across the world, as does its testing and treatment (6, 7).
The most common causes of increased CKD burden are diabetes and hypertension. Diabetic nephropathy, the leading cause of end-stage renal disease (ESRD), is associated with the excess mortality in diabetic patients (8, 9). Moreover, diabetic CKD increased kidney disease–associated disability (10, 11) and triggered arterial disease and cardiovascular complications (12). Type 2 diabetes is gradually replacing infectious diseases as the main cause of CKD in less economically advanced countries, thereby causing competition for scarce medical resources (9). In patients with type 2 diabetes and mild/moderate CKD, use of metformin is associated with a significant reduction in all-cause mortality (13). In addition, the incidence of CKD caused by diabetes (CKD-DM) is determined by socioeconomic, cultural, and political factors, which have led to gaps in the current status of CKD prevention and management capabilities in countries around the world (14). Understanding the burden of CKD-DM in various countries and implementing early detection and management are important steps towards achieving equal kidney health.
Owing to broad array of data sources and scientific statistical modeling approaches (15, 16), GBD study can provide comprehensive estimates of CKD-DM burden to date. GBD 2019 study includes 369 diseases and injuries data in 204 countries and territories (4, 10). In this study, we aimed to investigate CKD-DM epidemiology and its variation trend at the global, regional, and national levels among different sex, age, and socio-demographic index (SDI). In this study, we provided a wide range of latest CKD-DM data, including incidence, prevalence, deaths, DALYs, and sequala among two sexes, four world regions, 21 regions, and 15 age-groups. These findings could provide specific guidance for decision-making and focus efforts toward the burden of inequities in CKD.
Materials and Methods
Study Population and Data Collection
We evaluated the CKD-DM burden (incidence, prevalence, deaths, and DALYs) and impairment (prevalence and YLDs) in 204 countries and territories within four world regions and 21 specific regions between 1990 and 2019 (Appendix in Supplements). All the data were retrieved using the Global Health Data Exchange (GHDx) query tool (http://ghdx.healthdata.org/gbd-results-tool). Four measures, age-standardized rates (ASRs), and impairment data of type 1 diabetes–related CKD (CKD-T1DM) and type 2 diabetes–related CKD (CKD-T2DM) were collected among different age-groups and gender. The age range included in this study was >10 years old and was segmented into 15 age-groups. Anemia (17), an impairment related to CKD-DM, was classified into three grades: mild, moderate, and severe.
SDI, ranging from 0 to 1, is a comprehensive measure of development and is an indicator of the overall fertility rate of women under 25 years of age, educational attainment, and lagging per capita income distribution in a country. Based on SDI values in 2019, countries and territories were classified into five categories: high, high-middle, middle, low-middle, and low.
Statistical Analysis
All measures (counts, rates, and ASRs) were listed with a 95% uncertainty interval (UI). All rates in this study were reported per 100,000 individuals. We calculated estimated annual percentage changes (EAPCs) and their 95% CI to estimate the trend of ASRs, with the methods having been previously described (18, 19). When the EAPC and lower CI limit are positive, ASR increased. In contrast, when the EAPC and upper CI limit are negative, ASR decreased. The DisMod-MR 2.1 model, a Bayesian meta-regression method, was used for each measure. This study was approved by the Ethics Committee of the Second Affiliated Hospital, College of Medicine, Xi’an Jiaotong University. The access to and use of GBD study data did not require informed patient consent. This study followed the Guidelines for Accurate and Transparent Health Estimates (GATHER) Reporting guideline.
Results
Global Findings
In 2019, diabetes and CKD have become the seventh largest non-communicable diseases, the fourth leading cause of death, and the sixth leading cause of disability worldwide (Figure S1). CKD-T1DM was responsible for 12.9 thousand incident cases, 5.02 million patients, 8.20 thousand deaths, and 3.22 million DALYs in 2019, which increased by 75.09, 88.41, 89.73, and 72.63%, respectively, over 30 years worldwide (Table S1). Additionally, CKD-T2DM was associated with 2.5 million incident cases, 129.56 million patients, 405.99 thousand deaths, and 9.87 million DALYs, which increased by 156.49, 94.78, 172.39, and 141.73%, respectively (Table 1). Type 2 diabetes has become the second leading cause of CKD and CKD–related deaths and the third leading cause of CKD related DALYs in 2019 (Figure S2).
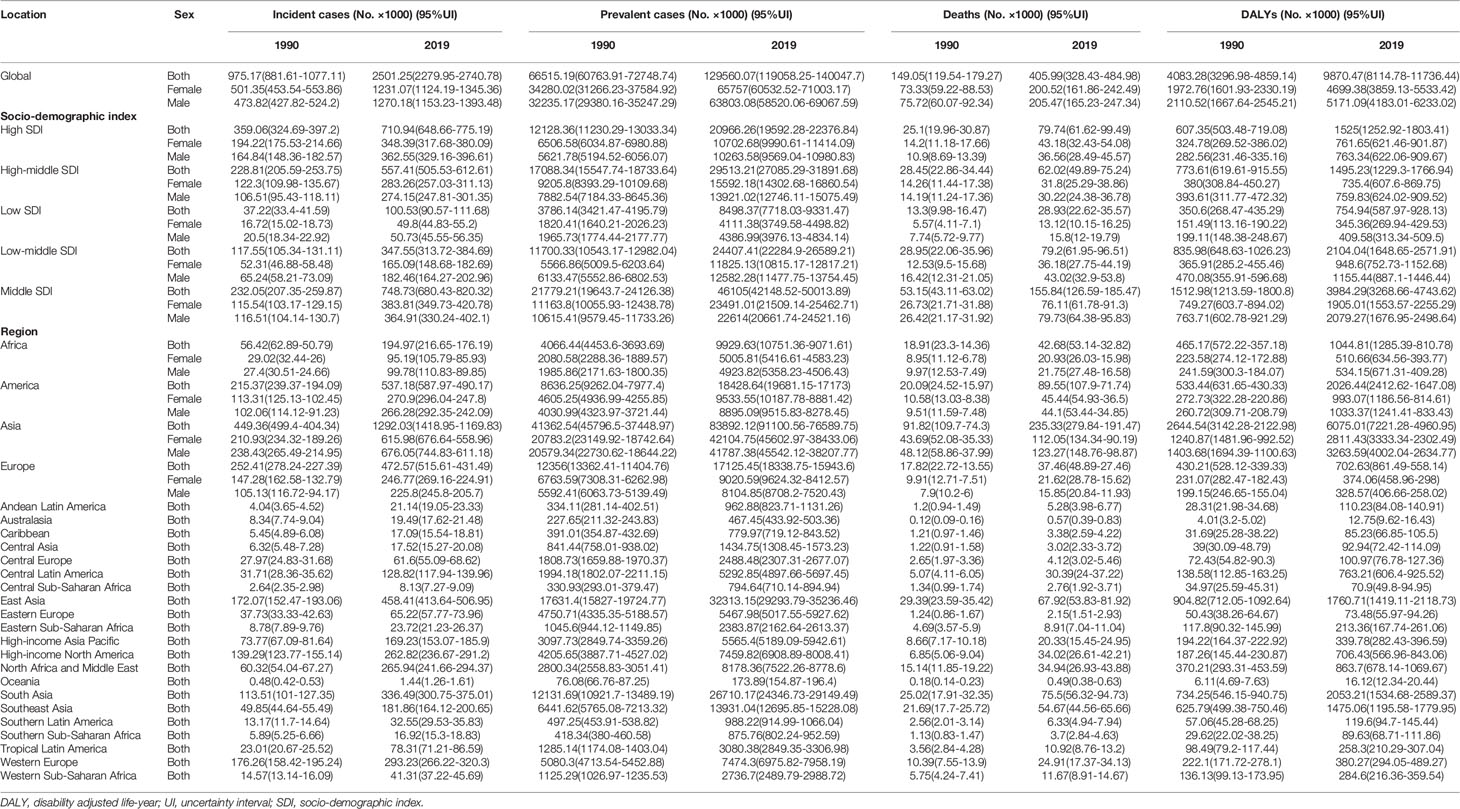
Table 1 The global and regional burden of chronic kidney disease caused by diabetes mellitus type 2.
As for the variation of ASRs, both age-standardized incidence rate (ASIR) and prevalence rate (ASPR) of CKD-T1DM exhibited upward trends in both genders globally (ASIR: EAPC = 1.21, 95% CI: 1.08–1.35; ASPR: EAPC = 1.15, 95% CI: 0.10–1.31). Interestingly, age-standardized death rate (ASDR) and DALY rate remained stable over 30 years (ASDR: EAPC = 0.08, 95% CI: −0.02–0.19; DALY: EAPC = −0.08, 95% CI: −0.18–0.02), falling for women but rising for men (Table S2). All ASRs of CKD-T2DM increased among women and men worldwide (Table 2). Further analysis indicated that incidence, prevalence, mortality of CKD-T1DM remained stable in all age-groups and gender. However, DALY rate showed a peak at 40–59 years (Figure 1). As for CKD-T2DM, the prevalence, mortality, and DALY rate increased with age. In four world regions, CKD-T2DM occurred mostly in people aged 80-plus years (Figure 2). The main age at which people develop CKD-T2DM, deaths, and DALYs is presented in Figures S3-5.
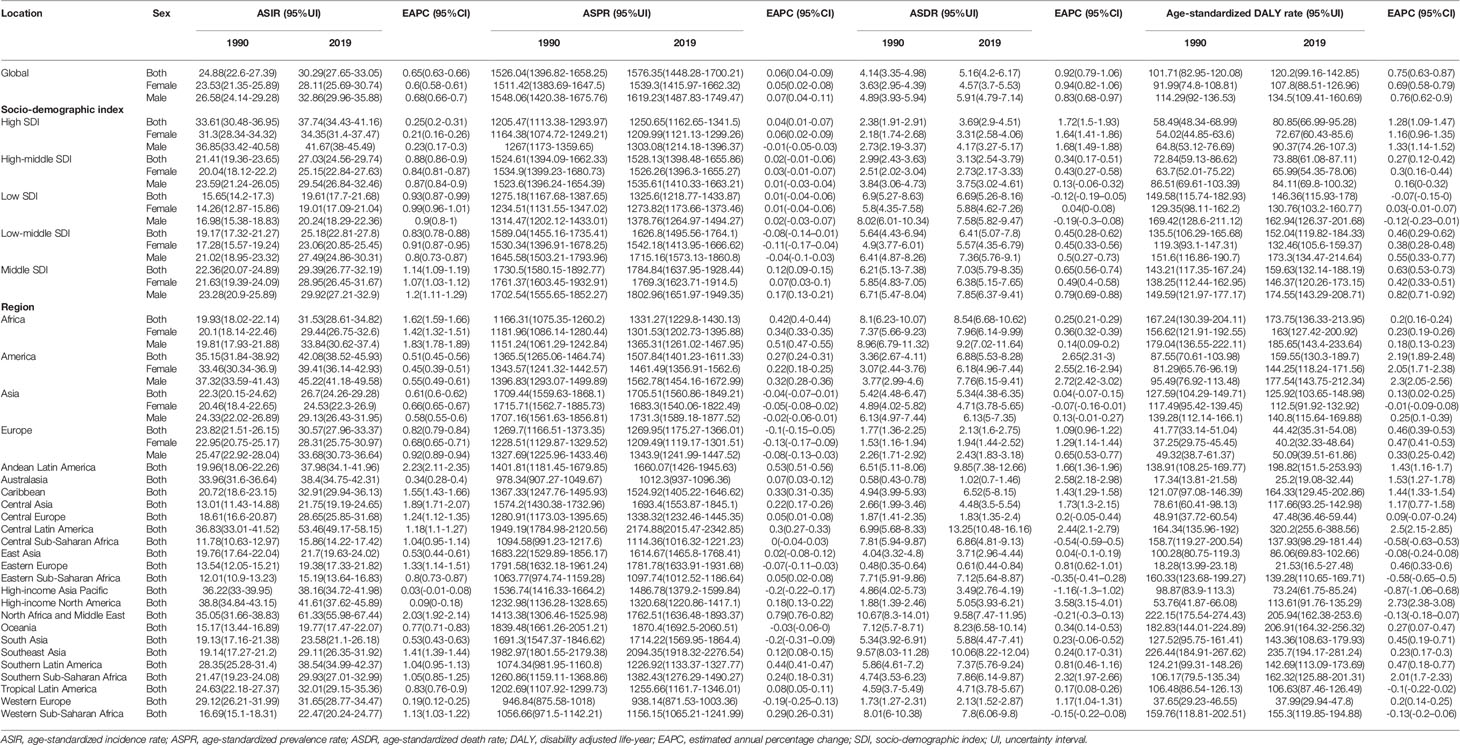
Table 2 The age-standardized rates and variation trends of diabetes mellitus type 2–related chronic kidney disease.
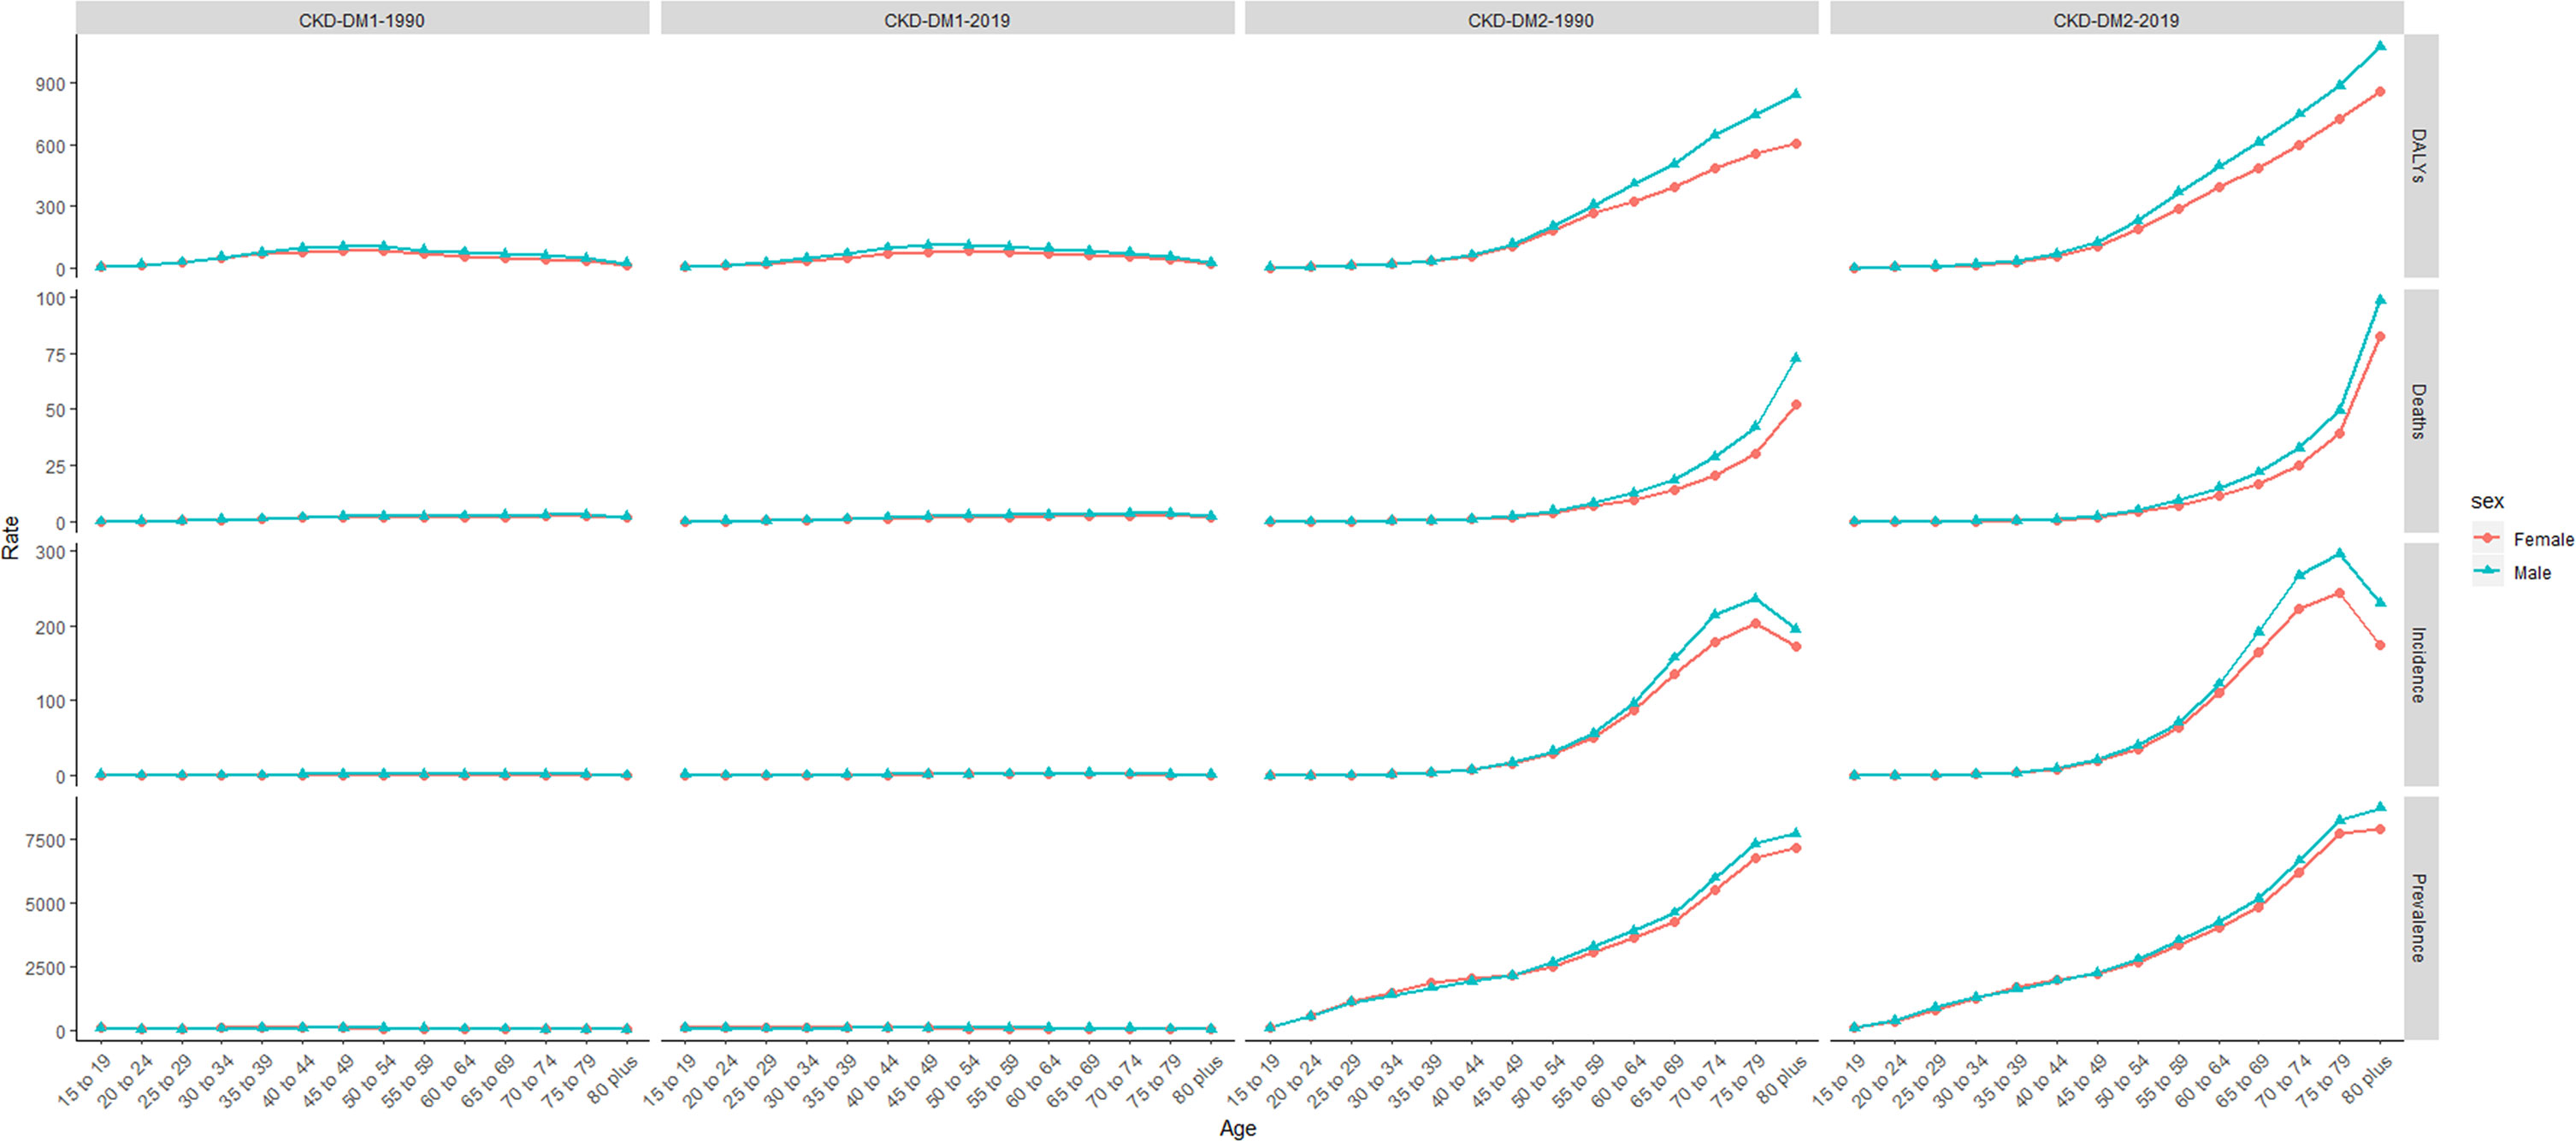
Figure 1 The incidence, prevalence, death, and DALY rate of CKD-DM burden from 1990 to 2019. CKD-DM1-1990 represents the incidence, prevalence, death, and DALY rate of type 1 diabetes–related CKD in 1990. CKD-DM1-2019 represents the incidence, prevalence, death, and DALY rate of type 1 diabetes–related CKD in 2019. CKD-DM2-1990 represents the incidence, prevalence, death, and DALY rate of type 2 diabetes–related CKD in 1990. CKD-DM2-2019 represents the incidence, prevalence, death, and DALY rate of type 2 diabetes-related CKD in 2019. CKD-DM, chronic kidney disease caused by diabetes; DALY, disability adjusted life-year. The vertical axis is the incidence, prevalence, death, and DALY rate (per 100,000 people), and the horizontal axis is the different age-groups (years).
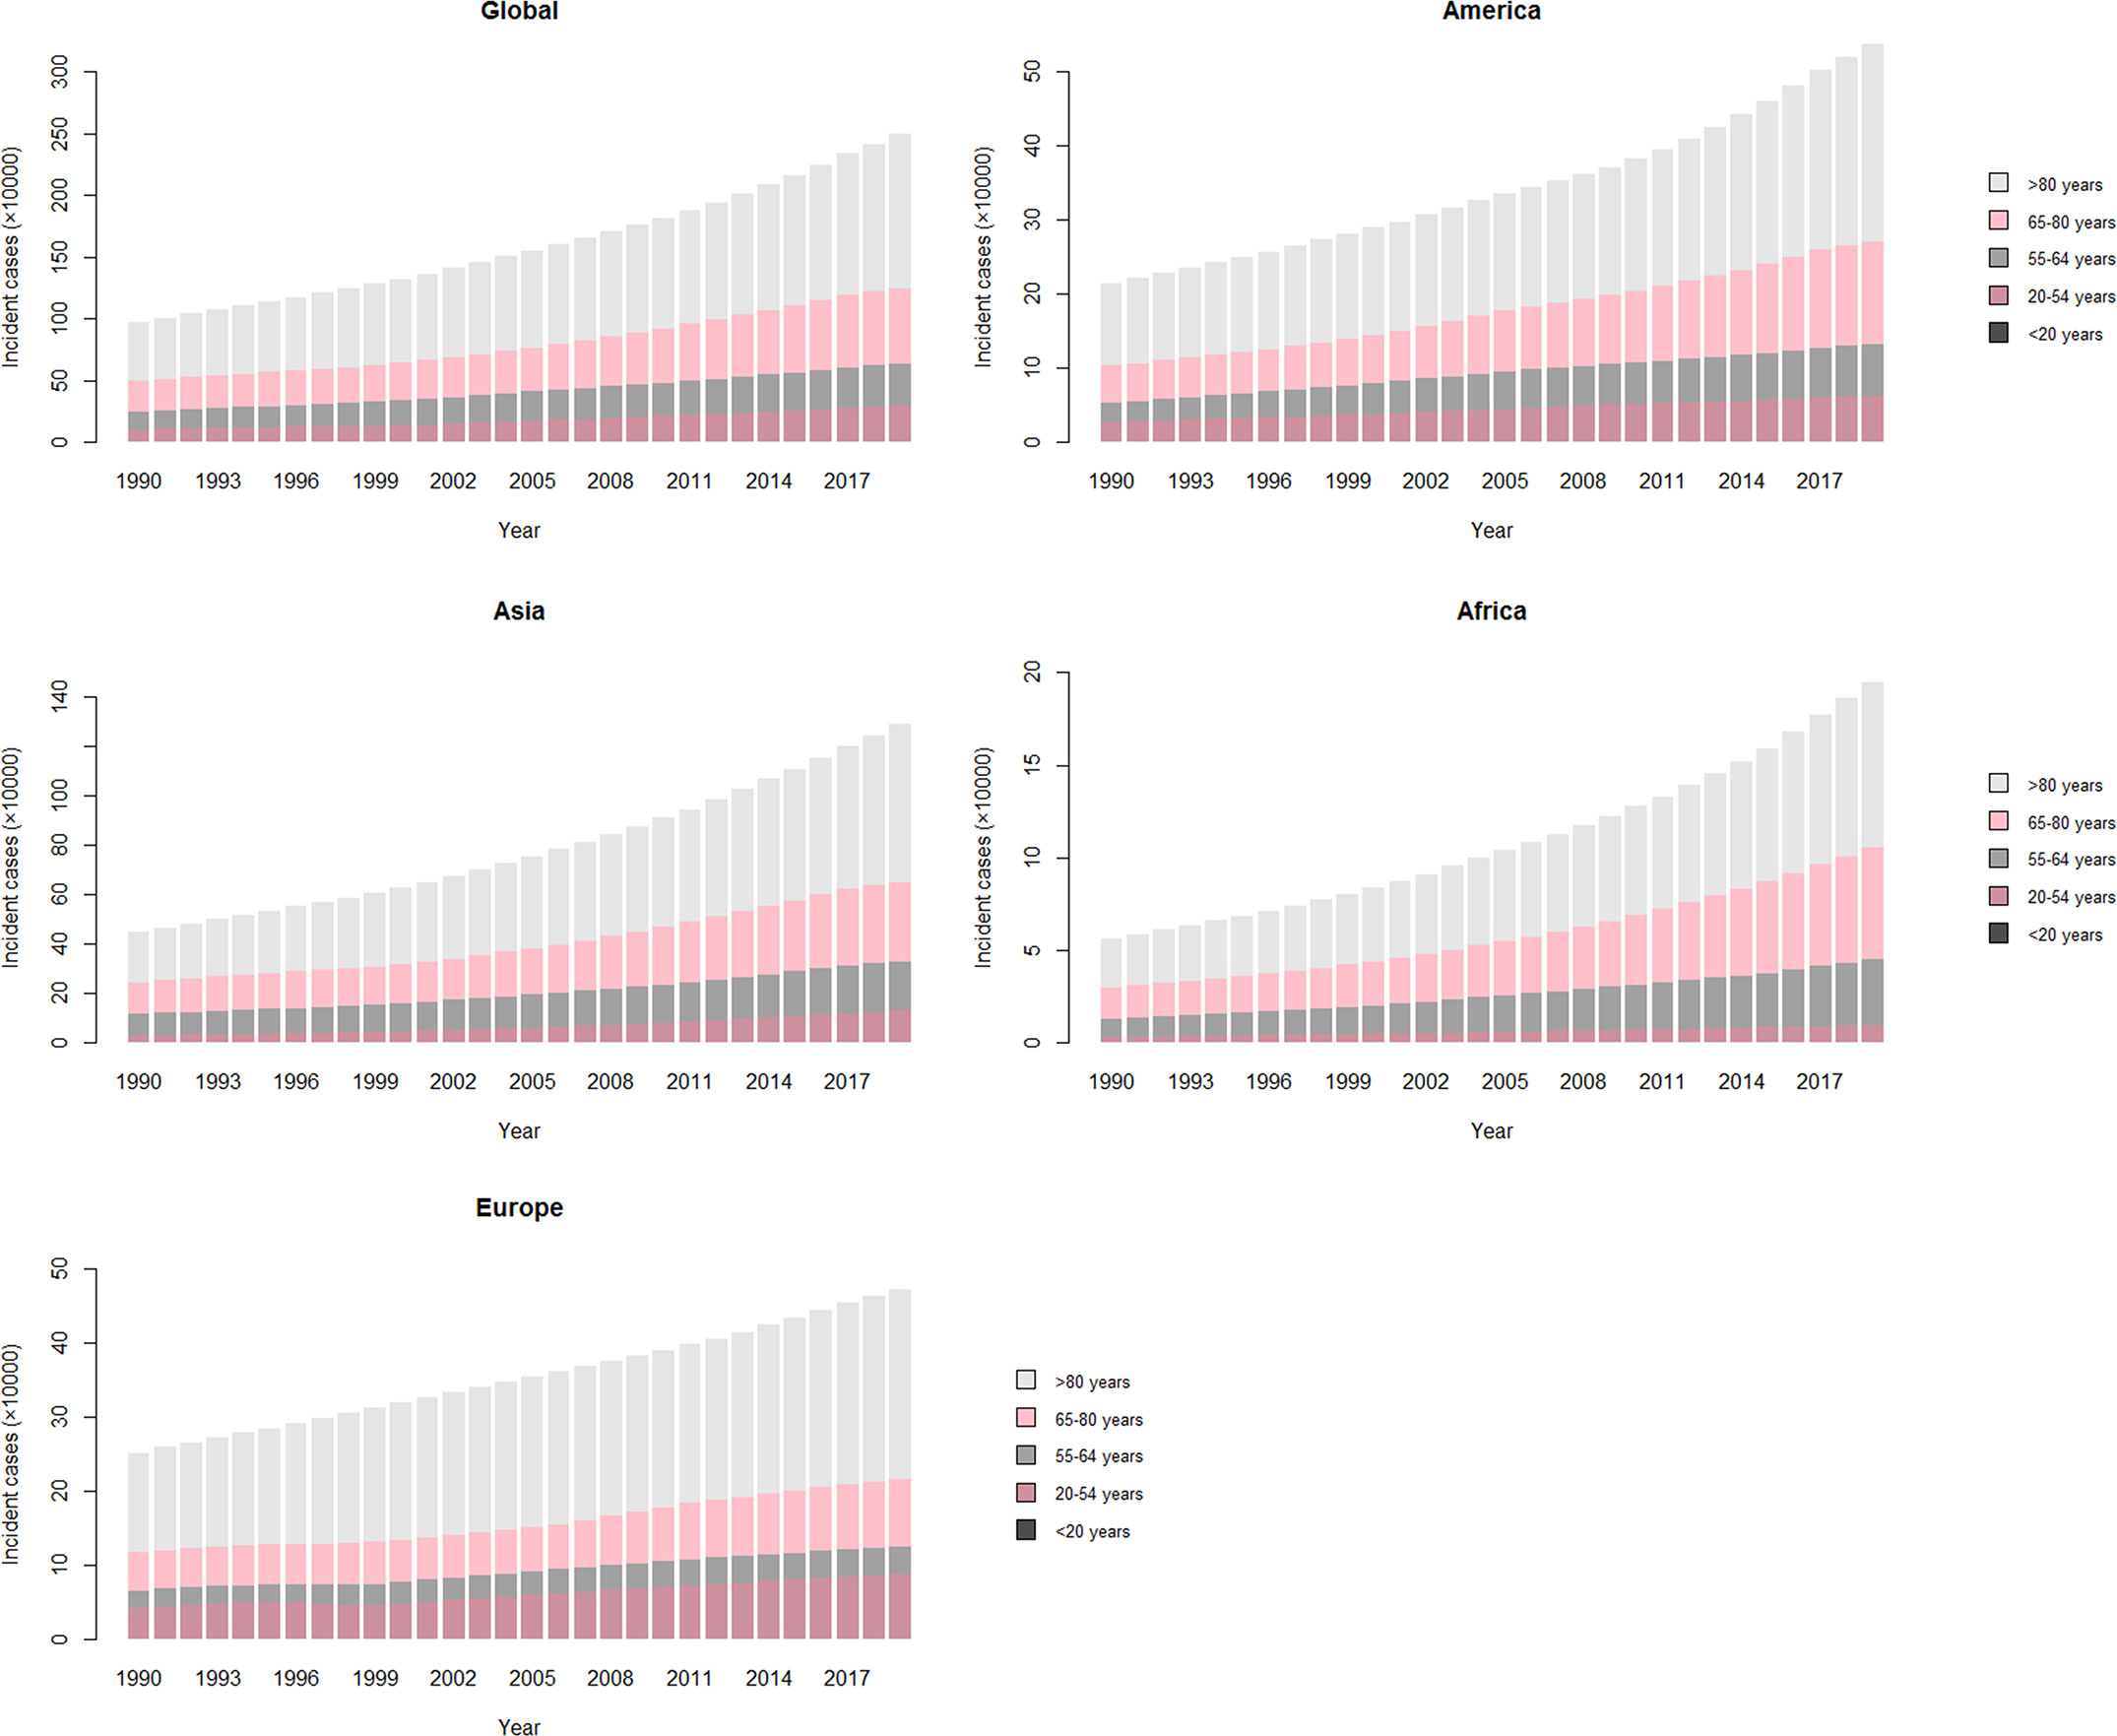
Figure 2 The number of type 2 diabetes–related CKD incident cases over 30 years. The vertical axis is the incident cases of type 2 diabetes–related CKD in four world regions (America, Asia, Africa, and Europe). The horizontal axis represents 30 years (1990–2019). Each column is the total number of incident cases among five age-groups (>80 years, 65–80 years, 55–64 years, 20–54 years, and <20 years) that year. CKD, chronic kidney disease.
SDI Findings
From 1990 to 2019, middle SDI quintile carried the heaviest burden of CKD-DM (Tables 1 and S1). Figure 3 shows the drift of CKD-DM among five SDI quintiles over 30 years. ASIR and ASPR of CKD-T1DM remained the highest in high SDI quintile, with the slowest increase (ASIR: EAPC = 0.90, 95% CI: 0.77–1.03; ASPR: EAPC = 0.74, 95% CI: 0.58–0.90), whereas they increased the fastest in middle SDI quintile (ASIR: EAPC = 1.53, 95% CI: 1.39–1.68; ASPR: EAPC = 1.62, 95% CI: 1.45–1.78), where they carried the highest age-standardized DALY rate (Table S2).
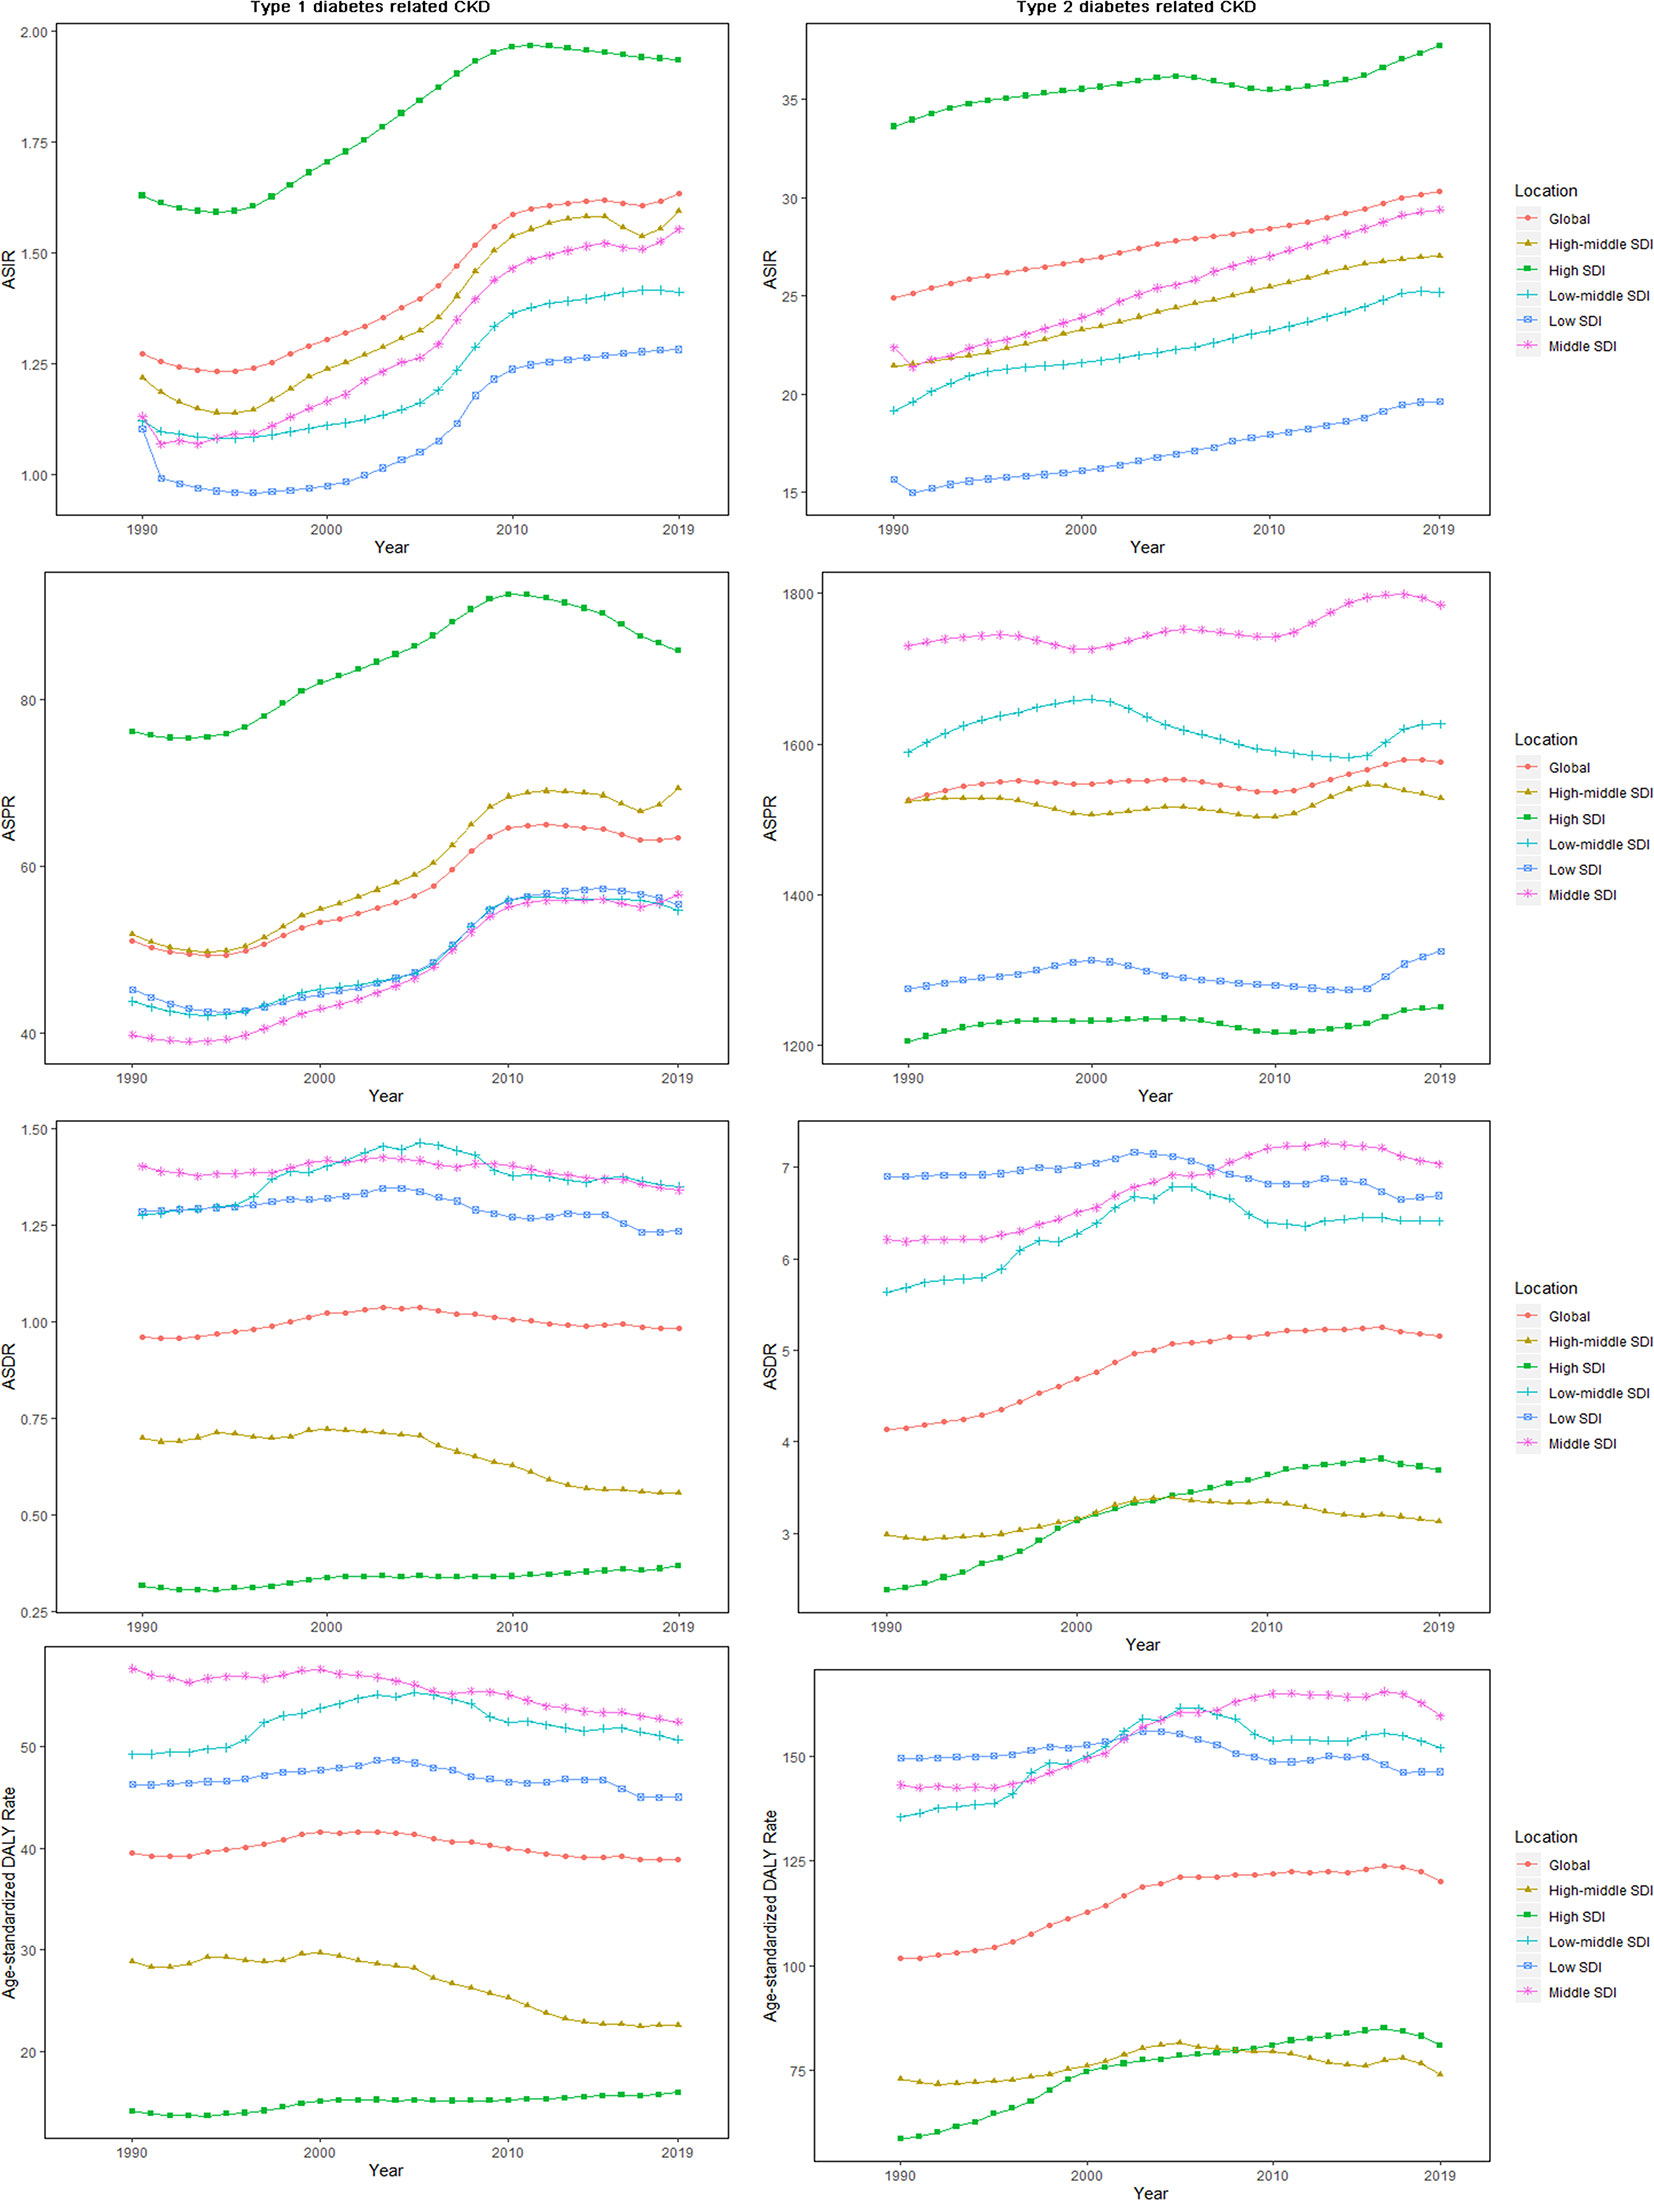
Figure 3 The age-standardized rates for CKD-DM among SDI quintiles over 30 years. The vertical axis is the age-standardized incidence, prevalence, death, and DALY rate (per 100,000 person-years), and the horizontal axis is the 30 years (1990–2019). Each point represents the age-standardized incidence, prevalence, death, and DALY rate (per 100,000 person-years) that year. Each color and shape represents an SDI quintile (Global, High SDI, High-middle SDI, Middle SDI, Low-middle SDI, and Low SDI). CKD-DM, type 1 diabetes–related chronic kidney disease; DALY, disability adjusted life-year; ASIR, age-standardized incidence rate; ASPR, age-standardized prevalence rate; ASDR, age-standardized death rate; SDI, socio-demographic index.
The ASIR of CKD-T2DM remained the highest in high SDI quintile, with the slowest increasing rate (EAPC = 0.25, 95% CI: 0.20–0.31). Among five SDI categories, ASIR (EAPC = 1.14, 95% CI: 1.09–1.19) and ASPR (EAPC = 0.12, 95% CI: 0.09–0.15) increased the fastest in middle SDI quintile. Only in low-middle SDI quintile did ASPR show a downward trend (EAPC = −0.08, 95% CI: −0.14–−0.01). ASDR and age-standardized DALY rate of CKD-T2DM increased the fastest in high SDI quintile (ASDR: EAPC = 1.72, 95% CI: 1.50–1.93; DALY: EAPC = 1.28, 95% CI: 1.09–1.47), especially for males (Table 2).
Figure 4 showed the variation of ASRs with the increase of SDI value among 21 regions. ASIR increased with the SDI value. As opposed to CKD-T1DM, ASPR of CKD-T2DM rose before SDI value of 0.5 and then began to decline again. As for ASDR and DALY, they had two turning points with SDI value of 0.6 and 0.8.
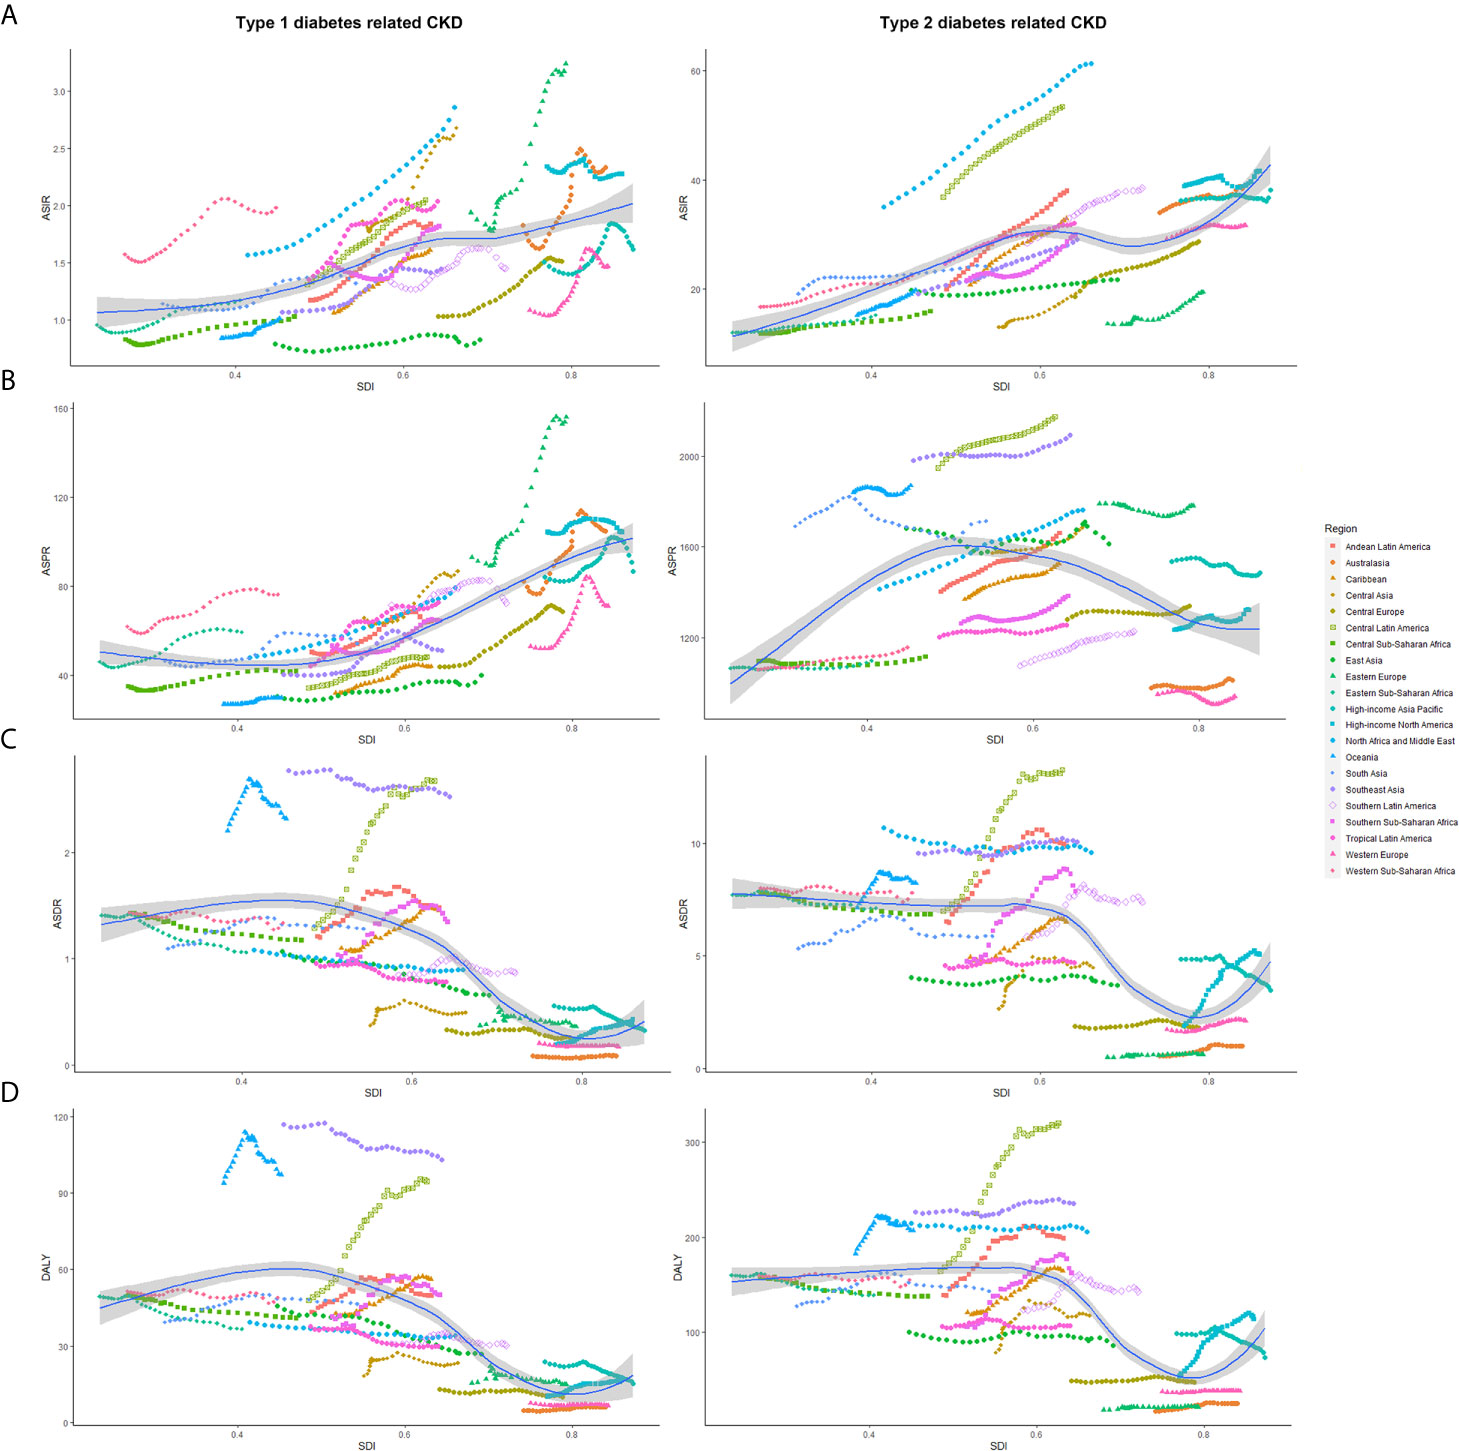
Figure 4 The age-standardized rates of CKD-DM among 21 regions based on SDI in 2019. The vertical axis is the age-standardized incidence, prevalence, death, and DALY rate (per 100,000 person-years), and the horizontal axis is the SDI value in 2019. Each combination of colors and shapes represents a region, 21 in total. Each point represents the age-standardized incidence, prevalence, death, and DALY rate (per 100,000 person-years) that year in this region. Each combination of the same color and shape, from front to back, is the data for each year from 1990 to 2019. (A) ASIR (per 100,000 population); (B) ASDR (per 100,000 population); (C) ASPR (per 100,000 population); (D) Age-standardized DALY rate (per 100,000 population). ASIR, age-standardized incidence rate; ASPR, age-standardized prevalence rate; ASDR, age-standardized death rate; CKD-DM, diabetes-related chronic kidney disease; DALY, disability adjusted life-year; SDI, socio-demographic index.
Regional Findings
Asia carried the heaviest burden of CKD-DM, especially in South and East (Tables 1 and S1). The region with the highest ASIR of CKD-T1DM changed from High-income North America in 1990 (ASIR: 2.34, 95% UI:1.99–2.73; ASPR: 104.38, 95% UI: 92.23–117.03) to Eastern Europe in 2019 (ASIR: 3.24, 95% UI: 2.70–3.87; ASPR: 156.02, 95% UI: 135.02–181.61, Table S2). Similarly, that with the highest ASIR of CKD-T2DM changed from High-income North America in 1990 (38.80, 95% UI: 34.84–43.15) to North Africa and Middle East in 2019 (61.33, 95% UI: 56.00–67.44).
ASIR and ASPR of CKD-T1DM increased in most regions, and the fastest in Eastern Europe (ASIR: EAPC = 2.46, 95% CI: 2.17–2.75; ASPR: EAPC = 2.41, 95% CI: 2.14–2.69). Only in High-income North America, the ASIR of CKD-T1DM decreased (EAPC = −0.11, 95% CI: −0.20–−0.02), with the slowest decrease of ASPR (EAPC = 0.11, 95% CI: 0.01–0.21, Table S2).
ASIR of CKD-T2DM increased in all regions, except for High-income Asia Pacific (EAPC = 0.03, 95% CI: −0.01–0.08) and High-income North America (EAPC = 0.09, 95% CI: −0.01–0.18). ASPR of CKD-T2DM decreased the fastest in South Asia (EAPC = −0.20, 95% CI: −0.31–−0.09). Alarmingly, both ASDR and age-standardized DALY rate of CKD-T2DM increased most rapidly in High-income North America (ASDR: EAPC = 3.58, 95% CI: 3.15–4.01; DALY: EAPC = 2.73, 95% CI: 2.38–3.08), but decreased largely in High-income Asia Pacific (ASDR: EAPC = −1.16, 95% CI: −1.30–−1.02; DALY: EAPC = −0.87, 95% CI: −1.06–−0.68, Table 2).
National Findings
The detailed data of CKD-T1DM and CKD-T2DM among 204 countries and territories are presented in Tables S3-6. China carried the highest burden of CKD-DM, followed by the United States and India. From 1990 to 2019, incident cases of CKD-T1DM increased the most in France (130.28%, 95% UI: 76.26–202.92, Table S3).
In 2019, people in China had the lowest ASIR of CKD-T1DM (0.81, 95% UI: 0.64–1.03). In addition, it increased faster in France than other countries (ASIR: EAPC = 3.00, 95% CI: 2.58–3.42). ASDR decreased most rapidly in Greece (EAPC = −4.57, 95% CI: −5.95–−3.17, Table S4).
Incident cases of CKD-T2DM increased in most countries and territories. The number of patients with CKD-T2DM increased most in Greenland (128.68%, 95% UI: 109.28–149.71), but decreased most in Afghanistan (−23.93%, 95% UI: −27.49–−19.84). Only in Solomon Islands, deaths and DALYs of CKD-T2DM decreased, and they grew largely in Armenia and El Salvador (Table S5). ASIR of CKD-T2DM increased faster in Morocco (EAPC = 2.73, 95% CI: 2.64–2.81) and Turkey (EAPC = 2.58, 95% CI: 2.37–2.79, Table S6).
Impairment Associated With CKD-DM
CKD-T1DM resulted in 655,237 cases of anemia in 2019 (mild: 56.62%; moderate: 40.27%; severe: 3.11%), increased by 82.32% over 30 years (Table 3). In addition, CKD-T2DM contributed to 566,181 cases of anemia in 2019 (mild: 62.19%; moderate: 34.51%; severe: 3.30%), increased by 138.55%. Years lived with disability (YLDs) of CKD-T1DM- and CKD-T2DM-related anemia grew by 56.61 and 102.88%, respectively (Table S7).
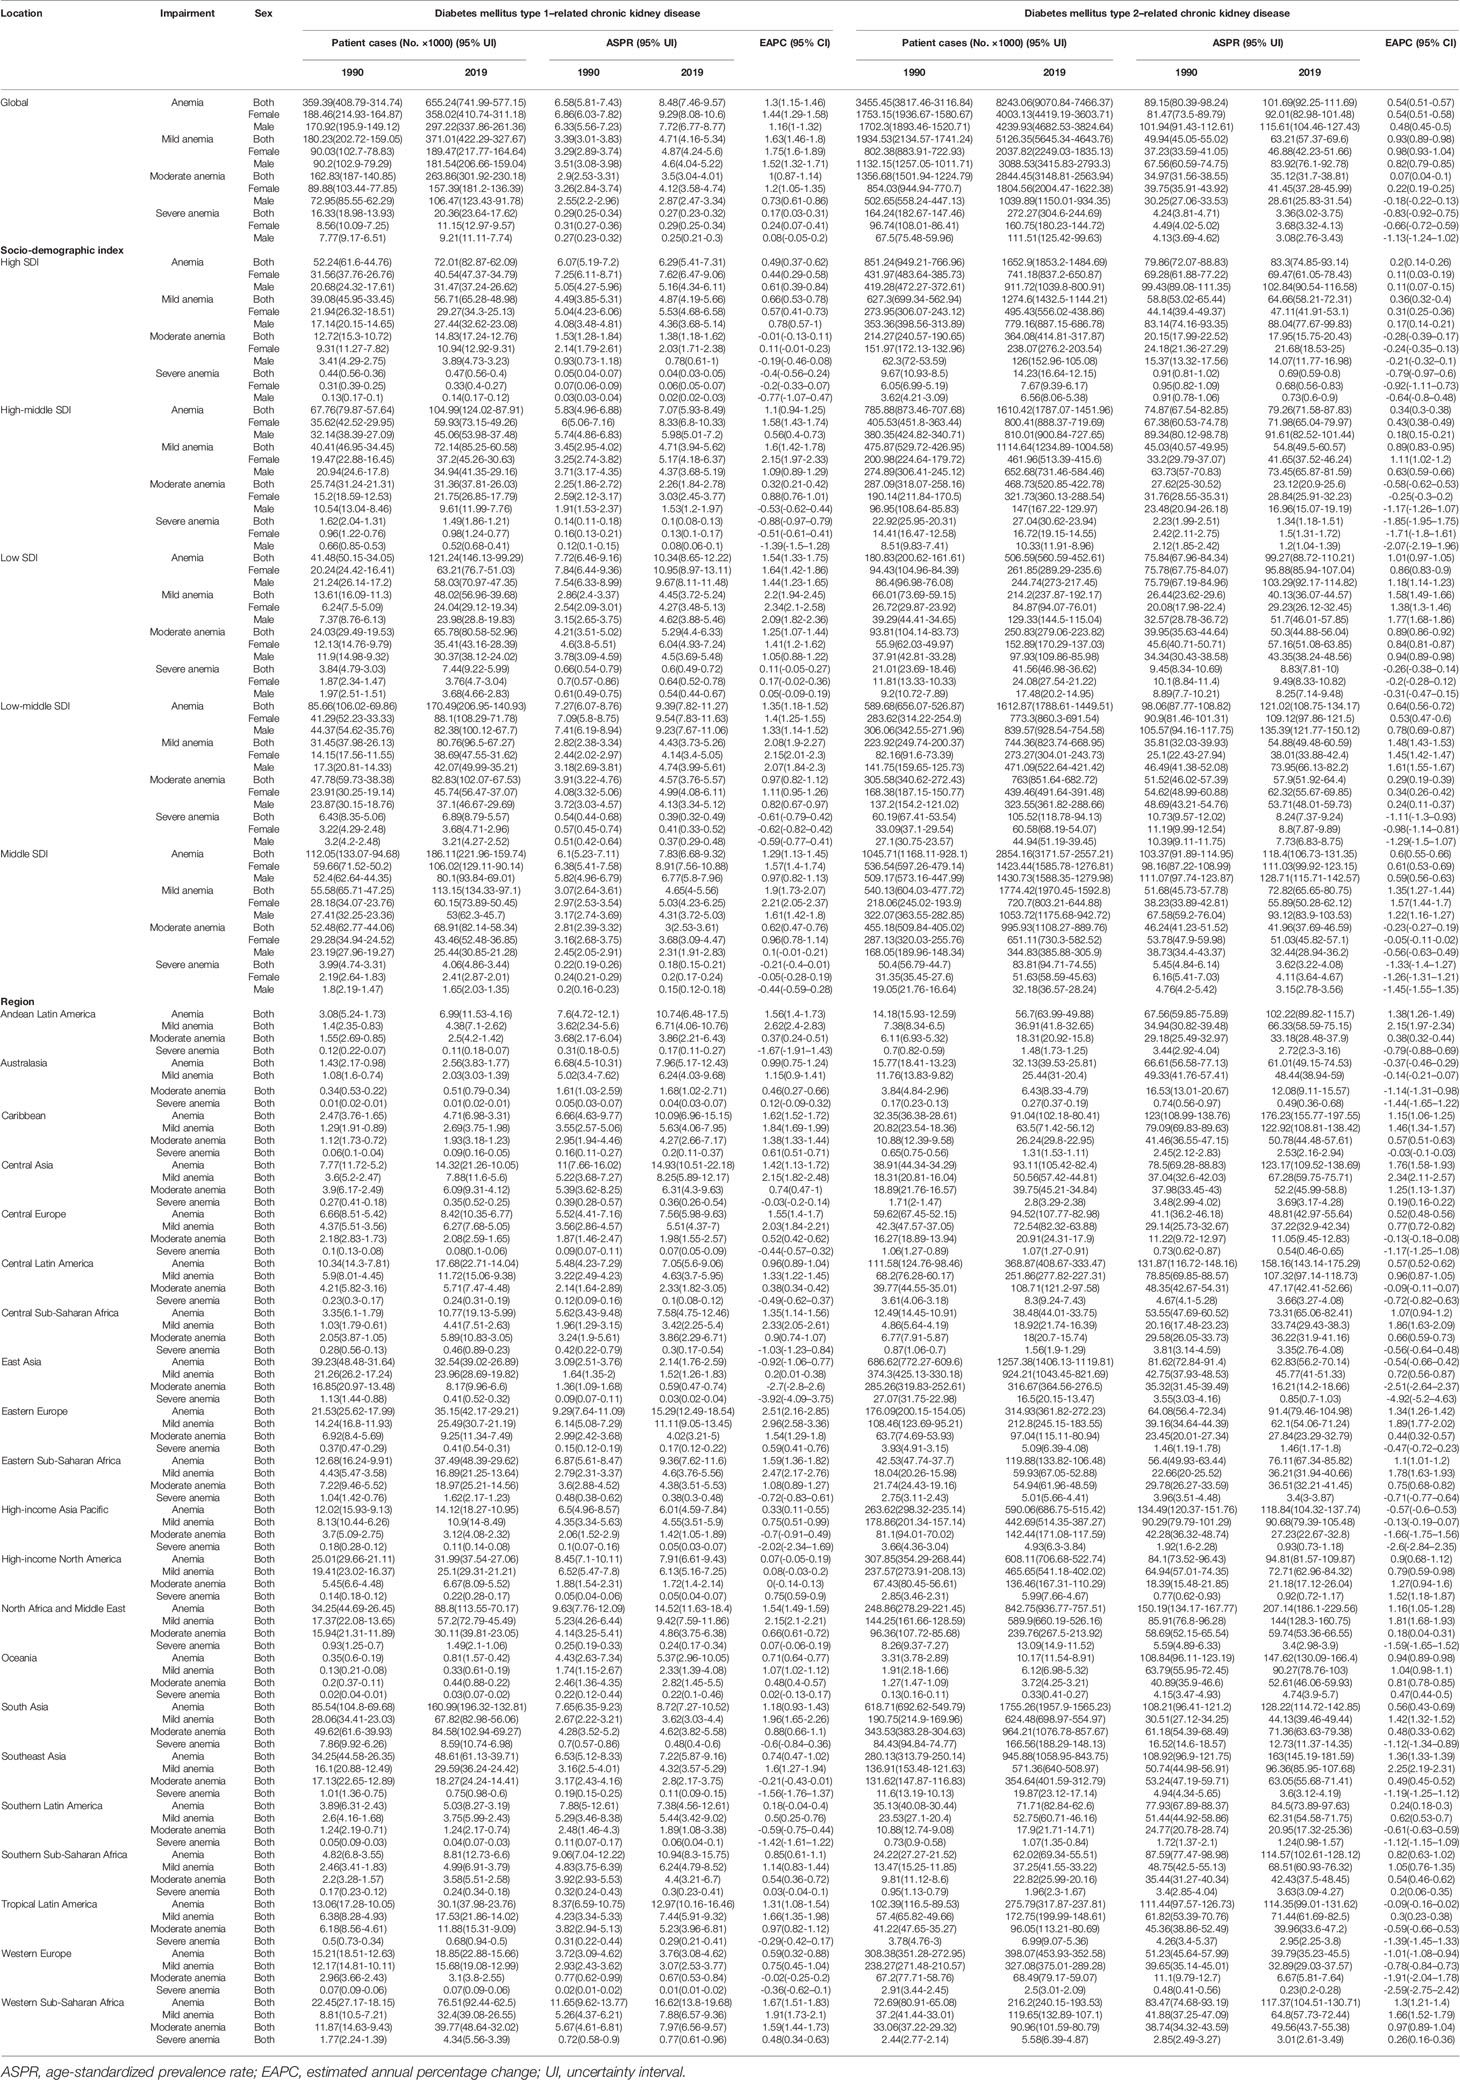
Table 3 The prevalent cases and ASPR of impairment caused by diabetes mellitus–related chronic kidney disease.
ASPR of CKD-T1DM-related anemia decreased only in East Asia (EAPC = −0.92, 95% CI: −1.06–−0.77), but increased the fastest in Eastern Europe (EAPC = 2.51, 95% CI: 2.16–2.85, Table 3). As for CKD-T2DM, it increased most rapidly in Central Asia (EAPC = 1.76, 95% CI: 1.58–1.93). YLDs rate of CKD-T2DM-related anemia increased only in low SDI quintile (EAPC = 0.50, 95% CI: 0.46–0.54), and it increased the fastest in High-income North America (EAPC = 1.20, 95% CI: 0.90–1.50, Table S7).
The prevalence and YLD rate of CKD-T2DM and CKD-T1DM was different among sex and age (Figure 5). The main onset age of CKD-T1DM-related anemia changed from 15–19 years in 1990 to 15–39 years for females. But that for males was stable, with two peaks at 15–19 and 55–59 years. The YLD rate of CKD-T1DM-related anemia was higher in females aged 15–24 years and in males aged 10–14 years. As for CKD-T2DM-related anemia, the prevalence and YLD rate increased with age.
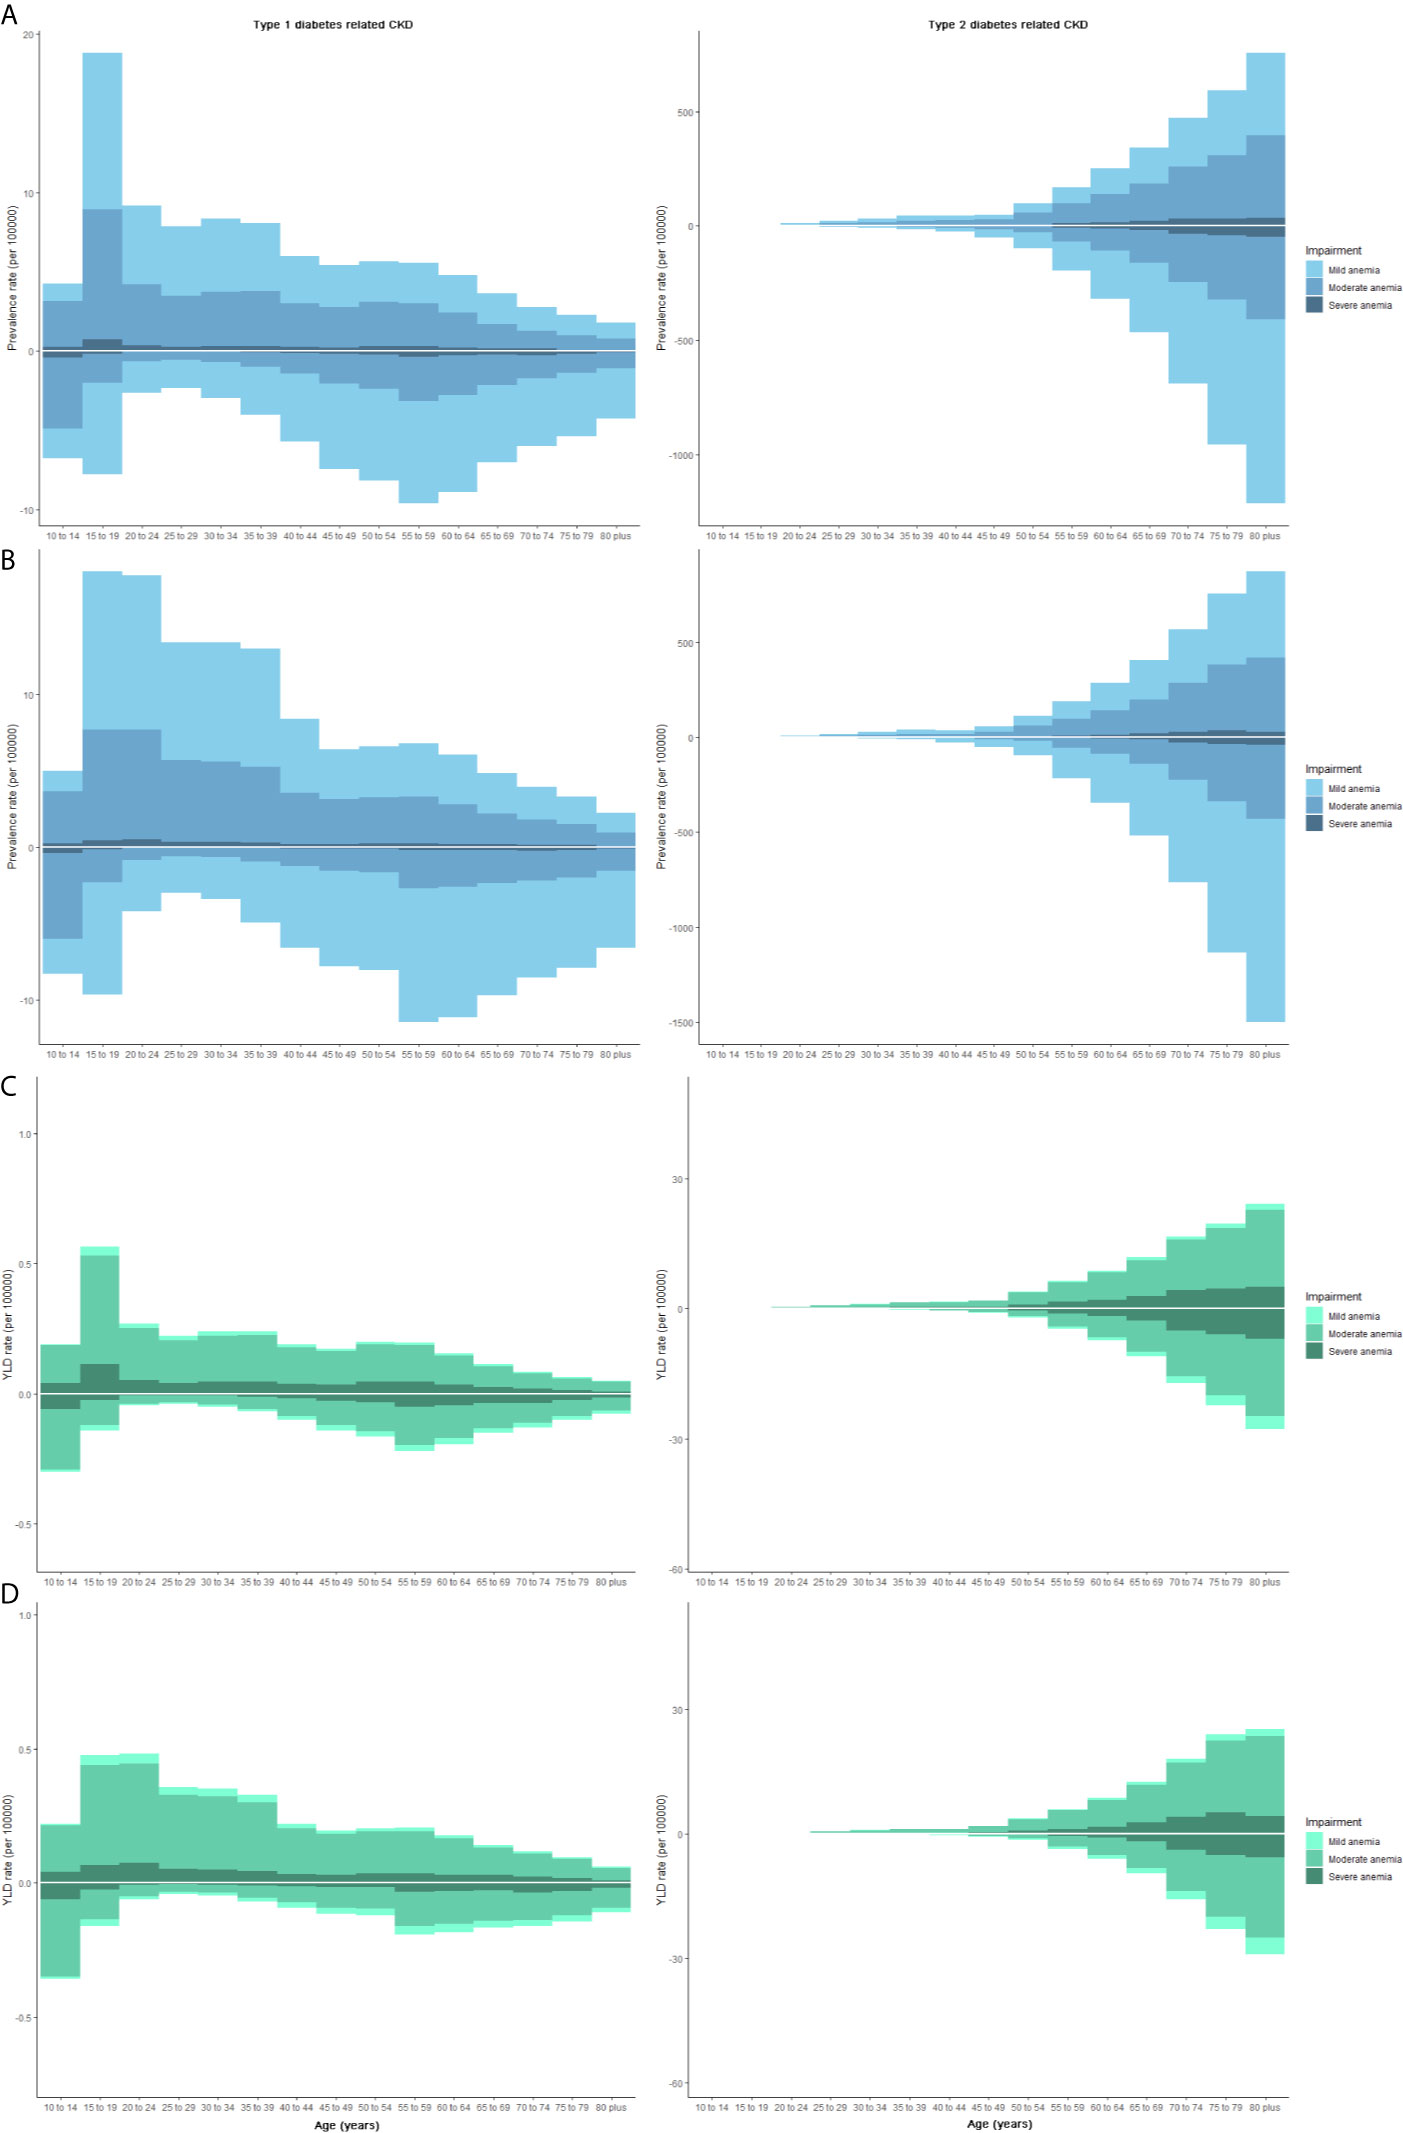
Figure 5 The prevalence and YLD rate of CKD-DM-related anemia at various age subgroups by gender. Each column represents the prevalence or YLD rate (per 100,000 people) of CKD-DM-related anemia (Three grades: mild, moderate, and severe). The upper column in each age-group is data for females, and the below column is for males. (A) Prevalence in 1990; (B) Prevalence in 2019; (C) YLD rate in 1990; (D) YLD rate in 2019. CKD, chronic kidney disease; YLD, years lived with disability.
Discussion
This study investigated the global, regional, and national disease burden of CKD-DM. Globally in 2019, there were 2.6 million incident cases, 135 million patients, 0.5 million deaths, and 13 million DALYs of CKD-DM, with a large increment as the global population grew. Further analysis showed that CKD-T2DM accounted for 95.32, 96.27, 83.20, and 75.38% of total CKD-DM incident cases, patients, deaths, and DALYs, respectively, reflecting the key role of type 2 diabetes in CKD development (20). All ASRs of CKD-T2DM increased from 1990 to 2019. All measured rates of CKD-T2DM increased with age, mirroring the cumulative risk effects of age. From the age of 50, all rates were higher in males than females. Interestingly, ASIR and ASPR of CKD-T1DM increased globally, whereas ASDR and age-standardized DALY rate decreased for women but increased for men. As for the sex difference, sex hormones had a vital role in the development of diabetes and renal complications (21). In a previous study, racial differences were observed between women and men in diabetes, and the relationship between life course and diabetes was peculiar to women (22).
In High-income North America, Eastern Europe, North Africa, and Middle East, ASIR of CKD-T1DM kept higher than other regions. One study reported that the incidence of ESRD in diabetic patients was 10 times higher than non-diabetic patients. In Australia, one of the high-income countries, diabetes had become the leading cause of ESRD over the past 20 years (23). The mortality in ESRD patients was 18.3 times higher than the general population (24). Nevertheless, not all patients with CKD-DM could receive renal replacement therapy, and 78% of patients lived in low- and middle-income countries, where resources, availability of dialysis, and kidney transplants were limited (25). However, the difference was not fully attributed to medical convenience. ASIR and ASPR of CKD-T1DM increased only in Eastern Europe, with the lowest ASDR of CKD-T2DM. ASIR of CKD-T1DM decreased only in High-income North America, but ASDR and DALY rate increased faster there. ASDR and DALY rate decreased faster in High-income Asia Pacific and East Asia. The difference of CKD-DM between regions might result from the gap in genetic, ethnic, and dietary risk factors.
Patients with CKD-T1DM- and CKD-T2DM-related anemia had doubled over the past 30 years. Anemia is a common complication of CKD. Among all causes of anemia, malaria, schistosomiasis, and CKD-related anemia have been on the rise (26). However, the severity and type of anemia were various among regions. The higher the SDI value, the lower the increasing rate of anemia-related ASPR, mirroring the gap in life and medical convenience among different SDI quintiles. Furthermore, there was 40% of the population with anemia in Ghana (27), a country in Western Sub-Saharan Africa, resulting from iron deficiency, hemoglobinopathies, micronutrient deficiency, and inflammation (26, 28). In addition, we should attach importance to the fast increase of ASPR in Central Asia. Conversely, in Western Europe, High-income Asia Pacific, and East Asia, ASPR of CKD-T2DM-related anemia decreased sharply, and the reasons should be further evaluated. In Austria, the incidence of type 1 diabetes is increasing in children aged 5 to 14 years (29). Alarmingly, for CKD-T1DM-related anemia, patients aged of 10–14 years mainly suffered moderate anemia, more severe than other age-groups, which we should pay attention to.
In many cases, the burden of CKD-DM is determined by various factors, which caused gaps in the CKD prevention and management capabilities worldwide (30). Our results reflected a shift of CKD-T1DM burden from high to low SDI quintile, but the ASDR and DALY rate of CKD-DM increased faster in high SDI quintile, which was not fully attributed to medical environment and renal replacement therapies (31). Global burden of CKD-DM was concentrated in middle SDI quintiles, especially in developing countries (20). Additionally, ASIR of CKD-DM increased with SDI value, revealing racial differences in disease susceptibility and medical disparities (32, 33). The variation in CKD-DM epidemiology reflects huge regional inequities in preventive care (34). White European individuals were reported to have a higher prevalence of CKD-T1DM (35). Race influenced mortality in patients with type 2 diabetes and multiple chronic conditions (36). Some studies explained it by economic inequality, socioeconomic status, and segregation (37–39).
Understanding the burden of CKD-DM in various countries benefited equal kidney health. China, India, and the USA carrying high disease burden for CKD-DM might partly be owing to their high populations. Notably, China had the lowest ASIR of CKD-T1DM. ASPR of CKD-T1DM was higher in Russia, Canada, and Mongolia. This was partially attributed to high prevalence of type 2 diabetes, improvements on CKD screening (40), and the relatively stagnant progress in addressing CKD-DM burden.
Although aging and population growth contributed to the increased burden of CKD-DM, risk factors such as diet and metabolism were involved. A study on children stated that type 1 diabetes was associated with younger age at ESRD onset, whereas type 2 diabetes was related to a higher mortality rate (41). The presence of diabetic nephropathy was associated with age, duration of diabetes, and poor glycemic control (42).
Almost one in five CKDs was caused by diabetes (10). Moreover, less than half of the patients were tested for urinary albumin, an early marker of kidney disease caused by diabetes (43). Many countries still lack a well-trained team of kidney experts and universal access to primary health care and renal replacement therapy. Screening for kidney function in diabetic patients as well as raising awareness are necessary for the early detection of CKD. Reducing the burden of CKD-DM should be reflected in the government’s health priorities and resource allocation measures, focusing on prevention, early control, and delayed progress.
Some inevitable limitations should be taken into consideration in the interpretation of our findings. The GBD study estimated the burden of CKD by relying on statistical methods and predicted covariant values. GBD data come from census, disease registration, household survey, health service usage, air pollution monitoring, disease notification civil registration and vital statistics, and other sources. High-quality results were based on well-established medical registration systems in some countries, such as China, USA, India, Australia, UK, Russia, and so on. GBD 2019 location hierarchy includes all WHO member states. Large, high-quality, population-based studies of CKD are scarce in some countries or territories, such as Cook Islands, Niue, Vatican City, Liechtenstein, Order of Malta, Palestine. There was inevitable information bias of primary data in those districts. Therefore, when specific data were applied to countries or territories that are not members of the World Health Organization, and areas with underdeveloped medical systems, the findings need to be interpreted with caution. Due to the limited data, we cannot further investigate the burden of CKD-DM at different stages. A greater investment is still needed to improve vital registration and data collection in developing countries. Despite these limitations, the findings from this analysis add novel knowledge on the global burden of CKD-DM.
Conclusion
From 1990 to 2019, the increasing burden of CKD-DM varied among regions and countries. All ASRs of CKD-T2DM exhibited upward trends, and from the age of 50, all rates were higher in males than females. ASIR of CKD-DM increased with SDI value. Middle SDI quintile accounted for the majority burden of CKD-DM worldwide. Asia carried the heaviest burden of CKD-DM, especially in South and East. The three countries with the highest burden of CKD-DM were China, the United States, and India. CKD-T2DM patients with anemia were mainly in mild to moderate grade for females, and in mild grade for males. Anemia-related YLD was mainly in moderate grade. These findings could help guide the epidemiological monitoring of this disease and prioritize the most appropriate health interventions.
Data Availability Statement
The original contributions presented in the study are included in the article/Supplementary Material. Further inquiries can be directed to the corresponding author.
Ethics Statement
The studies involving human participants were reviewed and approved by Ethics Committee of the Second Affiliated Hospital, College of Medicine, Xi’an Jiaotong University. Written informed consent from the participants’ legal guardian/next of kin was not required to participate in this study in accordance with the national legislation and the institutional requirements.
Author Contributions
All authors contributed to the article and approved the submitted version. ZD, JG, and YD designed the study. YD, YW, MW, and SY conducted the initial searches. YiZ and XD collected the data and verified the accuracy of the data. DX and YuZ contributed to data interpretation. YD, ZZ, and DZ performed the statistical analysis and visualization. YD wrote and revised the manuscript.
Conflict of Interest
The authors declare that the research was conducted in the absence of any commercial or financial relationships that could be construed as a potential conflict of interest.
Acknowledgments
The authors analyzed and interpreted the data for this manuscript. All aspects of manuscript writing were carried out by the authors.
Supplementary Material
The Supplementary Material for this article can be found online at: https://www.frontiersin.org/articles/10.3389/fendo.2021.672350/full#supplementary-material
Abbreviations
ASIR, age-standardized incidence rate; ASPR, age-standardized prevalence rate; ASDR, age-standardized death rate; CKD-DM, chronic kidney disease caused by diabetes; DALY, disability adjusted life-year; EAPC, estimated annual percentage change; SDI, socio-demographic index; UI, uncertainty interval; YLD, years lived with disability.
References
1. Wilson S, Mone P, Jankauskas SS, Gambardella J, Santulli G. Chronic Kidney Disease: Definition, Updated Epidemiology, Staging, and Mechanisms of Increased Cardiovascular Risk. J Clin Hypertens (Greenwich) (2021) 23:831–4. doi: 10.1111/jch.14186
2. Crews DC, Bello AK, Saadi G. Burden, Access, and Disparities in Kidney Disease. J Nephrol (2019) 32:1–8. doi: 10.1007/s40620-019-00590-6
3. Jager KJ, Fraser SDS. The Ascending Rank of Chronic Kidney Disease in the Global Burden of Disease Study. Nephrol Dial Transplant (2017) 32:ii121–8. doi: 10.1093/ndt/gfw330
4. GBD 2017 Disease and Injury Incidence and Prevalence Collaborators. Global, Regional, and National Incidence, Prevalence, and Years Lived With Disability for 354 Diseases and Injuries for 195 Countries and Territories, 1990-2017: A Systematic Analysis for the Global Burden of Disease Study 2017. Lancet (Lond Engl) (2018) 392:1789–858. doi: 10.1016/S0140-6736(18)32279-7
5. GBD 2017 DALYs and HALE Collaborators. Global, Regional, and National Disability-Adjusted Life-Years (DALYs) for 359 Diseases and Injuries and Healthy Life Expectancy (HALE) for 195 Countries and Territories, 1990-2017: A Systematic Analysis for the Global Burden of Disease Study 2017. Lancet (Lond Engl) (2018) 392:1859–922. doi: 10.1016/S0140-6736(18)32335-3
6. Glassock RJ, Warnock DG, Delanaye P. The Global Burden of Chronic Kidney Disease: Estimates, Variability and Pitfalls. Nat Rev Nephrol (2017) 13:104–14. doi: 10.1038/nrneph.2016.163
7. Hansson E, Mansourian A, Farnaghi M, Petzold M, Jakobsson K. An Ecological Study of Chronic Kidney Disease in Five Mesoamerican Countries: Associations With Crop and Heat. BMC Public Health (2021) 21:840. doi: 10.1186/s12889-021-10822-9
8. Bjornstad P, Cherney DZ. Renal Hyperfiltration in Adolescents With Type 2 Diabetes: Physiology, Sex Differences, and Implications for Diabetic Kidney Disease. Curr Diabetes Rep (2018) 18:22. doi: 10.1007/s11892-018-0996-2
9. Koye DN, Magliano DJ, Nelson RG, Pavkov ME. The Global Epidemiology of Diabetes and Kidney Disease. Adv Chronic Kidney Dis (2018) 25:121–32. doi: 10.1053/j.ackd.2017.10.011
10. GBD Chronic Kidney Disease Collaboration Global, Regional, and National Burden of Chronic Kidney Disease, 1990-2017: A Systematic Analysis for the Global Burden of Disease Study 2017. Lancet (Lond Engl) (2020) 395:709–33. doi: 10.1016/S0140-6736(20)30045-3
11. Fraser SDS, Roderick PJ. Kidney Disease in the Global Burden of Disease Study 2017. Nat Rev Nephrol (2019) 15:193–4. doi: 10.1038/s41581-019-0120-0
12. Roumeliotis S, Mallamaci F, Zoccali C. Endothelial Dysfunction in Chronic Kidney Disease, From Biology to Clinical Outcomes: A 2020 Update. J Clin Med (2020) 9:2359. doi: 10.3390/jcm9082359
13. Hu Y, Lei M, Ke G, Huang X, Peng X, Zhong L, et al. Metformin Use and Risk of All-Cause Mortality and Cardiovascular Events in Patients With Chronic Kidney Disease-A Systematic Review and Meta-Analysis. Front Endocrinol (Lausanne) (2020) 11:559446. doi: 10.3389/fendo.2020.559446
14. Bowe B, Xie Y, Li T, Mokdad AH, Xian H, Yan Y, et al. Changes in the US Burden of Chronic Kidney Disease From 2002 to 2016: An Analysis of the Global Burden of Disease Study. JAMA Netw Open (2018) 1:e184412. doi: 10.1001/jamanetworkopen.2018.4412
15. Nahvijou A, Arab M, Faramarzi A, Hashemi SY, Javan-Noughabi J. Burden of Esophageal Cancer According to World Health Organization Regions: Review of Findings From the Global Burden of Disease Study 2015. Health Scope (2019) 8:e64984. doi: 10.5812/jhealthscope.64984
16. Rahmani H, Sarabi Asiabar A, Niakan S, Hashemi SY, Faramarzi A, Manuchehri S, et al. Burden of Esophageal Cancer in Iran During 1995-2015: Review of Findings From the Global Burden of Disease Studies. Med J Islam Repub Iran (2018) 32:55. doi: 10.14196/mjiri.32.55
17. Chertow GM, Pergola PE, Farag YMK, Agarwal R, Arnold S, Bako G, et al. Vadadustat in Patients With Anemia and Non-Dialysis-Dependent CKD. N Engl J Med (2021) 384:1589–600. doi: 10.1056/NEJMoa2035938
18. Deng Y, Zhao P, Zhou L, Xiang D, Hu J, Liu Y, et al. Epidemiological Trends of Tracheal, Bronchus, and Lung Cancer at the Global, Regional, and National Levels: A Population-Based Study. J Hematol Oncol (2020) 13:98. doi: 10.1186/s13045-020-00915-0
19. Deng Y, Li H, Wang M, Li N, Tian T, Wu Y, et al. Global Burden of Thyroid Cancer From 1990 to 2017. JAMA Netw Open (2020) 3:e208759. doi: 10.1001/jamanetworkopen.2020.8759
20. Shaw JE, Sicree RA, Zimmet PZ. Global Estimates of the Prevalence of Diabetes for 2010 and 2030. Diabetes Res Clin Pract (2010) 87:4–14. doi: 10.1016/j.diabres.2009.10.007
21. Shepard BD. Sex Differences in Diabetes and Kidney Disease: Mechanisms and Consequences. Am J Physiol Renal Physiol (2019) 317:F456–f462. doi: 10.1152/ajprenal.00249.2019
22. Insaf TZ, Strogatz DS, Yucel RM, Chasan-Taber L, Shaw BA. Associations Between Race, Lifecourse Socioeconomic Position and Prevalence of Diabetes Among US Women and Men: Results From a Population-Based Panel Study. J Epidemiol Community Health (2014) 68:318–25. doi: 10.1136/jech-2013-202585
23. White S, Chadban S. Diabetic Kidney Disease in Australia: Current Burden and Future Projections. Nephrology (Carlton Vic) (2014) 19:450–8. doi: 10.1111/nep.12281
24. Groop PH, Thomas MC, Moran JL, Wadèn J, Thorn LM, Mäkinen VP, et al. The Presence and Severity of Chronic Kidney Disease Predicts All-Cause Mortality in Type 1 Diabetes. Diabetes (2009) 58:1651–8. doi: 10.2337/db08-1543
25. U.S.R.D. System. 2016 USRDS Annual Data Report: Epidemiology of Kidney Disease in the United States. National Institutes of Health, National Institute of Diabetes and Digestive and Kidney Disease. Am J Kidney Dis (2017) 69(3 Suppl 1):A7–A8. doi: 10.1053/j.ajkd.2016.12.004
26. Kassebaum NJ, Jasrasaria R, Naghavi M, Wulf SK, Johns N, Lozano R, et al. A Systematic Analysis of Global Anemia Burden From 1990 to 2010. Blood (2014) 123:615–24. doi: 10.1182/blood-2013-06-508325
27. Global Burden of Disease Study 2013 Collaborators. Global, Regional, and National Incidence, Prevalence, and Years Lived With Disability for 301 Acute and Chronic Diseases and Injuries in 188 Countries, 1990-2013: A Systematic Analysis for the Global Burden of Disease Study 2013. Lancet (Lond Engl) (2015) 386:743–800. doi: 10.1016/S0140-6736(15)60692-4
28. Wirth JP, Rohner F, Woodruff BA, Chiwile F, Yankson H, Koroma AS, et al. Anemia, Micronutrient Deficiencies, and Malaria in Children and Women in Sierra Leone Prior to the Ebola Outbreak - Findings of a Cross-Sectional Study. PloS One (2016) 11:e0155031. doi: 10.1371/journal.pone.0155031
29. Rami-Merhar B, Hofer SE, Fröhlich-Reiterer E, Waldhoer T, Fritsch M. Time Trends in Incidence of Diabetes Mellitus in Austrian Children and Adolescents <15 Years (1989-2017). Pediatr Diabetes (2020) 21:720–6. doi: 10.1111/pedi.13038
30. Tirapani LDS, Fernandes N. A Narrative Review of the Impacts of Income, Education, and Ethnicity on Arterial Hypertension, Diabetes Mellitus, and Chronic Kidney Disease in the World. Saudi J Kidney Dis Transpl (2019) 30:1084–96. doi: 10.4103/1319-2442.270264
31. Kaze AD, Ilori T, Jaar BG, Echouffo-Tcheugui JB. Burden of Chronic Kidney Disease on the African Continent: A Systematic Review and Meta-Analysis. BMC Nephrol (2018) 19:125. doi: 10.1186/s12882-018-0930-5
32. Liu J, Ren ZH, Qiang H, Wu J, Shen M, Zhang L, et al. Trends in the Incidence of Diabetes Mellitus: Results From the Global Burden of Disease Study 2017 and Implications for Diabetes Mellitus Prevention. BMC Public Health (2020) 20:1415. doi: 10.1186/s12889-020-09502-x
33. Motala AA, Omar MA, Pirie FJ. Diabetes in Africa. Epidemiology of Type 1 and Type 2 Diabetes in Africa. J Cardiovasc Risk (2003) 10:77–83. doi: 10.1177/174182670301000202
34. Horlyck-Romanovsky MF, Wyka K, Echeverria SE, Leung MM, Fuster M, Huang TT. Foreign-Born Blacks Experience Lower Odds of Obesity But Higher Odds of Diabetes Than US-Born Blacks in New York City. J Immigr Minor Health (2019) 21:47–55. doi: 10.1007/s10903-018-0708-7
35. Wunna W, Tsoutsouki J, Chowdhury A, Chowdhury TA. Advances in the Management of Diabetes: New Devices for Type 1 Diabetes. Postgrad Med J (2020) 97(1148):384–90. doi: 10.1136/postgradmedj-2020-138016
36. Clements JM, West BT, Yaker Z, Lauinger B, McCullers D, Haubert J, et al. Disparities in Diabetes-Related Multiple Chronic Conditions and Mortality: The Influence of Race. Diabetes Res Clin Pract (2020) 159:107984. doi: 10.1016/j.diabres.2019.107984
37. Golden SH, Brown A, Cauley JA, Chin MH, Gary-Webb TL, Kim C, et al. Health Disparities in Endocrine Disorders: Biological, Clinical, and Nonclinical Factors–An Endocrine Society Scientific Statement. J Clin Endocrinol Metab (2012) 97:E1579–639. doi: 10.1210/jc.2012-2043
38. Rosenstock S, Whitman S, West JF, Balkin M. Racial Disparities in Diabetes Mortality in the 50 Most Populous US Cities. J Urban Health (2014) 91:873–85. doi: 10.1007/s11524-013-9861-4
39. Lanting LC, Joung IM, Mackenbach JP, Lamberts SW, Bootsma AH. Ethnic Differences in Mortality, End-Stage Complications, and Quality of Care Among Diabetic Patients: A Review. Diabetes Care (2005) 28:2280–8. doi: 10.2337/diacare.28.9.2280
40. Myers OB, Pankratz VS, Norris KC, Vassalotti JA, Unruh ML, Argyropoulos C. Surveillance of CKD Epidemiology in the US - a Joint Analysis of NHANES and KEEP. Sci Rep (2018) 8:15900. doi: 10.1038/s41598-018-34233-w
41. Pleniceanu O, Twig G, Tzur D, Gruber N, Stern-Zimmer M, Afek A, et al. Kidney Failure Risk in Type 1 vs. Type 2 Childhood-Onset Diabetes Mellitus. Pediatr Nephrol (2020) 36(2):333–40. doi: 10.1007/s00467-020-04631-2
42. Pacilli A, Viazzi F, Fioretto P, Giorda C, Ceriello A, Genovese S, et al. Epidemiology of Diabetic Kidney Disease in Adult Patients With Type 1 Diabetes in Italy: The AMD-Annals Initiative. Diabetes Metab Res Rev (2017) 33:e2873. doi: 10.1002/dmrr.2873
Keywords: diabetes-related chronic kidney disease, mortality, disability-adjusted life-years, incidence, prevalence
Citation: Deng Y, Li N, Wu Y, Wang M, Yang S, Zheng Y, Deng X, Xiang D, Zhu Y, Xu P, Zhai Z, Zhang D, Dai Z and Gao J (2021) Global, Regional, and National Burden of Diabetes-Related Chronic Kidney Disease From 1990 to 2019. Front. Endocrinol. 12:672350. doi: 10.3389/fendo.2021.672350
Received: 26 February 2021; Accepted: 17 June 2021;
Published: 01 July 2021.
Edited by:
Gaetano Santulli, Columbia University, United StatesReviewed by:
Seyed Yaser Hashemi, Tehran University of Medical Sciences, IranRobert Stanton, Joslin Diabetes Center and Harvard Medical School, United States
Guangming Jin, Sun Yat-sen University, China
Copyright © 2021 Deng, Li, Wu, Wang, Yang, Zheng, Deng, Xiang, Zhu, Xu, Zhai, Zhang, Dai and Gao. This is an open-access article distributed under the terms of the Creative Commons Attribution License (CC BY). The use, distribution or reproduction in other forums is permitted, provided the original author(s) and the copyright owner(s) are credited and that the original publication in this journal is cited, in accordance with accepted academic practice. No use, distribution or reproduction is permitted which does not comply with these terms.
*Correspondence: Jie Gao, Z3hlal9jbkBzaW5hLmNvbQ==
†These authors have contributed equally to this work