 Paul G. Weightman Potter1†
 Sam J. Washer1†
 Aaron R. Jeffries1Janet E. Holley2Nick J. Gutowski2
 Emma L. Dempster1*‡
 Craig Beall1*‡
- 1Institute of Biomedical and Clinical Sciences, University of Exeter Medical School, Exeter, United Kingdom
- 2Royal Devon and Exeter Hospital, University of Exeter Medical School and the Department of Neurology, Exeter, United Kingdom
Aims/hypothesis: Recurrent hypoglycaemia (RH) is a major side-effect of intensive insulin therapy for people with diabetes. Changes in hypoglycaemia sensing by the brain contribute to the development of impaired counterregulatory responses to and awareness of hypoglycaemia. Little is known about the intrinsic changes in human astrocytes in response to acute and recurrent low glucose (RLG) exposure.
Methods: Human primary astrocytes (HPA) were exposed to zero, one, three or four bouts of low glucose (0.1 mmol/l) for three hours per day for four days to mimic RH. On the fourth day, DNA and RNA were collected. Differential gene expression and ontology analyses were performed using DESeq2 and GOseq, respectively. DNA methylation was assessed using the Infinium MethylationEPIC BeadChip platform.
Results: 24 differentially expressed genes (DEGs) were detected (after correction for multiple comparisons). One bout of low glucose exposure had the largest effect on gene expression. Pathway analyses revealed that endoplasmic-reticulum (ER) stress-related genes such as HSPA5, XBP1, and MANF, involved in the unfolded protein response (UPR), were all significantly increased following low glucose (LG) exposure, which was diminished following RLG. There was little correlation between differentially methylated positions and changes in gene expression yet the number of bouts of LG exposure produced distinct methylation signatures.
Conclusions/interpretation: These data suggest that exposure of human astrocytes to transient LG triggers activation of genes involved in the UPR linked to endoplasmic reticulum (ER) stress. Following RLG, the activation of UPR related genes was diminished, suggesting attenuated ER stress. This may be a consequence of a successful metabolic adaptation, as previously reported, that better preserves intracellular energy levels and a reduced necessity for the UPR.
Introduction
Iatrogenic hypoglycaemia is a limiting factor to optimal glycaemic control in people with type 1 (T1D) and insulin/sulphonylurea-treated type 2 diabetes [T2D (1)]. Acutely, severe hypoglycaemia, defined as requiring help from a third party for recovery, can lead to brain damage or death, in extreme but rare circumstances. Importantly the detection of hypoglycaemia and activation of appropriate counterregulatory responses (CRR) to reverse hypoglycaemia, are mediated to large extent by the central detection of hypoglycaemia (2). Moreover, frequent exposure to hypoglycaemia leads to defective CRR. Specifically the magnitude of the glucose-raising catecholamine response during hypoglycaemia is suppressed and triggered at a lower plasma glucose level, combined with an often absent glucagon response (3). These changes are, at least in part, driven by changes in brain hypoglycaemia-sensing nuclei, including the ventromedial hypothalamus [VMH (4)] and hindbrain (5).
Activation of CRR can be induced by administration of glucoprivic agents such as 2-deoxy-glucose [2DG (6)] and 5-thio-D-glucose (7) to discrete brain nuclei. Glucose sensing neurons found in nuclei of the hypothalamus and hindbrain detect changes in glucose concentration (8, 9). However, recently astrocytes have been implicated in direct glucose sensing and altering neuronal output (10, 11). For example, the expression of the glucose transporter GLUT2 is required in astrocytes but not neurons for a robust response to glucoprivation (12). Moreover, astrocytes in ex vivo brain slices containing the nucleus of the tractus solaris [NTS (6)], were activated by low glucose or 2DG. Furthermore, blocking astrocytic metabolism with fluorocitrate prevented increases in gastric motility normally associated with hypoglycaemia (13). In response to low glucose, astrocytes in the NTS increase intracellular calcium levels which occur before and independently of neuronal activity (14). Recently it has also been shown that blockade of purinergic signalling from astrocytes also blocks 2DG-induced CRR (11, 15). In addition, astrocytic glutamate uptake is impaired following RH, contributing to counterregulatory failure (16). Together these data suggest an active role of astrocytes in glucose detection, despite this evidence little is known about the intrinsic changes within astrocytes, especially human astrocytes, following recurrent low glucose (RLG). In this study, we used both RNA sequencing and an epigenome-wide association study (EWAS) of DNA methylation (DNAm) to examine for the first time, changes to the human astrocyte transciptome and methylome following acute and recurrent low glucose exposure.
Research Design and Methods
Astrocyte Isolation and Cell Culture
HPA cells were isolated from post-mortem sub-ventricular deep white matter following consent from next-of-kin, and with ethical approval from the North and East Devon Research Ethics Committee and confirmed as glial fibrillary and acidic protein (GFAP) and vimentin positive, as previously described (17), confirming astrocyte identity. The recurrent low glucose (RLG) model has been previously described [(18); Figure 1]. Each day cells were cultured in 2.5 mmol/L glucose-containing media for 2 hours before being changed for media containing 0.1 (low) or 2.5 (normal) mmol/L glucose for 3 hours. Overnight, cells were recovered in stock media containing 5.5 mmol/L glucose. This was repeated for four days. Control and low glucose (LG) treated cells had 2.5 mmol/L glucose for three days and on the fourth day the LG group received low glucose for 3 hours. The antecedent RLG (aRLG) and RLG groups had 0.1 mmol/L glucose for 3 hours on three consecutive days, on the fourth day the aRLG group was exposed to 2.5 mmol/L glucose, whereas RLG was exposed to 0.1 mmol/L glucose for 3 hours. Mannitol was added to maintain osmolarity (see ESM for details). Samples were split for RNA extraction and DNA extraction, with a total of five and six replicates for RNA sequencing and DNA methylation studies, respectively. Cells were confirmed as mycoplasma free using the MycoAlert kit (Lonza, Slough, UK).
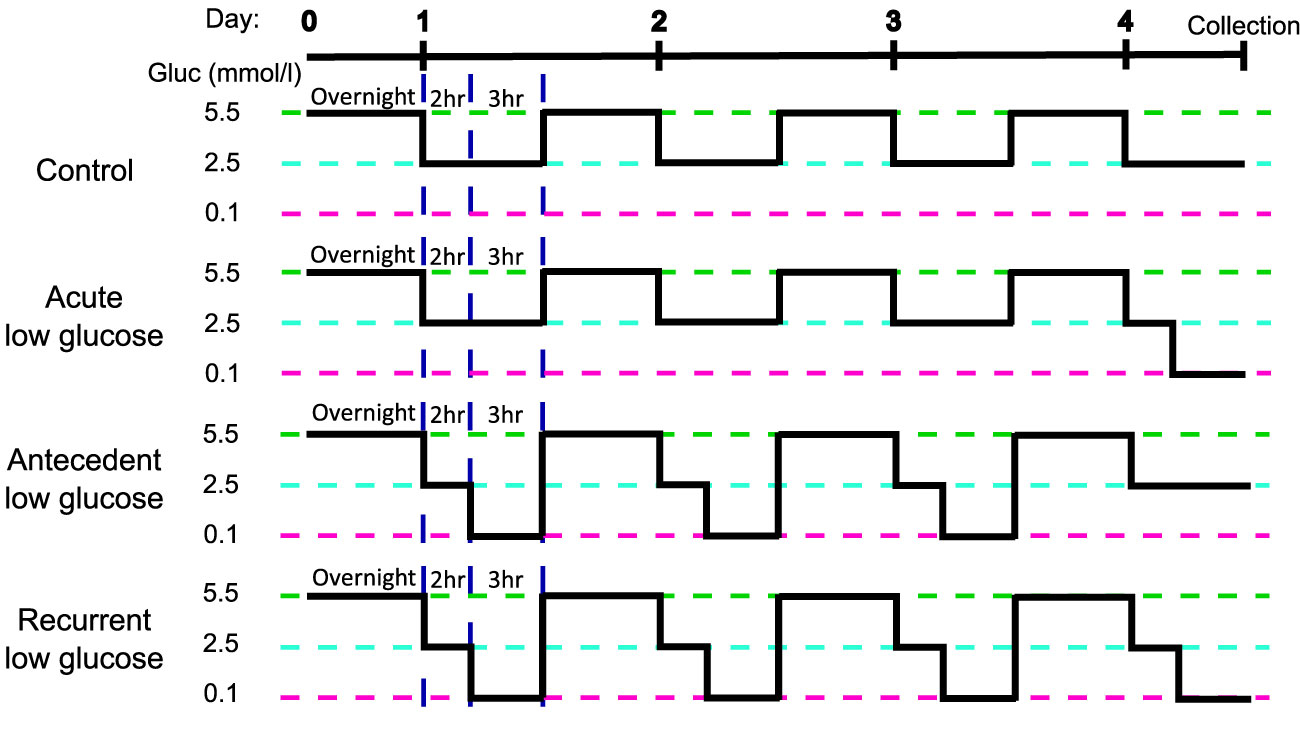
Figure 1 Schematic of the recurrent low glucose model. Human primary astrocytes were exposed to 0, 1, 3, or 4, three-hour long bouts of 0.1 mmol/l glucose; control (C), acute low glucose (LG), antecedent recurrent low glucose (aRLG), and recurrent low glucose (RLG) respectively. Each day cells were first incubated in 2.5 mmol/l glucose for 2 hours as a step down from overnight/stock media of 5.5 mmol/l glucose. Adapted from (18).
RNA Sequencing
Briefly, RNA was extracted using TRIzol and Direct-zol miniprep kit (Invitrogen, Carlsbad, CA, USA), according to manufacturers’ instructions. cDNA libraries were generated using the TruSeq DNA HT Library Preparation Kit (Illumina Inc., San Diego, CA, USA). Sequencing reads were generated using the Illumina HiSeq 2500 and fastq sequence quality was checked using MultiQC before alignment to the human genome (Build GRCh38.p12) using STAR. Mapped reads were counted using the FeatureCounts function of the subread package. Differential gene expression was calculated using DESeq2 (19) using the Likelihood ratio test function to analyse all groups together followed by the Wald-test for pairwise analysis. Genes with a false discovery rate (FDR) ≤0.05 were considered differentially expressed. For a principal component analysis plot see ESM Figure 1. Functional gene ontology analysis was performed using GOSeq. Gene length was accounted for during GO analysis. Raw RNAseq files are available through GEO accession number GSE166848.
DNA Methylation Analysis
DNA was extracted using a modified phenol:chloroform protocol and DNA methylation (DNAm) examined using the Infinium MethylationEPIC BeadChip platform (Illumina Inc.; EPIC). 729727 probes remained after QC processes. The one-way analysis of variance (ANOVA) test was used to test for differentially methylated sites associated across the three groups: LG, aRLG, RLG compared to control. To determine which group was driving the association behind the significant ANOVA results, the T statistics for control versus each of the three groups were extracted from the regression model. Unprocessed array data is available through GEO accession number GSE166848.
Results
Low Glucose-Induced Changes in Gene Expression in Human Astrocytes
In HPA cells, expression of 1240 genes were significantly (p<0.05) altered in response to glucose variation; 24 of which were significantly differentially expressed (DE) after FDR correction (adjusted p<0.05; Figure 2A). Volcano plots displaying the pairwise comparisons of each treatment group versus control shows that LG (Figure 2Ai) produced the largest effect on gene expression, whereas changes induced by aRLG (Figure 2Aii) and RLG (Figure 2Aiii) were more modest. LG and RLG shared similar DE patterns (Figure 2B) and importantly TXNIP, regulated by glucose (20), was significantly downregulated in both LG (log2 fold-change -2.16, p=1.09E-5) and RLG (log2 fold-change -1.46, p=2.91E-3; Figure 2C). Of the other DE genes there was a predominance of genes related to endoplasmic reticulum (ER)-stress. X-box binding protein 1 (XBP1; log2 fold-change 0.28, p=1.56E-4; Figure 2D), heat shock protein family A member 5 (HSPA5; log2 fold-change 0.34, p=3.55E-6; Figure 2E), and mesencephalic astrocyte-derived neurotrophic factor (MANF; log2 fold-change 0.41, p=7.55E-6; Figure 2F) showed increased expression following LG exposure which was blunted following RLG. Similarly, mitochondrially encoded NADH:ubiquinone oxidoreductase core, subunit 4 and subunit 4L (ND4 and ND4L) had increased gene expression in acute LG (ND4; log2 fold-change 0.37, p=3.5E-6; ND4L; log2 fold-change 0.47, p=5.75E-7) and a diminished, but still significant increase following RLG (Figures 2G, H). Pathway analysis of the DE genes identified seven gene ontology (GO) terms that were significantly altered after correction for multiple comparisons, which were related to the unfolded protein response (UPR) and ER-stress (Table 1).
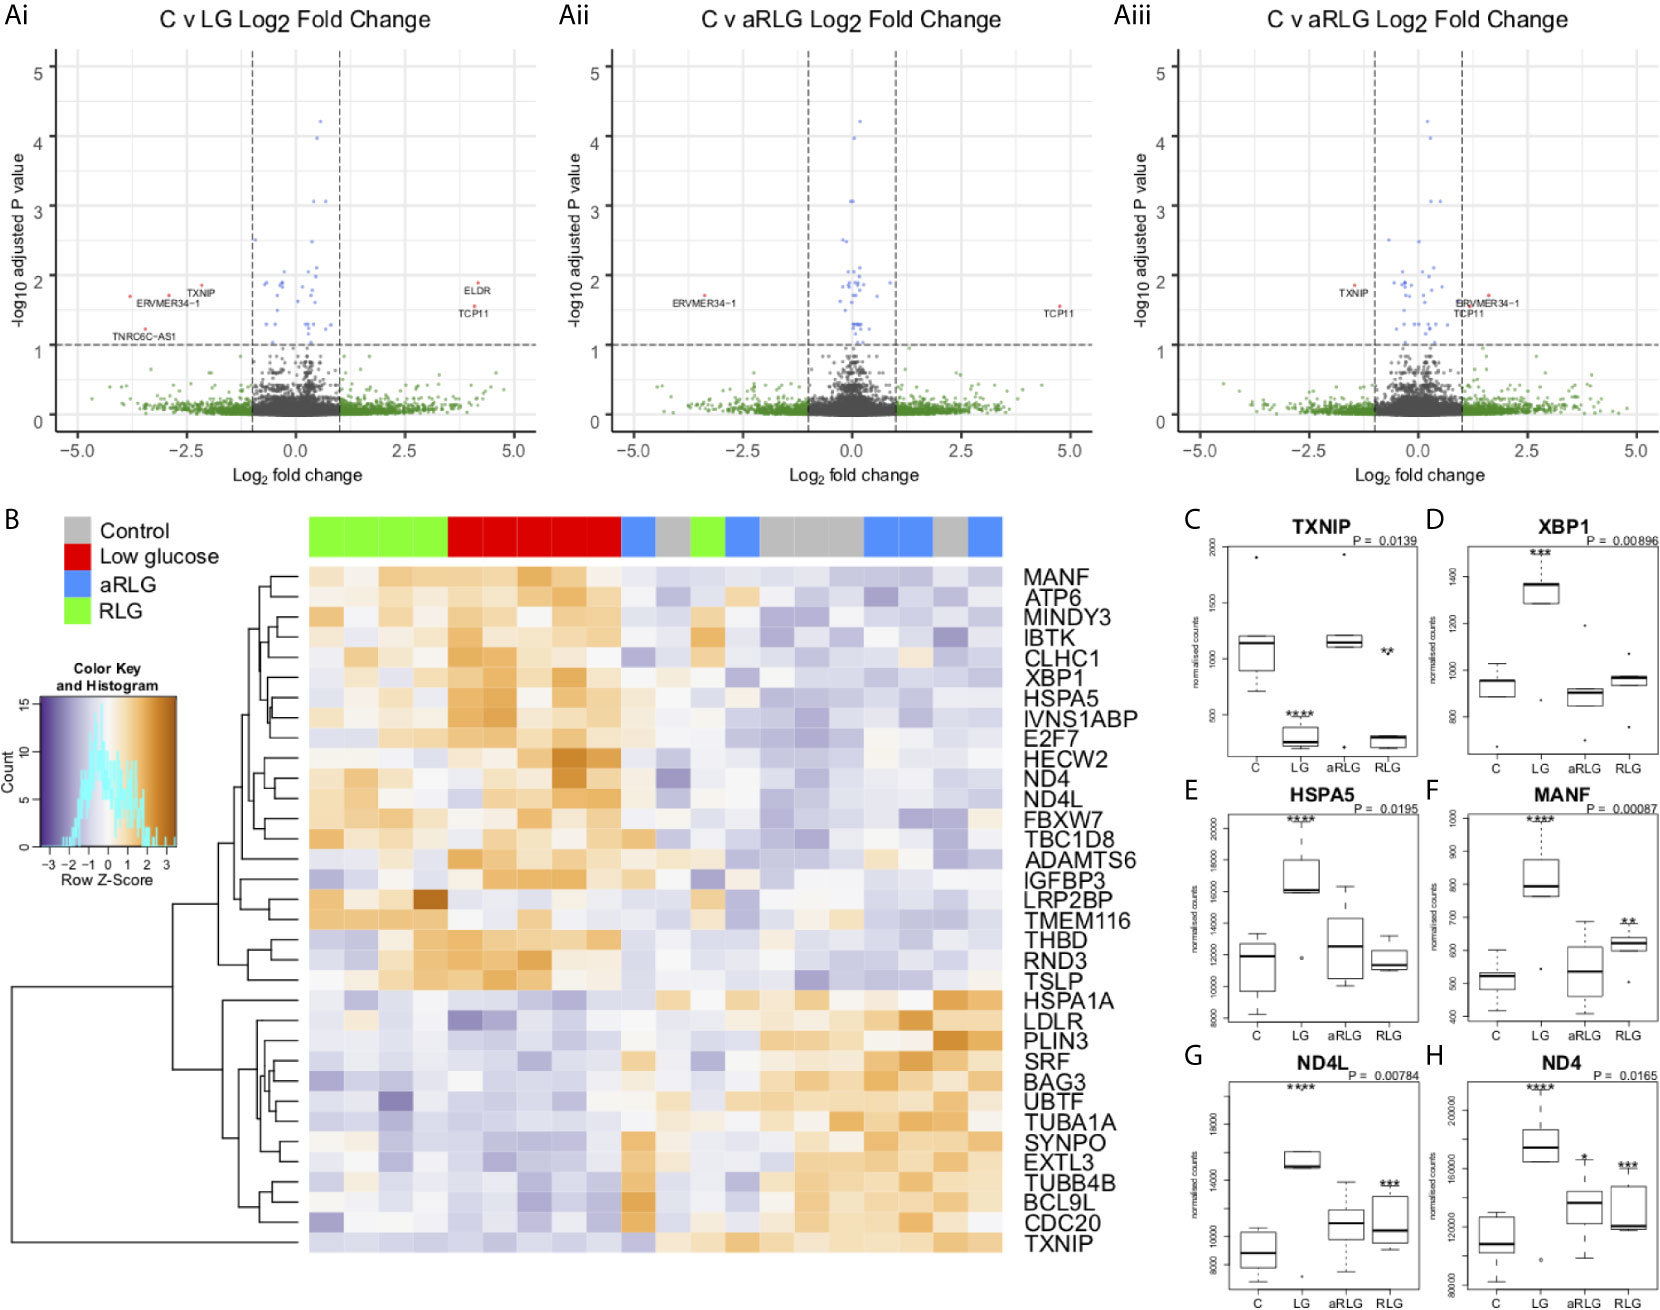
Figure 2 Glucose variation alters expression of genes involved in endoplasmic-reticulum stress. Volcano plots on the pairwise differential expression analysis between control cells (C) versus (Ai) low glucose (LG), (Aii) antecedent RLG, and (Aiii) recurrent low glucose (RLG), the red points on the plots represent genes padj<0.05. (B) Heatmap of hierarchical clustering of LRT analysis FDR ≤ 0.1 indicates differentially expressed genes (rows) between the four groups (padj<0.1). Orange indicates up-regulation and blue indicates down-regulation. The LG and RLG groups cluster together. TXNIP (C), XBP1 (D), HSPA5 (E), MANF (F), ND4L (G), ND4 (H) expression profiles, selected for their functional relevance to hypoglycaemia (p-value is the adjusted result of the likelihood ratio test). n=5; *p<0.05, **p<0.01, ***p<0.001, ****p<0.0001. Data presented as Mean ± SD.
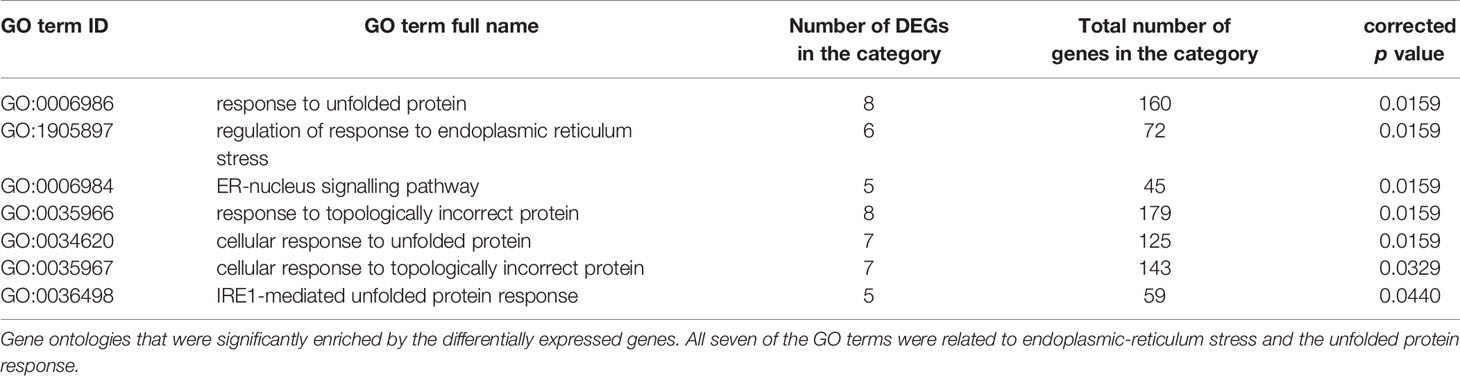
Table 1 Glucose variation significantly enriched gene ontologies related to endoplasmic-reticulum stress.
LG and RLG Produce Distinct DNA Methylation Profiles
Our analyses did not identify any differential methylated positions (DMP) that reached genome-wide significance for DNA methylation association analyses (Figures 3Ai-iii; p<9.42x10⁻⁸ (21)). However, 65 probes reached nominal significance of p<0.0001. Hierarchical clustering of these top probes showed four distinct groups that matched with the four experimental conditions suggesting a DNA methylation profile specific to each condition (Figure 3B). Of the differentially methylated CpG sites, several were related to energy or ion homeostasis. SLC19A3 (cg07417745, p=5.16E-7, βΔ= 0.23), encoding the thiamine transporter was hypermethylated after LG showing a linear relationship with the number of bouts of LG exposure (Figure 3C). Similarly, methylation of the GRID1 gene, encoding the ionotropic glutamate receptor δ1 (cg16777181) was hypermethylated following LG exposure (p=1.90E-3, βΔ=0.18) and this remained elevated following RLG (Figure 3D). In contrast, cg1102254 (NIPA1, p=2.65E-6, βΔ= -0.02), cg11692715 (SLC8B1; p=1.61E-5, βΔ= -0.16) and cg22467827 (CLHC1, p=4.28E-4, βΔ= -0.03), which encode a Mg2+ transporter (22), a Na+/Ca2+ antiporter, and clathrin heavy chain linker domain containing 1 respectively, were hypomethylated following RLG (Figures 3E–G). The probe cg22467827 (annotated to the gene CLHC1) was also differentially expressed (log2 fold-change 0.80, p=1.03E-4) in relation to RLG (Figure 3H). The two datasets (RNAseq and EPIC) were integrated resulting in 28 DE genes that overlapped with 31 differentially methylated positions (Figure 3I).
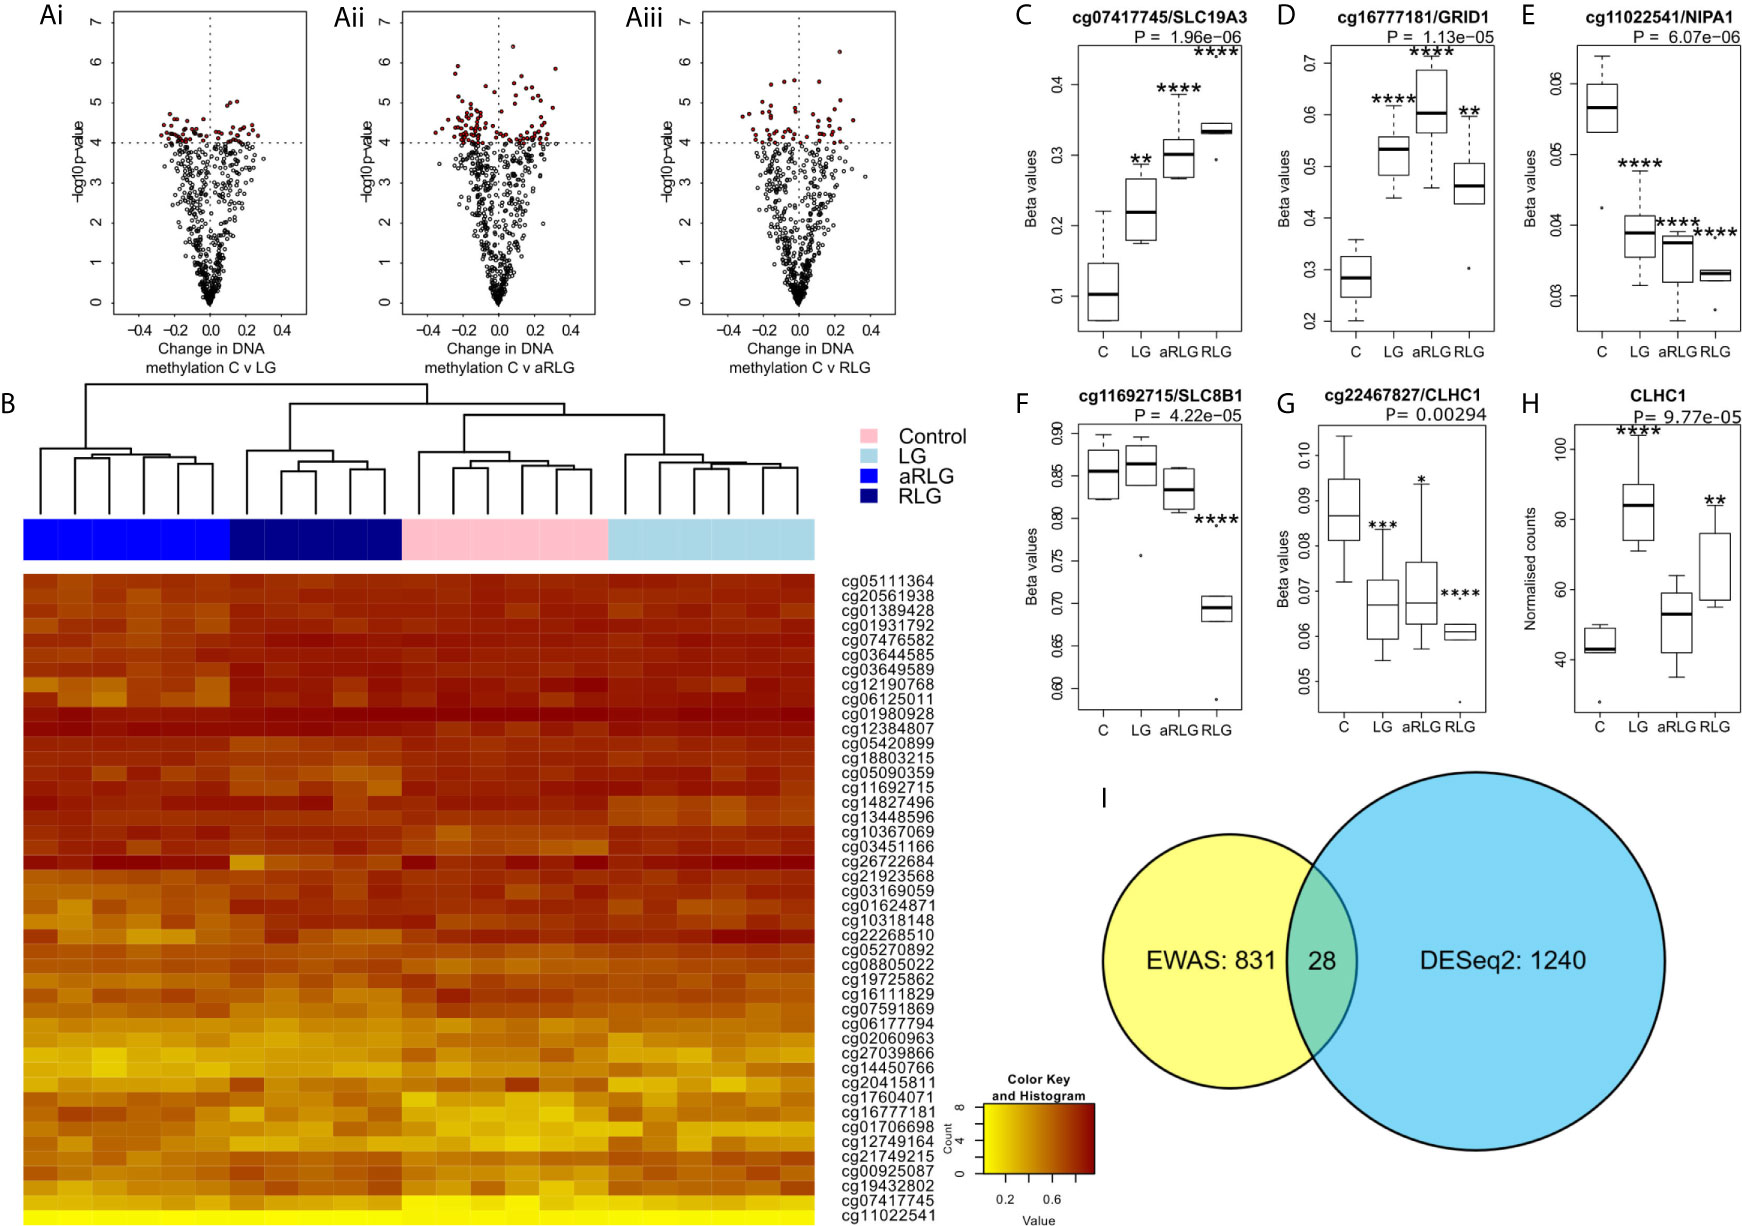
Figure 3 Effect of glucose variation on DNA methylation. (A) The most differentially methylated genes (ANOVA p ≤ 0.001) in pairwise comparison (red points are p<0.0001) between control treated HPA cells (C) versus (Ai) low glucose (LG), (Aii) antecedent recurrent low glucose (aRLG), and (Aiii) recurrent low glucose (RLG). (B) Heatmap of hierarchical clustering using probes ANOVA p<0.001 indicates differentially methylated cg sites (rows) between the four groups. Orange indicates hypermethylation and yellow indicates hypomethylation. Box plots of some of the most differentially methylated CpG sites labelled by their associated gene, selected for functional importance (C), cg07417745/SLC19A3, (D), cg16777181/GRID1, (E), cg11022541/NIPA1, (F), cg11692715/SLC8B1 (G), cg22467827/CLHC1 (p-value is the adjusted result of the ANOVA). (H), CLCH1 gene expression increases. Error bars represent standard deviation (I), Venn diagram of differentially methylated cg sites in yellow and differentially expressed genes (blue) and overlap between the two data sets, 28 genes. Data presented as Mean ± SD. *p<0.05, **p<0.01, ***p<0.001, ****p<0.0001. n=6 for methylation data and n=5 for gene expression changes.
Discussion
The central adaptations in response to RH that mediates defective CRR require further investigation, with little known about how astrocytes respond or adapt to RH. We sought to examine changes in HPA gene expression and DNA methylation to determine which, if any, pathways were altered by acute and RLG exposure. DE and GO pathway analyses revealed that the major pathway altered by acute LG was the UPR. Protein folding within the ER requires hydrolysis of ATP (for review see (23)) and reductions in ATP content driven by energy stress increases protein misfolding to activate the UPR (24). ER stress, via ATF6 promotes the production of XBP1 (25), which is spliced by IRE1α, to produce a potent transcriptional activator, XBP1s that increases HSPA5 (25) and MANF expression (26)). MANF is upregulated by UPR to inhibit cell proliferation and prevent ER-stress-related cell death (27, 28). Interestingly, here expression of XBP1, HSPA5, and MANF were increased following a single bout of LG. Similar ER stress responses have been reported in pericytes (29), cardiac tissue (30), rat primary astrocytes (31) and primary hippocampal neurons (24) in response to LG. Following RLG, the increase in UPR-related gene expression was substantially diminished. Given that energy deficiency increases ER stress, it is plausible that acute LG exposure causes poor folding of proteins leading to a marked increase in ER stress. Following successive bouts of LG, a concomitant metabolic adaptation, as previously reported (18), better preserves cellular (or intra-ER) ATP levels, thus attenuating (or delaying) subsequent LG-induced ER stress, reducing the necessity of the UPR. This is supported by the observation that expression levels of ND4L and ND4 following RLG remained elevated above control. These mitochondrial genes encode two subunits of complex I (NADH dehydrogenase) and the continued elevation of expression following RLG suggests a persistent adaptation. This correlates with our previous data in the same cell type demonstrating increased basal mitochondrial oxygen consumption following RLG, mediated by an increased reliance on fatty acid oxidation for ATP generation (18). It is worth noting that in our previous study, we did not observe any reduction in total intracellular ATP content following acute or recurrent low glucose exposure. When combined with our data presented here, it is possible that normal ER functions are transiently reduced during acute low glucose exposure in order to maintain intracellular ATP levels. Whether any metabolic adaptation following RLG leads to better preservation of intra-ER ATP levels remains to be determined.
The EWAS identified 65 DMPs associated with LG/RLG that reached nominal significance, while we did not identify any DMPs that reached the suggested array-wide significance (p<9.42x10⁻⁸). Hierarchical clustering revealed distinct patterns of DNA methylation across the four conditions. One of the most significant DMPs (cg07417745) is located in intron 1 of the SLC19A3 gene, which encodes a thiamine transporter (32), and showed a linear relationship between increased DNA methylation and the number of LG exposures. Interestingly, expression of this gene has previously been found to be modulated by hyperglycaemic-like conditions (33). Conversely, methylation of cg11022541 and cg11692715 located within the genes NIPA1 and SLC8B1 respectively, decreased following RLG. As these genes encode a Mg2+ transporter (22) and a Na+/Ca+ exchanger (34), this may indicate the energetic cost of ion handling within the cell, which requires further investigation. The main limitation in this study was that we were underpowered in the DNA methylation analyses as power analysis indicated we had 50% power to detect a difference of 10% in half of all the sites on the EPIC array. Moreover, the relationship between DNA methylation and gene expression is complex, with the direction of effect dictated by sequence context (35). Furthermore, the annotation of DNAm sites to genes is purely based on proximity rather than empirically derived data (36), both of these factors make inferences between DMPs and gene expression complicated. Despite these challenges we looked for overlapping genes between the datasets and identified 28 that were significantly altered (p<0.05) in both analyses. For example, CLHC1 gene expression was significantly increased and a DMP (cg22467827) located in intron 1 was hypomethylated. This tentatively suggests that DNA methylation within the first intron may be mediating the upregulation of this gene in the response to LG glucose.
These data demonstrate the intrinsic response of adult human primary astrocytes to acute and recurrent low glucose exposure. Despite the advantages of the high resolution information obtained from primary astrocyte cultures, whether these responses are shared by astrocytes across different brain regions remains unknown, especially given the emerging evidence of astrocyte heterogeneity. In addition, the influence of neighbouring cells such as neurons, pericytes and microglia would be interesting to examine. Therefore, expanding these findings to a more replete setting will be important for future studies using for example human inducible pluripotent stem cells in vitro or ex vivo/in vivo rodent models.
In summary, there are both shared and unique gene expression and DNA methylation profiles in human astrocytes following LG and RLG exposure. A single bout of LG exposure induced expression of genes associated with the UPR linked to ER stress. This response diminished after four bouts of LG exposure, suggesting an attenuated stress response. Taken together with previous observations that astrocytes adapt to RLG by increasing reliance on fatty acid oxidation to maintain intracellular ATP levels, activation of the UPR by glucose deprivation may be attenuated following RLG exposure.
Data Availability Statement
The datasets presented in this study can be found in online repositories. The names of the repository/repositories and accession number(s) can be found in the article/Supplementary Material.
Author Contributions
AJ, ED, and CB conceived the project. PW, SW, AJ, and ED contributed to data acquisition, analyses and writing of the manuscript. JH and NG obtained human post mortem tissue from which astrocytes were isolated, cultured, and characterised as the stable human primary astrocyte population, thus permitting the investigation of intrinsic changes in human astrocyte responses to be undertaken. CB wrote and edited the manuscript and accepts full responsibility for the work and/or conduct of the study, had access to the data and controlled the decision to publish. All authors contributed to the article and approved the submitted version.
Funding
This work was funded by a Novo Nordisk UK Research Foundation grant to CB, AJ, and ED, Mary Kinross Charitable Trust PhD studentship to CB for PWP, a European Foundation for the Study of Diabetes/Novo Nordisk Programme for Diabetes Research in Europe, a Diabetes UK RD Lawrence Fellowship to CB (13/0004647) and a JDRF postdoctoral fellowship (3-PDF-2020-941-A-N) to PWP. The University of Exeter Sequencing service is funded by Medical Research Council Clinical Infrastructure award (MR/M008924/1), Wellcome Trust Institutional Strategic Support Fund (WT097835MF), Wellcome Trust Multi-User Equipment Award (WT101650MA), and BBSRC LOLA award (BB/K003240/1). This study represents independent research supported by the National Institute of Health Research Exeter Clinical Research facility. The views expressed are those of the author(s) and not necessarily those of the NHS, the NIHR or the Department of Health and Social care.
Conflict of Interest
The authors declare that the research was conducted in the absence of any commercial or financial relationships that could be construed as a potential conflict of interest.
Acknowledgments
We thank the family of the donor for making this research possible. RNA library preparation and sequencing were performed by the Exeter Sequencing Service and Computational Core facilities at the University of Exeter.
Supplementary Material
The Supplementary Material for this article can be found online at: https://www.frontiersin.org/articles/10.3389/fendo.2021.671724/full#supplementary-material
References
1. Cryer PE. Hypoglycemia: Still the Limiting Factor in the Glycemic Management of Diabetes. Endocrine Practice: Off J Am Coll Endocrinol Am Assoc Clin Endocrinol (2008) 14(6):750–6. doi: 10.4158/EP.14.6.750
2. Arbelaez AM, Powers WJ, Videen TO, Price JL, Cryer PE. Attenuation of Counterregulatory Responses to Recurrent Hypoglycemia by Active Thalamic Inhibition: A Mechanism for Hypoglycemia-Associated Autonomic Failure. Diabetes (2008) 57(2):470–5. doi: 10.2337/db07-1329
3. Segel SA, Paramore DS, Cryer PE. Hypoglycemia-Associated Autonomic Failure in Advanced Type 2 Diabetes. Diabetes (2002) 51(3):724–33. doi: 10.2337/diabetes.51.3.724
4. McCrimmon RJ, Song Z, Cheng H, McNay EC, Weikart-Yeckel C, Fan X, et al. Corticotrophin-Releasing Factor Receptors Within the Ventromedial Hypothalamus Regulate Hypoglycemia-Induced Hormonal Counterregulation. J Clin Invest (2006) 116(6):1723–30. doi: 10.1172/JCI27775
5. Sanders NM, Taborsky GJ, Wilkinson CW, Daumen W, Figlewicz DP. Antecedent Hindbrain Glucoprivation Does Not Impair the Counterregulatory Response to Hypoglycemia. Diabetes (2007) 56(1):217–23. doi: 10.2337/db06-1025
6. Ritter S, Llewellyn-Smith I, Dinh TT. Subgroups of Hindbrain Catecholamine Neurons are Selectively Activated by 2-deoxy-D-glucose Induced Metabolic Challenge. Brain Res (1998) 805(1-2):41–54. doi: 10.1016/S0006-8993(98)00655-6
7. Ritter S, Dinh TT, Zhang Y. Localization of Hindbrain Glucoreceptive Sites Controlling Food Intake and Blood Glucose. Brain Res (2000) 856(1-2):37–47. doi: 10.1016/S0006-8993(99)02327-6
8. Song Z, Levin BE, McArdle JJ, Bakhos N, Routh VH. Convergence of Pre- and Postsynaptic Influences on Glucosensing Neurons in the Ventromedial Hypothalamic Nucleus. Diabetes (2001) 50(12):2673–81. doi: 10.2337/diabetes.50.12.2673
9. Levin BE, Routh VH, Kang L, Sanders NM, Dunn-Meynell AA. Neuronal Glucosensing: What do We Know After 50 Years? Diabetes (2004) 53(10):2521–8. doi: 10.2337/diabetes.53.10.2521
10. McDougal DH, Hermann GE, Rogers RC. Vagal Afferent Stimulation Activates Astrocytes in the Nucleus of the Solitary Tract Via AMPA Receptors: Evidence of an Atypical Neural-Glial Interaction in the Brainstem. J Neurosci (2011) 31(39):14037–45. doi: 10.1523/JNEUROSCI.2855-11.2011
11. Rogers RC, McDougal DH, Ritter S, Qualls-Creekmore E, Hermann GE. Response of Catecholaminergic Neurons in the Mouse Hindbrain to Glucoprivic Stimuli is Astrocyte Dependent. Am J Physiol Regul Integr Comp Physiol (2018) 315(1):R153–r64. doi: 10.1152/ajpregu.00368.2017
12. Marty N, Dallaporta M, Foretz M, Emery M, Tarussio D, Bady I, et al. Regulation of Glucagon Secretion by Glucose Transporter Type 2 (glut2) and Astrocyte-Dependent Glucose Sensors. J Clin Invest (2005) 115(12):3545–53. doi: 10.1172/JCI26309
13. McDougal DH, Viard E, Hermann GE, Rogers RC. Astrocytes in the Hindbrain Detect Glucoprivation and Regulate Gastric Motility. Autonomic Neurosci (2013) 175(1-2):61–9. doi: 10.1016/j.autneu.2012.12.006
14. McDougal D, Hermann G, Rogers R. Astrocytes in the Nucleus of the Solitary Tract are Activated by Low Glucose or Glucoprivation: Evidence for Glial Involvement in Glucose Homeostasis. Front Neurosci (2013) 7(249):1–10. doi: 10.3389/fnins.2013.00249
15. Rogers RC, Ritter S, Hermann GE. Hindbrain Cytoglucopenia-Induced Increases in Systemic Blood Glucose Levels by 2-Deoxyglucose Depend on Intact Astrocytes and Adenosine Release. Am J Physiol-Regulatory Integr Comp Physiol (2016) 310(11):R1102–8. doi: 10.1152/ajpregu.00493.2015
16. Chowdhury GMI, Wang P, Ciardi A, Mamillapalli R, Johnson J, Zhu W, et al. Impaired Glutamatergic Neurotransmission in the VMH may Contribute to Defective Counterregulation in Recurrently Hypoglycemic Rats. Diabetes (2017) 66(7):1979–89. doi: 10.2337/db16-1589
17. Holley JE, Gveric D, Whatmore JL, Gutowski NJ. Tenascin C Induces a Quiescent Phenotype in Cultured Adult Human Astrocytes. Glia (2005) 52(1):53–8. doi: 10.1002/glia.20231
18. Weightman Potter PG, Vlachaki Walker JM, Robb JL, Chilton JK, Williamson R, Randall AD, et al. Basal Fatty Acid Oxidation Increases After Recurrent Low Glucose in Human Primary Astrocytes. Diabetologia (2019) 62(1):187–98. doi: 10.1007/s00125-018-4744-6
19. Love MI, Huber W, Anders S. Moderated Estimation of Fold Change and Dispersion for RNA-seq Data With Deseq2. Genome Biol (2014) 15(12):550. doi: 10.1186/s13059-014-0550-8
20. Parikh H, Carlsson E, Chutkow WA, Johansson LE, Storgaard H, Poulsen P, et al. Txnip Regulates Peripheral Glucose Metabolism in Humans. PloS Med (2007) 4(5):e158. doi: 10.1371/journal.pmed.0040158
21. Mansell G, Gorrie-Stone TJ, Bao Y, Kumari M, Schalkwyk LS, Mill J, et al. Guidance for DNA Methylation Studies: Statistical Insights From the Illumina EPIC Array. BMC Genomics (2019) 20(1):366. doi: 10.1186/s12864-019-5761-7
22. Goytain A, Hines RM, El-Husseini A, Quamme GA. NIPA1(SPG6), the Basis for Autosomal Dominant Form of Hereditary Spastic Paraplegia, Encodes a Functional Mg2+ Transporter. J Biol Chem (2007) 282(11):8060–8. doi: 10.1074/jbc.M610314200
23. Braakman I, Hebert DN. Protein Folding in the Endoplasmic Reticulum. Cold Spring Harbor Perspect Biol (2013) 5(5):1–19. doi: 10.1101/cshperspect.a013201
24. de la Cadena SG, Hernández-Fonseca K, Camacho-Arroyo I, Massieu L. Glucose Deprivation Induces Reticulum Stress by the PERK Pathway and caspase-7- and Calpain-Mediated caspase-12 Activation. Apoptosis (2014) 19(3):414–27. doi: 10.1007/s10495-013-0930-7
25. Yoshida H, Matsui T, Yamamoto A, Okada T, Mori K. Xbp1 mRNA is Induced by ATF6 and Spliced by IRE1 in Response to ER Stress to Produce a Highly Active Transcription Factor. Cell (2001) 107(7):881–91. doi: 10.1016/S0092-8674(01)00611-0
26. Oh-Hashi K, Hirata Y, Kiuchi K. Transcriptional Regulation of Mouse Mesencephalic Astrocyte-Derived Neurotrophic Factor in Neuro2a Cells. Cell Mol Biol Lett (2013) 18(3):398–415. doi: 10.2478/s11658-013-0096-x
27. Apostolou A, Shen Y, Liang Y, Luo J, Fang S. Armet, a UPR-upregulated Protein, Inhibits Cell Proliferation and ER Stress-Induced Cell Death. Exp Cell Res (2008) 314(13):2454–67. doi: 10.1016/j.yexcr.2008.05.001
28. Huang J, Chen C, Gu H, Li C, Fu X, Jiang M, et al. Mesencephalic Astrocyte-Derived Neurotrophic Factor Reduces Cell Apoptosis Via Upregulating GRP78 in SH-SY5Y Cells. Cell Biol Int (2016) 40(7):803–11. doi: 10.1002/cbin.10621
29. Ikesugi K, Mulhern ML, Madson CJ, Hosoya K, Terasaki T, Kador PF, et al. Induction of Endoplasmic Reticulum Stress in Retinal Pericytes by Glucose Deprivation. Curr Eye Res (2006) 31(11):947–53. doi: 10.1080/02713680600966785
30. Barnes JA, Smoak IW. Glucose-Regulated Protein 78 (GRP78) is Elevated in Embryonic Mouse Heart and Induced Following Hypoglycemic Stress. Anat Embryol (2000) 202(1):67–74. doi: 10.1007/s004290000090
31. Lind KR, Ball KK, Cruz NF, Dienel GA. The Unfolded Protein Response to Endoplasmic Reticulum Stress in Cultured Astrocytes and Rat Brain During Experimental Diabetes. Neurochem Int (2013) 62(5):784–95. doi: 10.1016/j.neuint.2013.02.009
32. Eudy JD, Spiegelstein O, Barber RC, Wlodarczyk BJ, Talbot J, Finnell RH. Identification and Characterization of the Human and Mouse Slc19a3 Gene: A Novel Member of the Reduced Folate Family of Micronutrient Transporter Genes. Mol Genet Metab (2000) 71(4):581–90. doi: 10.1006/mgme.2000.3112
33. Beltramo E, Mazzeo A, Lopatina T, Trento M, Porta M. Thiamine Transporter 2 is Involved in High Glucose-Induced Damage and Altered Thiamine Availability in Cell Models of Diabetic Retinopathy. Diabetes Vasc Dis Res (2020) 17(1):1479164119878427. doi: 10.1177/1479164119878427
34. Palty R, Silverman WF, Hershfinkel M, Caporale T, Sensi SL, Parnis J, et al. NCLX is an Essential Component of Mitochondrial Na+/Ca2+ Exchange. Proc Natl Acad Sci USA (2010) 107(1):436–41. doi: 10.1073/pnas.0908099107
35. Jones PA. Functions of DNA Methylation: Islands, Start Sites, Gene Bodies and Beyond. Nat Rev Genet (2012) 13(7):484–92. doi: 10.1038/nrg3230
Keywords: recurrent low glucose, unfolded protein response, ER stress, human primary astrocytes, transcriptome (RNA-seq)
Citation: Weightman Potter PG, Washer SJ, Jeffries AR, Holley JE, Gutowski NJ, Dempster EL and Beall C (2021) Attenuated Induction of the Unfolded Protein Response in Adult Human Primary Astrocytes in Response to Recurrent Low Glucose. Front. Endocrinol. 12:671724. doi: 10.3389/fendo.2021.671724
Received: 24 February 2021; Accepted: 03 May 2021;
Published: 26 May 2021.
Edited by:
Cristina García Cáceres, Ludwig Maximilian University of Munich, GermanyReviewed by:
Ophélia Le Thuc, Helmholtz Center Munich, GermanyIsmael González-García, Helmholtz-Gemeinschaft Deutscher Forschungszentren (HZ), Germany
Copyright © 2021 Weightman Potter, Washer, Jeffries, Holley, Gutowski, Dempster and Beall. This is an open-access article distributed under the terms of the Creative Commons Attribution License (CC BY). The use, distribution or reproduction in other forums is permitted, provided the original author(s) and the copyright owner(s) are credited and that the original publication in this journal is cited, in accordance with accepted academic practice. No use, distribution or reproduction is permitted which does not comply with these terms.
*Correspondence: Emma L. Dempster, ZS5sLmRlbXBzdGVyQGV4ZXRlci5hYy51aw==; Craig Beall, Yy5iZWFsbEBleGV0ZXIuYWMudWs=
†These authors have contributed equally to this work
‡These authors share senior authorship