
94% of researchers rate our articles as excellent or good
Learn more about the work of our research integrity team to safeguard the quality of each article we publish.
Find out more
ORIGINAL RESEARCH article
Front. Endocrinol. , 16 July 2021
Sec. Neuroendocrine Science
Volume 12 - 2021 | https://doi.org/10.3389/fendo.2021.647184
This article is part of the Research Topic Diagnosis and Treatment of Primary Aldosteronism: from Clinical Origin to Translational Research View all 16 articles
 Kuan-Ming Chen1,2,3,4
 Bo-Ching Lee5
 Po-Ting Chen5
 Kao-Lang Liu5
 Kuan-Heng Lin1,2,3,4
 Chin-Chen Chang5,6*
 Tung-Hsin Wu1,2*
 Jia-Sheng Hong1,2
 Yen-Hung Lin7
The aim of this study was to analyze the differences in the distribution of abdominal adipose tissue between the two subtypes of primary aldosteronism (PA) using abdominal computed tomography. We retrospectively analyzed patients diagnosed as having essential hypertension (EH) or PA from the prospectively collected Taiwan Primary Aldosteronism Investigation (TAIPAI) database. Patients with PA were divided into the subgroups of idiopathic hyperaldosteronism (IHA) and unilateral aldosterone-producing adenoma (APA). Patients’ basic clinicodemographic data were collected, and a self-developed CT-based software program was used to quantify the abdominal adiposity indexes, including visceral adipose tissue (VAT) area, VAT ratio, waist circumference (WC), subcutaneous adipose tissue (SAT) area, and SAT ratio. We included 190 patients with EH and 436 patients with PA (238 with IHA and 198 with APA). The APA group had significantly lower abdominal adiposity indexes than the other groups. We also found negative correlations of aldosterone-to-renin ratio (ARR) with VAT area, VAT ratio, WC, and body mass index (BMI) in the APA group. After propensity score matching (which left 184 patients each in the IHA and APA groups), patients in the APA group still had significantly lower WC, SAT area, SAT ratio, and VAT ratio than those in the IHA group. Furthermore, logistic regression analysis indicated that lower probability of abdominal obesity was significantly related to patients with APA. Our data revealed that the distribution of abdominal adipose tissue was similar in patients with IHA and those with EH, but the abdominal adiposity indexes were significantly lower in patients with APA than in those with IHA and EH.
PA is one of the most common types of endocrine hypertension, with a prevalence of 5%–13% in patients with hypertension (1, 2). It is characterized by high plasma aldosterone concentration (PAC) and low plasma renin activity (PRA). PA has been considered a rare disease, but recent studies have determined that up to 20% of patients with resistant hypertension have PA (3–5).
Abdominal obesity is a common risk factor for cardiovascular events in patients with hypertension. Patients with EH have a similar probability of developing lipid metabolism disorder to those with PA (6, 7). In addition, an increased PAC may unstable the metabolic complications associated with abdominal adiposity, leading to a high risk of morbidity and mortality (6, 8–10). This implies that the etiology for developing the metabolic syndromes of obesity, dyslipidemia, and hyperglycemia in patients with PA might differ from that in patients with EH (11, 12).
Among patients with PA, 64% have IHA caused by bilateral adrenal hyperplasia and 27% have APA (13). Moreover, two subtypes of PA (IHA and APA) have different pathogeneses, and patients with APA have much higher levels of aldosterone than do those with IHA (14, 15). Therefore, patients with APA should theoretically experience severer obesity-related disorders than those with IHA due to aldosterone excess. However, studies have reported that patients with IHA have more metabolic disorders and a higher prevalence of obesity than those with APA (16, 17). We accordingly assumed that the distribution and mechanisms of the development of abdominal obesity in the two subtypes of PA should also be different. Therefore, using patients with EH as the control group, we investigated the relationship between abdominal fat tissue distribution and pathophysiology, and the factors affecting them, in the two subtypes of PA.
This was a retrospective analysis of a prospectively collected database. We enrolled patients diagnosed as having EH and PA from the Taiwan Primary Aldosteronism Investigation (TAIPAI) database from 2010 to 2018. We collected patients’ abdominal computed tomography (CT) scans and basic clinicodemographic data, including sex, age, BMI, systolic blood pressure (SBP), diastolic blood pressure (DBP), potassium ion concentration, PAC, PRA, ARR, and estimated glomerular filtration rate (eGFR). Patients’ history of hypertension and type 2 diabetes (T2D) were also collected. All patient identifying information was removed from the CT scans before analysis, and the requirement to obtain informed consent was waived by the institutional review board.
PA was diagnosed based on the following biochemical criteria: (a) autonomous excess aldosterone production evidenced with an ARR > 35; (b) a TAIPAI score > 60% (18); and (c) post-saline loading PAC > 10 ng/dL, ARR > 35 in a post-captopril/losartan test, or PAC > 6 ng/dL indicated by a fludrocortisone suppression test.
The classification of PA into subtypes was based on TAIAPI experience (2, 19). IHA was diagnosed according to the following criteria: (a) evidence of bilateral diffuse enlargement on preoperative computed tomography (CT); (b) nonlateralization of aldosterone secretion during adrenal venous sampling; and (c) diffuse cell hyperplasia on biopsy of resected specimen in patients who underwent an operation. APA was diagnosed based on the following criteria: (a) biochemical finding of PA and the evidence of adenoma on preoperative CT; (b) lateralization of aldosterone secretion during adrenal venous sampling; and (c) pathologically proven adenoma after adrenalectomy and (d) the subsequent emergence of either a cure pattern of hypertension without antihypertensive agents and improvement in hypertension, potassium, PAC, and PRA (14).
CT was used to calculate WC and quantify the parameters of abdominal adipose tissue. The CT scanning parameters were as follows: the tube voltage was 120 kVp, and the tube current was under automated exposure control. Slice thickness was 5 mm, and the scan range went from the upper edge of T12 to S1. A self-developed program written on the MATLAB platform was used to measure abdominal adipose tissue and its relevant indexes. To set the threshold segmentation, the Hounsfield unit (HU) values were set between −190 and −30 for fat and between −29 and 150 for muscle (20). The procedure is depicted in Figure 1. First, a slice of the umbilical area was selected (Figure 1A) to measure WC (Figure 1B). Next, one of the slices at L4 transverse process was selected (Figures 1C, D). The regions of interest in the layer of VAT, layer of muscle, and layer of SAT were circled on the slice to calculate the area of the total abdomen (Figure 1E). Finally, the set HU values for fat was used for threshold segmentation, and the corresponding SAT and VAT areas were calculated (Figure 1F). To eliminate individual differences, the SAT and VAT areas were divided by the total abdomen area to ensure standardized SAT and VAT ratios.
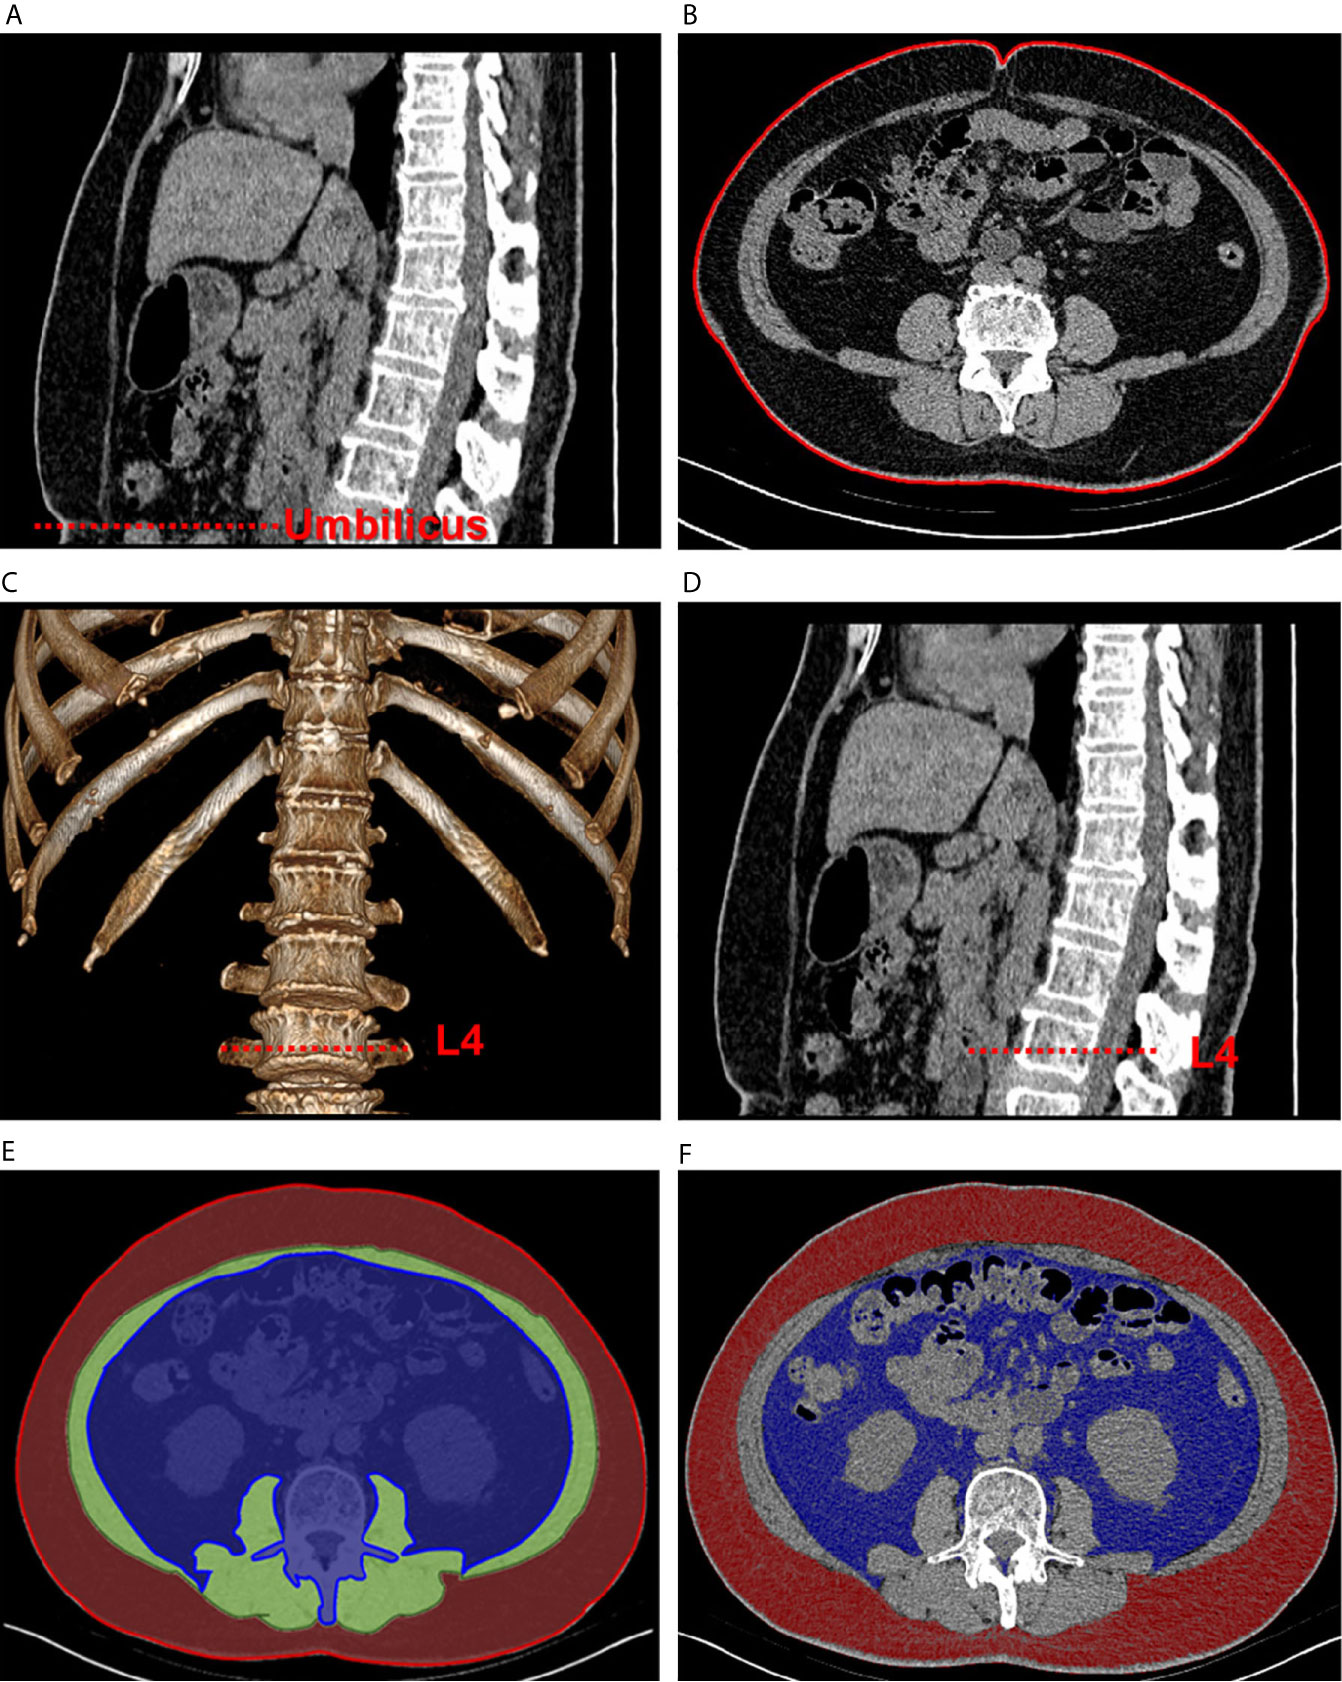
Figure 1 Schematic of abdominal adipose tissue quantification using computed tomographic images. The sagittal plane (A) was used to locate the umbilical area, and one of the corresponding transverse planes (B) was selected to measure waist circumference. Then, volume rendering (C) was used to locate the L4 area (D). The regions of interest of visceral fat (blue), muscular layer (green), and subcutaneous fat (red) were circled in one of the transverse planes (E). Quantification of the fat areas was completed through threshold segmentation (F).
Statistical analysis was performed using SPSS v22.0 (IBM Corp., Armonk, NY, USA). Data were presented as mean ± standard deviation for continuous variables and as percentage for categorical variables. Nonnormally distributed variables, such as PAC, PRA, and ARR, were expressed as median and interquartile range. Significant difference were compared using one-way ANOVA with the Bonferroni post-hoc for continuous variables, Chi-square test for categorical variables and Kruskal–Wallis tests for nonnormally distributed variables among EH, IHA, and APA groups or between any two groups. Spearman’s rank correlation was calculated for each of the three groups, and linear correlations among BMI, abdominal adiposity indexes, and ARR were analyzed.
A 1:1 propensity score matching (PSM) analysis was conducted. Propensity scores were estimated to control for possible confounding bias, such as sex, age, and BMI between any two groups in this study. The independent samples t test was used to compare continuous variables between two groups. We also performed univariate and multivariate logistic regression analysis to detect the relationship between the two subtypes of PA, clinical data and abdominal adiposity indexes.
We included 190 patients diagnosed with EH and 436 diagnosed with PA. The EH group had a higher proportion of men than the PA group did, but age and BMI were not significantly different between the two groups. The PA group exhibited significantly higher SBP, higher DBP, and longer duration of hypertension compared with the EH group. Significantly higher PAC, higher ARR, lower PRA, and lower potassium ion concentration were observed in the PA group compared with the EH group. Analysis of abdominal adiposity indexes indicated that the PA group had significantly lower WC, total abdomen area, VAT area, and VAT ratio than the EH group. The results of before and after PSM for sex between EH and PA groups are presented in Table S1.
In total, 238 patients with IHA and 198 patients with APA who were scheduled to undergo adrenalectomy. Table 1 compares the clinical and demographic variables between the groups. The EH group had a significantly higher proportion of men than the IHA group did, but not compared with the APA group. SBP and DBP were higher in the IHA and APA groups than in the EH group, but the duration of hypertension was significantly longer in patients with IHA than in those with EH. Compared with the EH group, the APA group had significantly higher ARR and both the APA and IHA groups had significantly higher PAC, higher ARR, lower PRA, and lower potassium ion concentration. Analysis of abdominal adiposity indexes indicated that the SAT ratio was significantly higher in the IHA group than in the EH group. However, the EH and IHA groups did not differ significantly in terms of WC, total abdomen area, SAT area, VAT area, and VAT ratio. By contrast, the APA group had significantly lower WC, total abdomen area, SAT area, VAT area, and VAT ratio than the EH group did. The results of PSM for sex, age, and BMI for the EH group vs. the IHA group and the EH group vs. the APA group are presented in Table S2.
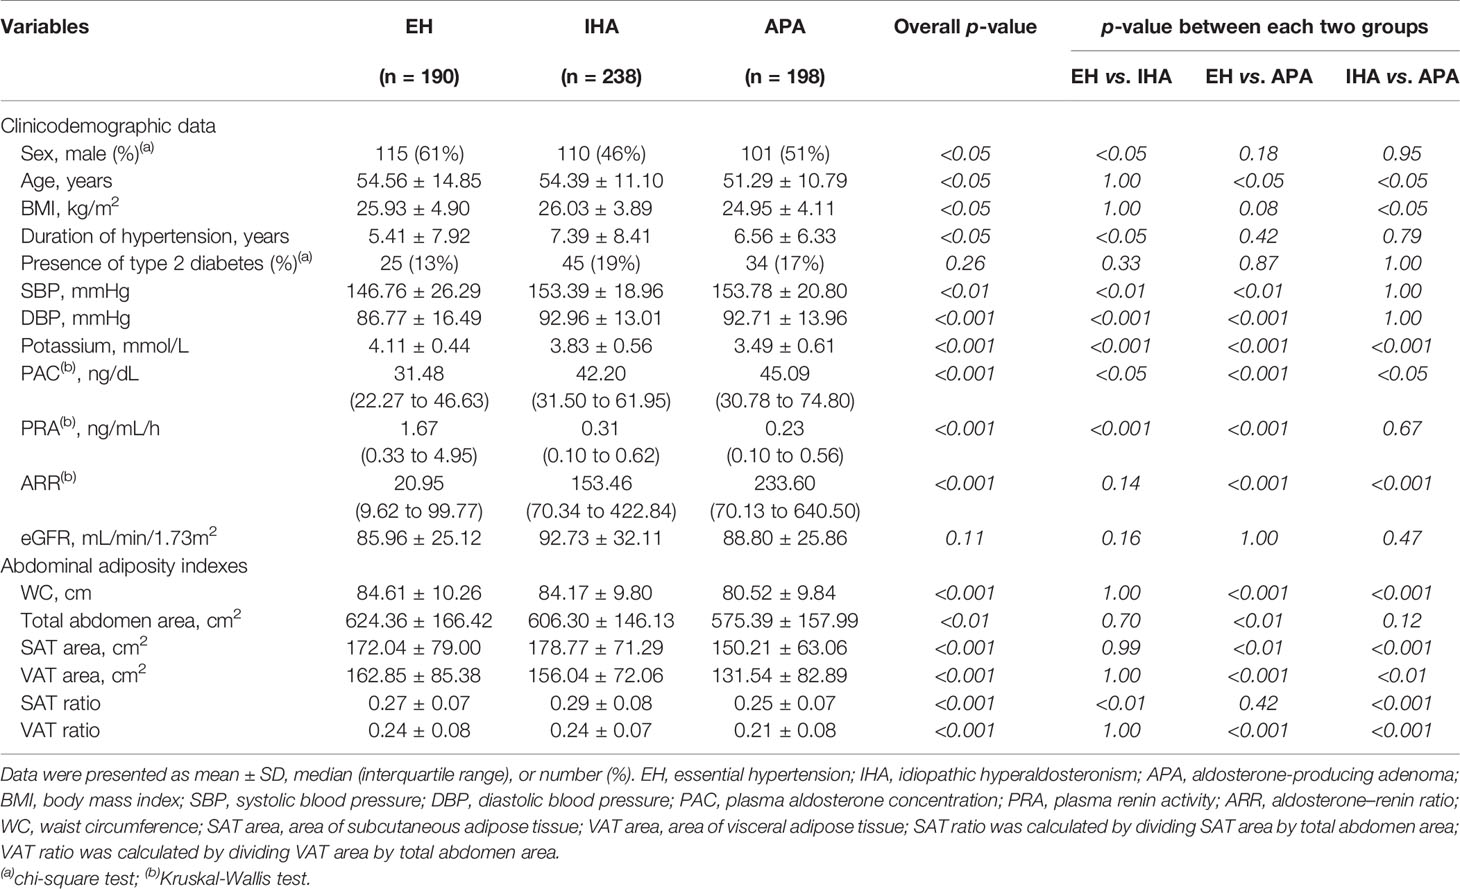
Table 1 Comparison of clinicodemographic data and abdominal adiposity indexes among the EH, IHA, and APA groups.
No significant correlations were observed between ARR, abdominal adiposity indexes, and BMI in the PA group. However, in the APA group, negative correlations of ARR were identified with VAT area (r = −0.174, p < 0.05; Figure 2A), VAT ratio (r = −0.177, p < 0.05; Figure 2B), WC (r = −0.182, p < 0.05; Figure 2C), and BMI (r = −0.176, p < 0.05; Figure 2D); however, no statically significant correlations were observed with total abdomen area (r = −0.152, p = 0.06), SAT area (r = −0.132, p = 0.09), or SAT ratio (r = −0.038, p = 0.63). By contrast, in the patients with EH or IHA, no statically significant correlations were observed of ARR with any factors.
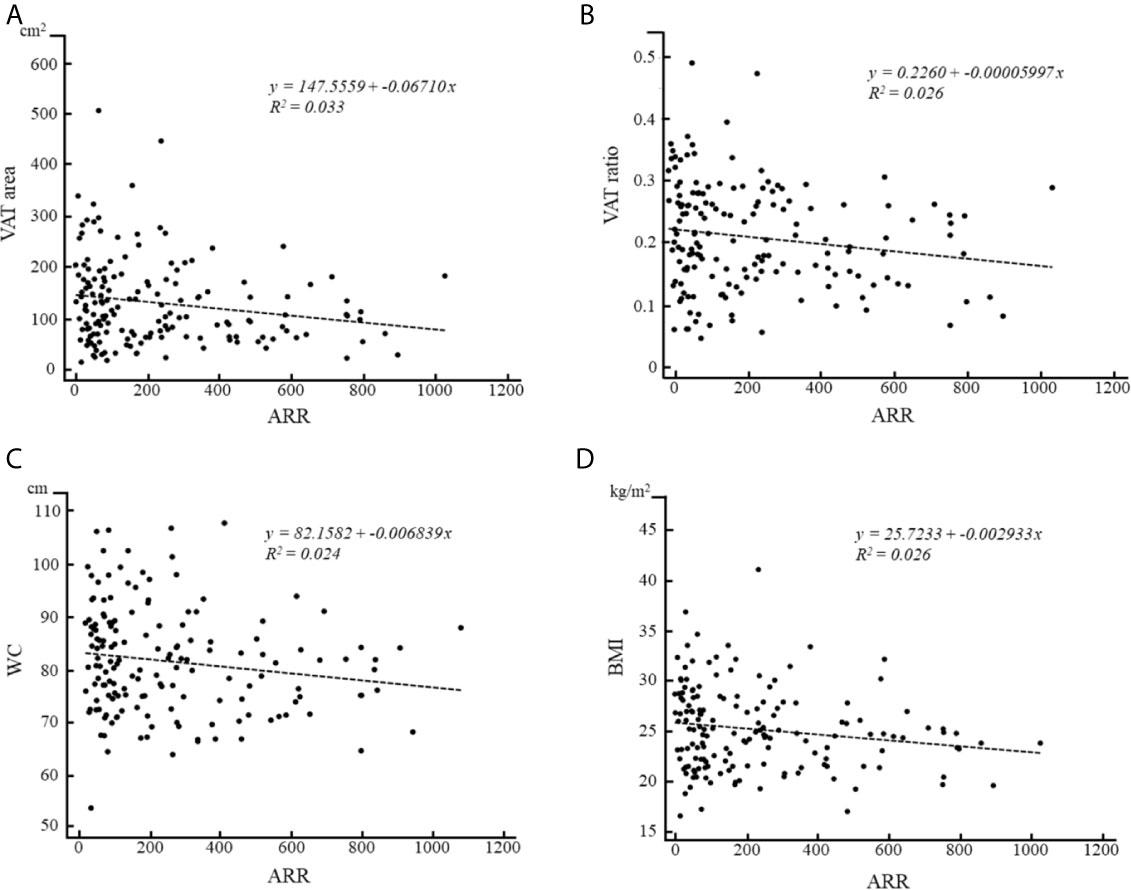
Figure 2 Correlations of ARR with (A) VAT area, (B) VAT ratio, (C) WC and (D) BMI in patients with APA.
As shown in Table 1, age and BMI were significantly higher in the IHA group than in the APA group. PAC and ARR were significantly higher and potassium ion concentration was significantly lower in patients with APA than in those with IHA. Analysis of abdominal adiposity indexes indicated that the APA group had significantly lower WC, SAT area, VAT area, SAT ratio, and VAT ratio than the other groups.
The clinical data and abdominal adiposity indexes after PSM for age and BMI, which led to 184 patients each in IHA and APA groups, are listed in Table 2. No significant differences in sex, duration of hypertension, presence of T2D, SBP, DBP, PAC, or PRA were noted. However, as was the case before PSM, ARR remained significantly higher and potassium ion concentration remained significantly lower in patients with APA than in those with IHA. Furthermore, the APA group had significantly lower values of all the abdominal adiposity indexes than the IHA group, including WC, SAT area, SAT ratio and VAT ratio (Figure 3).
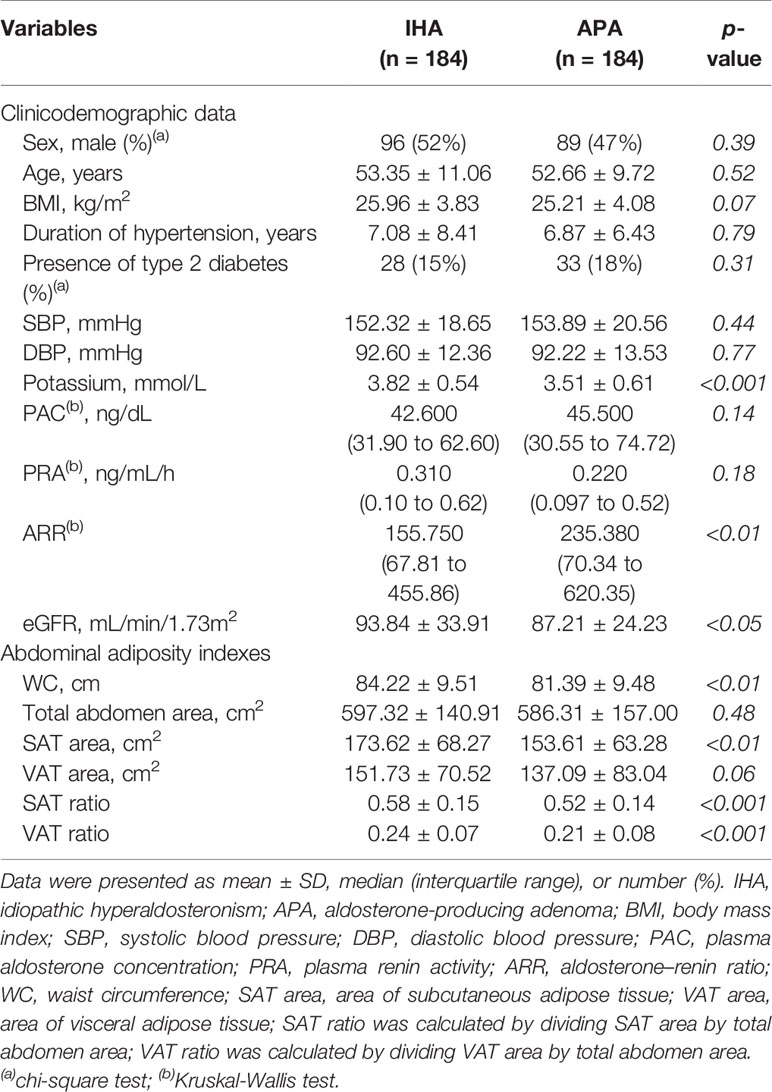
Table 2 Comparison of clinicodemographic data and abdominal adiposity indexes between the IHA and APA groups after propensity score matching for age and BMI.
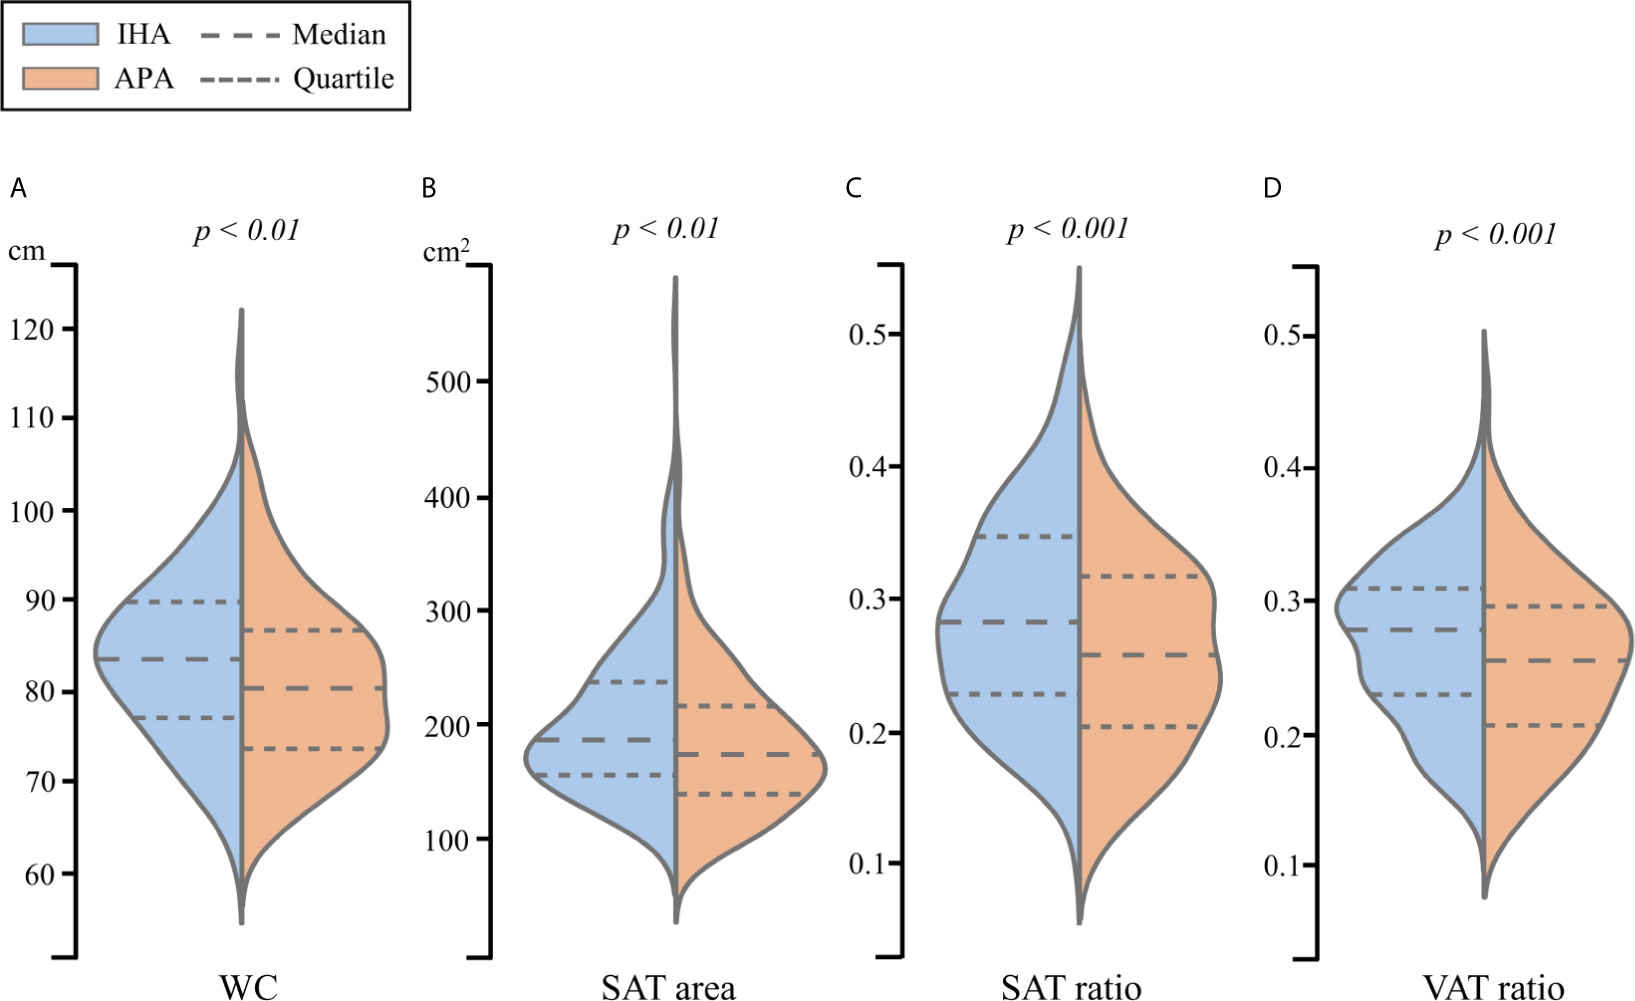
Figure 3 The violin plot of (A) WC, (B) SAT area, (C) SAT ratio and (D) VAT ratio for propensity score matched patients between IHA and APA.
Logistic regression for WC, SAT ratio, VAT ratio, potassium ion concentration, ARR and eGFR were performed to distinguish APA from IHA after PSM for age and BMI. As shown in Table 3, our multivariate regression analysis data revealed that patients with APA exhibited lower SAT ratio, VAT ratio and potassium ion concentration than patients with IHA. We additionally provide regression data before executing PSM in Table S3, the results also show that patients with APA has a lower chance of developing abdominal obesity and more severe hypokalemia, and are irrelevant to age and BMI.

Table 3 Logistic regression analysis of WC, SAT ratio, VAT ratio, potassium concentration, ARR and eGFR between IHA and APA group after propensity score matching for age and BMI.
This study is unique in that it involves 436 sets of abdominal CT scans and clinical data from patients with PA; in contrast to other studies, we added an additional 190 sets of data from patients with EH for comparison. The strength of our study is the direct use of CT scans to assess the abdominal component, in particular, the SAT and VAT can be measured directly and quantified using the following indexes, area and ratio. Our approach should be more convincing than other previous studies that use weight, BMI, or WC for assessment (16, 17). Our study reveals that the APA group had significantly lower abdominal adiposity indexes than the other groups. We also found negative correlations of ARR with VAT area, VAT ratio, WC, and BMI in the APA group. After PSM, patients in the APA group still had significantly lower WC, SAT area, SAT ratio, and VAT ratio than those in the IHA group. Furthermore, the logistic regression analysis indicated that lower probability of abdominal obesity was significantly related to patients with APA.
Adipose tissue is involved in many physiological and pathological processes. Excessive adipose tissue often causes with excessive PAC, causing the mineralocorticoids continuously activated and strengthened. This finally leads to the inflammation and adipocyte differentiation (21–24). Studies have indicated that the prevalence of obesity or dyslipidemia does not differ significantly between EH and PA groups (6, 25). Although our results indicated that the PA group had significantly lower WC and VAT than the EH group did, these differences disappeared after PSM for sex (Table S1).
However, PSM for sex, age, and BMI yielded no significant differences in WC or other abdominal adiposity indexes between patients with EH and IHA, whereas patients with APA had significantly lower WC, total abdomen area, SAT and VAT than those with EH (Table S2). This demonstrates that the metabolic phenotypes of obesity are similar in the EH and IHA groups, which is consistent with previous research (7). The present data suggested that, in contrast to patients with IHA, the metabolic profile of patients with APA might be a crucial factor that lowers the obesity prevalence in the overall PA population.
Distribution of abdominal fat is an important predictor of cardiovascular risk, increasing accumulation of SAT and VAT are associated with several cardiac diseases, particularly the VAT is an independent factor for metabolic syndrome (MetS) in patients with obesity (26). Whereas, interesting was that recent studies had indicated that patients with APA had higher risk of developing cardiac events among the PA population (27, 28). And despite having lower PAC than patients with APA, only those with IHA are more likely to develop MetS (16, 17).
Our study at least provides another point of view to support these inconsistent issues. In this study, patients with IHA and APA exhibited different distributions of abdominal adipose tissue. Even after controlling for age and BMI, patients with APA exhibited significant lower WC, SAT and VAT than patients with IHA. According to our logistic regression analysis, patients with IHA and APA exhibited significant differences in SAT and VAT. Consequently, it can be assumed that the higher incidence of cardiac events in the APAs is not associate with obesity, but may be direct related to the toxicity of chronic excess aldosterone.
ARR is an indicator of disorder in aldosterone activity and is useful for the diagnosis of PA (29). In particular, ARR is highly sensitive and specific in diagnosing APA (30, 31). In the present study, ARR was significantly negatively correlated with VAT area, VAT ratio, WC, and BMI in patients with APA. These findings were consistent with Er et al., who indicated that patients with APA had relatively smaller abdominal fat distribution, but the VAT will be increased after unilateral adrenalectomy (32). However, relevant study is still sparse, and the exact pathomechanisms remain clarified in the future.
No relationship was observed between ARR and other factors in patients with IHA. By contrast, Shibayama et al. (33) had reported that PAC was positively proportional to visceral fat distribution in patients with IHA. Taken together, the findings indicate that the relationship of abdominal obesity with aldosterone activity may differ between IHA and APA. These findings are in line with the notion that long-term aldosterone excess in patients with APA may lead to inflammation and fibrosis of perirenal fat tissue, eventually resulting in reduced abdominal adiposity indexes (34).
This retrospective study had the following limitations. First, we did not exclude autonomous cortisol secretion in patients with APA. Cortisol hypersecretion can be associated with obesity. Second, we did not evaluate laboratory data, such as lipid profile and HOMA-IR index, but these data have been proven to be irrelevant to abdominal fat accumulation (32). Third, this retrospective study did not take the effects of relevant medication history into account, such as antihypertensives or statins.
In conclusion, our data revealed that the abdominal adipose tissue indexes were similar in patients with IHA and those with EH but were markedly lower in patients with APA. Furthermore, ARR was negatively correlated with VAT area, VAT ratio, WC, and BMI in patients with APA but not in patients with IHA. These findings provide new insights into the relationship between adipose tissue and aldosterone excess in patients with APA and IHA. This suggests that patients with APA could be relatively lean during clinical practice, but still need to beware of higher risk of cardiac disease, such as heart failure, atrial fibrillation, ischemic heart disease, and other vascular events.
The original contributions presented in the study are included in the article/Supplementary Material. Further inquiries can be directed to the corresponding authors.
The studies involving human participants were reviewed and approved by National Taiwan University Hospital Research Ethics Committee. The patients/participants provided their written informed consent to participate in this study.
K-MC and J-SH carried out the experiment. K-MC wrote the manuscript with support from B-CL, P-TC, and K-HL. K-LL and Y-HL conceived the original idea. C-CC and T-HW supervised the project. All authors contributed to the article and approved the submitted version.
This study was supported by the research grants MOST109-2314-B-010 -023 -MY3 from the Ministry of Science and Technology, Taipei, Taiwan to T-HW.
The authors declare that the research was conducted in the absence of any commercial or financial relationships that could be construed as a potential conflict of interest.
The Supplementary Material for this article can be found online at: https://www.frontiersin.org/articles/10.3389/fendo.2021.647184/full#supplementary-material
1. Loh KC, Koay ES, Khaw MC, Emmanuel SC, Young WF Jr. Prevalence of Primary Aldosteronism Among Asian Hypertensive Patients in Singapore. J Clin Endocrinol Metab (2000) 85:2854–9. doi: 10.1210/jcem.85.8.6752
2. Wu VC, Hu YH, Er LK, Yen RF, Chang CH, Chang YL, et al. Case Detection and Diagnosis of Primary Aldosteronism - The Consensus of Taiwan Society of Aldosteronism. J Formos Med Assoc (2017) 116:993–1005. doi: 10.1016/j.jfma
3. Rossi GP, Bernini G, Caliumi C, Desideri G, Fabris B, Ferri C, et al. A Prospective Study of the Prevalence of Primary Aldosteronism in 1,125 Hypertensive Patients. J Am Coll Cardiol (2006) 48:2293–300. doi: 10.1016/j.jacc.2006.07.059
4. Douma S, Petidis K, Doumas M, Papaefthimiou P, Triantafyllou A, Kartali N, et al. Prevalence of Primary Hyperaldosteronism in Resistant Hypertension: A Retrospective Observational Study. Lancet (2008) 371:1921–6. doi: 10.1016/S0140-6736(08)60834-X
5. Calhoun DA. Hyperaldosteronism as a Common Cause of Resistant Hypertension. Annu Rev Med (2013) 64:233–47. doi: 10.1146/annurev-med-042711-135929
6. Matrozova J, Steichen O, Amar L, Zacharieva S, Jeunemaitre X, Plouin PF. Fasting Plasma Glucose and Serum Lipids in Patients With Primary Aldosteronism: A Controlled Cross-Sectional Study. Hypertension (2009) 53:605–10. doi: 10.1161/HYPERTENSIONAHA.108.122002
7. Somlóová Z, Widimský J Jr, Rosa J, Wichterle D, Strauch B, Petrák O, et al. The Prevalence of Metabolic Syndrome and Its Components in Two Main Types of Primary Aldosteronism. J Hum Hypertens (2010) 24:625–30. doi: 10.1038/jhh.2010.65
8. Krug AW, Ehrhart-Bornstein M. Aldosterone and Metabolic Syndrome: Is Increased Aldosterone in Metabolic Syndrome Patients an Additional Risk Factor? Hypertension (2008) 51:1252–8. doi: 10.1161/HYPERTENSIONAHA
9. Wu VC, Chueh SJ, Chen L, Chang CH, Hu YH, Lin YH, et al. Risk of New-Onset Diabetes Mellitus in Primary Aldosteronism: A Population Study Over 5 Years. J Hypertens (2017) 35:1698–708. doi: 10.1097/HJH.0000000000001361
10. Beuschlein F, Reincke M, Arlt W. The Impact of Connshing’s Syndrome – Mild Cortisol Excess in Primary Aldosteronism Drives Diabetes Risk. J Hypertens (2017) 35(12):2548. doi: 10.1097/HJH.0000000000001550
11. Fallo F, Pilon C, Urbanet R. Primary Aldosteronism and Metabolic Syndrome. Horm Metab Res (2012) 44:208–14. doi: 10.1055/s-0031-1295412
12. Goodfriend TL, Egan B, Stepniakowski K, Ball DL. Relationships Among Plasma Aldosterone, High-Density Lipoprotein Cholesterol, and Insulin in Humans. Hypertension (1995) 25:30–6. doi: 10.1161/01.hyp.25.1.30
13. Monticone S, Burrello J, Tizzani D, Bertello C, Viola A, Buffolo F, et al. Prevalence and Clinical Manifestations of Primary Aldosteronism Encountered in Primary Care Practice. J Am Coll Cardiol (2017) 69:1811–20. doi: 10.1016/j.jacc.2017.01.052
14. Chao CT, Wu VC, Kuo CC, Lin YH, Chang CC, Chueh SJ, et al. Diagnosis and Management of Primary Aldosteronism: An Updated Review. Ann Med (2013) 45:375–83. doi: 10.3109/07853890.2013.785234
15. Huang KH, Yu CC, Hu YH, Chang CC, Chan CK, Liao SC, et al. Targeted Treatment of Primary Aldosteronism - The Consensus of Taiwan Society of Aldosteronism. J Formos Med Assoc (2019) 118:72–82. doi: 10.1016/j.jfma.2018.01.006
16. Ohno Y, Sone M, Inagaki N, Yamasaki T, Ogawa O, Takeda Y, et al. Obesity as a Key Factor Underlying Idiopathic Hyperaldosteronism. J Clin Endocrinol Metab (2018) 103:4456–64. doi: 10.1210/jc.2018-00866
17. Zhang Z, Luo Q, Tuersun T, Wang G, Wu T, Zhang D, et al. Higher Prevalence of Metabolic Disorders in Patients With Bilateral Primary Aldosteronism Than Unilateral Primary Aldosteronism. Clin Endocrinol (Oxf) (2021) 94:3–11. doi: 10.1111/cen.14318
18. Wu VC, Yang SY, Lin JW, Cheng BW, Kuo CC, Tsai CT, et al. Kidney Impairment in Primary Aldosteronism. Clin Chim Acta (2011) 412:1319–25. doi: 10.1016/j.cca.2011.02.018
19. Chang CC, Chen YY, Lai TS, Zeng YH, Chen CK, Tu KH, et al. Taiwan Mini-Frontier of Primary Aldosteronism: Updating Detection and Diagnosis. J Formos Med Assoc (2020) 120:121–9. doi: 10.1016/j.jfma.2020.08.001
20. Aubrey J, Esfandiari N, Baracos VE, Buteau FA, Frenette J, Putman CT, et al. Measurement of Skeletal Muscle Radiation Attenuation and Basis of its Biological Variation. Acta Physiol (Oxf) (2014) 210:489–97. doi: 10.1111/apha.12224
21. Nagase M, Yoshida S, Shibata S, Nagase T, Gotoda T, Ando K, et al. Enhanced Aldosterone Signaling in the Early Nephropathy of Rats With Metabolic Syndrome: Possible Contribution of Fat-Derived Factors. J Am Soc Nephrol (2006) 17:3438–46. doi: 10.1681/ASN.2006080944
22. Colussi G, Catena C, Lapenna R, Nadalini E, Chiuch A, Sechi LA. Insulin Resistance and Hyperinsulinemia Are Related to Plasma Aldosterone Levels in Hypertensive Patients. Diabetes Care (2007) 30:2349–54. doi: 10.2337/dc07-0525
23. Yuan Y, Xu X, Zhao C, Zhao M, Wang H, Zhang B, et al. The Roles of Oxidative Stress, Endoplasmic Reticulum Stress, and Autophagy in Aldosterone/Mineralocorticoid Receptor-Induced Podocyte Injury. Lab Invest (2015) 95:1374–86. doi: 10.1038/labinvest.2015.118
24. Clemente-Postigo M, Tinahones A, El Bekay R, Malagón MM, Tinahones FJ. The Role of Autophagy in White Adipose Tissue Function: Implications for Metabolic Health. Metabolites (2020) 10:179. doi: 10.3390/metabo10050179
25. Pimenta E, Calhoun DA. Aldosterone and Metabolic Dysfunction: An Unresolved Issue. Hypertension (2009) 53:585–6. doi: 10.1161/HYPERTENSIONAHA.108.123406
26. Neeland IJ, Ayers CR, Rohatgi AK, Turer AT, Berry JD, Das SR, et al. Associations of Visceral and Abdominal Subcutaneous Adipose Tissue With Markers of Cardiac and Metabolic Risk in Obese Adults. Obes (Silver Spring) (2013) 21:E439–47. doi: 10.1002/oby.20135
27. Matsumoto T, Oki K, Kajikawa M, Nakashima A, Maruhashi T, Iwamoto Y, et al. Effect of Aldosterone-Producing Adenoma on Endothelial Function and Rho-associated Kinase Activity in Patients With Primary Aldosteronism. Hypertension (2015) 65:841–8. doi: 10.1161/HYPERTENSIONAHA.114.05001
28. Huang WC, Chen YY, Lin YH, Chen L, Lin PC, Lin YF, et al. Incidental Congestive Heart Failure in Patients With Aldosterone-Producing Adenomas. J Am Heart Assoc (2019) 8:e012410. doi: 10.1161/JAHA.119.012410
29. Kuo CC, Wu VC, Huang KH, Wang SM, Chang CC, Lu CC, et al. Verification and Evaluation of Aldosteronism Demographics in the Taiwan Primary Aldosteronism Investigation Group (Taipai Group). J Renin Angiotensin Aldosterone Syst (2011) 12:348–57. doi: 10.1177/1470320310391329
30. Ducher M, Mounier-Véhier C, Baguet JP, Tartière JM, Sosner P, Régnier-Le Coz S, et al. Aldosterone-to-Renin Ratio for Diagnosing Aldosterone-Producing Adenoma: A Multicentre Study. Arch Cardiovasc Dis (2012) 105:623–30. doi: 10.1016/j.acvd.2012.07.006
31. Okamoto R, Taniguchi M, Onishi Y, Kumagai N, Uraki J, Fujimoto N, et al. Predictors of Confirmatory Test Results for the Diagnosis of Primary Hyperaldosteronism in Hypertensive Patients With an Aldosterone-to-Renin Ratio Greater Than 20. The SHRIMP Study. Hypertens Res (2019) 42:40–51. doi: 10.1038/s41440-018-0126-1
32. Er LK, Lin MC, Tsai YC, Hsiao JK, Yang CY, Chang CC, et al. Association of Visceral Adiposity and Clinical Outcome Among Patients With Aldosterone Producing Adenoma. BMJ Open Diabetes Res Care (2020) 8:e001153. doi: 10.1136/bmjdrc-2019-001153
33. Shibayama Y, Wada N, Baba S, Miyano Y, Obara S, Iwasaki R, et al. Relationship Between Visceral Fat and Plasma Aldosterone Concentration in Patients With Primary Aldosteronism. J Endocr Soc (2018) 2:1236–45. doi: 10.1210/js.2018-00187
Keywords: primary aldosteronism, abdominal computed tomography, idiopathic hyperaldosteronism, aldosterone-producing adenoma, abdominal adiposity indexes
Citation: Chen K-M, Lee B-C, Chen P-T, Liu K-L, Lin K-H, Chang C-C, Wu T-H, Hong J-S and Lin Y-H (2021) Evaluation of Abdominal Computed Tomography Scans for Differentiating the Discrepancies in Abdominal Adipose Tissue Between Two Major Subtypes of Primary Aldosteronism. Front. Endocrinol. 12:647184. doi: 10.3389/fendo.2021.647184
Received: 29 December 2020; Accepted: 14 May 2021;
Published: 16 July 2021.
Edited by:
Qiang Wei, Sichuan University, ChinaReviewed by:
Nils Lambrecht, VA Long Beach Healthcare System, United StatesCopyright © 2021 Chen, Lee, Chen, Liu, Lin, Chang, Wu, Hong and Lin. This is an open-access article distributed under the terms of the Creative Commons Attribution License (CC BY). The use, distribution or reproduction in other forums is permitted, provided the original author(s) and the copyright owner(s) are credited and that the original publication in this journal is cited, in accordance with accepted academic practice. No use, distribution or reproduction is permitted which does not comply with these terms.
*Correspondence: Chin-Chen Chang, bWFjb3RvY2NAZ21haWwuY29t; Tung-Hsin Wu, dHVuZzcwNjFAZ21haWwuY29t
Disclaimer: All claims expressed in this article are solely those of the authors and do not necessarily represent those of their affiliated organizations, or those of the publisher, the editors and the reviewers. Any product that may be evaluated in this article or claim that may be made by its manufacturer is not guaranteed or endorsed by the publisher.
Research integrity at Frontiers

Learn more about the work of our research integrity team to safeguard the quality of each article we publish.