- 1Department of Integrative Physiology, Gunma University Graduate School of Medicine, Maebashi, Japan
- 2Education and Research Support Center, Gunma University Graduate School of Medicine, Maebashi, Japan
- 3Department of Bioscience and Laboratory Medicine, Hirosaki University Graduate School of Health Sciences, Hirosaki, Japan
- 4Department of Medicine, Johmoh Hospital, Maebashi, Japan
- 5Department of Nutrition and Health Sciences, Toyo University, Itakura, Japan
Thyroid hormone (TH) plays important roles in the developing brain. TH deficiency in early life leads to severe developmental impairment in the hippocampus. However, the mechanisms of TH action in the developing hippocampus are still largely unknown. In this study, we generated 3,5,3’-tri-iodo-l-thyronine (T3)-free neuronal supplement, based on the composition of neuronal supplement 21 (NS21), to examine the effect of TH in the developing hippocampus using primary cultured neurons. Effects of TH on neurons were compared between cultures in this T3-free culture medium (-T3 group) and a medium in which T3 was added (+T3 group). Morphometric analysis and RT-qPCR were performed on 7, 10, and 14 days in vitro (DIV). On 10 DIV, a decreased dendrite arborization in -T3 group was observed. Such difference was not observed on 7 and 14 DIV. Brain-derived neurotrophic factor (Bdnf) mRNA levels also decreased significantly in -T3 group on 10 DIV. We then confirmed protein levels of phosphorylated neurotrophic tyrosine kinase type 2 (NTRK2, TRKB), which is a receptor for BDNF, on 10 DIV by immunocytochemistry and Western blot analysis. Phosphorylated NTRK2 levels significantly decreased in -T3 group compared to +T3 group on 10 DIV. Considering the role of BDNF on neurodevelopment, we examined its involvement by adding BDNF on 8 and 9 DIV. Addition of 10 ng/ml BDNF recovered the suppressed dendrite arborization induced by T3 deficiency on 10 DIV. We show that the lack of TH induces a developmental delay in primary hippocampal neurons, likely caused through a decreased Bdnf expression. Thus, BDNF may play a role in TH-regulated dendritogenesis.
Introduction
Thyroid hormone (TH) plays important roles in general body growth, cardiovascular system coordination, skeletal muscle regulation, and central nervous system (CNS) development (1, 2). Especially, TH deficiency from the embryonic to neonatal period causes various developmental disorders, including in the brain, that in humans were originally called cretinism (3, 4). Perinatal TH deficiency induces brain dysfunction such as disrupted motor coordination, memory impairment, and decline in intelligence quotient (IQ) score (5, 6). Thus, the presence of TH during the perinatal period is essential for normal brain development.
The hippocampus is one of the brain regions strongly affected by perinatal TH deficiency (7, 8). As a part of the cerebral limbic system, the hippocampus is mainly responsible for memory and learning (9). Various symptoms from perinatal TH deficiency have been clarified in the hippocampus of animal models. Impairment of spatial memory caused by perinatal TH deficiency has been reported in the Morris water maze test and in the object location test (10–12). The mechanisms of these behavioral changes are considered to be induced by the reduction of synaptic transmission efficiency and neurotransmitter release in the hippocampus in TH-deficient mice (10) and rats (13–16). Morphologically, a decrease in the volume of the hippocampal CA1 and CA3 region, as well as a decrease in granule and pyramidal cell dendrite arborization, has been reported in the rat hippocampus (17–20).
Appropriate dendrite development represents a key element in generating neuronal networks required for normal brain function (21). TH deficiency leads to neurodevelopmental delay (22) and a decrease in dendrite arborization in various brain regions (19, 20, 23). In particular, decreased dendrite arborization of Purkinje cells and delayed maturation of granule cells have been reported in the rodent cerebellum (24, 25). The reduction of dendrite arborization of pyramidal cells and granular cells in the rat hippocampus has also been reported (19, 20). However, a limited number of studies have reported on the dendrite morphology in the hippocampus during the early developmental period with hypothyroid condition. In addition, the key molecules for induction of the decrease in dendrite arborization by TH deficiency have not yet been identified (19).
Here, we describe the action of 3,5,3’-tri-iodo-l-thyronine (T3), an active form of TH, on the growth of hippocampal neurons. Neurons in each brain region have their specific dendritic morphology, which may be mimicked in culture (26). It is relatively easy to study the morphology of the neuron and molecular mechanism in primary culture system. Therefore, we established a primary culture system of hippocampal neurons with or without T3 and analyzed the changes in their morphology and mRNA levels that may be involved TH-mediated brain development. We analyzed the dendrite morphology by Sholl analysis and the number of dendrite branches. We confirmed the mRNA levels of TH related genes, TH receptor genes, and synapse-related genes. TH related genes: neurotrophin 3 (Ntf3) and brain-derived neurotrophic factor (Bdnf) both of which are neurotrophic factor, neurogranin (Nrgn) which is calmodulin-binding protein, and hairless (Hr) which is lysine demethylase and nuclear receptor corepressor were reported to be regulated by TH (25, 27). TH receptor genes: TH receptor alpha (Thra) and TH receptor beta (Thrb) were selected because the action of TH is mostly through these receptors (28). Synapse-related genes: synapsin I (Syn1) and synaptophysin (Syp) both of which are pre-synapse related protein, and disks large membrane-associated guanylate kinase scaffold protein 4 (Dlg4) which is post-synapse related gene were selected to examine the effect of TH deficiency on the synapse. Cytoskeleton-associated gene: microtubule associated protein 2 (Map2) was selected because it is important molecule for dendrite elongation (29). We found that T3 is involved in dendrite development during the growth process in the primary cultured hippocampal neurons. Furthermore, the decrease in brain-derived neurotrophic factor (BDNF) induced by TH deficiency may play a major role in the reduction of dendrite arborization.
Materials and Methods
The experiments conducted in accordance with the guidelines and protocols were approved by the Animal Care and Experimentation Committee of the Gunma University (authorization number: 19-041). In this study, all efforts were made to minimize the suffering of animals and number of animals used.
Cell Culture
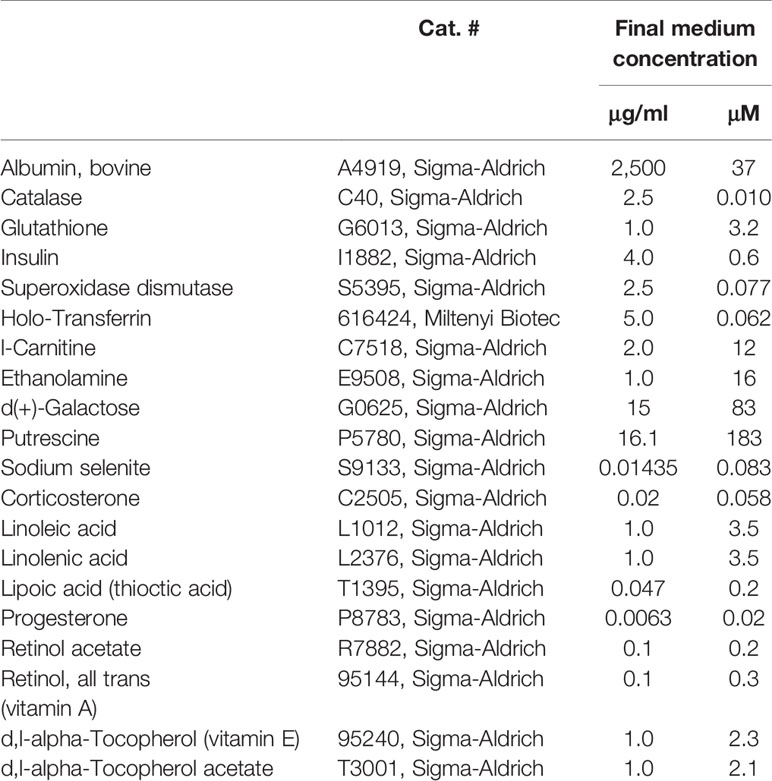
The formulation of the neuronal supplement 21 (NS21) defined supplement for serum-free neuronal culture media has previously been described in this study by Chen et al. (30). Based on the protocol in this paper, we generated a handmade neural supplement that does not contain T3 (Table 1) used for our cell culture system.
Pregnant C57BL/6J mice (gestation day 15/16) were purchased from SLC Japan (Hamamatsu, Shizuoka, Japan). The pregnant mice were decapitated under ketamine/xylazine anesthesthetic, and pups were taken out by cesarean section. After killing of the pups by hypothermia on ice, the hippocampus was removed (55 pregnant mice were used in total and 6–10 pups were taken from each pregnant mouse). Each culture contains cells of pups that were dissected out from the same dam. Brain tissues of pups from different dams were not mixed. Detailed methods for low-density culture of hippocampal neurons have previously been described (26, 31, 32). Briefly, the hippocampal tissue was digested for 10 min with shaking at 37°C using 15 U/ml of papain (Worthington Biochemical, Lakewood, NJ, USA) in phosphate buffered saline (PBS) containing 0.2 mg/ml L-cysteine, 0.2 mg/ml bovine serum albumin (BSA) (Thermo Fisher Scientific, Waltham, MA, USA), 5 mg/ml glucose, and 0.2 mg/ml DNase I (Sigma-Aldrich, St. Louis, MO, USA). Dissociated cells were placed at a density of 5,000–6,000 cells on 1 mg/ml poly-L-lysine (Sigma-Aldrich) coated round glass coverslips (12 mm in diameter) in a 24-well-plate. We placed one coverslip in each culture well. Cells were maintained in MACS Neuro Medium (Miltenyi Biotec, Bergisch Gladbach, Germany) containing 2% original neural supplement without T3 (Table 1), 1% 200 mM L-Glutamine (Thermo Fisher Scientific), and 1% 25 mM HEPES. Then, T3 dissolved in MACS Neuro Medium was added in some cultures at a final concentration of 3.0×10⁻⁹ M, the same concentration as for NS21 (+T3 group). The other group (-T3 group) received only vehicle. Cells were cultured in a 5% CO2 incubator at 37°C until 7, 10, and 14 DIV (Figure 1A). On 8 and 9 DIV, some of -T3 group received BDNF (PEPROTECH, Rocky Hill, NJ, USA) dissolved in 0.1% BSA containing Milli-Q water at a final concentration of 0.016, 0.4, and 10 ng/ml (Figure 1B). The concentration of 10 ng/ml BDNF was selected for this study, because it is in physiological range (33) and was an effective concentration for morphological analysis in previous studies (34). Concentration of 0.016 ng/mL BDNF was chosen for the lowest concentration and was identified by ELISA from the culture medium on 3 DIV (35). Concentration of 0.4 ng/ml BDNF was selected for the middle concentration between 10 to 0.016 ng/ml. Other cultures received vehicle of BDNF (0.1% BSA containing Milli-Q water). These cultured cells were maintained until 10 DIV.
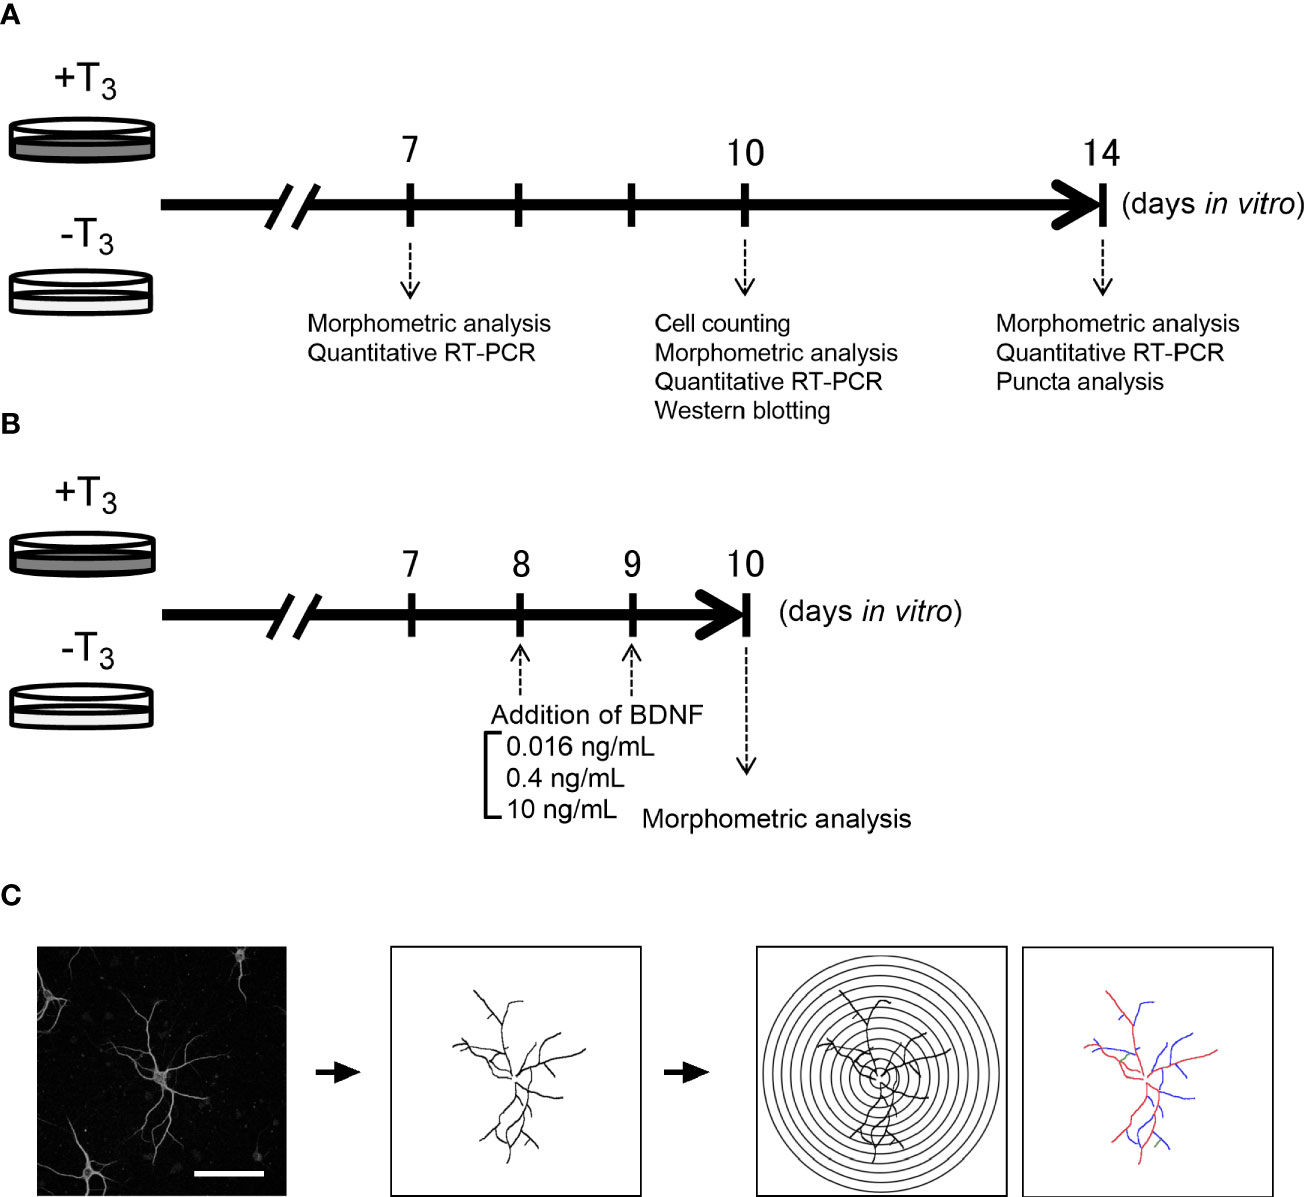
Figure 1 Schematic diagram of the experiment. Schedule of the overall experiment (A) and rescue experiment (B). Schematic diagram of Sholl analysis and quantification of the number of dendrite branches (primary dendrite branch: red, secondary dendrite branch: blue, tertiary dendrite branch: green) (C). Scale bar indicates 100 μm.
Immunocytochemistry
Hippocampal neurons were visualized by immunostaining. The primary hippocampal neurons on coverslips were fixed with 4% paraformaldehyde in PBS and were incubated with NH4Cl (50 mM) in PBS for 10 min. Then, cells were permeabilized with 0.1% Triton X-100 in PBS. After blocking with 5% fetal bovine serum in 0.3% Triton X-100, cells were incubated with primary antibodies overnight at 4°C. The following antibodies were used for 7, 10, and 14 DIV: Alexa Fluor 488 conjugated anti-MAP2 (Millipore Cat# MAB3418X, RRID: AB_571048; 1:1,000) and anti-synaptophysin (Cell Signaling Technology Cat# 5461P, RRID: AB_10838404; 1:1,000) antibody. The following antibodies were used for 10 DIV: anti-phosphorylated neurotrophic tyrosine kinase type 2 receptor (NTRK2) (Millipore Cat# ABN1381, RRID: AB_2721199, 1:500), anti-NTRK2 (BD Biosciences Cat# 610101, RRID: AB_397507, 1:1,000), anti-GFAP (Abcam Cat# ab7260, RRID: AB_305808, 1:1,000), and Alexa Fluor 488 conjugated anti-MAP2 antibody. The coverslips were rinsed with PBS and incubated with a secondary antibody conjugated with Alexa Fluor 596 Goat anti-rabbit IgG (Abcam Cat# ab150080, RRID: AB_2650602; 1:1,000) or with a secondary antibody conjugated with Alexa Fluor 596 Goat anti-rabbit IgG (Abcam Cat# ab150080, RRID: AB_2650602; 1:1,000) and Alexa Fluor 488 Goat anti-mouse IgG (Thermo Fisher Scientific Cat# A-11001, RRID: AB_2534069, 1:1,000) antibody for 1 h at room temperature. The coverslips were washed for 5 min in PBS, incubated for 30 min in 300 nM DAPI (Thermo Fisher Scientific Cat# D1306, RRID: AB_2629482) and mounted on glass slides with a Fluoromount/Plus (Diagnostic BioSystems, Pleasanton, CA, USA).
Quantification of Cell Number
Total cell number, neuronal cell number, and astrocyte cell number were acquired on 10 DIV with IN Cell Analyzer 2200 (GE Healthcare, Chicago, IL, USA). Sixteen fields were randomly selected by the computer from each coverslip, and average number of 16 fields in one coverslip per one dam dissection was used for statistical analysis. The images were analyzed using IN Cell Developer Toolbox v1.9 (GE Healthcare). Total cell number was recognized based on DAPI staining. Total neuronal number was identified based on MAP2 and DAPI staining. Total astrocyte number was identified based on glial fibrillary acidic protein (GFAP) and DAPI staining. Co-localized areas of MAP2 and DAPI, or GFAP and DAPI were extracted using a command of Segmentation, Sieve, and Dilation.
Cell Viability Assay
We conducted the 3-(4,5-dimethylthiazol-2-yl)-5-(3-carboxymethoxyphenyl)-2-(4-sulfophenyl)-2H-tetrazolium (MTS) assay (Promega, Madison, WI, USA) to confirm the cell viability on 10 DIV, as described in previous report (36). The succinic dehydrogenase found in the active mitochondria caused the conversion of MTS into aqueous soluble formation. Hippocampal neurons were seeded into 96-well plate (1,000–2,000 cells per well) and were maintained with or without T3 medium. On 8 and 9 DIV, BDNF were added to some of the -T3 group medium at a final concentration of 0.016, 0.4, and 10 ng/ml. The medium received MTS reagent and was incubated for 4 h in 5% CO2 at 37°C. The absorbance of each well was measured at 490 nm by using a micro-plate reader (Molecular Devices, San Jose, CA, USA). Relative values were calculated as percentages values of the +T3 group. Data were obtained from three independent dissections.
Morphometric Analysis
Sholl Analysis
We carried out a Sholl analysis for quantitative analysis of dendrite morphology by ImageJ Fiji software v1.51 (37–39) (Figure 1C). Images of MAP2- and DAPI-positive neurons on 7, 10, and 14 DIV were taken with a confocal microscope LSM880 (Carl Zeiss, Oberkochen, Germany). Neurons were selected based on the criteria; low dendrite entanglement with other neuronal dendrites, or no aggregation with other neurons. To avoid the objective bias, we adopted single-blind method. We analyzed neurons matching our search criteria. The coverslip was scanned from left top area to right top then right bottom to left bottom. Morphometric analysis of neurons matching the criteria was also done with this direction and continued until the number of neurons reached to twenty per one coverslip from one dam dissection, and 4–5 coverslips were imaged in each treatment group. The image of each neuron was manually traced on computer. The transparent layer which overlaid on the image of the neuron was used for tracing of the neuron. Manually traced images of neuron drawn in a transparent layer were used for Sholl analysis. The 10–300 μm equidistant concentric circles were overlaid on the image of the neuron centered on the cell body. The intersections between dendrites and each concentric circle were measured.
Counting the Number of Dendrites
We counted the number of primary, secondary, and tertiary dendrites per neuron to quantify the dendrite branches (Figure 1C) (40). The dendrite branches were manually counted from the images acquired, as described above.
Quantitative Analysis of the Pre-Synaptic Puncta
Using immunocytochemistry for synaptophysin, a representative presynaptic protein (23), we counted the number of pre-synaptic puncta. The images stained with MAP2, synaptophysin, and DAPI on 14 DIV were captured with a confocal microscope LSM880. For quantification of pre-synaptic puncta, digital images (1,192 × 1,192 pixels) were acquired. Spine density was manually determined along secondary or tertiary dendritic segments using the ImageJ Fiji software. The images of pre-synapse staining were subjected to a user-defined intensity threshold to select puncta. The threshold was not changed during all experiment. The pre-synaptic puncta were measured co-localized to MAP2 staining.
Quantitative RT-PCR
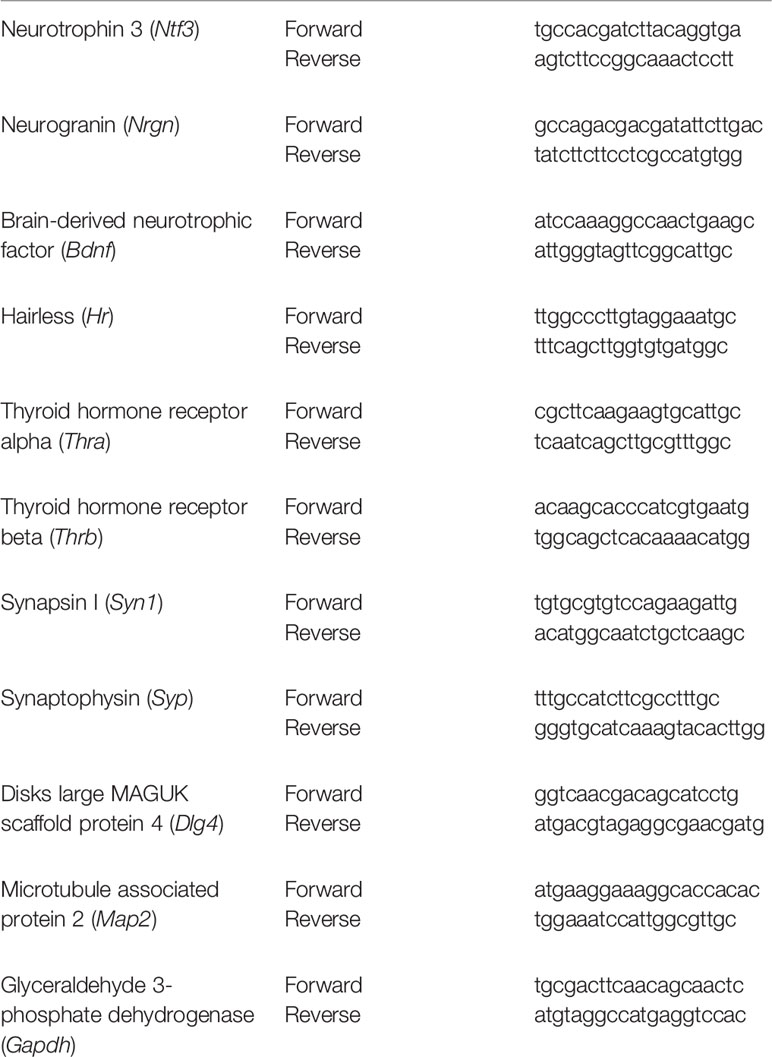
Total RNA was extracted from primary hippocampal neurons on 7, 10, and 14 DIV using QIAzol Lysis reagent (QIAGEN, Hilden, Germany). We harvested cell from three coverslips per one dam dissection, combined, and extracted total RNA. cDNA was synthesized from 250 ng of total RNA using ReverTra Ace qPCR RT Master Mix with gDNA Remover (TOYOBO, Osaka, Japan). Total RNA with 260/280 absorbance ratio higher than 1.8 was used. Specific primer sets were used for the following TH regulated genes: Ntf3, Nrgn, Bdnf (exon IX), Hr; TH receptor genes: Thra, Thrb; synapse-related genes: Syn1, Syp, Dlg4, cytoskeleton-associated gene; Map2. Primer sequences are described in Table 2. The quantitative RT-PCR protocol for all mRNAs was as follows: 95°C for 60 s; followed by 40 cycles of amplification at 95°C for 15 s; and 60°C for 45 s. The data were analyzed using the delta-delta Ct method. Levels of measured mRNAs were normalized by those of glyceraldehyde 3-phosphate dehydrogenase (Gapdh) used as internal control. The amplification efficiency of each primer set was 90 to 105%.
Western Blot Analysis
The expression levels of proteins were determined by Western blot analysis, as described previously (41). Briefly, total proteins were extracted from primary cultured hippocampal neurons in a lysis buffer containing 20 mM Tris-HCl (pH 8.0), 137 mM NaCl, 10% Glycerol, 1% Nonidet P40, and proteinase inhibitors. We harvested cells from 8 coverslips per one dam dissection, combined, and extracted protein. Protein concentration was measured by BCA Protein assay kit (Thermo Fisher Scientific) and 30 µg of total protein was used. Total protein was separated by sodium dodecyl sulfate-polyacrylamide gel electrophoresis and transferred to the nitrocellulose membrane. The membrane was blocked with 5% BSA in Tris Buffered Saline with 1% Tween 20 for 1 h at 4°C. Immunoblotting was performed using specific antibodies. Phosphorylated NTRK2 was detected using a rabbit polyclonal antibody against phosphorylated NTRK2 (Millipore Cat# ABN1381, RRID : AB_2721199, 1:500). NTRK2 was detected using a mouse monoclonal antibody NTRK2 (BD Biosciences Cat# 610101, RRID : AB_397507, 1:1,000). β-actin was detected using rabbit polyclonal antibody against β-actin (Cell Signaling Technology Cat# 4967, RRID : AB_330288, 1:2,000). The primary and secondary antibodies were stripped using Restore stripping buffer (Thermo Fisher Scientific). NTRK2 was used for normalization.
Statistical Analysis
After the morphometric analysis, the average value/neuron in each coverslip was used as a representative value. Each group consists of 4–5 coverslips obtained from different dam dissection. The average value of each group was calculated using this representative value and the statistical analysis was also performed using this representative value. For quantitative RT-PCR and Western blot analysis, as stated above, each sample was obtained from different dam dissection, indicating equal weighting of the value. Results are presented as mean ± standard error of the mean (SEM). GraphPad Prism v8.0 for Windows (GraphPad Software, San Diego, CA, USA) was used for statistical analysis. Statistical comparisons were performed by Student’s two-tailed t-test or by one- or two-way analysis of variance (ANOVA), followed by the Tukey’s test for post hoc analysis. Differences were considered significant at p-values <0.05.
Results
Absence of T3 Did Not Affect Cell Viability
To examine the cell viability, total cell number, neuronal cell number, and astrocyte cell number were assessed on 10 DIV using IN Cell Analyzer 2200. An average number of cells in 16 fields per one coverslip from one dam dissection was used for statistical analysis. Data were obtained from four coverslips from different dissection. There was no difference in total cell number and neuronal cell number between +T3 and -T3 group (Figures 2A, B). There are mainly three types of glial cell in the brain: astrocyte, oligodendrocyte, and microglia. We verified only the astrocyte number in the glial cells, because Xie et al. reported that oligodendrocyte and microglia could not survive in the neurobasal medium plus B27 supplement which is the origin of the NS21 (42). We examined the total astrocyte number using specific marker for astrocyte (anti-GFAP antibody) on 10 DIV. There was no difference in astrocyte cell number between +T3 and -T3 group on 10 DIV (Figures 2A, B). Cell viability was also investigated by MTS assay on 10 DIV. There was no difference among group (Supplemental Figure 1). These results indicate that absence of T3 did not induce hippocampal cell death.
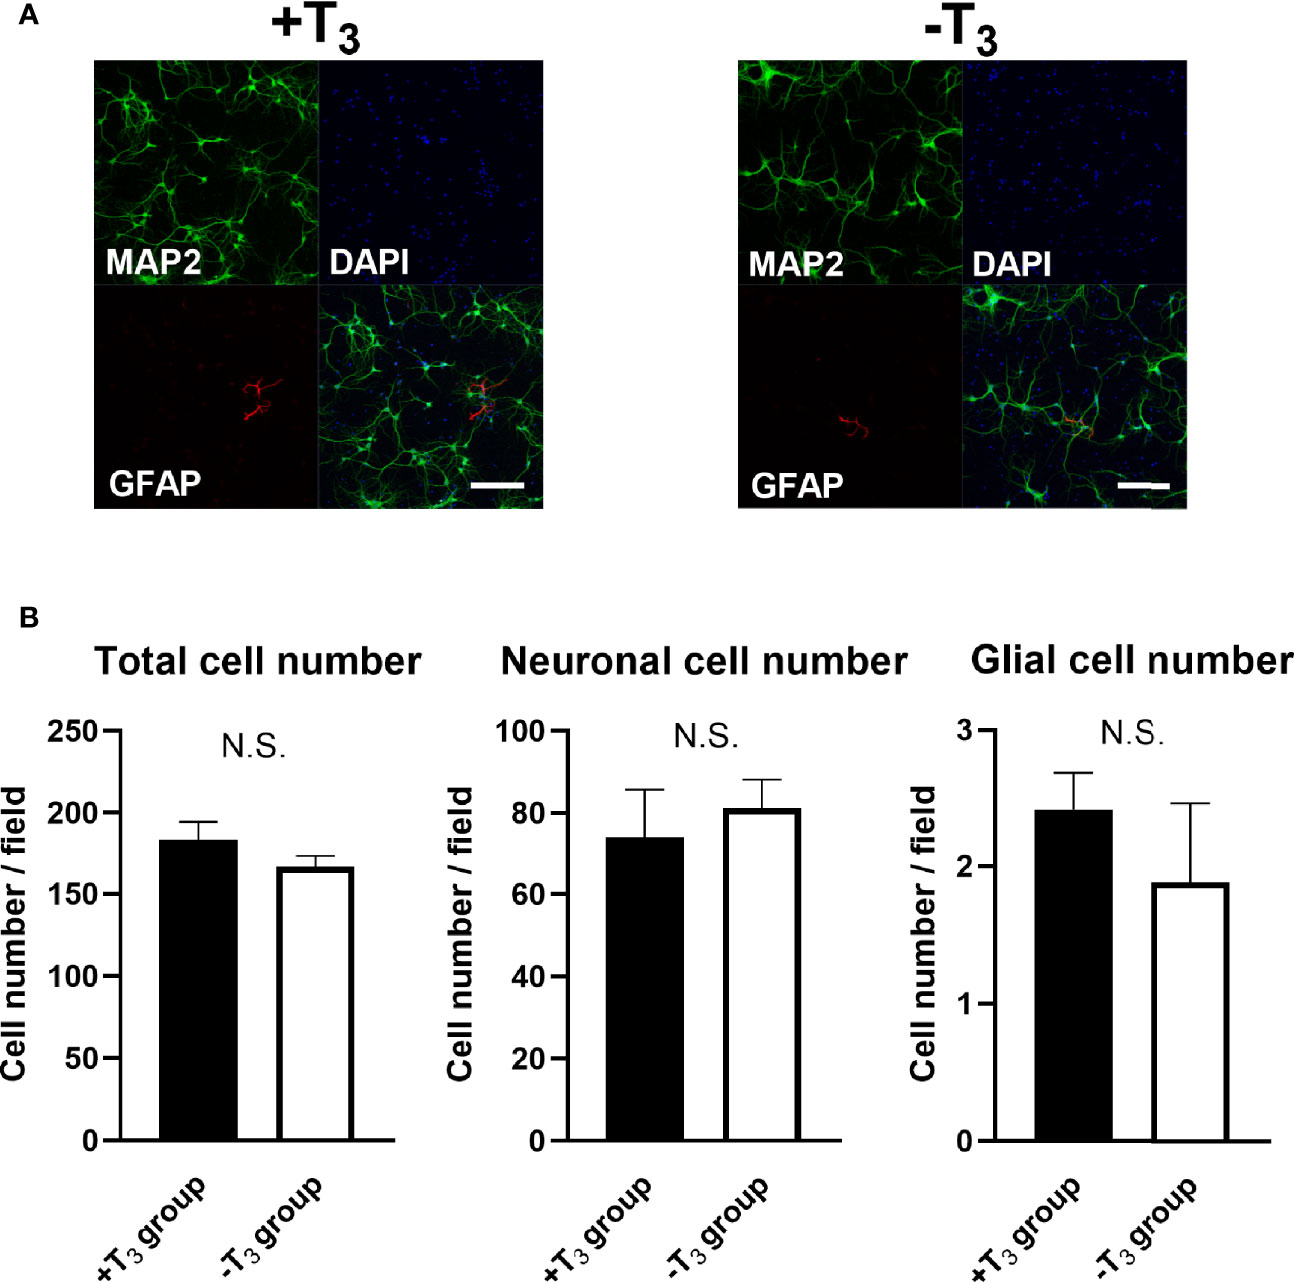
Figure 2 Absence of T3 did not change cell number on 10 DIV. (A) Representative images of the microtubule associated protein 2 (MAP2) (green), Glial fibrillary acidic protein (GFAP) (red), and DAPI (blue) immunoreactivities are shown. Scale bar indicates 200 μm. (B) Total cell number, Neuronal cell number, and astrocyte cell number were measured in +T3 and -T3 group using IN Cell Analyzer 2200. There were no significant differences in total cell number, neuronal cell number, and astrocyte cell number among groups on 10 DIV. Average number of 16 fields in one coverslip were used for statistical analysis. Data were obtained from four coverslips came from different dissections. (+T3 group, n = 4; -T3 group, n = 4). Graph shows means ± SEM.
T3-Free Hippocampal Neurons Showed Growth Retardation
To quantify the dendrite morphology of the +T3 and -T3 groups, we performed a Sholl analysis, which is a method to determine dendrite arborization and extension (39) (Figure 1C). The intersections with dendrites and concentric circles increased along with growth between 7 and 14 DIV (Figures 3A, B). Representative data from each coverslip was obtained by counting 20 neurons. The average value of each group was calculated using the average value of each coverslip as a representative value of each coverslip. The statistical analysis was also performed using this representative values (see Materials and Methods). While the number of intersections was not different between +T3 and -T3 groups on 7 DIV, it decreased significantly on 10 DIV in -T3 group compared with +T3 group [F(1, 176) = 44.88, p < 0.0001, ANOVA]. However, the difference was not observed on 14 DIV.
We next counted the number of primary, secondary, and tertiary dendrites to evaluate the effects of T3 on dendrite branching (Figure 3C). Data were obtained from 20 neurons and the data comparison and statistical analysis was performed as stated above. On 7 DIV, the average number of primary, secondary, and tertiary dendrites per neuron was similar in both groups. However, on 10 DIV, the average number secondary and tertiary dendrites decreased significantly in -T3 group [secondary: t(7) = 2.87, p = 0.0241; tertiary: t(7) = 3.52, p = 0.0098, t-test]. This difference was not observed on 14 DIV. These results indicated that the T3 exerts an effect on the morphology of primary hippocampal neurons only during a limited time window.
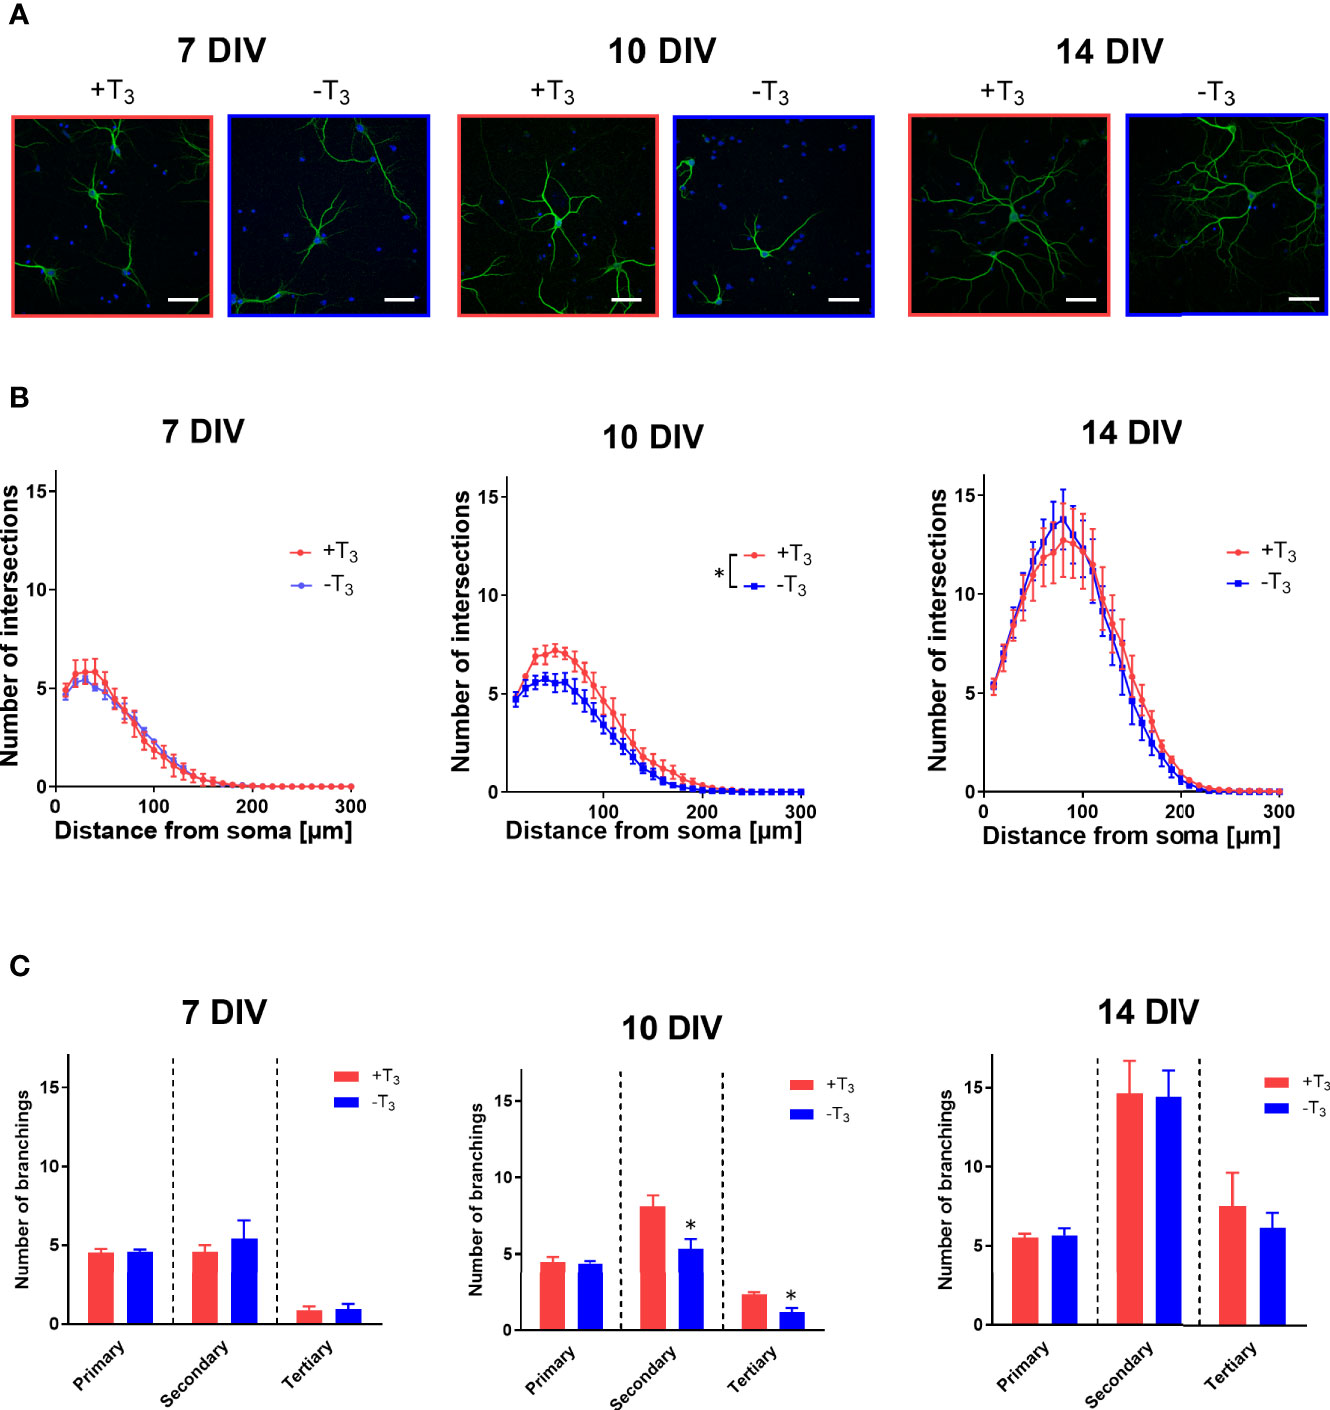
Figure 3 Hippocampal neurons cultured in T3-free medium showed growth retardation on 10 DIV. (A) Representative images of primary hippocampal neurons that were immunostained with a microtubule associated protein 2 (MAP2) antibody, from +T3 and -T3 group are shown. Scale bar indicates 50 μm. (B) The number of intersections of dendrite at each concentric circle, studied by Sholl analysis. Sholl results indicate that -T3 group shows less intersections on 10 DIV compared with +T3 group (*p < 0.05, two-way ANOVA). Data were obtained from 20 neurons per one coverslip. The average number of intersections were calculated and used as a representative number of each coverslip. Using this number, the average number of each group was calculated, and the statistical analysis was performed (7DIV: +T3 group, n = 4 coverslips; -T3 group, n = 4 coverslips; 10 DIV: +T3 group, n = 4 coverslips; -T3 group, n = 4 coverslips; 14 DIV: +T3 group, n = 5 coverslips; -T3 group, n = 4 coverslips). (C) In -T3 group, the number of secondary and tertiary dendrites significantly decreased on 10 DIV compared with +T3 group (*p < 0.05, t-test). Data analysis was performed as stated above (7DIV: +T3 group, n = 4; -T3 group, n = 4; 10 DIV: +T3 group, n = 4; -T3 group, n = 4; 14 DIV: +T3 group, n = 5; -T3 group, n = 4). Graphs in B, C show means ± standard error of the mean (SEM).
Number of Pre-Synaptic Puncta Did Not Change by T3 Treatment
We then counted the number of synaptic puncta to examine the change of pre-synapses by T3 (43, 44). Representative images of each group stained with synaptophysin (red) and MAP2 (green) are shown in Figure 4A. The number of synaptophysin-positive puncta on the 50 μm dendrite is shown in Figure 4B. Data were obtained from four coverslips came from different dissections; twenty neurons were analyzed per one coverslip. The average number of quantifications in each coverslip was used for statistical analysis as indicated above. The distribution of synapses was similar between +T3 and -T3 groups.
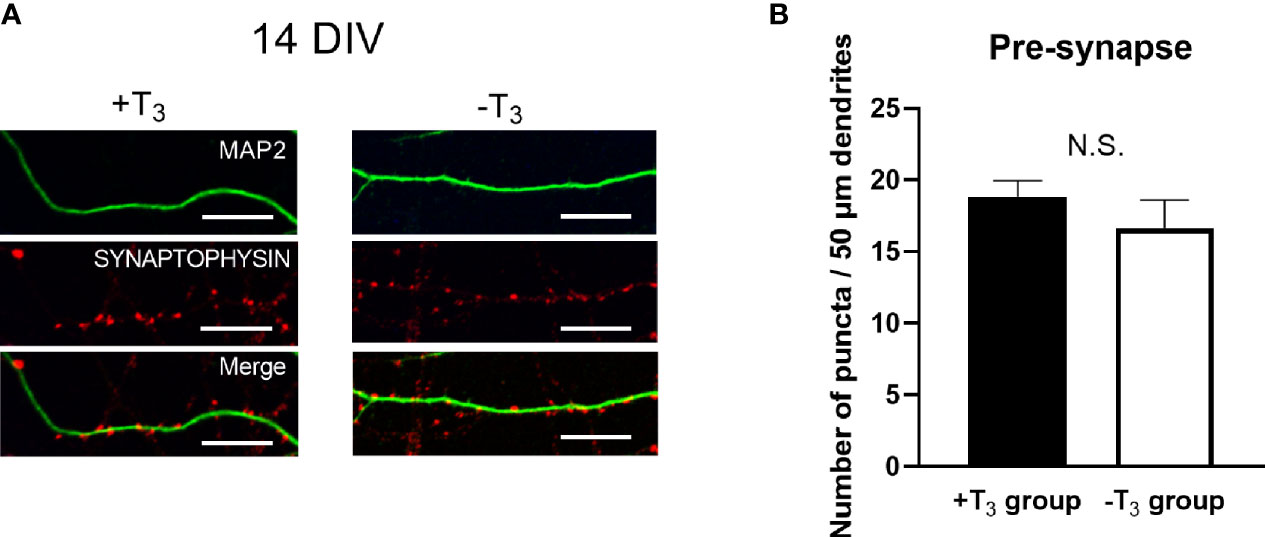
Figure 4 The number of synaptophysin-positive puncta on dendrites did not change in +T3 and -T3 group. (A) Representative images of the synaptophysin (red) on microtubule associated protein 2 (MAP2) (green) are shown. Scale bar indicates 10 μm. (B) The number of puncta in 50 µm dendrite. The number of dendritic puncta were not different between +T3 and -T3 groups. Twenty neurons were analyzed per one coverslip came from independent dissection. Then the data analysis was performed as indicated in the materials and methods section and in the legend of Figure 3 (+T3 group, n = 4; -T3 group, n = 4). Graph in B shows means ± SEM.
mRNA Levels of Primary Hippocampal Neurons
We performed quantitative RT-PCR to investigate changes in mRNA levels due to TH (Figure 5). We harvested cells from three coverslips per one dam dissection, combined all cells, and extracted total RNA. On 7 DIV, Nrgn and Hr mRNA levels decreased significantly in -T3 group compared with +T3 group [Nrgn: t(8) = 2.81, p = 0.0228; Hr: t(8) = 2.51, p = 0.0364, t-test]. On 10 DIV, when the abnormal dendrite arborization was observed, Bdnf and Syn1 mRNA levels decreased significantly in -T3 group [Bdnf: t(7) = 2.56, p = 0.0378, t-test; Syn1: t(7) = 2.67, p = 0.0319, t-test]. At this period, despite growth retardation observed in -T3 group, the mRNA levels of cytoskeletal-related protein did not change. On 14 DIV, Nrgn, Hr, and Thrb mRNA levels decreased significantly in -T3 group [Nrgn: t(10) = 2.23, p = 0.0495; Hr: t(7) = 2.58, p = 0.0366; Thrb: t(7) = 2.79, p = 0.0268, t-test].
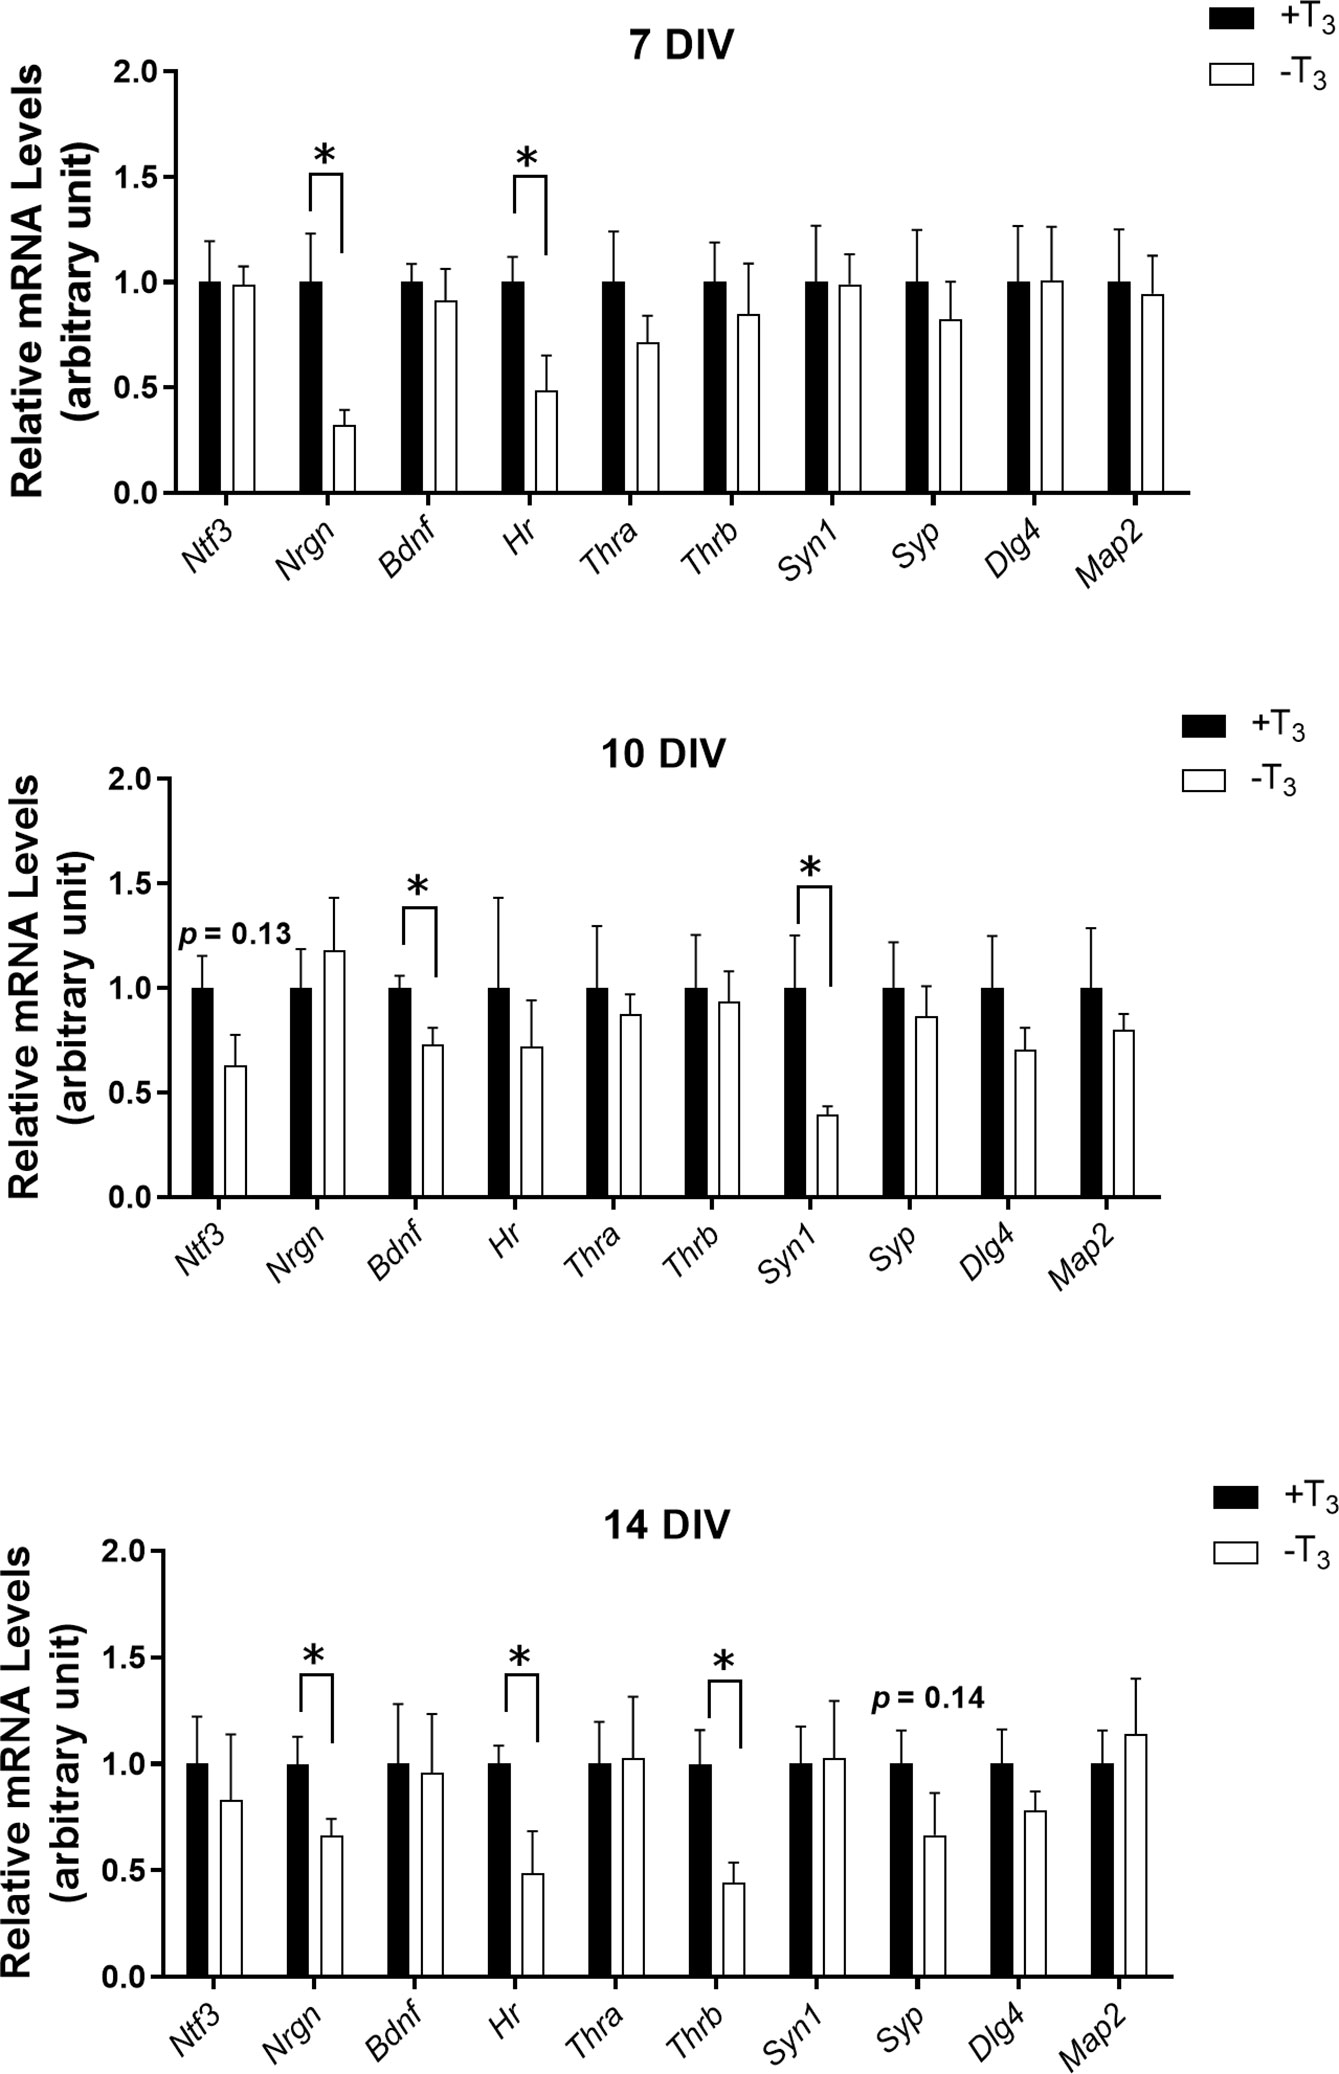
Figure 5 mRNA levels of TH-related genes and synaptic proteins of +T3 or -T3 group on 7, 10, and 14 DIV. The mRNA levels were normalized to glyceraldehyde 3-phosphate dehydrogenase (Gapdh) mRNA levels. We harvested cells from three coverslips per one dam dissection, combined all cells, extracted total RNA, and used for quantitative RT-PCR (7DIV: +T3 group, n = 5; -T3 group, n = 5; 10 DIV: +T3 group, n = 4–5; -T3 group, n = 5; 14 DIV: +T3 group, n = 5–6; -T3 group, n = 4–6). Asterisks indicate a statistical difference between +T3 and -T3 groups (*p < 0.05, t-test). Graph shows means ± SEM.
Decreased dendrite arborization was observed on 10 DIV. However, this difference was not observed on 14 DIV and no significant changes were observed in the number of presynaptic puncta on 14 DIV. Quantitative RT-PCR results indicated that Bdnf mRNA levels significantly decreased on 10 DIV with decreased dendrite arborization, although TH receptor (TR) (Thra and Thrb) mRNA levels did not change on 10 DIV. Thus, the decreased dendrite arborization is likely caused by a mechanism mediated by TH.
BDNF Rescued the Growth Retardation of T3-Free Hippocampal Neurons
Based on the simultaneous decrease of Bdnf mRNA levels and abnormal dendrite arborization on 10 DIV, we examined whether BDNF is involved in this process. We confirmed the decrease in BDNF signaling in -T3 group on 10 DIV by checking the phosphorylation levels of NTRK2, which is a receptor for BDNF (Figures 6A, B). The phosphorylation of NTRK2 is triggered by binding with BDNF leading to the activation of downstream signaling pathways (45, 46). Thus, the phosphorylation levels of NTRK2 can be an indication of the signal intensity of BDNF. We conducted immunocytochemistry and Western blot analysis to verify the phosphorylated NTRK2 levels (Figures 6A, B). We harvested cells from eight coverslips per one dam dissection, combined, and extracted protein. In the immunocytochemistry study, -T3 group tended to show lower signal of phosphorylated NTRK2 compared with +T3 group (Figure 6A). In the Western blot study (Figures 6B, C), the phosphorylated NTRK2 levels of -T3 group significantly lowered compared with +T3 group [t(11) = 2.69, p = 0.0211; t-test] (Figure 6C). These results indicate that BDNF involved in the dendrite arborization on 10 DIV.
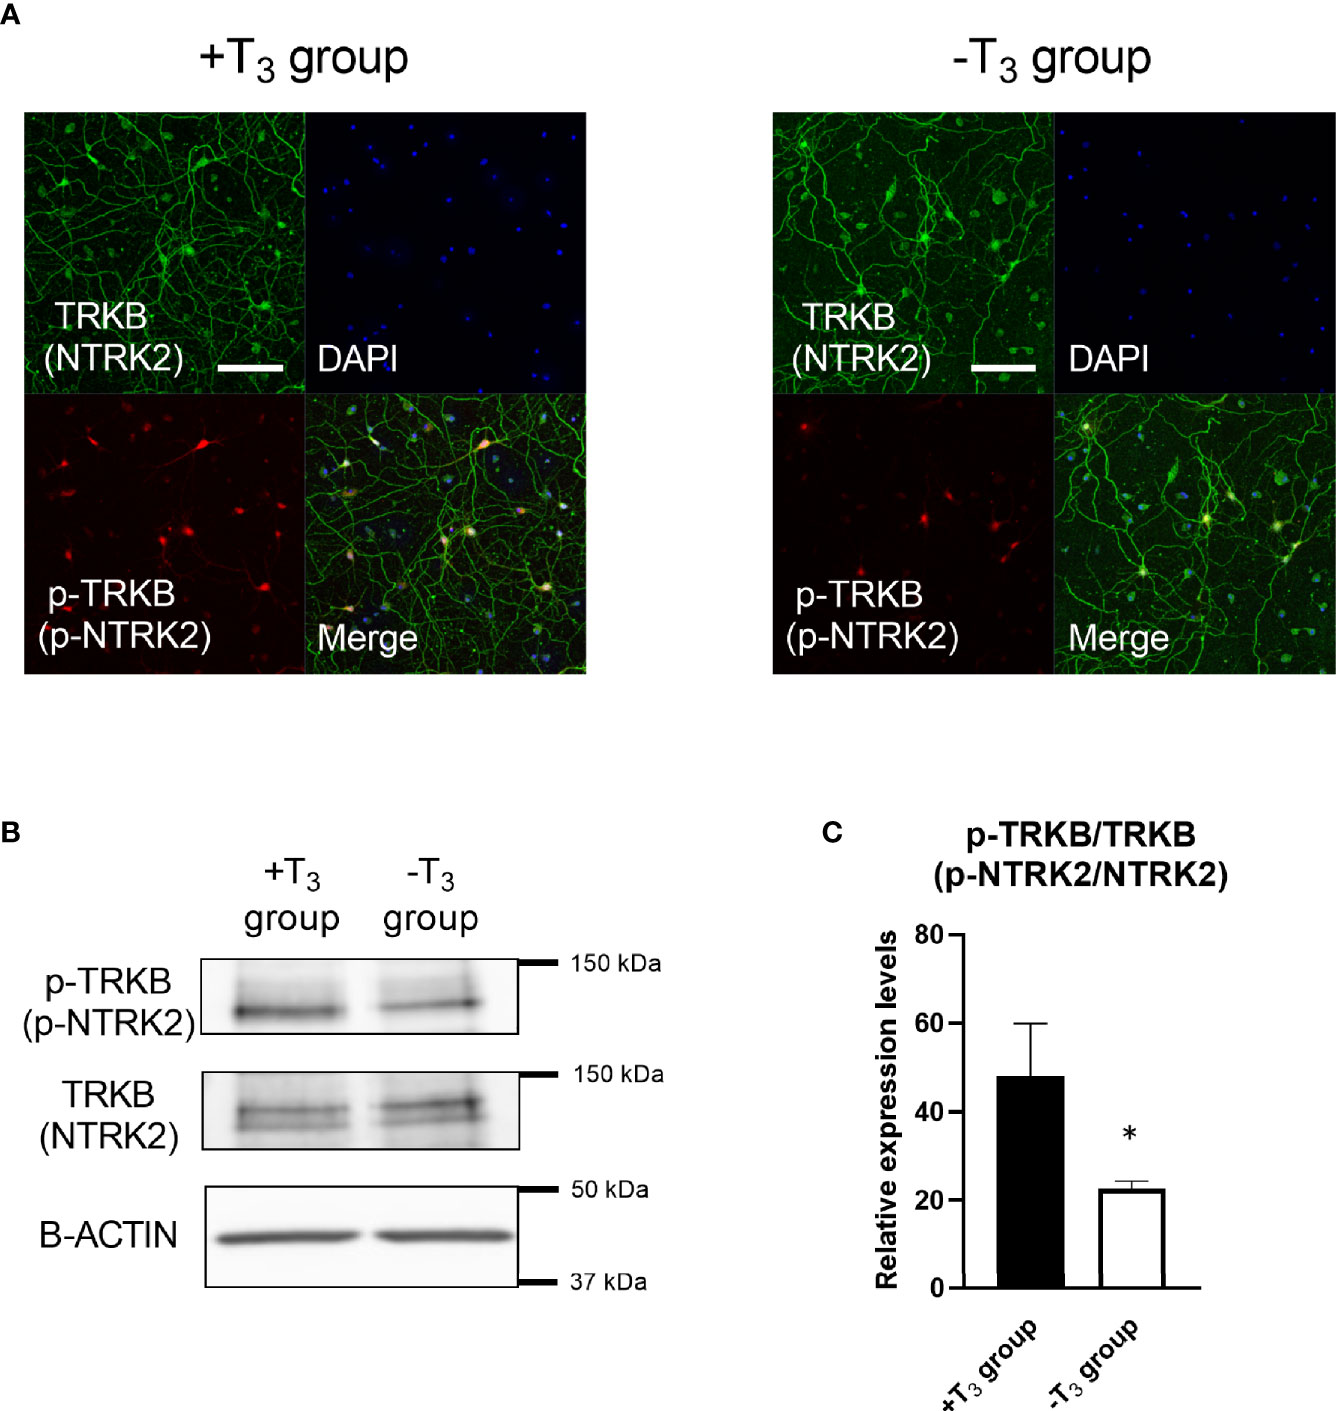
Figure 6 Phosphorylated tyrosine kinase receptor B (p-TRKB, p-NTRK2) levels of -T3 group is decreased compared with +T3 group. (A) Representative images of the TRKB (NTRK2) (green), and p-TRKB (red) immunoreactivity and DAPI (blue) staining are shown. Scale bar indicates 50 μm. (B) Representative result of Western blot for p-TRKB, TRKB, and β-actin. (C) The change in the ratio of p-TRKB/TRKB levels in Western blot. We harvested cell from 8 coverslips per one dam dissection, combined, extracted protein, and used for Western blot analysis. The p-TRKB levels decreased significantly in -T3 group (n = 8) compared with +T3 group (n = 5) (*p < 0.05, t-test). Data were obtained from five–eight independent dissection (+T3 group, n = 5; -T3 group, n = 8). TRKB were used for normalization. Graph shows mean ± SEM.
We also examined whether BDNF addition ameliorates decrease in dendrite arborization on 10 DIV in -T3 group. BDNF at concentration of 0.016, 0.4, and 10 ng/ml was added to -T3 group culture on 8 and 9 DIV, and the dendrite arborization was measured by Sholl analysis on 10 DIV. The number of intersections increased by BDNF in a concentration-dependent manner (Figures 7A, B). The number of intersections was significantly different between +T3 group and -T3 group [F(4, 449) = 86.91, p < 0.0001, two-way ANOVA, p < 0.0001, Tukey’s post hoc test], and between +T3 group and the lowest BDNF concentration (0.016 ng/ml) group [F(4, 449) = 86.91, p < 0.0001, two-way ANOVA, p < 0.0001, Tukey’s post hoc test]. A significant difference in the number of intersections was observed between the group of highest BDNF concentration (10 ng/ml) and -T3 group [F(4, 449) = 86.91, p < 0.0001, two-way ANOVA, p < 0.0001, Tukey’s post hoc test], and between the group with highest BDNF concentration and group with lowest BDNF concentration [F(4, 449) = 86.91, p < 0.0001, two-way ANOVA, p < 0.0001, Tukey’s post hoc test]. There was no difference between +T3 group and the group with highest BDNF concentration.
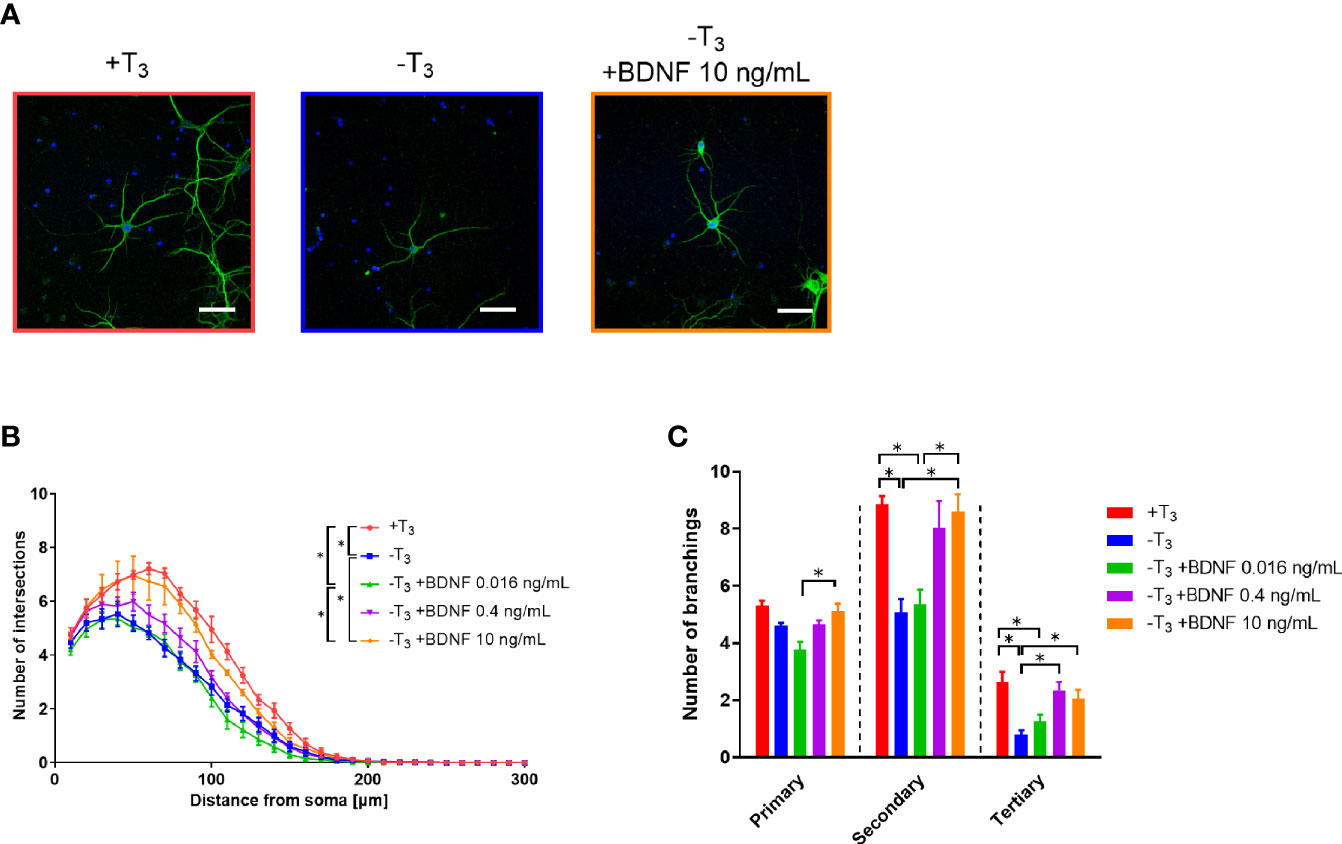
Figure 7 Addition of brain-derived neurotrophic factor (BDNF) rescued the decrease in dendrite arborization in -T3 group. (A) Representative images of MAP2 immunoreactivity showing the dendrite morphology of +T3, -T3, and the 10 ng/ml BDNF-supplemented group. Scale bar indicates 50 μm. (B) The number of intersections of dendrite at each concentric circle, studied by Sholl analysis. Sholl analysis indicates that +T3 and the highest BDNF concentration group are significantly different from -T3 group and the lowest BDNF concentration group (*p < 0.05, Tukey’s test). Data were obtained from 20 neurons per one coverslip came from independent dissection. Then the data analysis was performed as indicated in the materials and methods section and in the legend of Figure 3 (+T3 group, n = 4; -T3 group, n = 4; -T3 +BDNF 0.016 ng/ml group, n = 4; -T3 +BDNF 0.4 ng/ml group, n = 4; -T3 +BDNF 10 ng/ml group, n = 4). (C) The addition of 10 ng/ml BDNF normalized the number of intersections similar to the +T3 group. Data were obtained from 20 neurons per one coverslip came from independent dissection. Then the data analysis was performed as indicated in the materials and methods section and in the legend of Figure 3 (+T3 group, n = 4; -T3 group, n = 4; -T3 +BDNF 0.016 ng/ml group, n = 4; -T3 +BDNF 0.4 ng/ml group, n = 4; -T3 +BDNF 10 ng/ml group, n = 4). Graphs in B, C show means ± SEM.
We also counted the number of primary, secondary, and tertiary dendrites of +T3, -T3, and BDNF-supplemented groups (Figure 7C), respectively. The number of primary dendrites did not differ between the +T3 and -T3 group. The number of secondary dendrites as well as the -T3 group was significantly different between the +T3 group [F(4, 15) = 9.225, p < 0.0006, one-way ANOVA, p = 0.0037, Tukey’s post hoc test] and the highest BDNF concentration (p = 0.0063, Tukey’s post hoc test).
Sholl analysis indicated that the decrease in dendrite arborization on 10 DIV was recovered by 10 ng/ml of BDNF treatment on 10 DIV. A concentration dependent increase of BDNF was observed in the number of secondary branches.
Discussion
Herein, we investigated the effect of TH in the developmental process of hippocampal neurons in primary culture with or without T3. We analyzed the changes in dendritogenesis, synaptogenesis, mRNA levels, and protein levels. The decrease in dendrite arborization was observed only on 10 DIV (Figure 3). After this period, dendrite arborization caught up even without T3 and was at a level similar to +T3 group on 14 DIV. Because Bdnf mRNA levels also decreased in -T3 group on 10 DIV (Figure 5), we verified phosphorylated NTRK2 levels on 10 DIV to confirm the decrease in BDNF signaling in -T3 group. Phosphorylated NTRK2 levels significantly decreased in -T3 group on 10 DIV (Figure 6). We then attempted a rescue experiment by adding 10 ng/ml of BDNF to -T3 group (Figure 7). BDNF treatment rescued the phenotype of disrupted dendrite growth due to the absence of T3. indicating that BDNF is involved in TH-mediated dendrite arborization.
Change of Gene Transcription Due to Thyroid Hormone Deficiency
TH is involved in the regulation of various genes expression (25, 47–49). Some of these genes are expressed in the brain and their expression is altered in perinatal hypothyroidism. The expression of the following neurotrophic factors; nerve growth factor (Ngf), Ntf3, and Bdnf has been reported to be altered by perinatal hypothyroidism. In a rat model of perinatal hypothyroidism, Ngf mRNA levels are decreased in the hippocampal dentate gyrus and CA1 region (50), and Ntf3 mRNA levels are decreased in the dentate gyrus (50). Furthermore, Bdnf mRNA levels decrease on postnatal days (P) 15 and 30 in the rat perinatal hippocampus with hypothyroidism, whereas they return to normal on P60 (51). In the present study, T3 treatment did not affect Ntf3 mRNA levels. On the other hand, Bdnf mRNA levels decreased in -T3 group specifically on 10 DIV (Figure 5). Moreover, our results are comparable to those in the study by Sui and Li et al., showing that the Bdnf mRNA levels in the rat hippocampus are normalized over time regardless of TH status. On the other hand, mRNA levels of TR, Thra, and Thrb were not altered by TH status (Figure 5). The general mechanism of transcriptional regulation of TR implies a TH-dependent activated transcription factor: when TH binds to TR, a co-activator protein complex is recruited by TR and target genes are transcribed (52). Therefore, the decrease in Bdnf mRNA levels in -T3 group is due to the lack of TH action, not to the difference in TR expression levels. Moreover, Map2, which is binding protein to the microtubules and is important component of dendrite elongation and stabilize microtubules (29), mRNA levels were similar in both groups, indicating that the change in dendrite development is not due to the change of Map2 levels.
Relationship Between Thyroid Hormone and Dendrite Arborization
BDNF belongs to the neurotrophin family, which plays important roles in neuronal survival and development (32, 53, 54). The action of BDNF on neuronal development has been well explored using knockout animals. Morphometric alterations such as reduction of dendrite arborization and extension have been reported in Bdnf gene conditional knockout mice (32, 55). Sui et al. demonstrated that perinatal hypothyroidism cause decreased BDNF transcription levels and expression levels during P1 to 30 in the hippocampus (51). Rami et al. revealed that decreased dendritic arborization occurred in the perinatal hypothyroid rat in the hippocampal granule and pyramidal cell on P6 and 10 (20). Thus, Bdnf is suggested to be involved in the TH-mediated development of hippocampal neurons. In this study, the reduction of Bdnf mRNA level observed on 10 DIV concomitant to the suppression of dendrite arborization in -T3 group. Bdnf gene is transcribed from multiple promoters (56). Based on a previous study showing that BDNF increased the number of primary dendrites in primary cultured hippocampal neurons (57), we also counted the number of dendritic branches. Although we could not clearly see the effect of BDNF on the development of primary dendrite branches in -T3 group, the deficient growth of secondary and tertiary branches was rescued by BDNF (Figure 7). Taken together, our study demonstrated that BDNF is involved in TH-mediated elongation and branching of dendrites in the hippocampus. However, the mechanism of BDNF action remains to be fully understood. Receptors for BDNF, such as NTRK2, are expressed in hippocampal neurons (58). Whether BDNF activates an intracellular signaling pathway through NTRK2 binding is yet to be demonstrated. Moreover, downstream targets inducing dendritogenesis remain to be identified and warrant further studies.
Action of Thyroid Hormone on Synaptogenesis and Function
In the present study, we found that the decreased dendrite arborization occurred on 10 DIV and this alternation returned to normal on 14 DIV. This phenomenon is considered to be a “catch-up growth”. In addition to TH and BDNF, the dendritic growth is regulated by several other molecules (59). Although the mechanisms causing the catch-up growth cannot be clarified, such additional molecules may contribute to the “catch-up growth”. These results of the present study are analogous to the previous report of temporal morphological alternation in the cerebellum in thyroid hormone-deficient mice (24). This report indicated that despite morphological alternation return to normal, the impairment of synaptic function is remaining (24). TH is involved in synaptic formation and neuron functions (23, 60); for instance, the reduction of the number of synapses and the decrease in paired-pulse ratio, which is the indicator of calcium-dependent neurotransmitter release probability related to short-term synaptic plasticity (61), have been reported (15, 23, 24). Using synaptophysin immunocytochemistry (Figure 4), we observed no difference in the number of pre-synaptic puncta, a result inconsistent with results of previous studies showing the decrease in the number of synapse in the cerebral and cerebellar neurons in hypothyroid animals (62–64). This might be due to the action of TH on synaptogenesis being different in the hippocampus by comparison to the cerebral cortex and cerebellum. As primary cultured neurons form pre- and post-synapses, we also measured mRNA levels of representative proteins involved in synaptic functions (65). Significant decreases in presynaptic protein mRNAs, Syn1 were observed in -T3 group on 10 DIV, whereas no difference was observed in postsynaptic protein (Dlg4) mRNA (Figure 5). These results indicate that, although TH does not affect synaptogenesis, it may affect synaptic function by regulating the expression of synaptic proteins, particularly at the presynaptic level. Previous study demonstrated that the alteration of synaptic transmission and the reduction in paired-pulse facilitation, which was disrupted by the change in calcium-mediated functions in the pre-synapse, occurred in the rodent hippocampus under perinatal thyroid hormone deficiency (11, 13). It have been reported that the post-synaptic secretion of BDNF was induced in the neuronal activity- and calcium-dependent manner (66). BDNF localizes not only post synaptically but also pre synaptically with a higher pre synaptic levels (67, 68). Therefore, the alternation of synaptic transmission and change in calcium-mediated functions might involve in the decline in the BDNF signaling.
The present study demonstrates that the lack of TH transiently induces abnormal dendrite arborization in the cultured hippocampal neuron. Such aberrant dendrite arborization is rescued by addition of 10 ng/ml BDNF. Our results, along with studies in a rat model of hypothyroidism, indicate that the abnormal dendrite arborization in animals may be, at least in part, caused by the decreased expression of BDNF.
Data Availability Statement
The raw data supporting the conclusions of this article will be made available by the authors, without undue reservation.
Ethics Statement
The animal study was reviewed and approved by Animal Care and Experimentation Committee of the Gunma University.
Author Contributions
HY conducted the whole experiment and prepared the data and manuscript. IA and NK designed complete study, supported the whole experiment, and supervised manuscript. IA and NK integrated complete study and supervised manuscript. IA and NK had responsibility for the whole experiment. SI, TS, WM, and YT supervised the whole experiment and helped to draft the manuscript. All authors contributed to the article and approved the submitted version.
Funding
This work was supported by the Grant-in-Aid for Scientific Research (B) (Grant 18H03379 to NK) and Grant-in-Aid for Early-Career Scientists (Grant 19K16486 to IA) from the Japan Society for the Promotion of Sciences.
Conflict of Interest
The authors declare that the research was conducted in the absence of any commercial or financial relationships that could be construed as a potential conflict of interest.
Acknowledgments
We thank the member of the Department of Integrative Physiology, Gunma University Graduate School of Medicine, for their technical assistance and advice. We thank Dr. Masaki Fukata, Dr. Yuko Fukata, and Dr. Norihiko Yokoi, National Institute for Physiological Sciences, for their assistance with culture preparation. We thank Dr. Junko Kimura-Kuroda, Tokyo Metropolitan Institute of Medical Science, for assistance with culture. We thank Dr. Yasuki Ishizaki, Department of Molecular and Cellular Neurobiology, Gunma University Graduate School of Medicine, for technical advice for immunocytochemical analysis.
Supplementary Material
The Supplementary Material for this article can be found online at: https://www.frontiersin.org/articles/10.3389/fendo.2021.629100/full#supplementary-material
References
1. Cabello G, Wrutniak C. Thyroid hormone and growth: Relationships with growth hormone effects and regulation. Reprod Nutr Dev (1989) 29:387–402. doi: 10.1051/rnd:19890401
2. Louzada RA, Carvalho DP. Similarities and differences in the peripheral actions of thyroid hormones and their metabolites. Front Endocrinol (Lausanne) (2018) 9:394:394. doi: 10.3389/fendo.2018.00394
3. Chen ZP, Hetzel BS. Cretinism revisited. Best Pract Res Clin Endocrinol Metab (2010) 24:39–50. doi: 10.1016/j.beem.2009.08.014
4. Glinoer D. Clinical and biological consequences of iodine deficiency during pregnancy. Endocr Dev (2007) 10:62–85. doi: 10.1159/000106820
5. Williams GR. Neurodevelopmental and neurophysiological actions of thyroid hormone. J Neuroendocrinol (2008) 20:784–94. doi: 10.1111/j.1365-2826.2008.01733.x
6. Zoeller RT, Rovet J. Timing of thyroid hormone action in the developing brain: Clinical observations and experimental findings. J Neuroendocrinol (2004) 16:809–18. doi: 10.1111/j.1365-2826.2004.01243.x
7. Gilbert ME, Lasley SM. Developmental thyroid hormone insufficiency and brain development: A role for brain-derived neurotrophic factor (BDNF)? Neuroscience (2013) 239:253–70. doi: 10.1016/j.neuroscience.2012.11.022
8. Reid RE, Kim EM, Page D, O’Mara SM, O’Hare E. Thyroxine replacement in an animal model of congenital hypothyroidism. Physiol Behav (2007) 91:299–303. doi: 10.1016/j.physbeh.2007.03.005
9. Squire LR. Memory and the Hippocampuss: A Synthesis From Findings With Rats, Monkeys, and Humans. Psychol Rev (1992) 99:195–231. doi: 10.1037/0033-295X.99.2.195
10. Amano I, Takatsuru Y, Khairinisa MA, Kokubo M, Haijima A, Koibuchi N. Effects of Mild Perinatal Hypothyroidism on Cognitive Function of Adult Male Offspring. Endocrinology (2018) 159:1910–21. doi: 10.1210/en.2017-03125
11. Gilbert ME, Sui L. Dose-dependent reductions in spatial learning and synaptic function in the dentate gyrus of adult rats following developmental thyroid hormone insufficiency. Brain Res (2006) 1069:10–22. doi: 10.1016/j.brainres.2005.10.049
12. Khairinisa MA, Takatsuru Y, Amano I, Kokubo M, Haijima A, Miyazaki W, et al. In utero and postnatal propylthiouracil-induced mild hypothyroidism impairs maternal behavior in mice. Front Endocrinol (Lausanne) (2018) 9:228. doi: 10.3389/fendo.2018.00228
13. Sui L, Gilbert ME. Pre- and postnatal propylthiouracil-induced hypothyroidism impairs synaptic transmission and plasticity in area CA1 of the neonatal rat hippocampus. Endocrinology (2003) 144:4195–203. doi: 10.1210/en.2003-0395
14. Sánchez-Huerta KB, Montes S, Pérez-Severiano F, Alva-Sánchez C, Ríos C, Pacheco-Rosado J. Hypothyroidism reduces glutamate-synaptic release by ouabain depolarization in rat CA3-hippocampal region. J Neurosci Res (2012) 90:905–12. doi: 10.1002/jnr.22806
15. Vara H, Martínez B, Santos A, Colino A. Thyroid hormone regulates neurotransmitter release in neonatal rat hippocampus. Neuroscience (2002) 110:19–28. doi: 10.1016/S0306-4522(01)00541-3
16. Vara H, Muñoz-Cuevas J, Colino A. Age-dependent alterations of long-term synaptic plasticity in thyroid-deficient rats. Hippocampus (2003) 13:816–25. doi: 10.1002/hipo.10132
17. Madeira MD, Cadete-Leite A, Andrade JP, Paula-Barbosa MM. Effects of hypothyroidism upon the granular layer of the dentate gyrus in male and female adult rats: A morphometric study. J Comp Neurol (1991) 314:171–86. doi: 10.1002/cne.903140116
18. Madeira MD, Sousa N, Lima-Andrade MT, Calheiros F, Cadete-Leite A, Paula-Barbosa MM. Selective vulnerability of the hippocampal pyramidal neurons to hypothyroidism in male and female rats. J Comp Neurol (1992) 322:501–18. doi: 10.1002/cne.903220405
19. Rami A, Rabié A, Patel AJ. Thyroid hormone and development of the rat hippocampus: Cell acquisition in the dentate gyrus. Neuroscience (1986) 19:1207–16. doi: 10.1016/0306-4522(86)90134-X
20. Rami A, Patel AJ, Rabié A. Thyroid hormone and development of the rat hippocampus: Morphological alterations in granule and pyramidal cells. Neuroscience (1986) 19:1217–26. doi: 10.1016/0306-4522(86)90135-1
21. Jan YN, Jan LY. Branching out: Mechanisms of dendritic arborization. Nat Rev Neurosci (2010) 11:316–28. doi: 10.1038/nrn2836
22. Cayrou C, Denver RJ, Puymirat J. Suppression of the basic transcription element-binding protein in brain neuronal cultures inhibits thyroid hormone-induced neurite branching. Endocrinology (2002) 143:2242–9. doi: 10.1210/endo.143.6.8856
23. Kimura-Kuroda J, Nagata I, Negishi-Kato M, Kuroda Y. Thyroid hormone-dependent development of mouse cerebellar Purkinje cells in vitro. Dev Brain Res (2002) 137:55–65. doi: 10.1016/S0165-3806(02)00408-X
24. Amano I, Takatsuru Y, Toya S, Haijima A, Iwasaki T, Grasberger H, et al. Aberrant Cerebellar Development in Mice Lacking Dual Oxidase Maturation Factors. Thyroid (2016) 26:741–52. doi: 10.1089/thy.2015.0034
25. Koibuchi N, Chin WW. Thyroid hormone action and brain development. Trends Endocrinol Metab (2000) 11:123–8. doi: 10.1016/S1043-2760(00)00238-1
26. Banker GA, Cowan WM. Rat hippocampal neurons in dispersed cell culture. Brain Res (1977) 126:397–425. doi: 10.1016/0006-8993(77)90594-7
27. Thompson CC, Potter GB. Thyroid Hormone Action in Neural Development. Cereb Cortex (2000) 10:939–45. doi: 10.1093/cercor/10.10.939
28. Koibuchi N. The role of thyroid hormone on cerebellar development. Cerebellum (2008) 7:530–3. doi: 10.1007/s12311-008-0069-1
29. Harada A, Teng J, Takei Y, Oguchi K, Hirokawa N. MAP2 is required for dendrite elongation, PKA anchoring in dendrites, and proper PKA signal transduction. J Cell Biol (2002) 158:541–9. doi: 10.1083/jcb.200110134
30. Chen Y, Stevens B, Chang J, Milbrandt J, Barres BA, Hell JW. NS21: Re-defined and modified supplement B27 for neuronal cultures. J Neurosci Methods (2008) 171:239–47. doi: 10.1016/j.jneumeth.2008.03.013
31. Ohkawa T, Satake S, Yokoi N, Miyazaki Y, Ohshita T, Sobue G, et al. Identification and characterization of GABAA receptor autoantibodies in autoimmune encephalitis. J Neurosci (2014) 34:8151–63. doi: 10.1523/JNEUROSCI.4415-13.2014
32. Zagrebelsky M, Gödecke N, Remus A, Korte M. Cell type-specific effects of BDNF in modulating dendritic architecture of hippocampal neurons. Brain Struct Funct (2018) 223:3689–709. doi: 10.1007/s00429-018-1715-0
33. Cazzin C, Mion S, Caldara F, Rimland JM, Domenici E. Microarray analysis of cultured rat hippocampal neurons treated with brain derived neurotrophic factor. Mol Biol Rep (2011) 38:983–90. doi: 10.1007/s11033-010-0193-0
34. Patel MN, McNamara JO. Selective enhancement of axonal branching of cultured dentate gyrus neurons by neurotrophic factors. Neuroscience (1995) 69:763–70. doi: 10.1016/0306-4522(95)00281-M
35. Balkowiec A, Katz DM. Cellular mechanisms regulating activity-dependent release of native brain-derived neurotrophic factor from hippocampal neurons. J Neurosci (2002) 22:10399–407. doi: 10.1523/jneurosci.22-23-10399.2002
36. Ariyani W, Iwasaki T, Miyazaki W, Khongorzul E, Nakajima T, Kameo S, et al. Effects of gadolinium-based contrast agents on thyroid hormone receptor action and thyroid hormone-induced cerebellar purkinje cell morphogenesis. Front Endocrinol (Lausanne) (2016) 7:115:115. doi: 10.3389/fendo.2016.00115
37. Jacobs S, Cheng C, Doering LC. Hippocampal neuronal subtypes develop abnormal dendritic arbors in the presence of Fragile X astrocytes. Neuroscience (2016) 324:202–17. doi: 10.1016/j.neuroscience.2016.03.011
38. Schindelin J, Arganda-Carreras I, Frise E, Kaynig V, Longair M, Pietzsch T, et al. Fiji: An open-source platform for biological-image analysis. Nat Methods (2012) 9:676–82. doi: 10.1038/nmeth.2019
39. Sholl DA. Dendritic organization in the neurons of the visual and motor cortices of the cat. J Anat (1953) 87:387–406. doi: 10.1038/171387a0
40. Paper O. Erratum: Iron deficiency impairs developing hippocampal neuron gene expression, energy metabolism, and dendrite complexity (Developmental Neuroscience (2016) 38 (264-276) DOI: 10.1159/000448514). Dev Neurosci (2018) 40:288. doi: 10.1159/000492448
41. Yajima H, Haijima A, Khairinisa MA, Shimokawa N, Amano I, Takatsuru Y. Early-life stress induces cognitive disorder in middle-aged mice. Neurobiol Aging (2018) 64:139–46. doi: 10.1016/j.neurobiolaging.2017.12.021
42. Xie C, Markesbery WR, Lovell MA. Survival of hippocampal and cortical neurons in a mixture of MEM+ and B27-supplemented neurobasal medium. Free Radic Biol Med (2000) 28:665–72. doi: 10.1016/S0891-5849(99)00268-3
43. Impey S, Davare M, Lasiek A, Fortin D, Ando H, Varlamova O, et al. An activity-induced microRNA controls dendritic spine formation by regulating Rac1-PAK signaling. Mol Cell Neurosci (2010) 43:146–56. doi: 10.1016/j.mcn.2009.10.005
44. Molnár E. Long-term potentiation in cultured hippocampal neurons. Semin Cell Dev Biol (2011) 22:506–13. doi: 10.1016/j.semcdb.2011.07.017
45. Begni V, Riva MA, Cattaneo A. Cellular and molecular mechanisms of the brain-derived neurotrophic factor in physiological and pathological conditions. Clin Sci (2017) 131:123–38. doi: 10.1042/CS20160009
46. Gupta VK, You Y, Gupta VB, Klistorner A, Graham SL. TrkB receptor signalling: Implications in neurodegenerative, psychiatric and proliferative disorders. Int J Mol Sci (2013) 14:10122–42. doi: 10.3390/ijms140510122
47. Gil-Ibañez P, García-García F, Dopazo J, Bernal J, Morte B. Global transcriptome analysis of primary cerebrocortical cells: Identification of genes regulated by triiodothyronine in specific cell types. Cereb Cortex (2017) 27:706–17. doi: 10.1093/cercor/bhv273
48. Royland JE, Parker JS, Gilbert ME. A genomic analysis of subclinical hypothyroidism in hippocampus and neocortex of the developing rat brain. J Neuroendocrinol (2008) 20:1319–38. doi: 10.1111/j.1365-2826.2008.01793.x
49. Takahashi M, Negishi T, Tashiro T. Identification of genes mediating thyroid hormone action in the developing mouse cerebellum. J Neurochem (2008) 104:640–52. doi: 10.1111/j.1471-4159.2007.05049.x
50. Gilbert ME, Sanchez-Huerta K, Wood C. Mild thyroid hormone insufficiency during development compromises activity-dependent neuroplasticity in the hippocampus of adult male rats. Endocrinology (2016) 157:774–87. doi: 10.1210/en.2015-1643
51. Sui L, Li BM. Effects of perinatal hypothyroidism on regulation of reelin and brain-derived neurotrophic factor gene expression in rat hippocampus: Role of DNA methylation and histone acetylation. Steroids (2010) 75:988–97. doi: 10.1016/j.steroids.2010.06.005
52. Vella KR, Hollenberg AN. The actions of thyroid hormone signaling in the nucleus. Mol Cell Endocrinol (2017) 458:127–35. doi: 10.1016/j.mce.2017.03.001
53. Binder DK, Scharfman HE. Brain-derived neurotrophic factor. Growth Factors (2004) 22:123–31. doi: 10.1080/08977190410001723308
54. McAllister AK, Lo DC, Katz LC. Neurotrophins regulate dendritic growth in developing visual cortex. Neuron (1995) 15:791–803. doi: 10.1016/0896-6273(95)90171-X
55. Rauskolb S, Zagrebelsky M, Dreznjak A, Deogracias R, Matsumoto T, Wiese S, et al. Global deprivation of brain-derived neurotrophic factor in the CNS reveals an area-specific requirement for dendritic growth. J Neurosci (2010) 30:1739–49. doi: 10.1523/JNEUROSCI.5100-09.2010
56. Aid T, Kazantseva A, Piirsoo M, Palm K, Timmusk T. Mouse and rat BDNF gene structure and expression revisited. J Neurosci Res (2007) 85:525–35. doi: 10.1002/jnr.21139
57. Labelle C, Leclerc N. Exogenous BDNF, NT-3 and NT-4 differentially regulate neurite outgrowth in cultured hippocampal neurons. Dev Brain Res (2000) 123:1–11. doi: 10.1016/S0165-3806(00)00069-9
58. Yan Q, Radeke MJ, Matheson CR, Talvenheimo J, Welcher AA, Feinstein SC. Immunocytochemical localization of TrkB in the central nervous system of the adult rat. J Comp Neurol (1997) 378:135–57. doi: 10.1002/(SICI)1096-9861(19970203)378:1<135::AID-CNE8>3.0.CO;2-5
59. Ledda F, Paratcha G. Mechanisms regulating dendritic arbor patterning. Cell Mol Life Sci (2017) 74:4511–37. doi: 10.1007/s00018-017-2588-8
60. Sawano E, Takahashi M, Negishi T, Tashiro T. Thyroid hormone-dependent development of the GABAergic pre- and post-synaptic components in the rat hippocampus. Int J Dev Neurosci (2013) 31:751–61. doi: 10.1016/j.ijdevneu.2013.09.007
61. Zucker RS, Regehr WG. Short-term synaptic plasticity. Annu Rev Physiol (2002) 64:355–405. doi: 10.1146/annurev.physiol.64.092501.114547
62. Hajós F, Patel AJ, Balázs R. Effect of thyroid deficiency on the synaptic organization of the rat cerebellar cortex. Brain Res (1973) 50:387–401. doi: 10.1016/0006-8993(73)90740-3
63. Nicholson JL, Altman J. The effects of early hypo- and hyperthyroidism on the development of the rat cerebellar cortex. II. Synaptogenesis in the molecular layer. Brain Res (1972) 44:25–36. doi: 10.1016/0006-8993(72)90363-0
64. Nicholson JL, Altman J. Synaptogenesis in the rat cerebellum: effects of early hypo- and hyperthyroidism. Science (1972) 176:530–2. doi: 10.1126/science.176.4034.530
65. Matteoli M, Verderio C, Krawzeski K, Mundigl O, Coco S, Fumagalli G, et al. Mechanisms of synaptogenesis in hippocampal neurons in primary culture. J Physiol - Paris (1995) 89:51–5. doi: 10.1016/0928-4257(96)80551-1
66. Kuczewski N, Porcher C, Lessmann V, Medina I, Gaiarsa JL. Activity-dependent dendritic release of BDNF and biological consequences. Mol Neurobiol (2009) 39:37–49. doi: 10.1007/s12035-009-8050-7
67. Matsuda N, Lu H, Fukata Y, Noritake J, Gao H, Mukherjee S, et al. Differential activity-dependent secretion of brain-derived neurotrophic factor from axon and dendrite. J Neurosci (2009) 29:14185–98. doi: 10.1523/JNEUROSCI.1863-09.2009
Keywords: hypothyroidism, brain-derived neurotrophic factor, Sholl analysis, dendrite growth, primary culture, hippocampus
Citation: Yajima H, Amano I, Ishii S, Sadakata T, Miyazaki W, Takatsuru Y and Koibuchi N (2021) Absence of Thyroid Hormone Induced Delayed Dendritic Arborization in Mouse Primary Hippocampal Neurons Through Insufficient Expression of Brain-Derived Neurotrophic Factor. Front. Endocrinol. 12:629100. doi: 10.3389/fendo.2021.629100
Received: 13 November 2020; Accepted: 06 January 2021;
Published: 23 February 2021.
Edited by:
Laurent M. Sachs, Muséum National d’Histoire Naturelle, FranceReviewed by:
Pieter Vancamp, Centre National de la Recherche Scientifique (CNRS), FranceMeredith Hartley, University of Kansas, United States
Copyright © 2021 Yajima, Amano, Ishii, Sadakata, Miyazaki, Takatsuru and Koibuchi. This is an open-access article distributed under the terms of the Creative Commons Attribution License (CC BY). The use, distribution or reproduction in other forums is permitted, provided the original author(s) and the copyright owner(s) are credited and that the original publication in this journal is cited, in accordance with accepted academic practice. No use, distribution or reproduction is permitted which does not comply with these terms.
*Correspondence: Izuki Amano, aWFtYW5vLWxqQHVtaW4uYWMuanA=
 Hiroyuki Yajima
 Izuki Amano
 Sumiyasu Ishii
 Tetsushi Sadakata
 Wataru Miyazaki
 Yusuke Takatsuru
 Noriyuki Koibuchi