 Michele Schiavon
 David Herzig
 Matthias Hepprich
 Marc Y. Donath
 Lia Bally
 Chiara Dalla Man
- 1Department of Information Engineering, University of Padova, Padova, Italy
- 2Department of Diabetes, Endocrinology, Nutritional Medicine and Metabolism, Inselspital, Bern University Hospital, University of Bern, Bern, Switzerland
- 3Division of Endocrinology, Diabetes and Metabolism, University Hospital Basel, Basel, Switzerland
Assessment of insulin secretion is key to diagnose postprandial hyperinsulinemic hypoglycemia (PHH), an increasingly recognized complication following bariatric surgery. To this end, the Oral C-peptide Minimal Model (OCMM) can be used. This usually requires fixing C-peptide (CP) kinetics to the ones derived from the Van Cauter population model (VCPM), which has never been validated in PHH individuals. The objective of this work was to test the validity of the OCMM coupled with the VCPM in PHH subjects and propose a method to overcome the observed limitations. Two cohorts of adults with PHH after gastric bypass (GB) underwent either a 75 g oral glucose (9F/3M; age=42±9 y; BMI=28.3±6.9 kg/m2) or a 60 g mixed-meal (7F/3M; age = 43 ± 11 y; BMI=27.5±4.2 kg/m2) tolerance test. The OCMM was identified on CP concentration data with CP kinetics fixed to VCPM (VC approach). In both groups, the VC approach underestimated CP-peak and overestimated CP-tail suggesting CP kinetics predicted by VCPM to be inaccurate in this population. Thus, the OCMM was identified using CP kinetics estimated from the data (DB approach) using a Bayesian Maximum a Posteriori estimator. CP data were well predicted in all the subjects using the DB approach, highlighting a significantly faster CP kinetics in patients with PHH compared to the one predicted by VCPM. Finally, a simulation study was used to validate the proposed approach. The present findings question the applicability of the VCPM in patients with PHH after GB and call for CP bolus experiments to develop a reliable CP kinetic model in this population.
Introduction
Postprandial hyperinsulinemic hypoglycemia is an increasingly recognized metabolic complication affecting up to a third of patients following gastric bypass surgery (1, 2). While the underlying mechanisms remain to be fully elucidated (3), excessive postprandial insulin exposure due to exaggerated insulin secretion and/or diminished insulin clearance are key pathophysiological hallmarks of postprandial hyperinsulinemic hypoglycemia (4–6). Thus, reliable estimation of insulin secretion is fundamental to improve our understanding and diagnostic armamentarium of this complex condition.
Insulin secretion is not directly measurable in vivo but can be reconstructed from plasma C-peptide concentrations using non-parametric, e.g., deconvolution (7), or parametric approaches, e.g., structural models (8–11). Nevertheless, both approaches require the knowledge of C-peptide kinetics, usually described by a linear two-compartment model (12).
The direct measurement of C-peptide kinetics requires the injection of a C-peptide bolus under somatostatin infusion to block its endogenous secretion (13). However, to reduce patient burden and costs associated with additional experiments, C-peptide kinetic parameters predicted by the Van Cauter population model (14) can be used. The Van Cauter population model was originally validated in normal, obese, and non-insulin-dependent diabetic individuals and its use within approaches to estimate insulin secretion was shown to yield similar average estimates in the target population as when individual estimates from C-peptide bolus data are used (15, 16). However, this might not hold true when the Van Cauter population model is applied to different populations, such as patients having undergone bariatric surgery, procedures that substantially alter glucose kinetics and secretion of gluco-regulatory hormones (17). Since inaccuracy in C-peptide kinetics may negatively affect the estimation of insulin secretion, the applicability of the Van Cauter population model to predict C-peptide kinetics in patients suffering from postprandial hyperinsulinemic hypoglycemia must be investigated.
The aim of this work was to assess the validity of the Van Cauter population model in post-gastric bypass individuals suffering from postprandial hyperinsulinemic hypoglycemia. This was done by coupling it with a model for the estimation of C-peptide secretion. Among the models proposed in the literature, here the so-called Oral C-peptide Minimal Model (OCMM) (11, 18) was used. In a second step, a new methodology was proposed to overcome the observed limitations when using the Van Cauter population model in these subjects. Finally, the validity of this new methodology was tested by means of an in silico experiment.
Database and Methods
Databases
Data from twenty-two post-gastric bypass individuals suffering from postprandial hyperinsulinemic hypoglycemia gathered during two separate clinical trials were used in this work.
Twelve subjects (Cohort 1 - OGTT) (9F; age = 42±9 y; BMI = 28.3±6.9 kg/m2) were studied at the University Hospital Bern, Bern, Switzerland (NCT03609632). Participants arrived at the clinical research facility at 0800 after an overnight fast. An intravenous cannula was inserted in one arm for blood sampling and kept open with a saline infusion. Participants underwent a standard oral glucose tolerance test (OGTT) consisting in the ingestion of 75 g of dextrose and the frequent sampling for plasma glucose, insulin and C-peptide concentrations for 210 min after glucose ingestion. Samples were taken every 15 min until 60 min after glucose ingestion and every 30 min subsequently. Hypoglycemia, defined as plasma glucose level < 2.8 mmol/L, was treated using intravenous dextrose (10%) to reach euglycaemia. Plasma glucose was determined from venous blood using the Biosen C-line analyser (IGZ Instruments AG, Zurich, Switzerland). Insulin and C-peptide concentration were measured by conventional immunoassays (Roche Diagnostics, Mannheim, Germany).
The other 10 subjects (Cohort 2 - MMTT) (7F; age = 43±11 y; BMI = 27.5±4.2 kg/m2) were studied at the University Hospital Basel, Basel, Switzerland (NCT03200782). Subjects participated in a double-blind, double-dummy placebo controlled, randomized, cross-over trial where each subject underwent a standardized liquid mixed-meal tolerance test (MMTT, 300 ml Ensure plus®, Abbott, 60 g carbohydrates, 450 kcal) on three occasions receiving either a placebo, a SGLT2-inhibitor or a IL-1 receptor agonist. For the purpose of this work, only data from the placebo visit were used. More details on the study protocol can be found in (19). Plasma glucose, insulin and C-peptide concentrations were sampled every 30 min for 180 min after mixed-meal ingestion. In case of symptomatic hypoglycemia, defined by the Whipple’s triad with plasma glucose < 2.5 mmol/L, immediate glucose measurement and blood sampling was performed followed by the administration of 10 g glucose (orally or intravenously).
In Figure 1, mean ± standard error (SE) of plasma glucose (top) and C-peptide (bottom) concentrations of the two studies are reported.
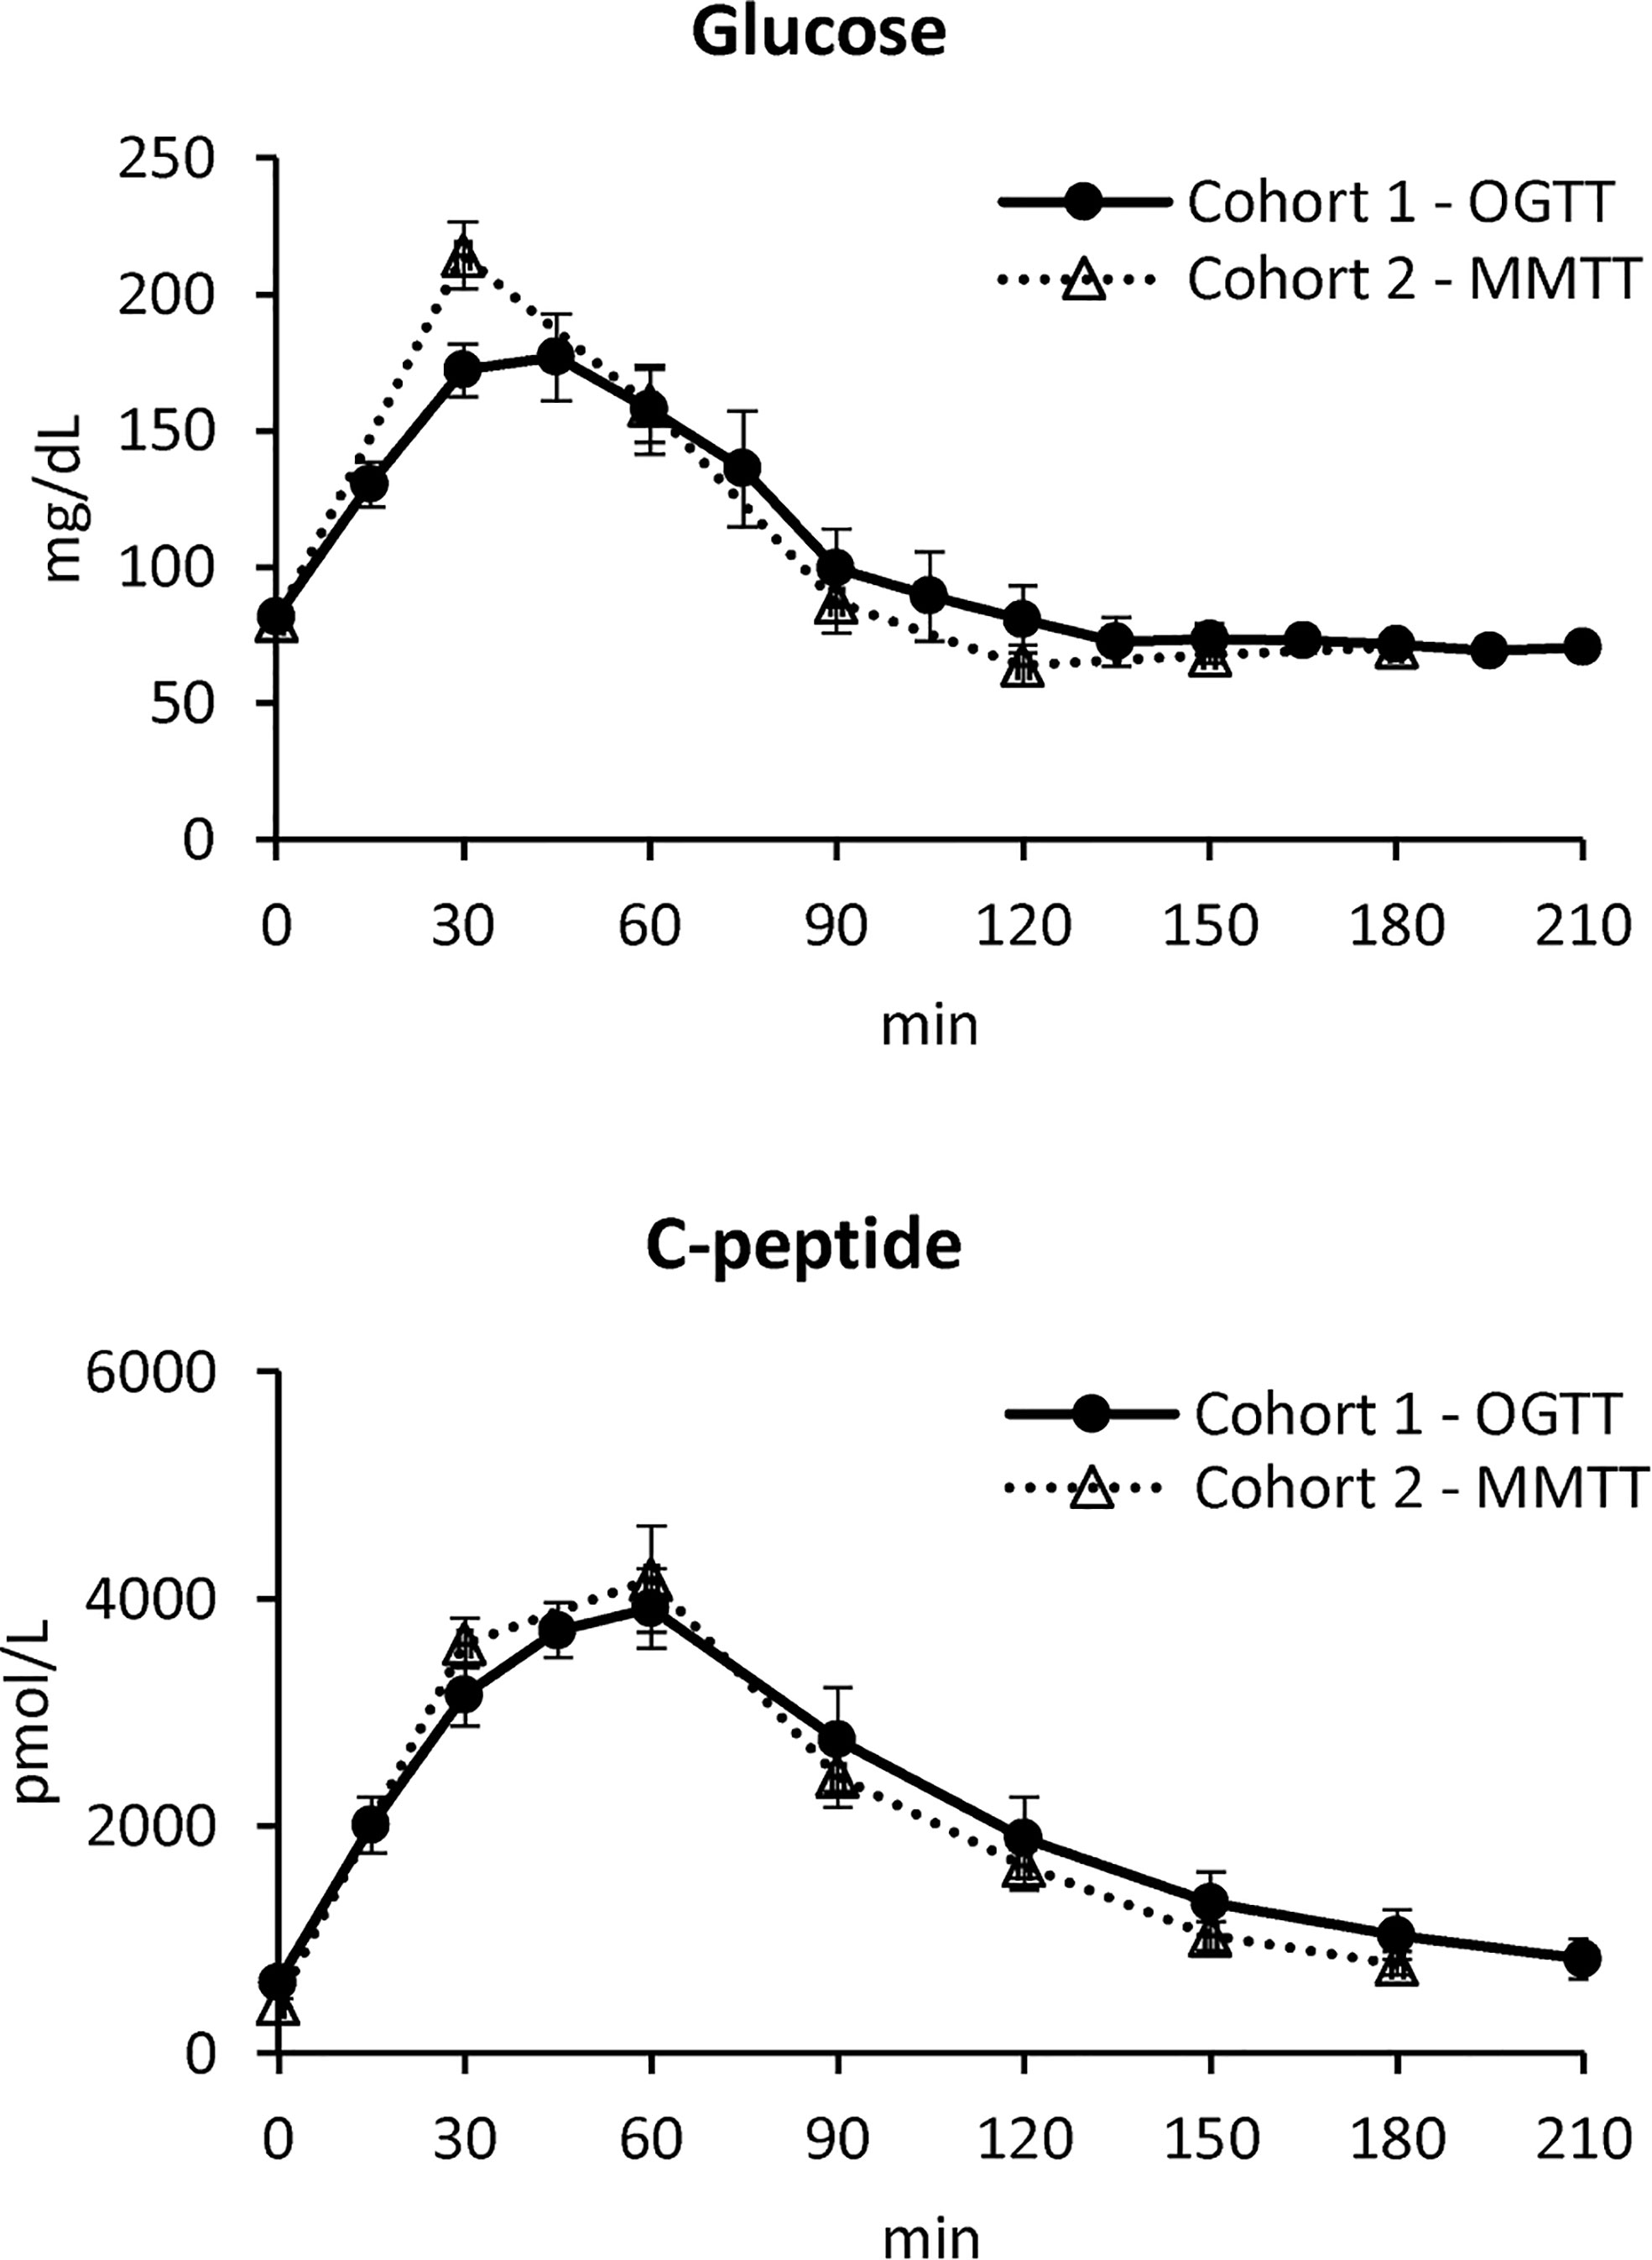
Figure 1 Plasma glucose (top) and C-peptide (bottom) concentrations in Cohort 1 – OGTT (continuous line with black circles) and Cohort 2 – MMTT (dotted line with triangles) (mean ± SE).
Methods
The Oral C-Peptide Minimal Model (OCMM)
The oral C-peptide minimal model (OCMM, Figure 2) (11, 18) interprets plasma C-peptide concentration in relation to the observed changes in glucose concentration and provides a quantification of β-cell responsivity to glucose.
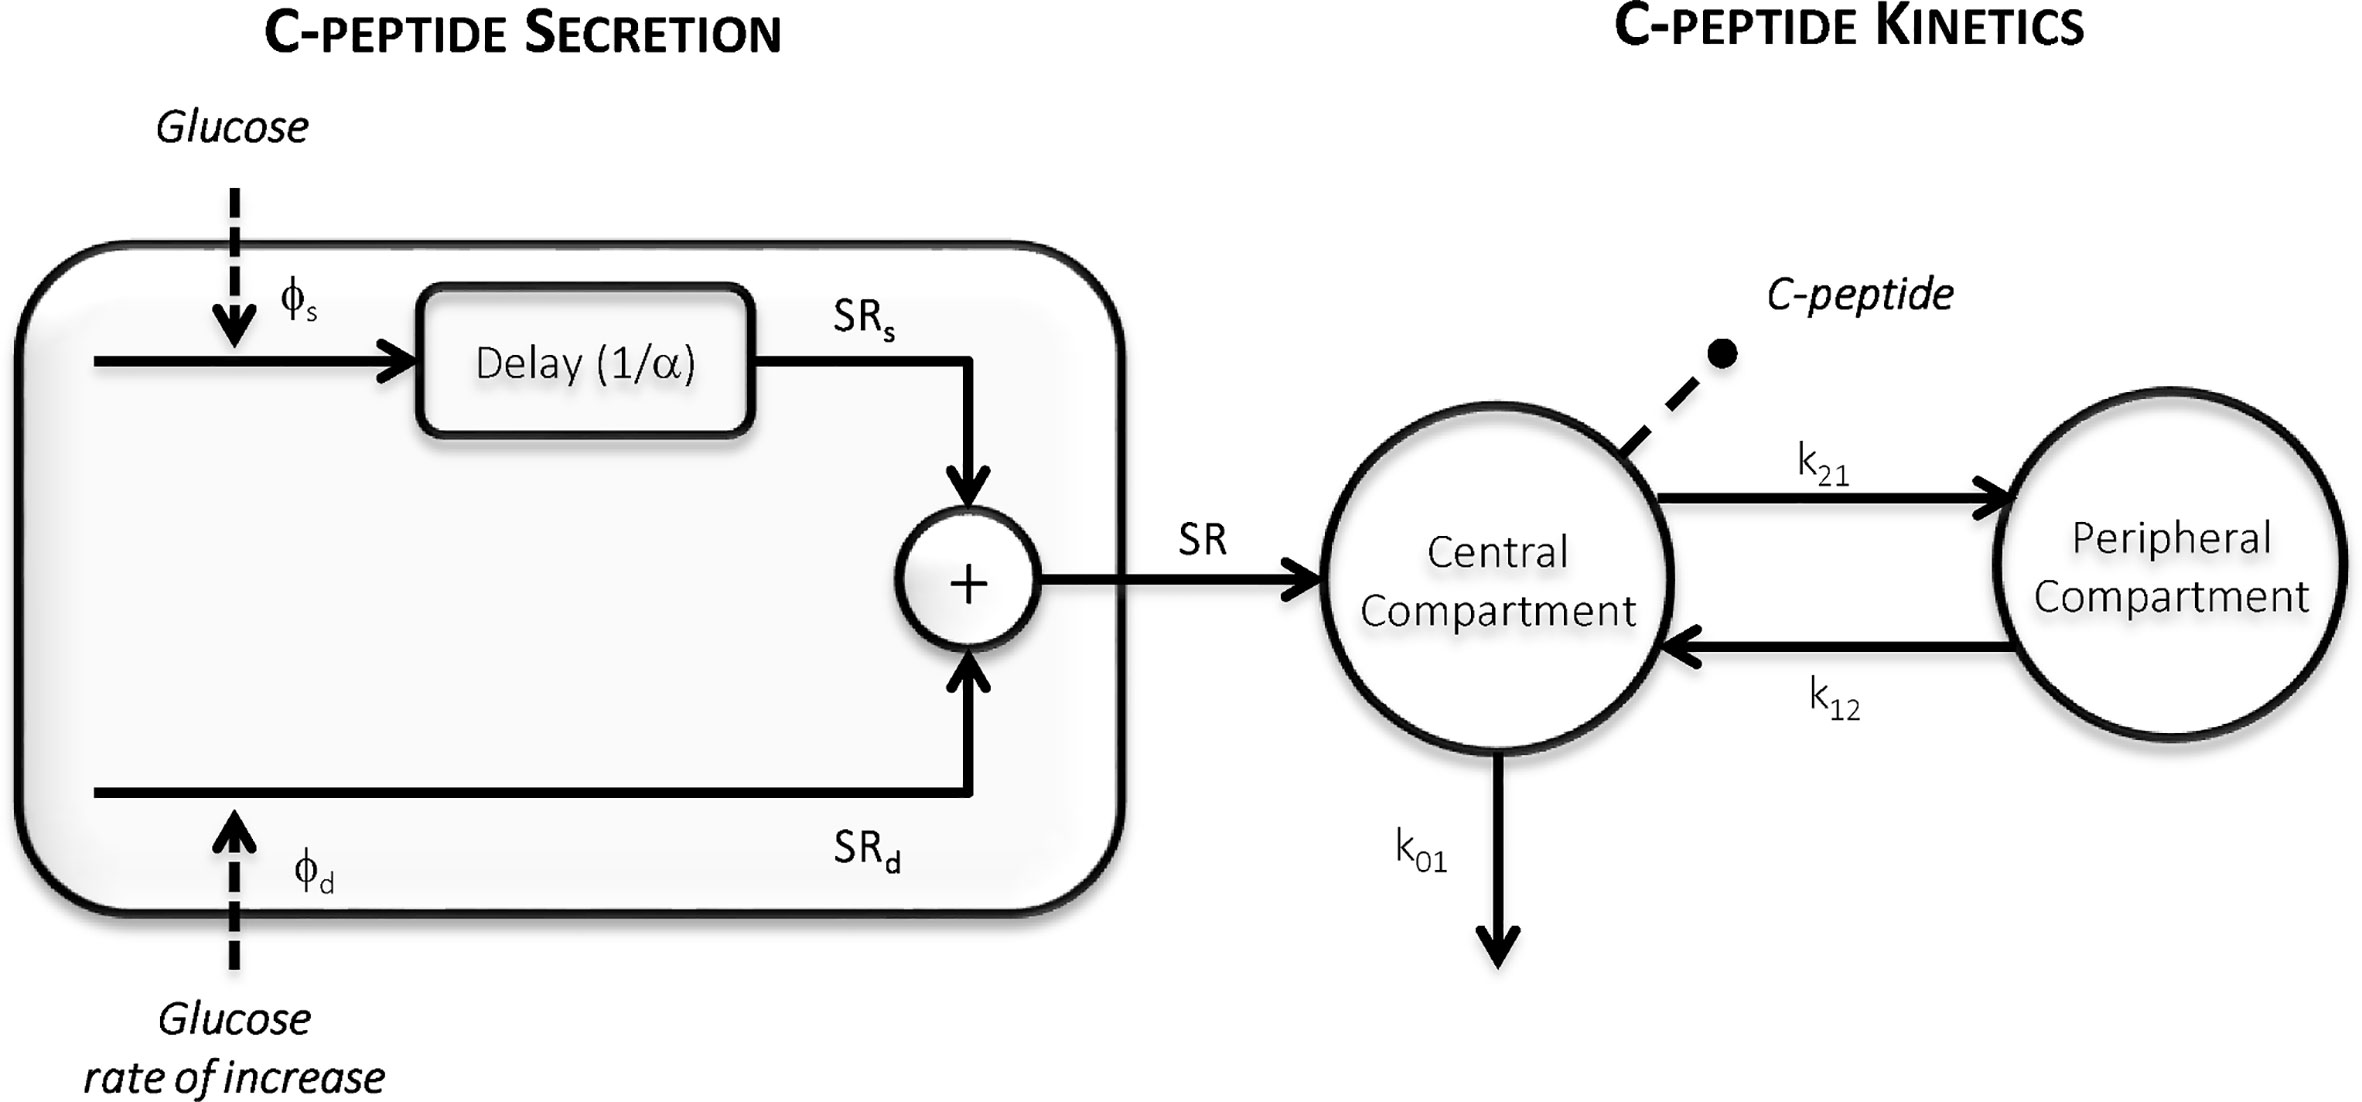
Figure 2 The Oral C-peptide Minimal Model (OCMM) (11, 18) with its secretion (left) and kinetics (right) components. SR is the pancreatic secretion, Φs and Φd static and dynamic β-cell responsivity indices respectively, 1/α time constant of the static component, and k01, k12, and k21 C-peptide kinetic parameters.
C-peptide kinetics are described by the well-known two-compartment model (12) (Figure 2, right panel):
where CP1 and CP2 (pmol/L) are the above-basal C-peptide concentrations in the first (central) and second (peripheral) compartments respectively, kij (min-1) the C-peptide kinetic parameters, with k01 representing the C-peptide fractional metabolic clearance rate (MCR, min-1) and SR (pmol/L/min) the above basal pancreatic secretion normalized by the volume of distribution of the first compartment.
SR is modeled as the sum of two components controlled by glucose concentration (static component, SRs) and its rate of increase (dynamic component, SRd) (Figure 2, left panel):
In particular, SRs represents the provision of new releasable insulin Y(t) (pmol/L/min):
which is controlled by glucose concentration (G, mmol/L) according to:
Thus, SRs is dynamically related to glucose concentration and tends toward a steady-state value with a time constant 1/α (min). The steady-state value is linearly dependent from glucose concentration above a threshold level h (mmol/L), here fixed to pre-meal (basal) glucose level Gb (20), through a parameter β (min-1). SRd represents the secretion of promptly releasable insulin and is proportional, through a parameter kd (dimensionless), to the rate of glucose increase:
Basal insulin secretion (SRb) can be calculated as:
where CP1b is the basal C-peptide concentration in the first compartment.
From model parameters, indices of static (Φs = β, 10-9 min-1), dynamic (Φd = kd, 10-9) and basal β-cell responsiveness (Φb = SRb/Gb, 10-9 min-1) can be derived. Finally, an index of total β-cell responsiveness to glucose (Φtot, 10-9 min-1) (11) can be calculated as:
where T (min) is the time at which the system is assumed to return to steady-state conditions after the perturbation (here assumed T=300 min).
Model Identification
The OCMM is a priori uniquely identifiable if the measured C-peptide data are assumed as model output and the measured glucose concentrations as known input (21, 22). Parameters were estimated with a Bayesian Maximum a Posteriori (MAP) estimator (23), which requires the maximization of the a posteriori probability density function of the parameter vector p = [kd, α, β, k01, k12, k21]:
which, by recalling the Bayes theorem, can be rewritten as
where fz|p (z|p) is the likelihood of the data, fz(z) is the probability density function of the data vector z, which can be ignored in the maximization problem since it does not depend on p, and fp(p) is the a priori probability density function of p. The definition of fp(p) differs depending on the adopted identification approach, as detailed below.
C-Peptide Kinetics Fixed to Van Cauter Population Model (VC Approach)
Here, we assumed p=[p1, p2] with p1=[kd, α, β] and p2=[k01, k12, k21]. The a priori probability density function fp1(p1) was assumed to be noninformative for all the parameters except for α to improve the numerical identifiability of the model (11), especially when a limited number of samples is available. The C-peptide kinetic parameters (p2) were fixed to those predicted by the Van Cauter (VC) population model (Table 1) (14). In that study, a method was proposed to estimate the kinetics parameters of the two-compartment model of C-peptide kinetics (12) from patient demographics. The model was originally validated in a large database of normal, obese, and non-insulin-dependent individuals with diabetes. However, it has never been validated in PHH subjects.
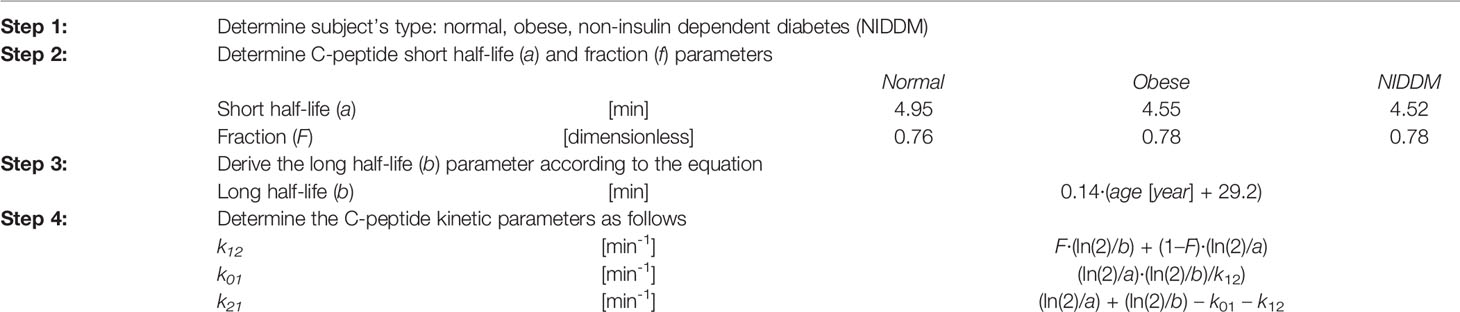
Table 1 Procedure to obtain the c-peptide kinetic parameters using the Van Cauter population model (14).
The VC approach provided unsatisfactory results in terms of model ability to predict the data in this population (see Results section). Therefore, another identification approach was tested (DB approach). Finally, a simulation study was also performed to test the accuracy of this method. An overview of the workflow is shown in Figure 3.
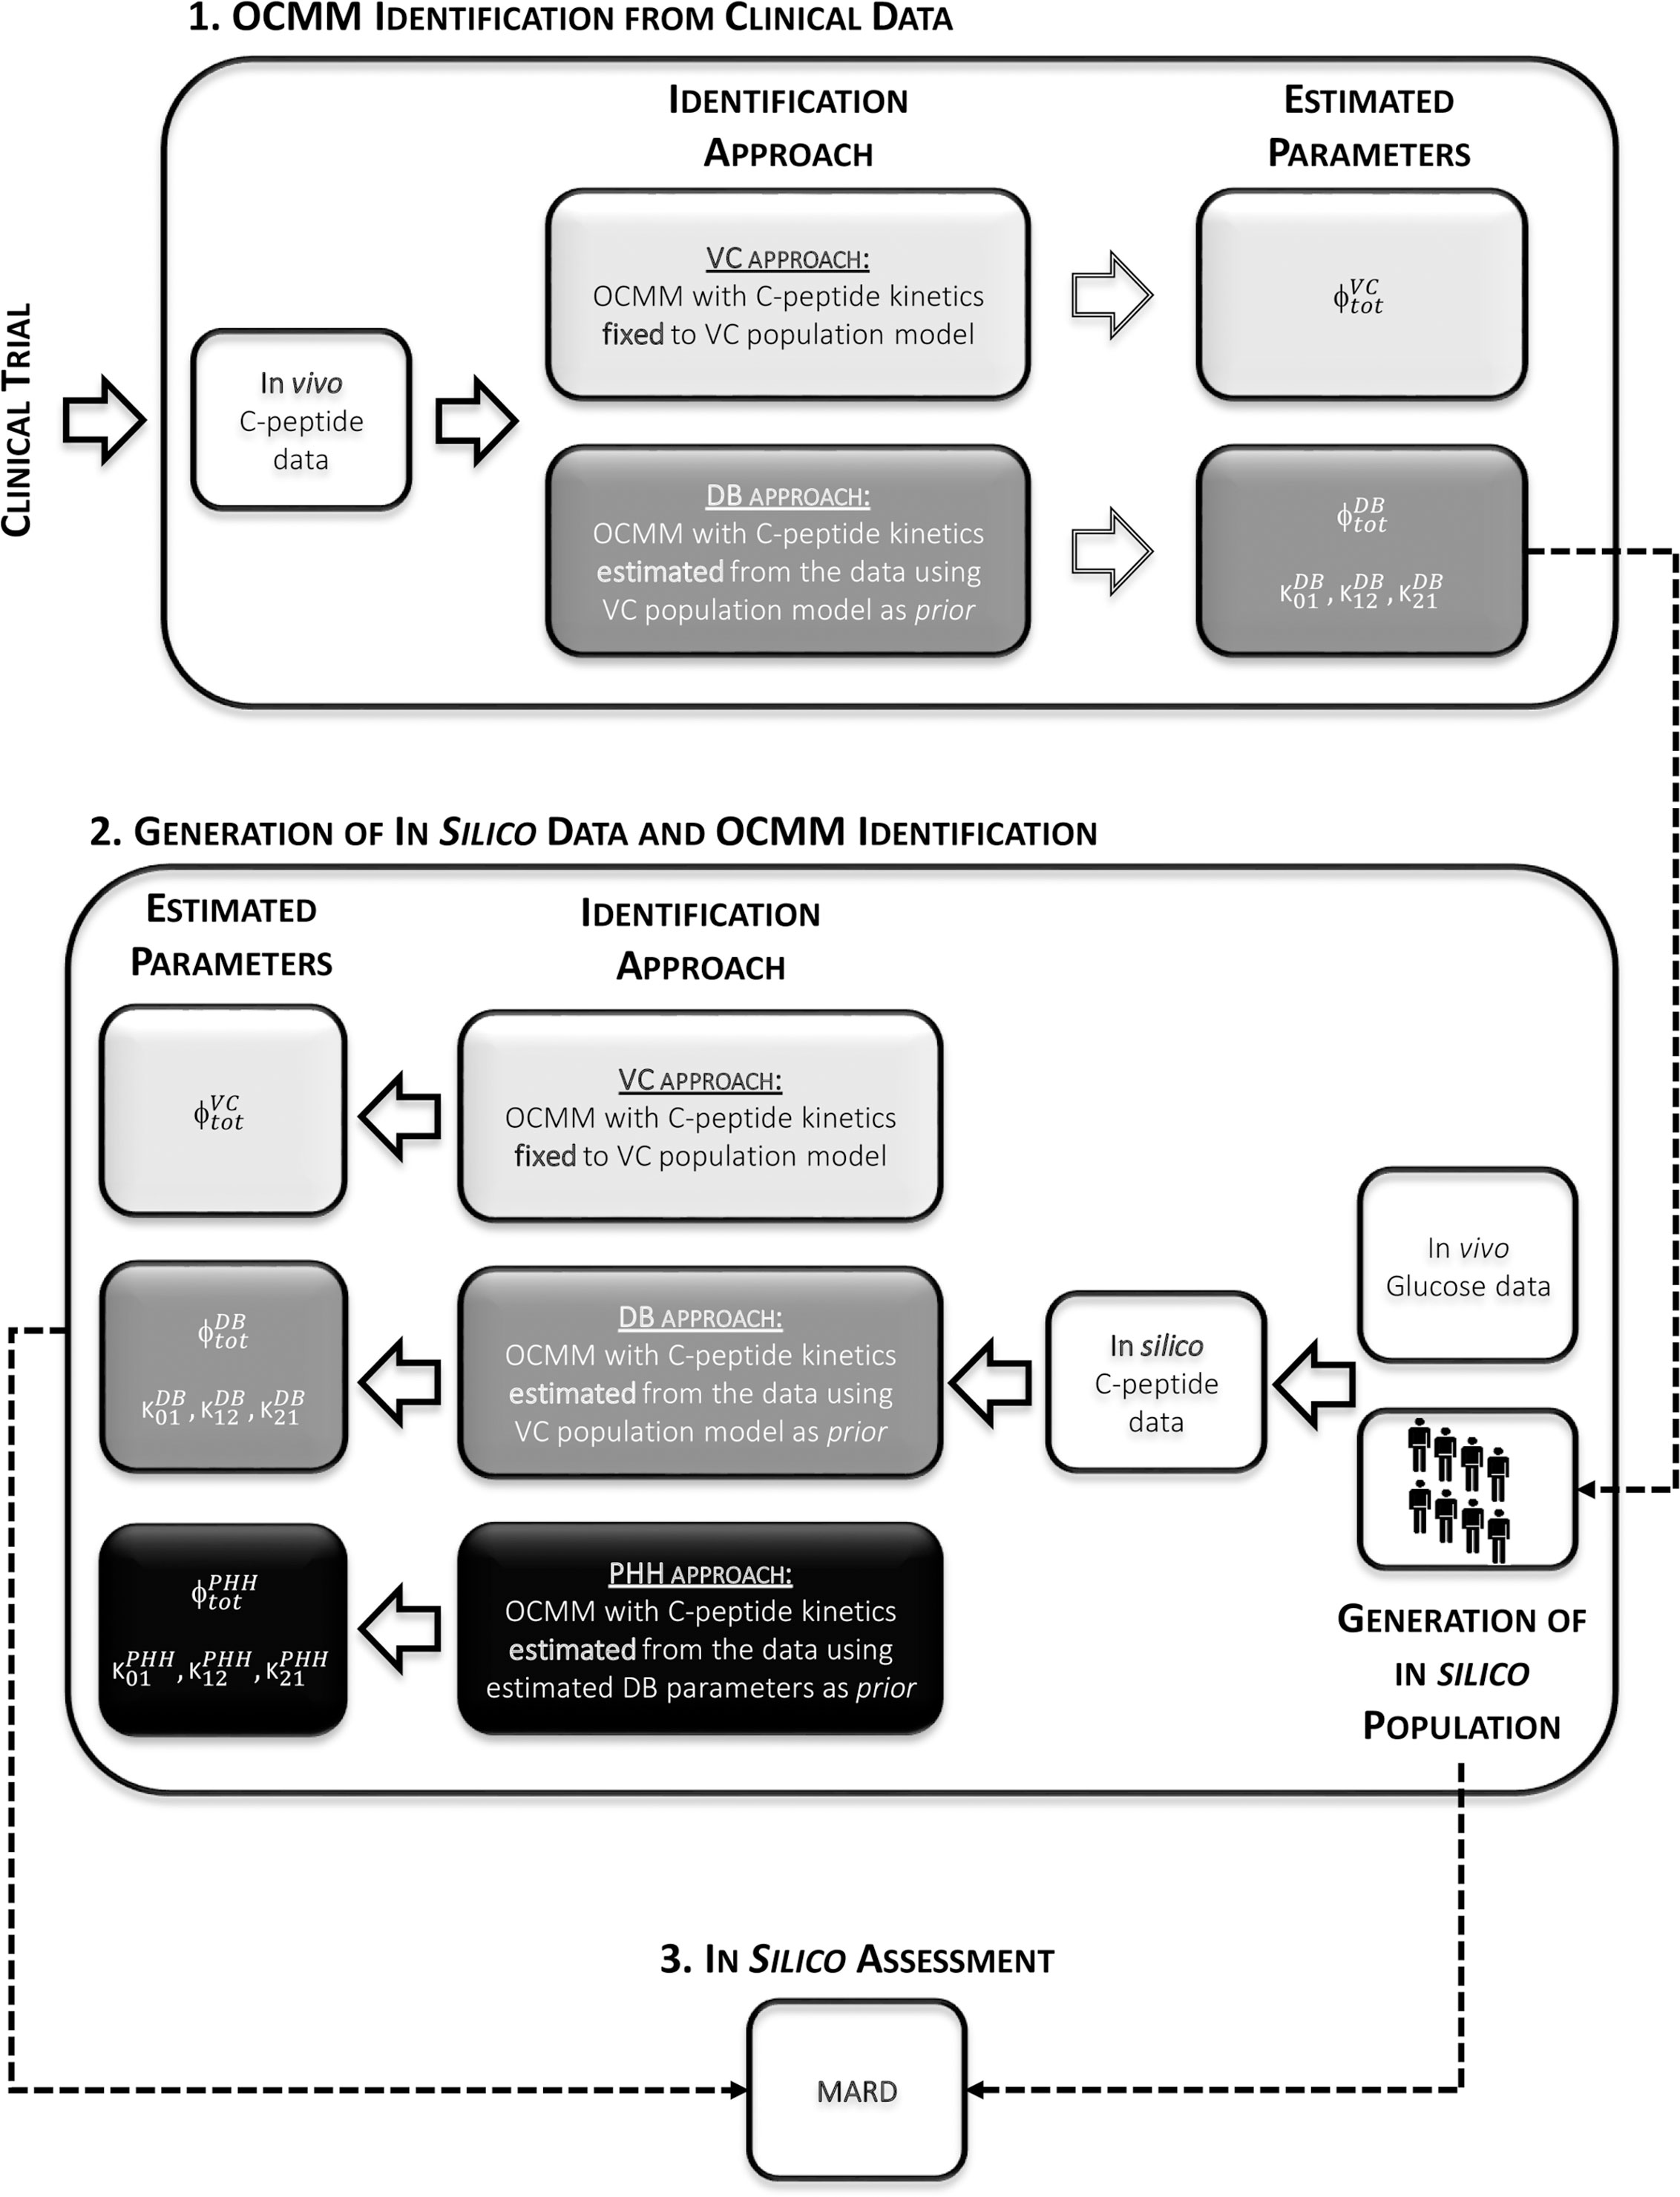
Figure 3 Overview of the study workflow. 1: Identification of the OCMM by both the VC and the proposed DB approach from in vivo data. 2: Use of estimated parameters with the DB approach to randomly generate the in silico population from which C-peptide concentration curves were simulated. Identification of the OCMM using the VC, DB, and PHH approach using in silico data. 3: Calculation of mean absolute relative difference (MARD) for the assessment of the proposed methodology using in silico results.
C-Peptide Kinetics Estimated from the Data (DB Approach)
Here, the C-peptide kinetic parameters (p2) were estimated, together with the secretion parameters (p1) from the C-peptide data (data-based, DB) using the MAP estimator of eqs. 8 and 9. The a priori probability density function fp1 (p1) was the same as the one adopted in the VC approach, while fp2 (p2) was derived from the Van Cauter population model (14).
For both approaches (VC and DB), measurement error of C-peptide concentration was assumed to be independent, Gaussian, with zero mean and variance dependent on C-peptide concentrations (24). Glucose concentration and its time derivative were used as error-free model inputs. Here, the time derivative of glucose concentration was calculated using a stochastic regularized deconvolution method (25), particularly suitable in case of noisy signals. The precision of model parameter estimates was quantified by its coefficient of variation (CV, %) (23). Parameter estimation and statistical analyses were carried out using Matlab® (R2016a); differential equations were integrated using a method based on an explicit Runge-Kutta (4th–5th order) pair formula implemented in the Matlab function ode45 (26).
In Silico Assessment
The ability of the proposed DB approach to accurately estimate the kinetic and secretion parameters of the OCMM was assessed by computer simulation.
To set up the simulation, we first used the C-peptide kinetic parameters estimated with the DB approach to derive the joint C-peptide kinetic parameter distribution in our PHH subjects. Specifically, similarly to what done in (27), the kinetic parameters were assumed to be log-normally distributed with mean (μp2) and covariance matrix (Ʃp2):
From the above distribution, we randomly extracted 1,100 kinetic parameter vectors p2=[k01, k12, k21]. In particular, for each of the 22 subjects in our database, 50 triplets (p2) were randomly generated and coupled to the set of estimated secretion parameters (p1) together with the corresponding glucose curve. This allowed us to create 1,100 in silico (virtual) subjects, with known kinetic and secretion parameters, for which the C-peptide concentration after an oral test was simulated using the subject-specific glucose curve as input signal. Such in silico C-peptide profiles were then sampled and corrupted by an additive Gaussian random noise with zero mean and variance as in (24). Finally, the OCMM was identified using both the VC and DB approach, as described in Section 2.2.2. In addition, we tested to what extent the final parameter estimates were affected by the choice of the a priori information. To do so, the model was also identified using as prior information the C-peptide kinetic parameters estimated with the DB approach (PHH approach).
Statistical Analysis
Normality of variable distributions was assessed by Lilliefors test and, since some of the variable of interest were not normally distributed, nonparametric tests were used. In particular, for the parameters estimated from in vivo (clinical) data, differences between the VC and the DB approaches, within the same cohort, were assessed using a Wilcoxon signed-rank test; while a Mann-Whitney-U test was used to compare cohorts (Cohort 1-OGTT vs. Cohort 2-MMTT). For the results of the in silico experiment, mean absolute relative differences (MARD) between the estimated parameters from the respective approach and the known parameters were calculated in order to assess the validity of the approaches. Differences in MARD among identification approaches (VC vs. DB vs. PHH) were then assessed by Kruskal-Wallis test and post-hoc analysis was performed using Dunn-Sidak correction for multiple comparison (26). Results are reported as median [25th, 75th] percentile unless otherwise specified. A p-value <0.05 was considered statistically significant.
Results
Model Identification
In both cohorts, the VC approach underestimated C-peptide peak and overestimated C-peptide tail, while the DB accurately predicted C-peptide data in all subjects (Figure 4). Individual estimates of the key parameters Φtot and MCR are reported in Figure 5.
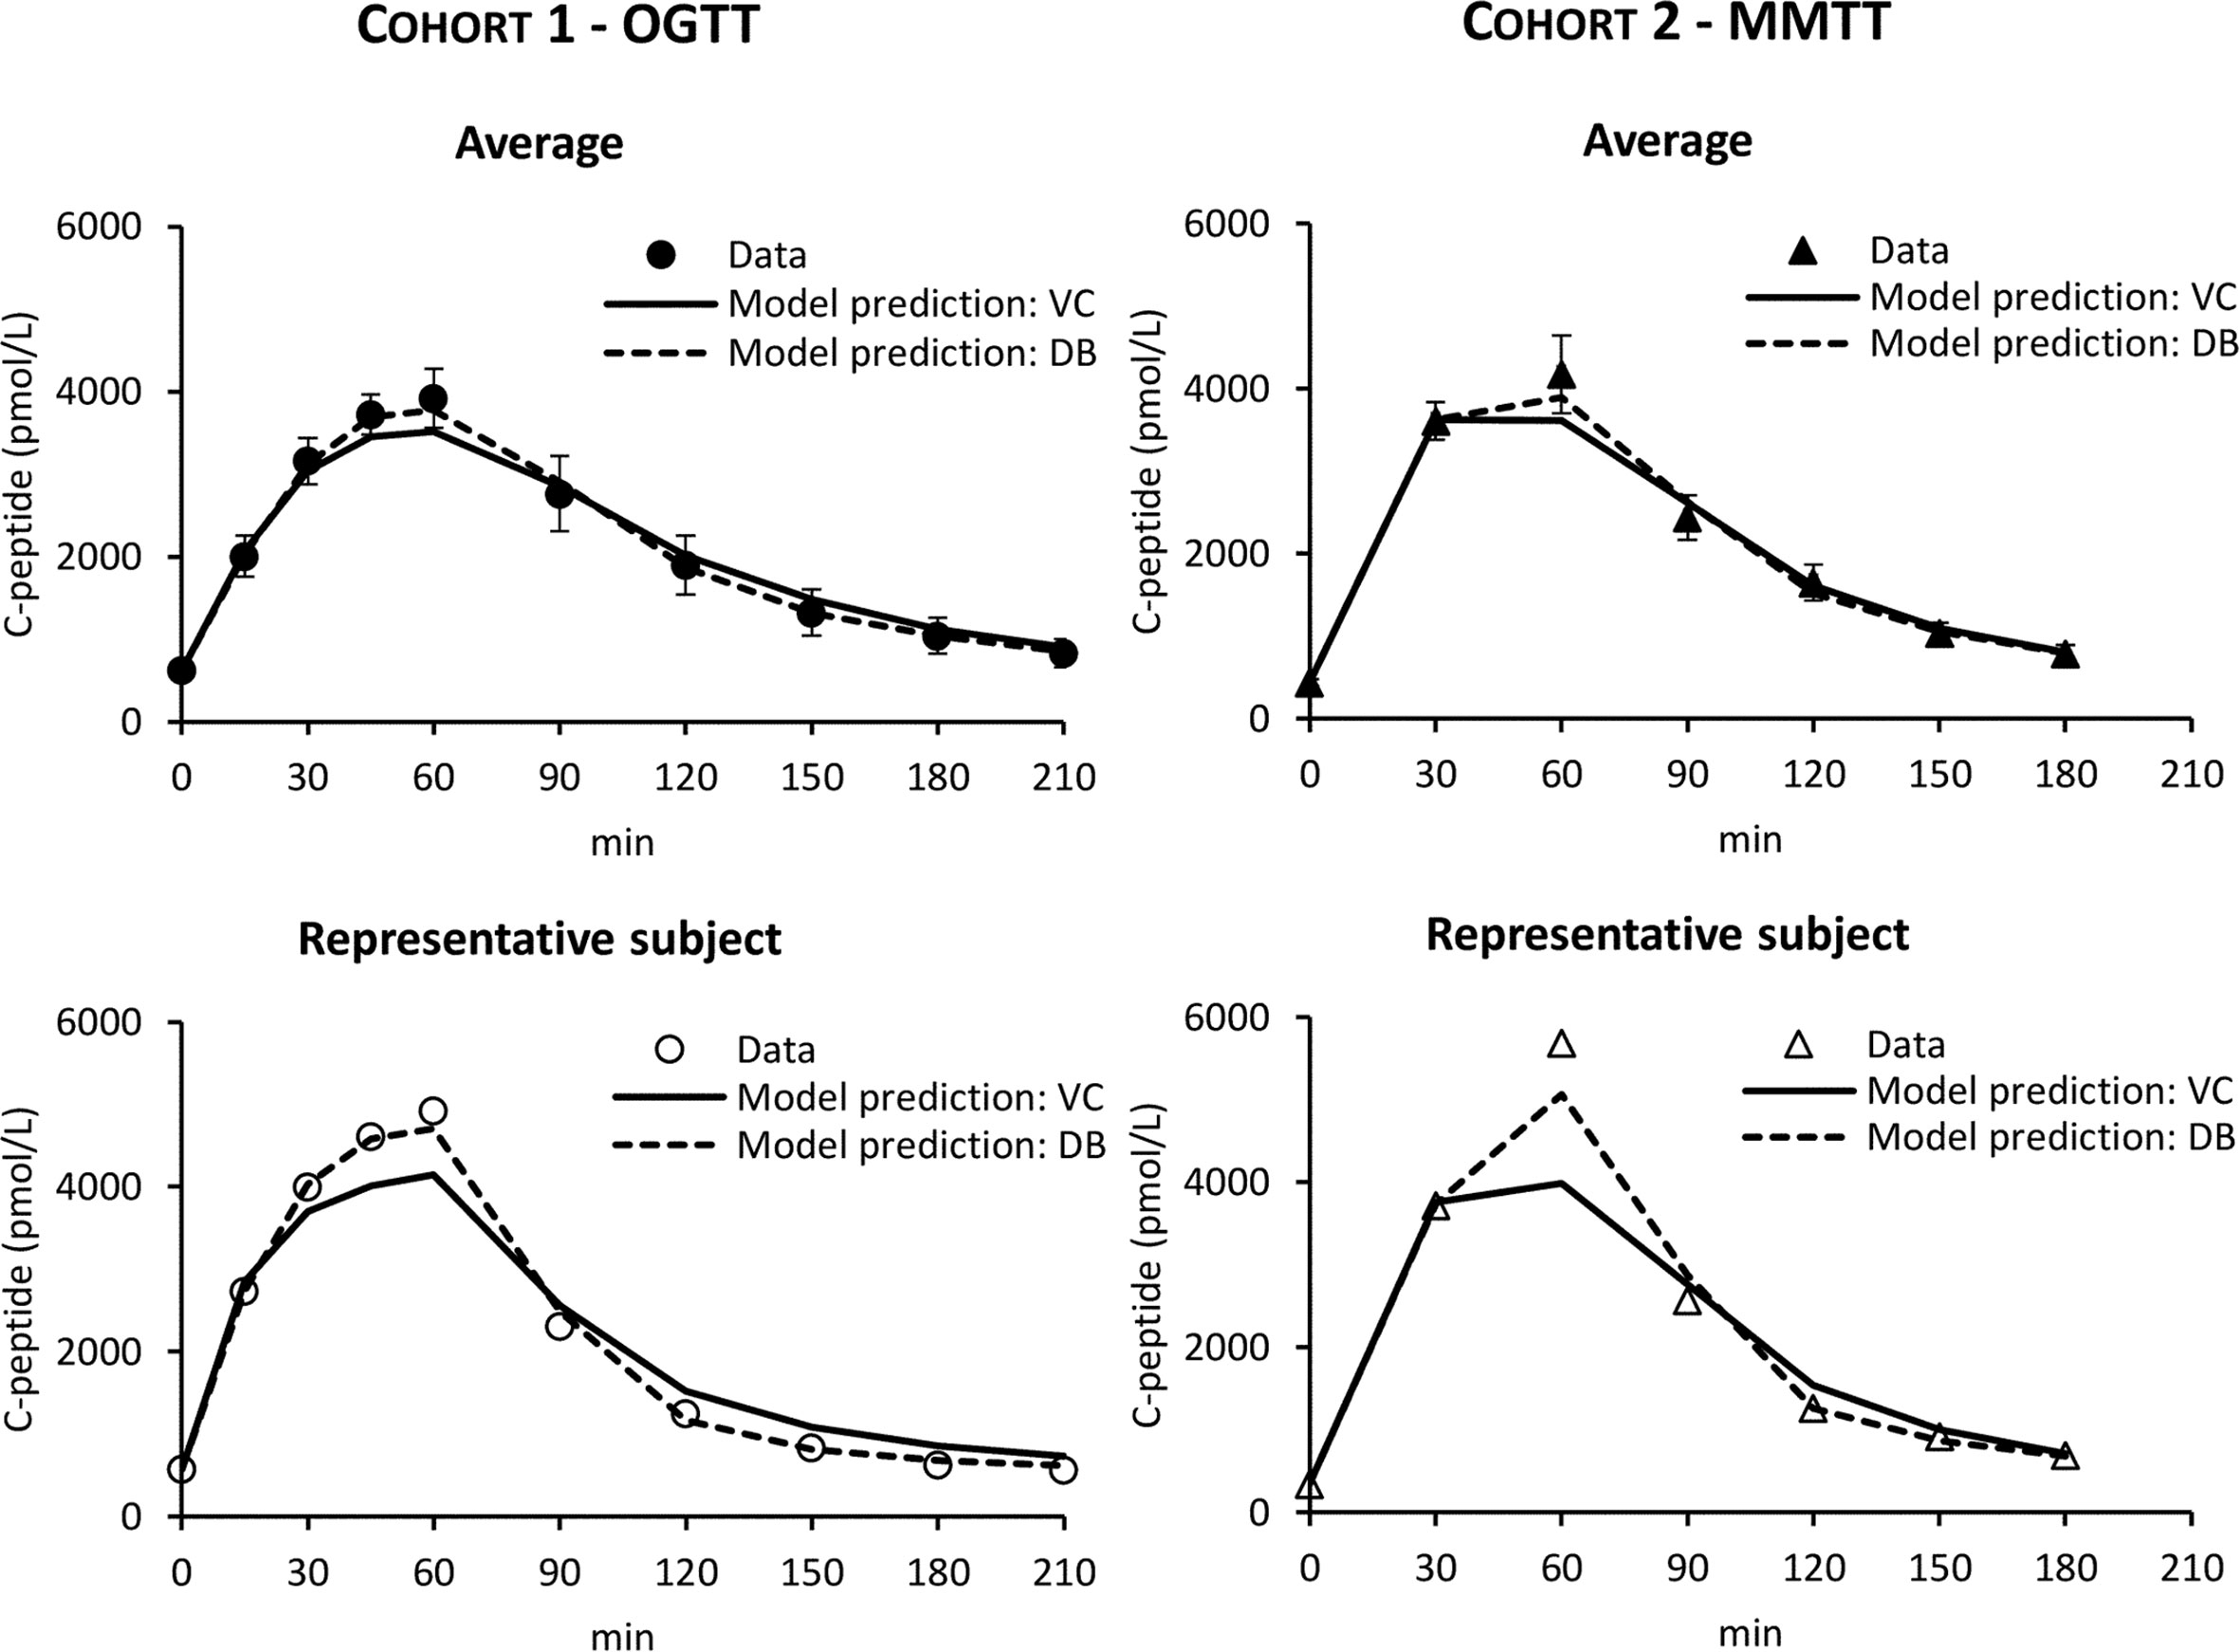
Figure 4 C-peptide data in Cohort 1 – OGTT (left panels, circles) and Cohort 2 – MMTT (right panels, triangles) vs. model predictions obtained with VC (continuous line) and DB (dashed line) approach. Mean ± SE are reported in the top panels while representative subjects in the bottom panels.
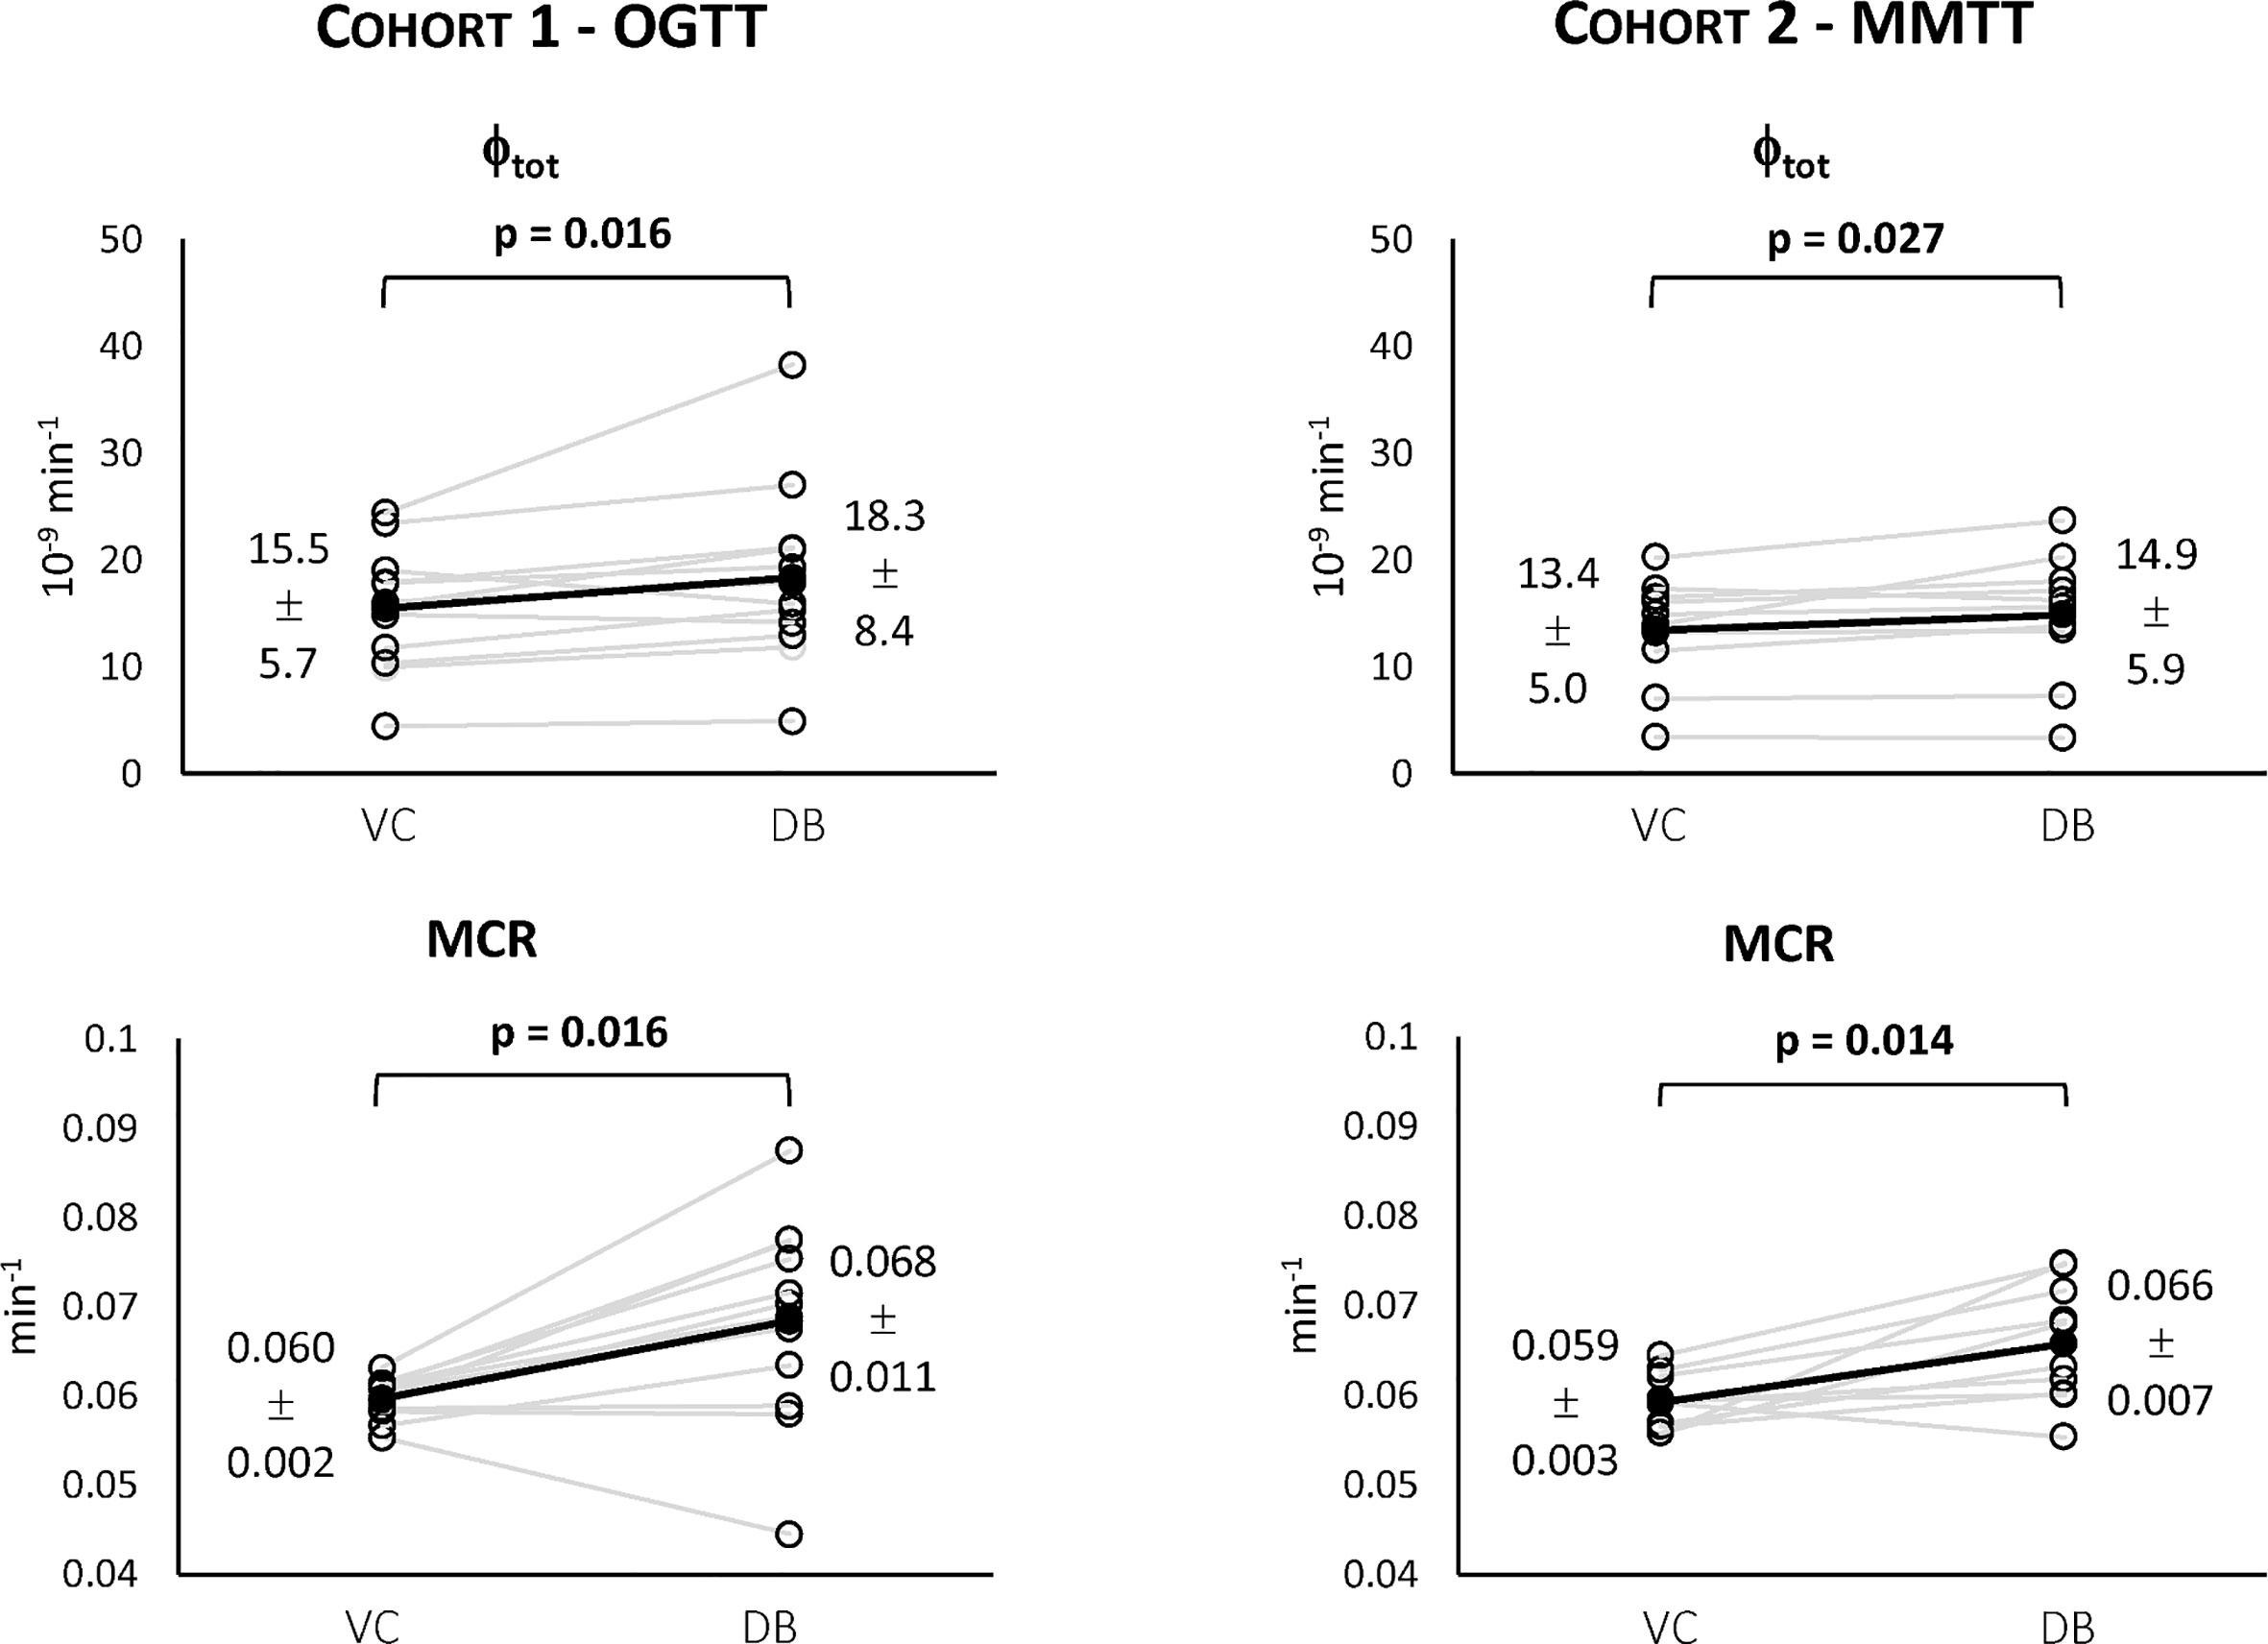
Figure 5 Individual estimates of the index of total β-cell responsivity to glucose (Φtot, top) and C-peptide metabolic clearance rate (MCR, bottom) for both Cohort 1 – OGTT (left) and Cohort 2 – MMTT (right).
For both cohorts, a statistically significant difference between the VC and the DB approach was observed for Φtot (Figure 5, top) and MCR (Figure 5, bottom). No statistically significant differences between cohorts were observed for both variables within the VC and DB approach, respectively. When pooling data from both cohorts, a significantly higher Φtot (16.1 [13.5, 20.0] 10-9 min-1 vs. 15.4 [11.6, 17.7] 10-9 min-1, p<0.01) was observed with the DB than the VC approach, which was accompanied by a significantly higher C-peptide MCR (0.068 [0.061, 0.074] min-1 vs. 0.059 [0.057, 0.061] min-1, p<0.001) in the DB vs. VC approach. All parameters were estimated with precision: CV among parameters was 19 [14, 24] % using the DB approach and 9 [5, 17] % using the VC approach.
In Silico Assessment
The distributions of the simulated vs. real C-peptide concentrations were very similar for both cohorts (Figure 6). Model parameters were estimated with precision in almost all the subjects with CV of 8 [5, 16] %, 19 [15, 24] %, and 17 [13, 25] % for the VC, DB, and PHH approach, respectively.
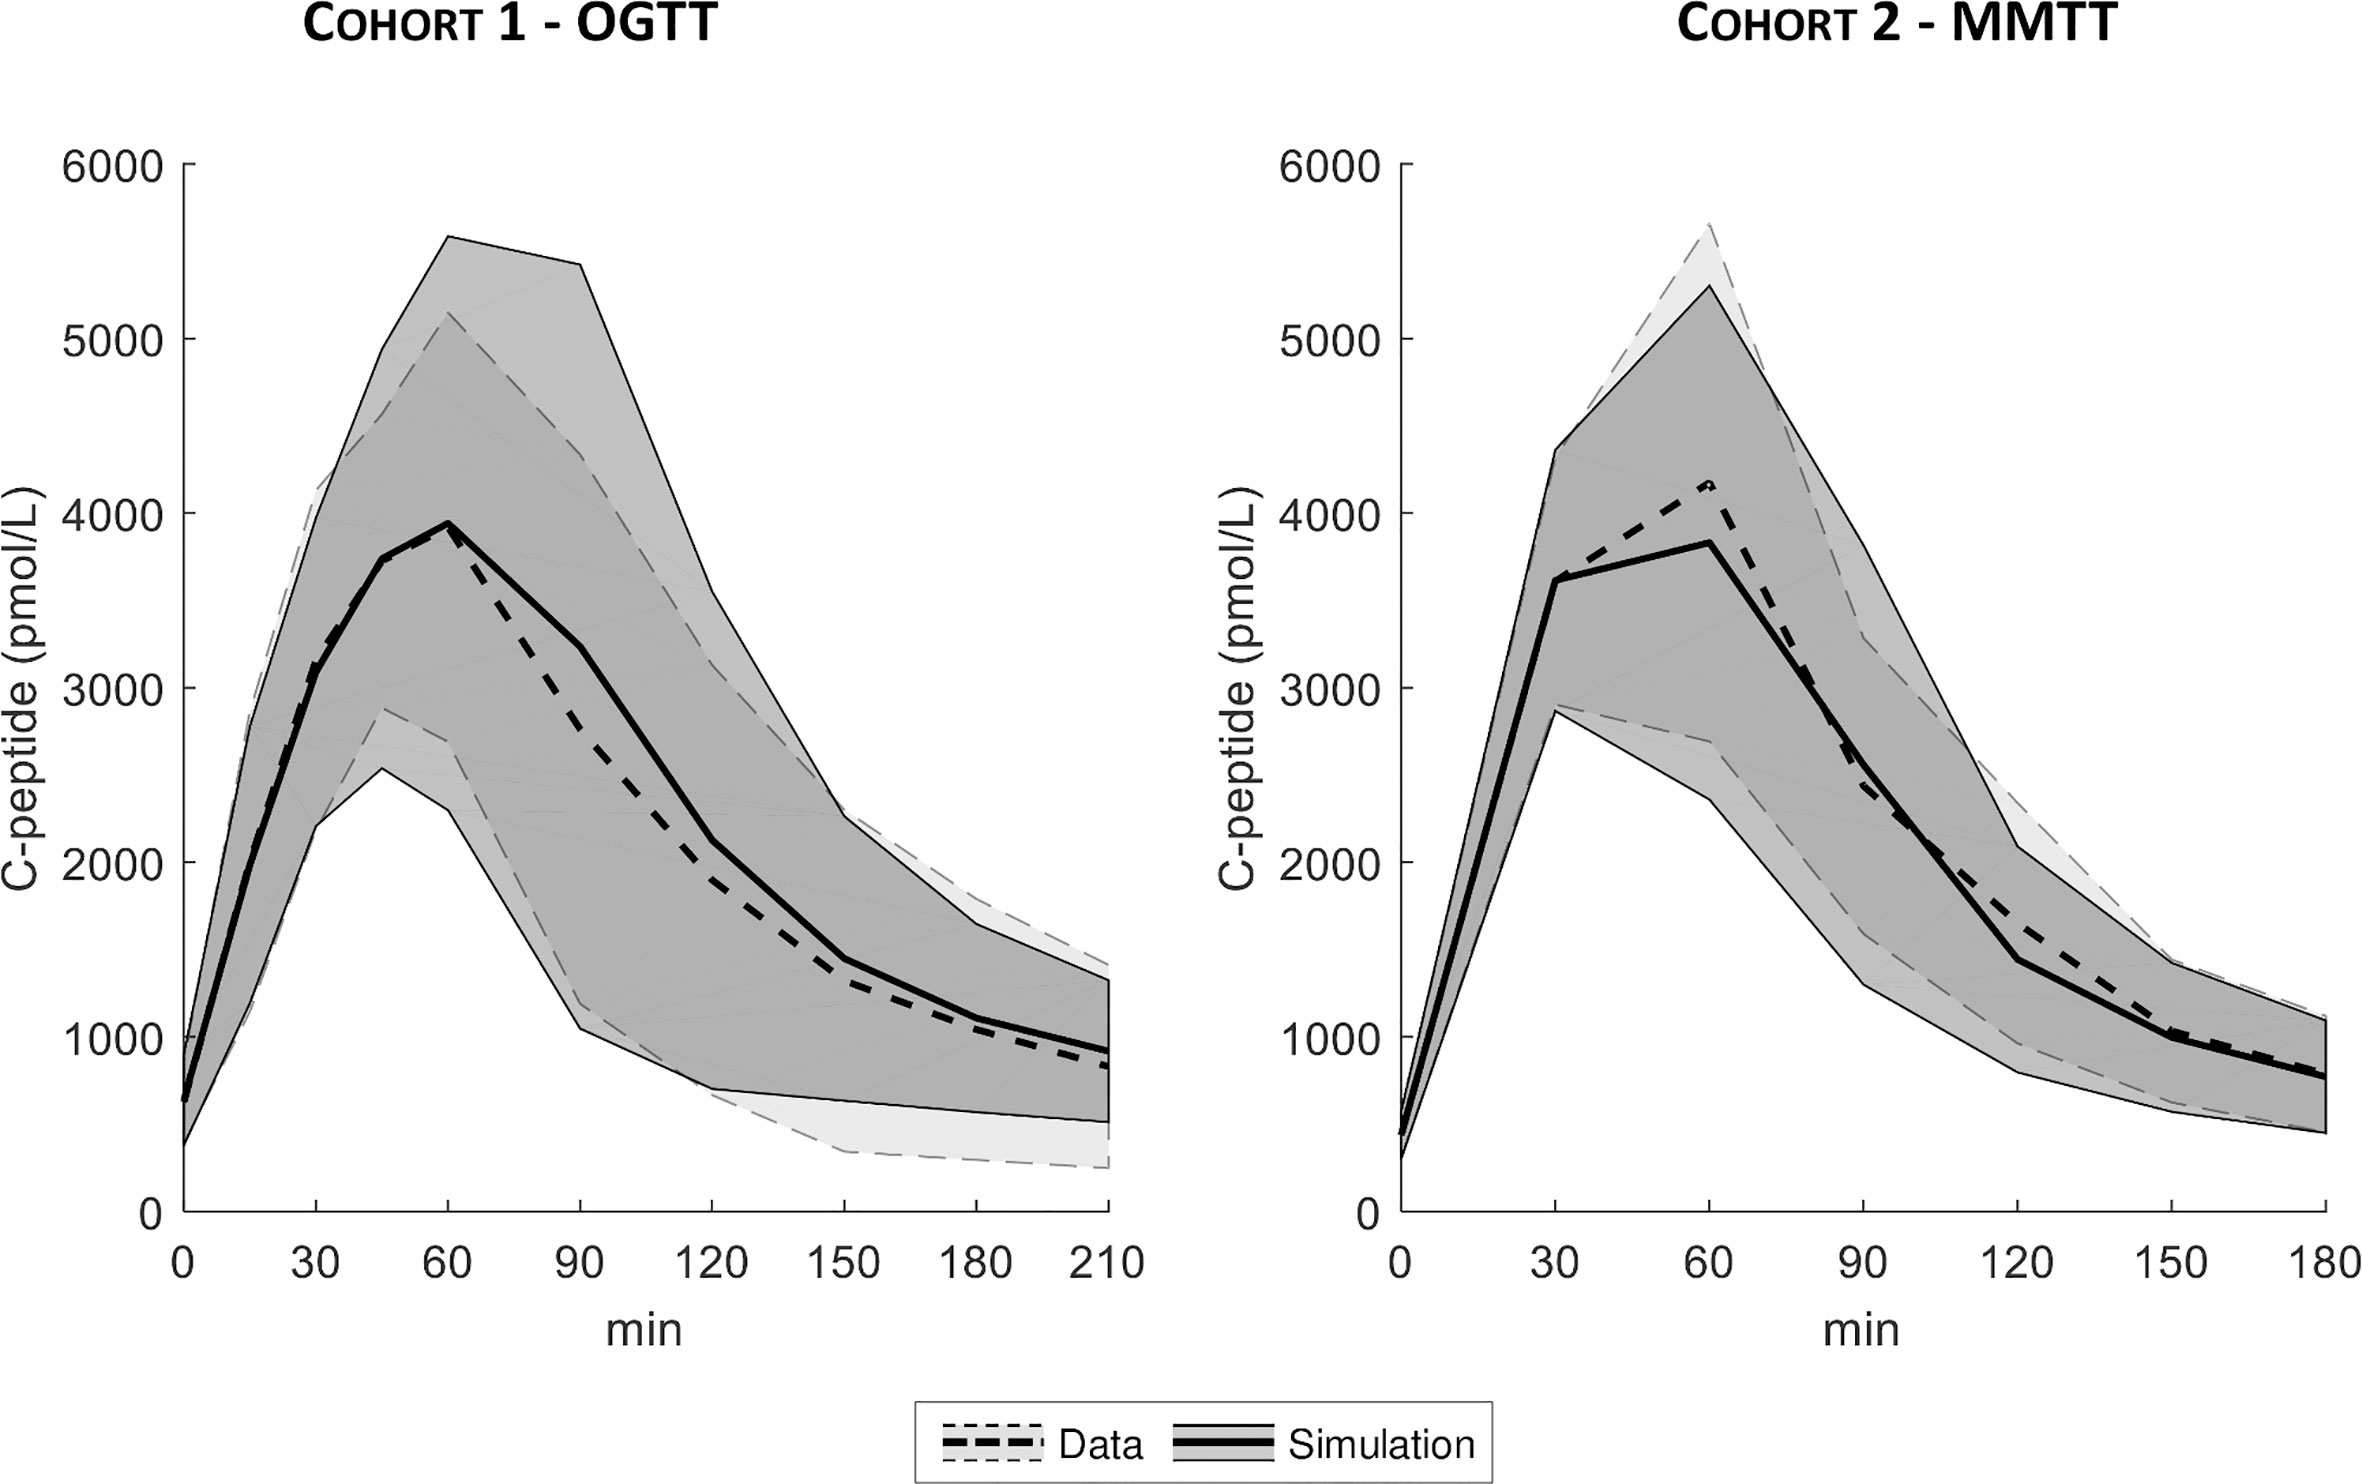
Figure 6 Mean ± SD of true (dashed line with light shaded area) vs. simulated data (continuous line with dark shaded area), for both Cohort 1- OGTT (left) and Cohort 2 - MMTT (right).
The MARD of estimated vs. true Φtot and MCR are reported in Figure 7. MARD for Φtot was 14 [7, 22] % with the VC, 11 [5, 17] % with the DB and 9 [5, 16] % with the PHH approach. MARD for MCR was 13 [7, 20] % with the VC, 9 [5, 15] % with the DB and 8 [4, 14] % with the PHH approach. For both parameters, the Kruskal-Wallis test highlighted a significant difference in MARD among the identification approaches. The post-hoc analysis revealed a significant difference of VC vs. DB and PHH, but not between DB vs. PHH approaches. Moreover, the overall MARD, calculated by pooling all the estimated parameters, was 23 [11, 44] % vs. 14 [6, 24] % vs. 14 [6, 25] % with the VC vs. DB vs. PHH approach, respectively. Also in this case, Kruskal-Wallis test detected a significant difference between approaches which was confirmed by post-hoc analysis only when comparing VC vs. DB and PHH approach.
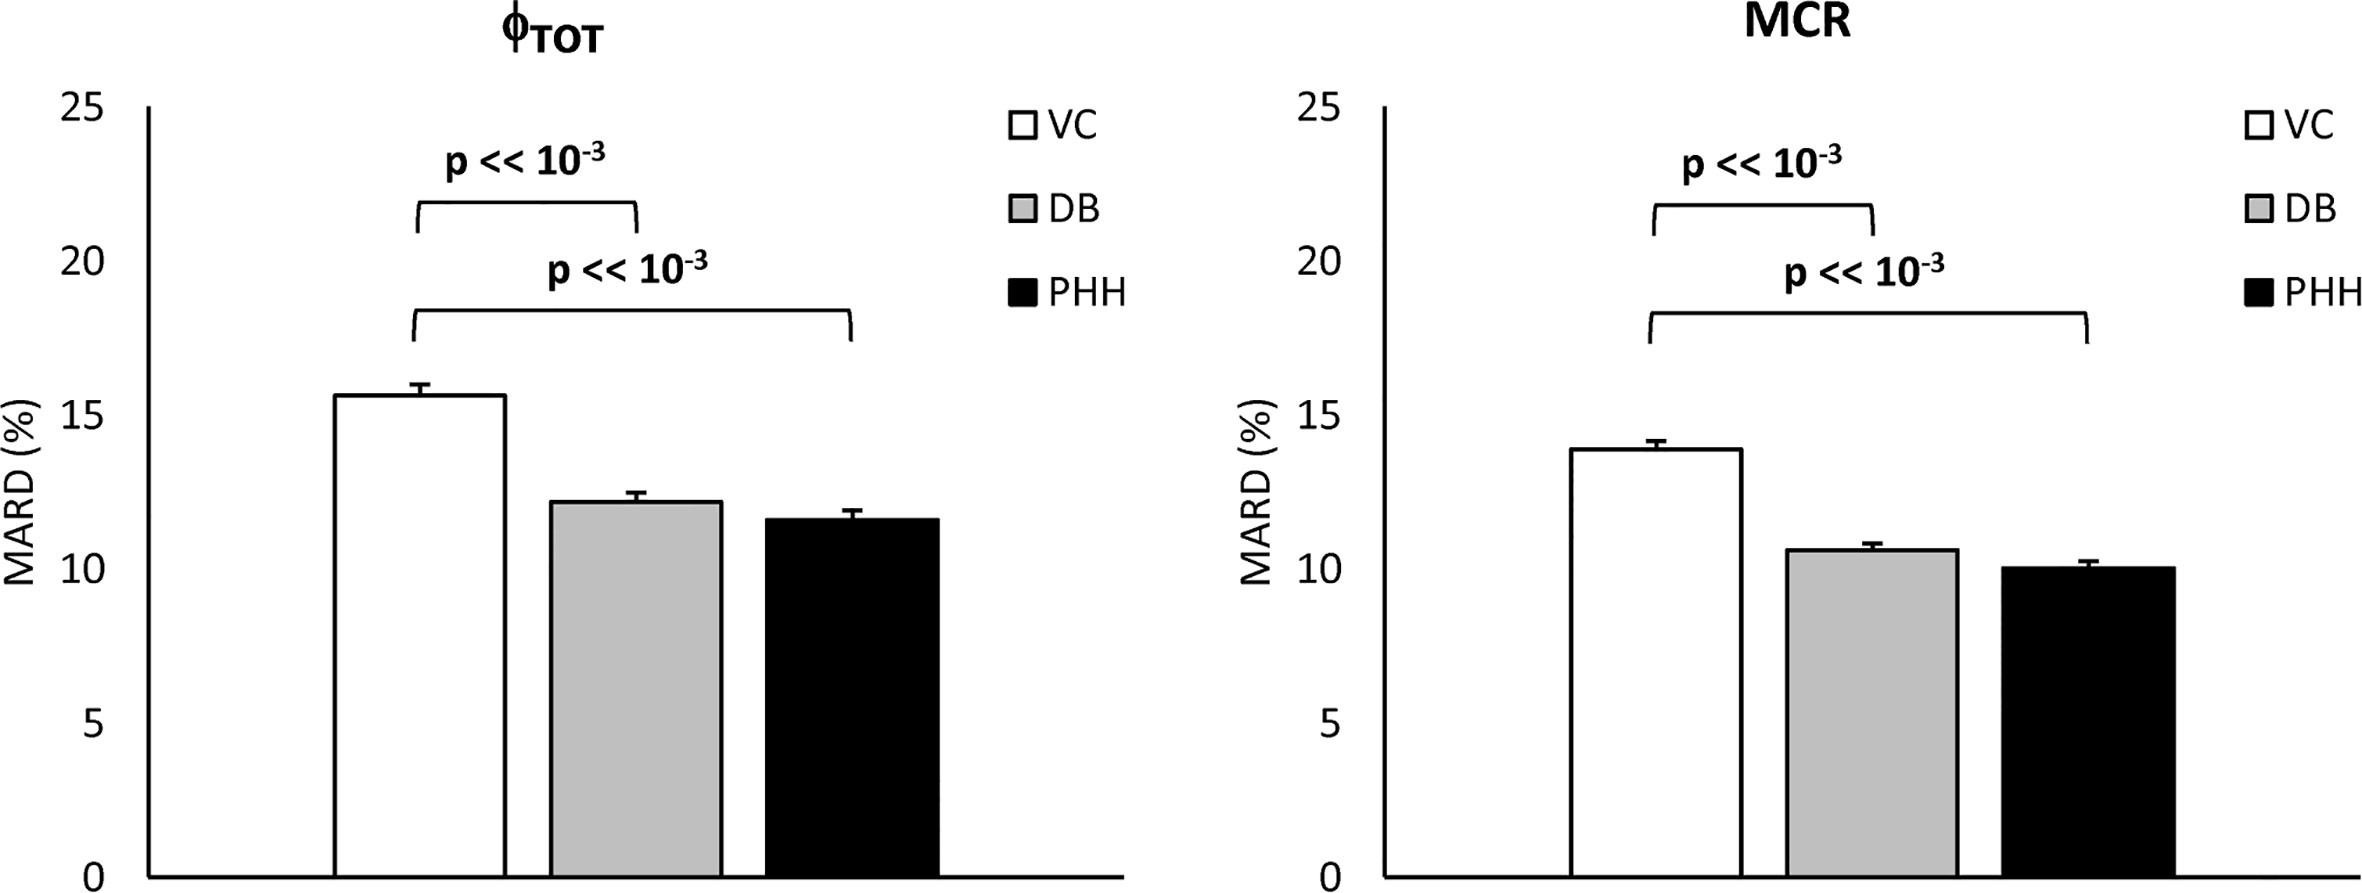
Figure 7 Mean Absolute Relative Difference (MARD) of estimated vs. true Φtot and MCR (left and right, respectively) for the VC, DB, and PHH approach calculated from the 1100 simulated C-peptide traces (mean ± SE).
Discussion
In this work, we tested the validity of the OCMM (11, 18) coupled with the Van Cauter population model for C-peptide kinetics in post-gastric bypass surgery individuals suffering from postprandial hyperinsulinemic hypoglycemia. We observed unsatisfactory results in terms of the model ability to predict the data (Figure 4). We hypothesized that this could be due to a mismatch between the actual C-peptide kinetics of the specific population under study and those predicted by the Van Cauter population model. To overcome this limitation, we used a Bayesian approach to estimate C-peptide kinetics from the data and tested the performance of the two different approaches using an in silico experiment.
While the OCMM prediction with the VC approach underestimated the C-peptide peak and overestimated the C-peptide tail, model fit of the data was satisfactory in all subjects with the DB approach (Figure 4). Our results, as illustrated by the higher C-peptide MCR with the DB vs. VC approach (Figure 5 bottom), are suggestive of faster C-peptide kinetics in post-gastric bypass patients suffering from postprandial hyperinsulinemic hypoglycemia compared to values predicted by the Van Cauter population model (14).
The better model prediction achieved with the DB approach was expected since, unlike the VC approach, the C-peptide kinetic parameters are allowed to adapt to the specific data. However, this does not demonstrate that the estimated kinetic and secretion parameters are closer to the true ones. To assess the validity of the proposed approach, a simulation study was performed. Results showed that the MARD of estimated vs. true parameters was significantly lower with the DB vs. VC approach for both Φtot and MCR (Figure 7), suggesting that the DB approach, despite exploiting the a priori information derived from the VC model, allows to estimate model parameters closer to the true ones than the VC approach. Similar results were also obtained when using a prior better reflecting the characteristics of the population under study (PHH approach), indicating that final results are minimally affected by the specific choice of the prior.
A limitation of the present study is the use of only one of the possible C-peptide secretion models available in the literature (11) and we imputed the unsatisfactorily prediction of the data to a mismatch of C-peptide kinetics while this could also be due to inadequacy of the model for the specific population. Using other models, e.g., (8–10), could lead to different conclusions depending on model structure and a priori/a posteriori identifiability properties. However, the C-peptide secretion model adopted here (11) has been used in many studies either on different populations, e.g., healthy (28), prediabetes (29), and subjects with type 2 diabetes (30), and experimental conditions, e.g., testing the effects of pharmacological treatments (31, 32), while always showing its ability to describe the data with C-peptide kinetic parameters fixed to the ones predicted by the Van Cauter population model. Another limitation is that the proposed DB approach was validated in a simulation framework only, while a C-peptide bolus experiment in the same subjects or inclusion of a control group with previous assessment of C-peptide kinetics would be required. In other words, the higher C-peptide MCR suggested by our results need to be confirmed by the current gold-standard experiment using C-peptide bolus under somatostatin infusion. Nevertheless, we would like to point out that the methodology outlined in this work is applicable beyond the study of insulin secretion in this population. The described approach will allow to study insulin secretion also in other metabolic disorders possibly affecting C-peptide kinetics (e.g., renal diseases) or to study secretion of other hormones for which a population model of the kinetics is not yet available (e.g., glucagon). Noteworthy, as a first step to study this population, we focused on C-peptide secretion and kinetics only. However, assessing insulin kinetics and hepatic insulin extraction is also of great interest. To do so, we will apply this methodology to estimate insulin kinetics and hepatic insulin extraction in future works.
In conclusion, the results of the present study show the limitations of the OCMM coupled to the Van Cauter population model to accurately describe C-peptide data in post-gastric bypass individuals suffering from postprandial hyperinsulinemic hypoglycemia. Consequently, its validity to study insulin secretion and β-cell function in this population is limited. To overcome this limitation, we propose an alternative approach by estimating C-peptide kinetics from the data using a Bayesian approach. This opens new possibilities for the study of hormones for which population kinetic models are unavailable. Overall, our results suggest faster C-peptide metabolic clearance rate in post-gastric bypass individuals suffering from postprandial hyperinsulinemic hypoglycemia compared to previously studied populations. While the ability of the new approach to describe C-peptide data was tested in silico, further confirmation using in vivo experiments are warranted.
Data Availability Statement
The original contributions presented in the study are included in the article. Further inquiries can be directed to the corresponding author.
Ethics Statement
The studies involving human participants were reviewed and approved by Local ethics committee (Kantonale Ethikommission Bern, Bern, Switzerland for NCT03609632 and Ethikkommission Nordwest- und Zentralschweiz, Basel, Switzerland for NCT03200782). Study related procedures were performed in accordance with the local ethics standards and with the Declaration of Helsinki. The patients/participants provided their written informed consent to participate in this study.
Author Contributions
All authors contributed to the article and approved the submitted version. MS performed the analysis, contributed to the discussion and wrote the manuscript. DH and LB provided the data, contributed to the discussion and writing the manuscript. MH and MD provided the data, contributed to the discussion, and edited the manuscript. CDM reviewed data analysis, contributed to results interpretation and writing the manuscript. CDM is the guarantor of this work and, as such, had full access to all the data in the study and takes responsibility for the integrity of the data and the accuracy of the data analysis.
Funding
This work was supported by MIUR (Italian Minister for Education) under the initiative “Departments of Excellence” (Law 232/2016), University of Padova under the initiative “SID-Networking Project 2019”, the Swiss National Science Foundation (PCEGP3_186978) and the Scientific Fund of the Department of Diabetes, Endocrinology, Nutritional Medicine, Inselspital as well as the Diabetes Center Bern and the University Hospital in Basel.
Conflict of Interest
The authors declare that the research was conducted in the absence of any commercial or financial relationships that could be construed as a potential conflict of interest.
Acknowledgments
We would like to thank Sjaam Jainandunsing and Nicole Hunkeler for their assistance during the experiments in Bern.
References
1. Lee CJ, Brown TT, Schweitzer M, Magnuson T, Clark JM. The incidence and risk factors associated with developing symptoms of hypoglycemia after bariatric surgery. Surg Obes Relat Dis (2018) 14(6):797–802. doi: 10.1016/j.soard.2018.01.028
2. Capristo E, Panunzi S, De Gaetano A, Spuntarelli V, Bellantone R, Giustacchini P, et al. Incidence of hypoglycemia after gastric bypass vs sleeve gastrectomy: a randomized trial. J Clin Endocrinol Metab (2018) 103:2136–46. doi: 10.1210/jc.2017-01695
3. Jørgensen NB, Dirksen C, Bojsen-Møller KN, Jacobsen SH, Worm D, Hansen DL, et al. Exaggerated glucagon-like peptide 1 response is important for improved beta-cell function and glucose tolerance after Roux-en-Y gastric bypass in patients with type 2 diabetes. Diabetes (2013) 9:3044–52. doi: 10.2337/db13-0022
4. Honka H, Salehi M. Postprandial hypoglycemia after gastric bypass surgery: from pathogenesis to diagnosis and treatment. Curr Opin Clin Nutr Metab Care (2019) 22(4):295–302. doi: 10.1097/MCO.0000000000000574
5. Goldfine AB, Mun EC, Devine E, Bernier R, Baz-Hecht M, Jones DB, et al. Patients with neuroglycopenia after gastric bypass surgery have exaggerated incretin and insulin secretory responses to a mixed meal. J Clin Endocrinol Metab (2007) 12:4678–85. doi: 10.1210/jc.2007-0918
6. Shah A, Holter MM, Rimawi F, Mark V, Dutia R, McGinty J, et al. Insulin clearance after oral and intravenous glucose following gastric bypass and gastric banding weight loss. Diabetes Care (2019) 2:311–7. doi: 10.2337/dc18-1036
7. Pillonetto G, Sparacino G, Cobelli C. Reconstructing insulin secretion rate after glucose stimulus by an improved stochastic deconvolution method. IEEE Trans BioMed Eng (2001) 48(11):1352–4. doi: 10.1109/10.959332
8. Hovorka R, Chassin L, Luzio SD, Playle R, Owens DR. Pancreatic β-cell responsiveness during meal tolerance test: model assessment in normal subjects and subjects with newly diagnosed noninsulin-dependent diabetes mellitus. J Clin Endocrinol Metab (1998) 83:744–50. doi: 10.1210/jc.83.3.744
9. Cretti A, Lehtovirta M, Bonora E, Brunato B, Zenti MG, Tosi F, et al. Assessment of β-cell function during the oral glucose tolerance test by a minimal model of insulin secretion. Eur J Clin Invest (2001) 31:405–16. doi: 10.1046/j.1365-2362.2001.00827.x
10. Mari A, Schmitz O, Gastaldelli A, Oestergaard T, Nyholm B, Ferrannini E. Meal and oral glucose tests for assessment of beta-cell function: modeling analysis in normal subjects. Am J Physiol Endocrinol Metab (2002) 283:1159–66. doi: 10.1152/ajpendo.00093.2002
11. Breda E, Toffolo G, Polonsky KS, Cobelli C. Insulin release in impair glucose tolerance. Oral minimal model predicts normal sensitivity to glucose but defective response times. Diabetes (2002) 51:227–33. doi: 10.2337/diabetes.51.2007.S227
12. Eaton RP, Allen RC, Schade DS, Erickson KM, Standefer J. Prehepatic insulin production in man: kinetic analysis using peripheral connecting peptide behavior. J Clin Endocrinol Metab (1980) 51:520–8. doi: 10.1210/jcem-51-3-520
13. Polonsky KS, Licinio-Paxiao J, Given BD, Pugh W, Rue P, Galloway J, et al. Use of biosynthetic human C-peptide in the measurement of insulin secretion rates in normal volunteers and type 1 diabetics. J Clin Invest (1986) 77:98–105. doi: 10.1172/JCI112308
14. Van Cauter E, Mestrez F, Sturie J, Polonsky KS. Estimation of insulin secretion rated from C-peptide levels: comparison of individual and standard kinetic parameters from C-peptide clearance. Diabetes (1992) 41:368–77. doi: 10.2337/diabetes.41.3.368
15. Magni P, Sparacino G, Bellazzi R, Toffolo G, Cobelli C. Insulin minimal model indexes and secretion: proper handling of uncertainity by a Bayesian approach. Ann Biomed Eng (2004) 32(7):1027–37. doi: 10.1023/B:ABME.0000032465.75888.91
16. Varghese RT, Dalla Man C, Laurenti MC, Piccinini F, Sharma A, Shah M, et al. Performance of individually measured population-based C-peptide kinetics to asses β-cell function in the presence and absence of acute insulin resistance. Diabetes Obes Metab (2018) 20(3):549–55. doi: 10.1111/dom.13106
17. Svane MS, Bosjen-Møller KN, Martinussen C, Dirksen C, Madsen JL, Reitelseder S, et al. Postprandial nutrient handling and gastrointestinal hormone secretion after Roux-en-Y gastric bypass vs sleeve gastrectomy. Gastroenterology (2019) 156:1627–41. doi: 10.1053/j.gastro.2019.01.262
18. Cobelli C, Dalla Man C, Toffolo G, Basu R, Vella A, Rizza R. The oral minimal model method. Diabetes (2014) 63:1203–13. doi: 10.2337/db13-1198
19. Hepprich M, Wiedermann SJ, Schelker BL, Trinh B, Stäerkle A, Geigges M, et al. Postprandial hypoglycemia in patients after bariatric surgery is mediated by glucose-induced IL-1β. Cell Metab (2020) 31(4):699–709. doi: 10.1016/j.cmet.2020.02.013
20. Dalla Man C, Campioni M, Polonsky KS, Basu R, Rizza RA, Toffolo G, et al. Two-hour seven-sample oral glucose tolerance test and meal protocol. Diabetes (2005) 54:3265–73. doi: 10.2337/diabetes.54.11.3265
21. Cobelli C, Foster D, Toffolo G. Tracer kinetic in Biomedical Research: from Data to Model. New York: Kluwer Academic/Plenum (2000).
22. Bellu G, Saccomani MP, Audoly S, D’Angiò L. DAISY: A new software tool to test global identifiability of biological and physiological systems. Comput Methods Programs Biomed (2007) 88(1):52–61. doi: 10.1016/j.cmpb.2007.07.002
23. Carson ER, Cobelli C. Modeling methodology in physiology and medicine. 2nd ed. San Diego, CA, USA: Academic Press (2013).
24. Toffolo G, Campioni M, Basu R, Rizza RA, Cobelli C. A minimal model of insulin secretion and kinetics to assess hepatic insulin extraction. Am J Physiol Endocrinol Metab (2006) 290:169–76. doi: 10.1152/ajpendo.00473.2004
25. De Nicolao G, Sparacino G, Cobelli C. Nonparametric input estimation in physiological systems: Problems, methods, case studies. Automatica (1997) 33:851–70. doi: 10.1016/S0005-1098(96)00254-3
27. Visentin R, Campos-Náñez E, Schiavon M, Lv D, Vettoretti M, Breton M, et al. The UVA/Padova type 1 diabetes simulator goes from single meal to single day. J Diabetes Sci Technol (2018) 12(2):273–81. doi: 10.1177/1932296818757747
28. Basu R, Dalla Man C, Campioni M, Basu A, Klee G, Toffolo G, et al. Effects of age and sex on postprandial glucose metabolism. Diabetes (2006) 55:2001–14. doi: 10.2337/db05-1692
29. Konopka AR, Esponda RR, Robinson MM, Johnson ML, Carter RE, Schiavon M, et al. Hyperglucagonemia mitigates the effect of metformin on glucose production in prediabetes. Cell Rep (2016) 15:1394–400. doi: 10.1016/j.celrep.2016.04.024
30. Basu A, Dalla Man C, Basu R, Toffolo G, Cobelli C, Rizza RA. Effect of type 2 diabetes on insulin secretion, insulin action, glucose effectiveness, and postprandial glucose metabolism. Diabetes Care (2009) 32:866–72. doi: 10.2337/dc08-1826
31. Hinshaw L, Schiavon M, Mallad A, Dalla Man C, Basu R, Bharucha AE, et al. Effects of delayed gastric emptying on postprandial glucose kinetics, insulin sensitivity, and β-cell function. Am J Physiol Endocrinol Metab (2014) 307:494–502. doi: 10.1152/ajpendo.00199.2014
Keywords: model identification, parameter estimation, obesity, insulin secretion, oral minimal model, OGTT, mixed meal
Citation: Schiavon M, Herzig D, Hepprich M, Donath MY, Bally L and Dalla Man C (2021) Model-Based Assessment of C-Peptide Secretion and Kinetics in Post Gastric Bypass Individuals Experiencing Postprandial Hyperinsulinemic Hypoglycemia. Front. Endocrinol. 12:611253. doi: 10.3389/fendo.2021.611253
Received: 28 September 2020; Accepted: 19 January 2021;
Published: 15 March 2021.
Edited by:
Darko Stefanovski, University of Pennsylvania, United StatesReviewed by:
Amit Tirosh, Sheba Medical Center, IsraelMichael Rickels, University of Pennsylvania, United States
Copyright © 2021 Schiavon, Herzig, Hepprich, Donath, Bally and Dalla Man. This is an open-access article distributed under the terms of the Creative Commons Attribution License (CC BY). The use, distribution or reproduction in other forums is permitted, provided the original author(s) and the copyright owner(s) are credited and that the original publication in this journal is cited, in accordance with accepted academic practice. No use, distribution or reproduction is permitted which does not comply with these terms.
*Correspondence: Chiara Dalla Man, ZGFsbGFtYW5AZGVpLnVuaXBkLml0