 Flavio A. Cadegiani
 Claudio E. Kater
- Adrenal and Hypertension Unit, Division of Endocrinology and Metabolism, Department of Medicine, Federal University of São Paulo Medical School, São Paulo, Brazil
Objectives: The Endocrine and Metabolic Responses on Overtraining Syndrome (EROS) study identified multiple hormonal and metabolic conditioning processes in athletes, and underlying mechanisms and biomarkers of overtraining syndrome (OTS). The present study's objective was to reveal independent predictors and linear correlations among the parameters evaluated in the EROS study to predict clinical, metabolic, and biochemical behaviors in healthy and OTS-affected male athletes.
Methods: We used multivariate linear regression and linear correlation to analyze possible combinations of the 38 parameters evaluated in the EROS study that revealed significant differences between healthy and OTS-affected athletes.
Results: The testosterone-to-estradiol (T:E) ratio predicted the measured-to-predicted basal metabolic rate (BMR) ratio; the T:E ratio and total testosterone level were inversely predicted by fat mass and estradiol was not predicted by any of the non-modifiable parameters. Early and late growth hormone, cortisol, and prolactin responses to an insulin tolerance test (ITT) were strongly correlated. Hormonal responses to the ITT were positively correlated with fat oxidation, predicted-to-measured BMR ratio, muscle mass, and vigor, and inversely correlated with fat mass and fatigue. Salivary cortisol 30 min after awakening and the T:E ratio were inversely correlated with fatigue. Tension was inversely correlated with libido and directly correlated with body fat. The predicted-to-measured BMR ratio was correlated with muscle mass and body water, while fat oxidation was directly correlated with muscle mass and inversely correlated with fat mass. Muscle mass was directly correlated with body water, and extracellular water was directly correlated with body fat and inversely correlated with body water and muscle mass.
Conclusions: Hypothalamic-pituitary responses to stimulation were diffuse and indistinguishable between the different axes. A late hormonal response to stimulation, increased cortisol after awakening, and the T:E ratio were correlated with vigor and fatigue. The T:E ratio was also correlated with body metabolism and composition, testosterone was predicted by fat mass, and estradiol predicted anger. Hydration status was inversely correlated with edema, and inter-correlations were found among fat oxidation, hydration, and body fat.
Introduction
The benefits of extensive exercise have exceeded previous expectations, including primary prevention, active part of the treatment, improvement of life quality, and prognosis under chronic or incurable diseases, and prevention of complications and recurrence, of a wide range of diseases, including cardiovascular (1, 2), hypertension, type 2 diabetes mellitus (T2DM) (1), dyslipidemia, cancers (3–6), cognitive function (7), and all quality of life domains (8–10).
Many of the benefits from physical activity are linked to multiple adaptive changes that leads to improvements in neuromuscular (11), cardiovascular (12), musculoskeletal, autonomic, and other systems that active individuals undergo. However, these benefits may only occur when physically active individuals sleep and eat appropriately, alongside with training (13, 14).
Indeed, overtraining syndrome (OTS), which affects between 40 and 60% of the elite athletes during their careers, is likely a major manifestation of the harms of an imbalance between excessive training, insufficient recovery, non-refreshing sleep, insufficient caloric, protein, and/or carbohydrate intake, and concurrent psychological stress, including excessive cognitive effort, social, familiar, or financial issues (15–17). This imbalance is the likely underlying reason of the paradoxical loss of physical performance in OTS, which is not able to be justified by any apparent dysfunction (15). However, OTS is still a controversial issue since several characteristics of OTS, including underlying mechanisms, pathophysiology, and biological markers are universally accepted or clarified, as the prevailing findings on previous studies were inconsistent (15–17).
To address all the unanswered questions on OTS, and also to better understand the multiple conditioning processes that athletes seem to undergo, we conducted the Endocrine and Metabolic Responses to Overtraining Syndrome (EROS) study (18–24). In that study, we evaluated basal and exercise-independent hormonal responses to stimulation tests, multiple biochemical markers, including muscular, inflammatory, immunologic, and nutritional parameters, specific eating, psychological, and social patterns, and the body metabolism and composition of healthy athletes, athletes affected by OTS, and sedentary individuals with similar baseline characteristics (age, sex, and body mass index—BMI). The list of parameters evaluated by the EROS study are detailed in Table 1, together with the selection process for the present analysis, to be described further.
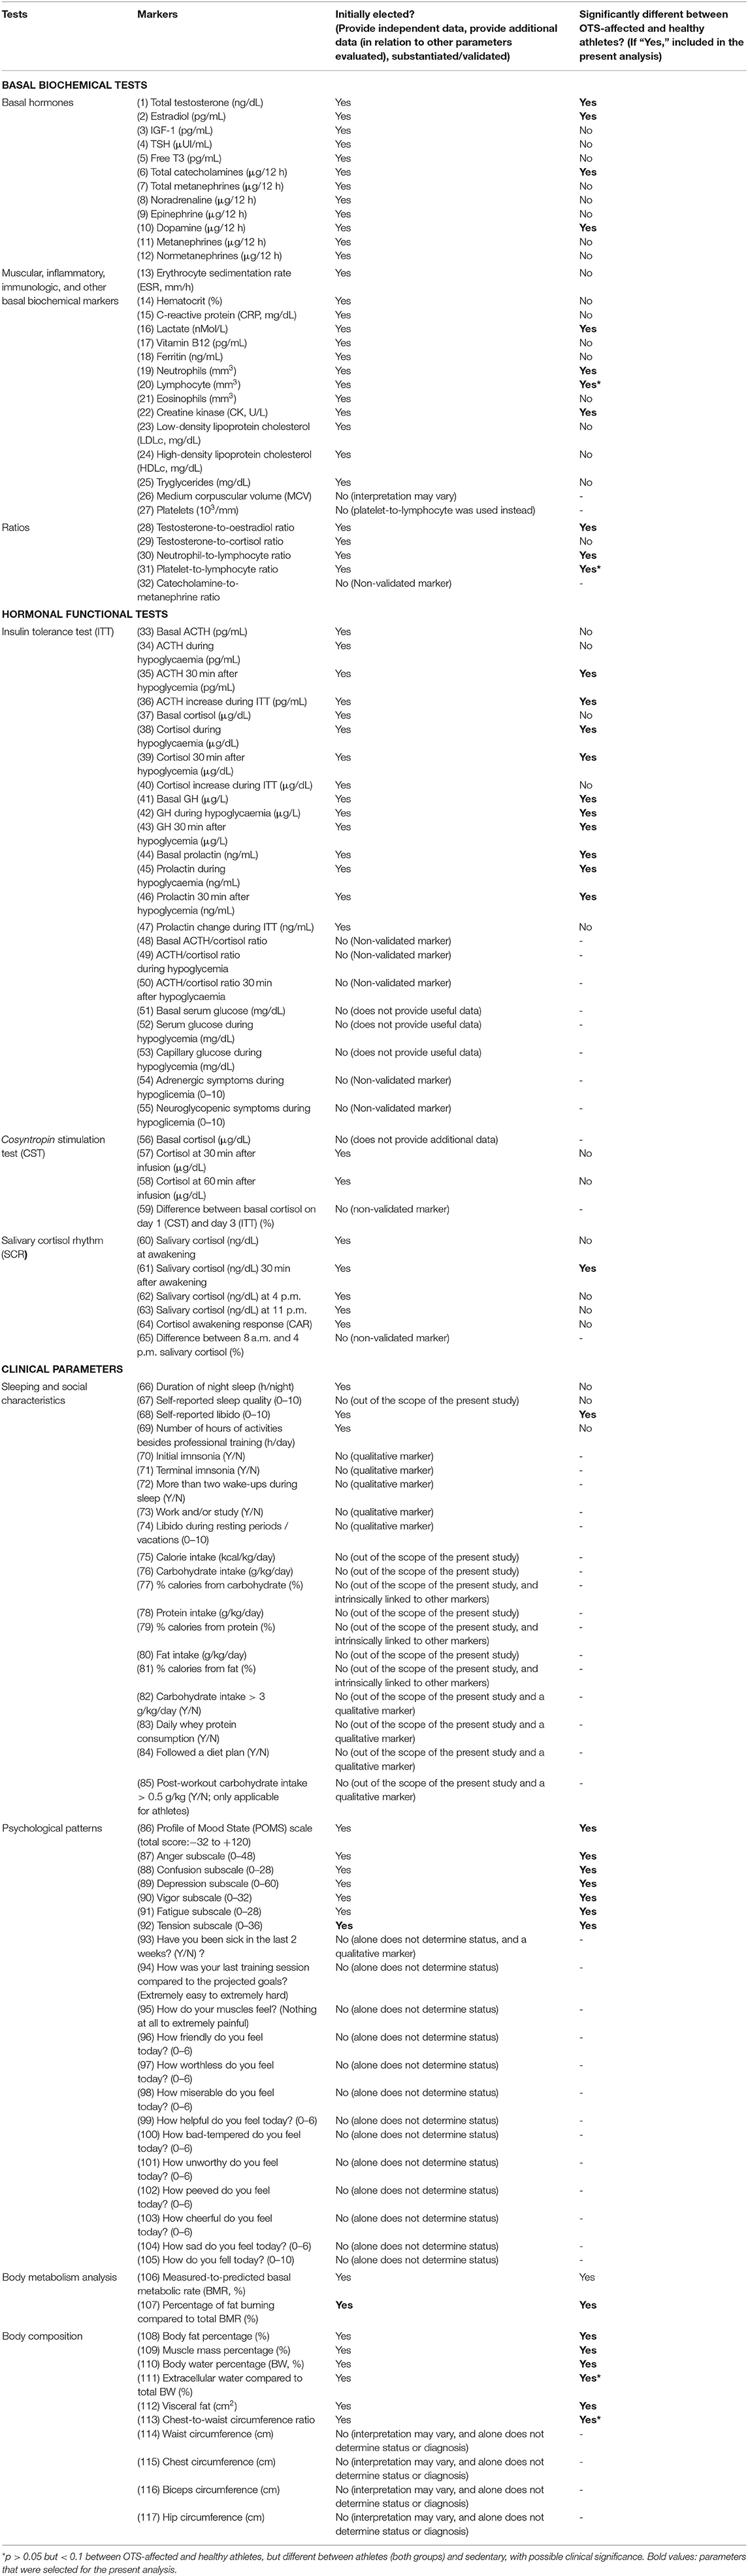
Table 1. Eligible markers for the present analysis.
Among the 117 markers evaluated in the EROS study, we identified 50 novel parameters for OTS-affected and healthy athletes, including amplified and prolonged GH, cortisol, and prolactin responses to a stimulation test, increased testosterone, lactate clearance, catecholamines, basal metabolic rate (BMR), fat oxidation, and hydration in healthy athletes, and blunted hormonal responses (compared to healthy athletes), increased creatine kinase (CK), aromatase activity, estradiol, anger, depression, fatigue, mental confusion and fat mass, and reduced testosterone, hydration, muscle mass, BMR, fat oxidation, and moods in athletes affected by OTS (23). The major findings of the EROS study are described in Figure 1.
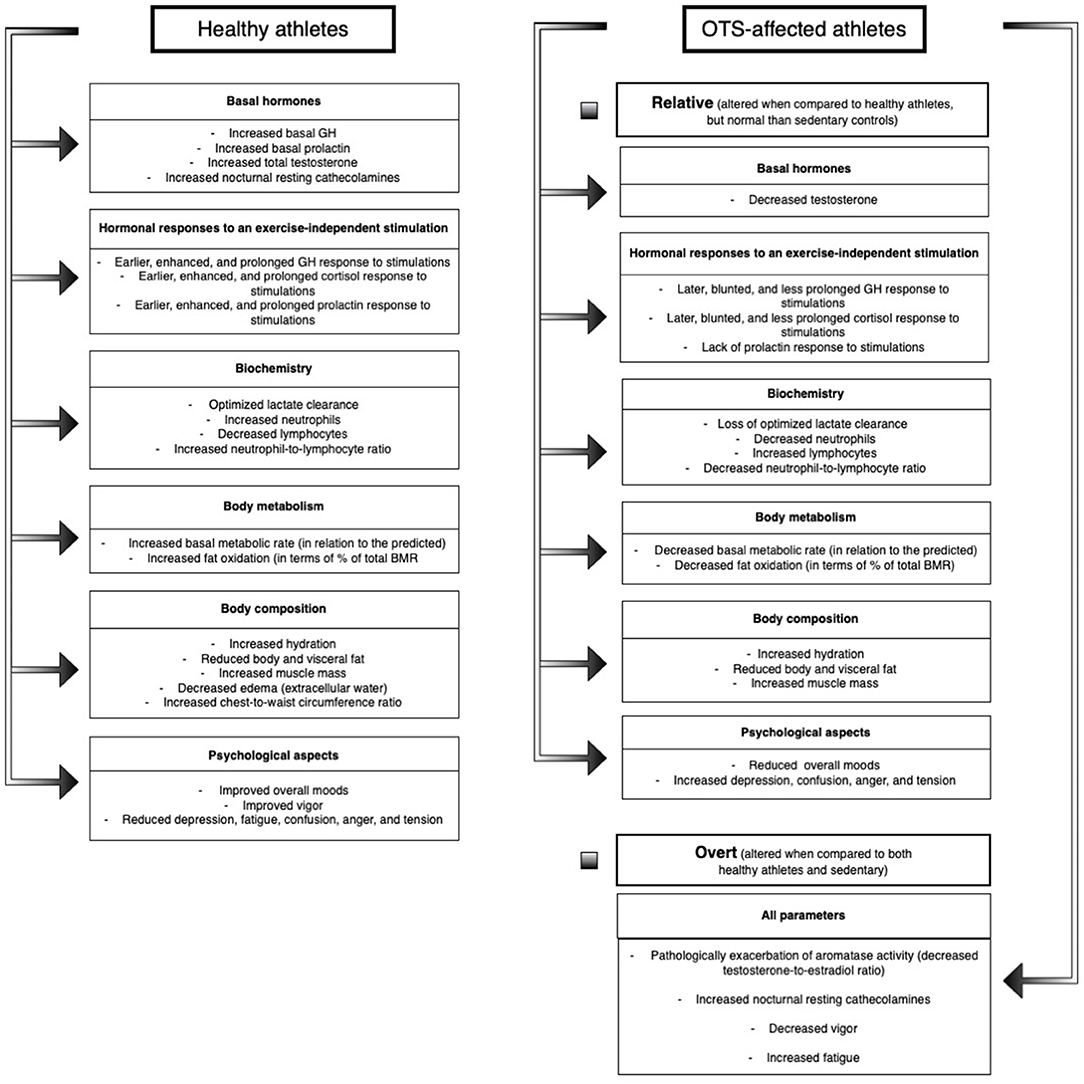
Figure 1. Main findings of the EROS study.
The findings unveiled by the EROS study supported the hypothesis of the existence of multiple adaptations of clinical, metabolic, biochemical, and body parameters that athletes, while the majority of the physiological adaptive changes are compromised in OTS, which may explain the hallmark of OTS, the loss of performance (23, 24).
Despite the multiple and broad adaptive changes previously demonstrated to occur in athletes, and the more than 50 novel markers and processes identified in both healthy and OTS-affected athletes in the present study, the relationships between parameters that are affected by training and/or OTS are unclear (18–21). Associations, interactions, synergisms, stimulations, and inhibitions between hormones, inflammatory, immunologic, muscular, metabolic, and clinical markers, and psychological, eating, sleep, and training patterns, have been poorly assessed previously, and have not been identified in the EROS study, once our primary objective was to detect differences between OTS and healthy athletes, and sedentary control among the 117 parameters evaluated, using three-group and pairwise comparisons, which were published in different arms (18–24).
The unexpected large number of markers identified in both populations of athletes allowed us hypothesize the existence of a web of multiple sorts of interactions between parameters of different natures, which could result in the wide range of benefits and improved performance observed in healthy athletes, and the paradoxical decrease of sports performance, fatigue, reduced libido, and body changes in OTS (24). The correlations to be identified between the newly uncovered parameters could provide a new understanding of the complex processes of conditioning processes that athletes typically undergo, and the convoluted mechanisms that lead to OTS (23, 24).
In summary, despite the large number of discoveries (18–22, 24), our primary findings do not demonstrate the multiple sorts of relationship between those markers that participate in the adaptative processes of the athletes and those that have roles in the pathogenesis of OTS. Therefore, in the present study we aimed to uncover the web of multiple interactions that participate in the conditioning processes that occur in athletes, and the underlying mechanisms of the pathophysiology of OTS, derived from an exhaustive yet reasonable joint post-hoc analysis of the primary findings of the EROS study, using different and more complex statistical analyses (e.g., multivariate linear regression, logistic regression, and linear correlation analyses) that those employed in the primary arms of the study, which is adequate owing to the large number of data generated by the EROS study (more than 11,000 results among 117 parameters).
Our ultimate objective was to identify independent predictors and linear correlations, and determine causal relationships and inter-influences, among hormonal, immunologic, inflammatory, muscular, psychological, metabolic, and body composition parameters, aiming to uncover behavior patterns and dysfunctional pathways in OTS.
Materials and Methods
Subject and Parameter Selection
The detailed methodology was of the EROS study was previously published (18–22), also available at a depository (https://osf.io/bhpq9/). The present study was approved by the ethical committee of the Federal University of São Paulo (Approval Number: 1093965).
We recruited participants through social media (Facebook, Instagram, Whatsapp), and were initially evaluated for age, sex, weight and height, clinical characteristics, and if they were suspected for Overtraining Syndrome (OTS), healthy athletes (ATL), or non-physically active (NPAC), and training (if athletes). Inclusion criteria for all participants, criteria for all athletes, and specific criteria for OTS are shown in Figure 2. Employing a two-step selection process, we avoided athletes with an insufficient amount of training for the adaptive changes to exercises, non-full sedentary, extremes of age, misdiagnosis of OTS, and presence of confounding hormones, medications, and diseases.
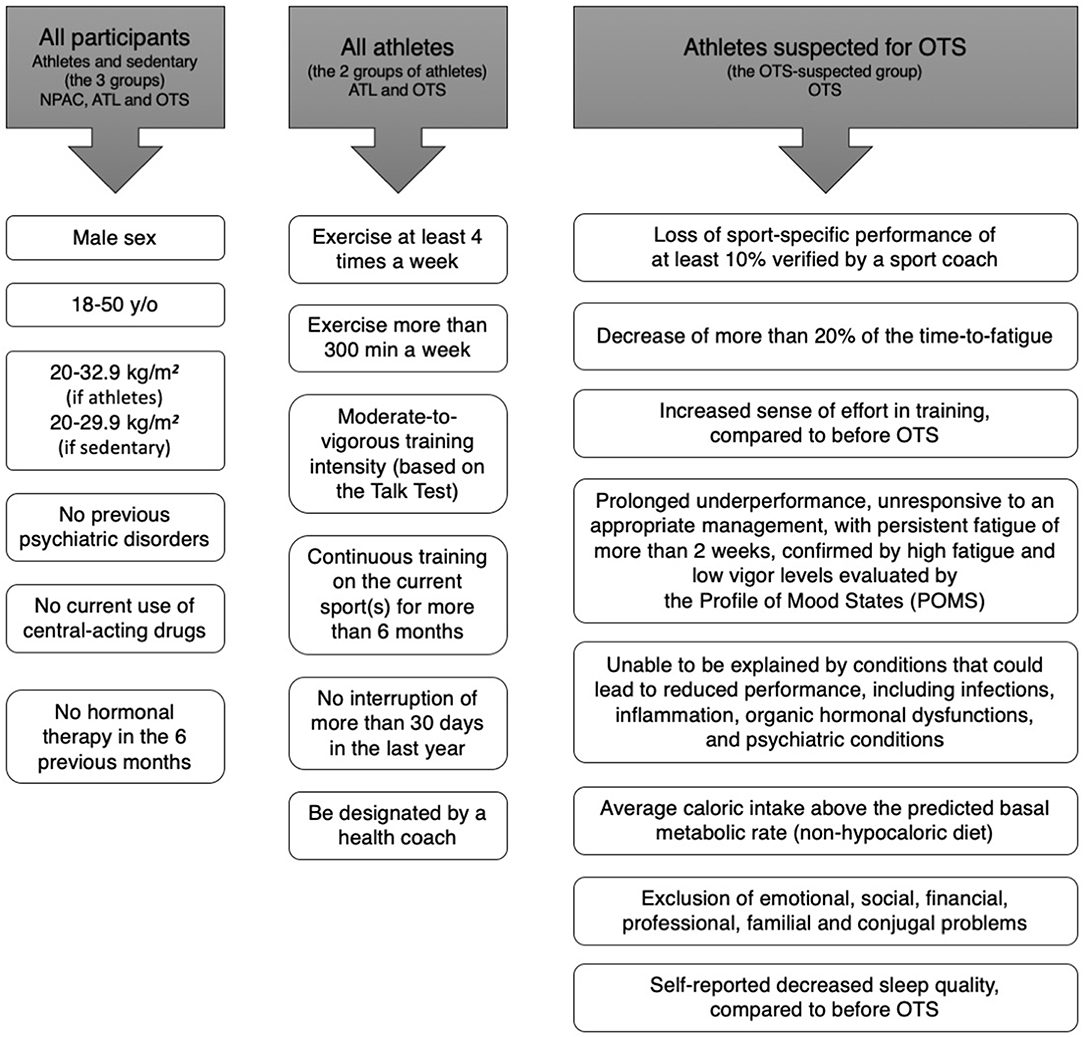
Figure 2. Selection criteria for the EROS study.
For OTS candidates, we employed the diagnostic flowchart proposed by the latest guideline on OTS (15), the joint guideline of the European College of Sport Science and American College of Sports Medicine, from 2013, which requires the presence of decrease of at least 10% in training intensity, volume, pace, power, strength, or overall performance, decrease of the time-to-fatigue of at least 20%, both verified by a professional coach, increased sense of effort, changes in behavior and decreased energy levels, with or without sleep disturbances, infections or injuries, which persisted for at least 1–2 months, despite the attempts to recover, and which is not caused by conditions that could inherently lead to decrease of performance, including inflammations, infections, and frank hormonal dysfunctions.
Design of the Study
Summary of the procedures according to each primary arm of the EROS study
All selected participants signed a written informed consent for participation in the study, approved by the ethics committee of the Federal University of São Paulo, in accordance with the Declaration of Helsinki. Then, participants underwent hormonal responses to stimulation tests, basal biochemical, inflammatory, muscular, immunologic, and hormonal parameters, nocturnal urinary catecholamines (NUC) and its metabolites, analysis of body metabolism and composition, and evaluation of psychological, social, sleep, and eating patterns.
In the EROS-HPA axis arm of the study, we evaluated peripheral and central components of the hypothalamic-pituitary-adrenal (HPA) axis (whether primary or peripheral: adrenal, or central: pituitary and hypothalamus), by employing a 250 ug cosyntropin stimulation test (CST), for direct evaluation of cortico-adrenal responses to a synthetic ACTH, an insulin tolerance test (ITT), an exercise-independent stimulation test that provokes a hypoglycemia as the stimulation for the evaluation of the integrity of the HPA axis, and salivary cortisol rhythm (SCR), for the identification of the patterns of the circadian rhythm of the cortisol.
In the EROS-STRESS test we employed the same ITT for the evaluation of the of the growth hormone (GH) and prolactin responses to hypoglycemia, and which we detailed different aspects of the test, including time-to-hypoglycemia, glycemic nadir, severity of adrenergic, and neuroglycopenic symptoms during hypoglycemia, and compared between groups.
In the EROS-BASAL arm, we evaluated basal hormones, immunologic, muscular, classical inflammatory, lipids, and vitamin. And for the EROS-PROFILE, participants underwent several questions regarding specific sleeping, eating, social, and psychological patterns, and underwent analysis of body composition and metabolism.
The full process was performed during a short period, of <10 days, between the recruitment, clinical, and biochemical inclusion and exclusion criteria, the collect of the basal biochemical parameters, all questionnaires, body composition, and metabolism, and functional tests. For all parameters we performed three-group and pairwise comparisons.
Procedures and Tests
Questionnaires
After the selection criteria, athletes (sedentary subjects were not assessed at this moment) underwent an initial specific interview about training patterns, including the type(s) the sport(s) practiced, time since starting the current sport(s), training volume and intensity (evaluated by a professional coach, on a scale from 0 to 10 compared to athletes of the same level of training), duration of training per week (min), number of rest days per week was recorded based on standardized tests, and whether they were supervised by a coach. This first questionnaire aimed to determine the baseline characteristics of the OTS and ATL Groups.
For all athletes affected by OTS, we evaluated whether and the number of days to overcome the underperformance state, changes in sensitivity to heat or to coldness, occurrence of infections, particularly upper respiratory tract infections (URTIs), and injuries, and feelings of monotony and boredom.
All participants (now including the non-physically active group—NPAC) then underwent specific questionnaires regarding sleeping, eating, social, and psychological characteristics.
In terms to eating habits, we employed a 7-day food and nutrition specific record and manually calculated mean daily carbohydrate, fat, protein, and overall caloric intake, aiming to preclude heterogeneity regarding the food analysis. The following specific aspects were evaluated: mean daily (1) carbohydrate, (2) protein, and (3) fat intake (in g/kg), (4) mean daily calorie, total (kcal/day) and per weight (kcal/kg/day), (5) the proportion of carbohydrate, protein and fat intake, (6) whether a diet plan was followed (yes or no), (7) whether there was daily whey protein ingestion, (8) whether post-training carbohydrate intake was > 0.5 g/kg, and (9) whether carbohydrate intake throughout the day was > 4.0 g/kg.
With regards to sleeping patterns, evaluation included the following aspects: (1) self-reported sleep quality (zero to ten; where zero = awful and ten = great), (2) mean duration of sleeping time, (3) whether there was difficulty falling sleep, (4) whether waking up too early and unable to sleep again, and (5) whether waking up more than two times during the night.
For the evaluation of the social aspects, we asked (1) whether participants attended work or study besides the professional training sessions, if so, (2) how many hours per day they attended to the professional activities besides the training periods, and (3) their self-reported libido, from zero to ten (zero = no sex drive; ten = astonishing sex drive), compared to 1 year before, during the training periods.
With regards to the psychological characteristics, we employed the Profile of Mood States (POMS) questionnaire with the overall and specific mood scales: (1) total score (from −32 to +200; where −32 is the best score and +200 the worst score), (2) anger (from 0 to 48), (3) confusion (from 0 to 28), (4) depression (from 0 to 60), (45 fatigue (from 0 to 28), (6) tension (from 0 to 36), and (7) vigor (from 0 to 32; vigor score is counted as negative for the total POMS score) subscales. In a different moment of the interview, we also evaluated specific self-reported feelings of (8) general well-being, (9) friendly, (10) worthless, (11) miserable, (12) helpful, (13) bad-tempered, (14) guilty, (15) unworthy, (16) peeved, (17) cheerful, (18) sad, and (19) fatigue [from zero (not fatigued at all) to ten (extremely fatigued)].
The POMS questionnaire and the specific feeling questions were performed by only one author (FAC), in an impartial way, with a constant voice and standardized words of each question in order to prevent “faking good” in ATL and “faking bad” in healthy and OTS-affected athletes, respectively. The RESTQ questionnaire, also used to evaluate athletes, although not validated for non-physically active individual, was not employed, once NPAC were also evaluated as a second group control.
Basal Tests
Between 36 and 48 h after the last training session (in the case of the groups of athletes), we collected basal fasting levels of the following parameters: CRP; ESR; creatinine; hematocrit, medium corpuscular volume, and numbers of neutrophils, lymphocytes, eosinophils, and platelets (automated assays); CK; ferritin; high-density lipoprotein-cholesterol and triglycerides (calorimetric enzymatic assays) and low-density lipoprotein-cholesterol (Friedewald equation); serum lactate (enzymatic assays); serum total testosterone; estradiol (chemiluminescence assay); serum IGF-1 (chemiluminescence assay); nocturnal 12-h urinary catecholamines and metanephrines (calorimetric enzymatic assays); serum free thyronine (fT3; electrochemiluminescence assay); and serum TSH (electrochemiluminescence assay).
We then calculated the testosterone-to-estradiol, testosterone-to-cortisol, catecholamines-to-metanephrines, neutrophil-to-lymphocyte, and platelet-to-lymphocyte ratios, and compared them between the groups.
Hormonal Functional Tests
The CST, ITT, and SCR were performed in all participants, in a specific sequence.
Cosyntropin stimulation test (CST)
In the first day, we performed a stimulation test with a high doses (250 μg) of cosyntropin, a synthetic adrenocorticotropic hormone (ACTH), in order to hormonal responsiveness of the adrenal glands.
For the CST, at 8.00 a.m. (after 30-min resting and 8-h fasting) blood was collected (time 0) from the antecubital vein of the participants for serum cortisol. Immediately, 250 μg of cosyntropin was infused intravenously, slowly (during 30 s), and blood was collected at 30 min (time 1) and 60 min (time 2) for the analysis of the cortisol increase, in absolute levels [μg/dL], in response to a synthetic ACTH.
Insulin tolerance test (ITT)
Forty-eight hours after the CST, we then performed an ITT, to evaluate the integrity of the HPA, GH, and prolactin axes, once a normal response required absolute unaltered functions in all levels (hypothalamus, pituitary, and adrenals or other glands) of the axes. This is an intrinsic and independent test of the hormonal responsiveness, without interferences from external signaling or systems.
Participants followed the same protocol of at least 8-h fasting, arrival time before 7.30 a.m. and a 30- resting period prior to the beginning of the ITT. Although participants had signed the written consent and were fully aware of the risks of an ITT, before the beginning of the ITT we reminded them of the potential side effects derived from a state of hypoglycemia purposely induced by the test. After agreeing, blood was collected (time 0), and a dose of 0.1 IU/kg of regular insulin was infused in bolus. When hypoglycemia was detected, blood was collected (time 1—during hypoglycemia), 10 mL of 50% glucose solution was given intravenously, and high-glycemic index food was offered ad libitum (fat free ice-creams, Diletto, São Paulo, Brazil), blood was finally sampled again, 30 min (time 2) and 60 min (time 3) after the hypoglycemic episode.
The criteria for the detection of the hypoglycemia for the collect of the blood at time 1 was: (1) Asymptomatic hypoglycemia, when capillary glucose was below 30 mg/dL; (2) Moderate-to-intense adrenergic (cold sweating, shakiness, pallor, heart palpitations) and/or neuroglycopenic (mood changes, unrest, sleepiness) symptoms (a score of 5–10, from a zero to ten scale), regardless of the glucose levels; and (3) Capillary glucose below 45 mg/dL associated with any adrenergic or neuroglycopenic symptom.
Serum glucose (mg/dL), cortisol (μg/dL), ACTH (pg/mL), GH (μg/L), and prolactin (ng/mL) were collected at all times. During the ITT, time-to-hypoglycemia (minutes since the insulin infusion), and level of intensity of adrenergic and neuroglycopenic symptoms (zero to ten, self-reported) were also evaluated during the ITT. Absolute increase of cortisol, prolactin, GH, and ACTH, as well as the ACTH/cortisol ratio at all times were calculated. Among these hormones, we adjusted GH for body composition, since GH release is negatively influenced by body fat.
Given the actual risk of ITT-induced severe hypoglycemia (loss of consciousness), three doses of subcutaneous glucagon (GlucaGen HypoKit, 1 μg, NovoNordisk), syringes containing 20 mL of 50% glucose solution and an automated external defibrillator (AED) were available.
Salivary cortisol rhythm (SCR)
Between 2 and 7 days after the ITT, we collected the SCR, including the collect of the saliva at the awakening moment, at 30 min after awakening, at 4 and at 11 p.m. which were collected by the participants themselves, using laboratory kits provided by the researcher (FAC). Specific recommendations for the self-collect of the samples were provided.
All hormones from the functional tests were analyzed by specific electrochemiluminescence assays using specific commercial kits (Roche), while serum glucose was analyzed by an enzymatic assay of hexokinase.
All biochemical data were determined using standardized commercial assay kits ((18–21), https://osf.io/bhpq9). The inter- and intra-assay coefficients of variability were lower than 3.5 and 3%, respectively.
Body Composition and Metabolism
On a different day from the CST, ITT, or CST, previously scheduled, and after at least 24 h of the last training session (for OTS and ATL), we performed the evaluation of body composition using a gold-standard air-displacement pletimosgraph (Bod Pod, CosMed, USA) for analysis of body fat in terms of weight (kg) and percentage (%), and a validated and standardized electrical bioimpedance scale (InBody770, Biospace, South Korea) for analysis of visceral fat (%), muscle mass (kg), percentage of lean mass (%), body water (liters), percentage of body water (%), and percentage of extracellular water (%).
We then measured chest, biceps, and waist circumferences using a standardized and highly accurate pro-body- scanner and (Styku, USA). An indirect calorimetry (Spirostik, Geratherm Respiratory, Germany) was performed to evaluate basal metabolic rate (BMR) (kcal/day), the measured-to-predicted BMR ratio (%), after adjustments for age, weight, height and sex, and fat oxidation in relation to total metabolic rate (%).
Selection of the Markers for the Analysis of Associations, Predictions, and Correlations Between Markers
We initially excluded 48 of the 117 markers present in the EROS study, by excluding those that were intrinsically linked to other parameters (seven markers), did not determine diagnoses or status (16 markers), were qualitative indices (nine markers), markers that did not provide additional independent data (two markers), markers that were not the behavioral consequences of exercise (four markers), and invalid and/or unsubstantiated data (nine markers) (Table 1). We then selected the 38 from the 69 remaining markers that yielded significant differences between the two groups of athletes: OTS-affected athletes and healthy athletes (34 markers), or that were significantly different between these groups and sedentary controls (p < 0.05) with trends to be significantly different between healthy and OTS-affected athletes (p < 0.1) (four markers).
Statistical Analysis
We used multivariate linear regression to analyze all possible combinations of the 38 parameters that were evaluated in the EROS study (18–21). The intent was to identify: (1) clinical or biochemical markers (including hormonal, metabolic, and body metabolism and composition markers) as independent predictors of other markers and (2) strong linear correlations among the parameters evaluated in the EROS study (18–21). As the identification of triggers and the influence of OTS were not evaluated in the present study, they were excluded from the analyses.
We used multivariate linear regression with a removal criterion of p > 0.01. The standardized residual variables of the last model were examined for normality and homoscedasticity. The cut-off for the presence of multicollinearity was a tolerance index of 0.403 for the variables in the last model. A p-value < 0.05 was considered statistically significant for independent predictors, and p < 0.01 for linear correlations (with >0.40 correlation coefficient), which we considered to unveil moderate-to-strong correlations.
Although r > 0.4 is generally considered to be of moderate association, there is no rule or universally accepted sizes of correlation to be considered as weak, moderate or strong. Since we studied entirely different biological aspects, and each of these aspects is extensively influenced by a large number of different predictors from different natures, it is unlikely to find a single linear correlation > 0.5 (> −0.5), since each parameter tends to be driven by multiple factors. Hence, in this particular case, according to the literature, a correlation > 0.4 is sufficient to be considered as a strong correlation (25–27), or at least moderate-to-strong.
The p-value for the linear correlations was lower and partial correlations were not considered to avoid incidental misinterpretative correlations. Analyses were performed using SAS 9.4 (SAS Institute, Inc., Cary, NC, USA).
Parameters that were independently influenced by OTS, as published in the EROS-DISRUPTORS study (24), were adjusted according to the level of influence of OTS, in order to homogenize the groups of athletes. The biological behaviors that were modified by the presence of OTS include: (1) cortisol 30 min after hypoglycemia, in response to an ITT (26.1% of influence by OTS); (2) cortisol increase during ITT (22.0%); (3) GH 30 min after hypoglycemia, in response to an ITT (23.0%); (4) testosterone-to-estradiol (T:E) ratio (30.7%); (5) neutrophils (13.8%); (6) neutrophil-to-lymphocyte ratio (13.6%) (7) Profile of Mood States (POMS) vigor subscale (83.6%); (8) POMS fatigue subscale (85.7%); (9) POMS tension subscale (42.8%); (10) muscle mass (33.7%); (11) body water (50.5%), and (12) visceral fat (38.2%).
Those parameters that were not modified by the presence of OTS did not require adjustments according to the population (if OTS-affected or if healthy athletes), since these markers behaved independently from OTS.
Correlations that were unlikely to have any biological plausibility were excluded.
Further information on the material, methods, individualized results, and the raw data are provided at a repository (https://osf.io/bhpq9/).
Results
Primary Results
All sub-groups had similar age, BMI, and training patterns. As per selection criteria, all 34 parameters were significantly different between OTS-affected and healthy athletes. The primary results of these markers are detailed in Table 2.
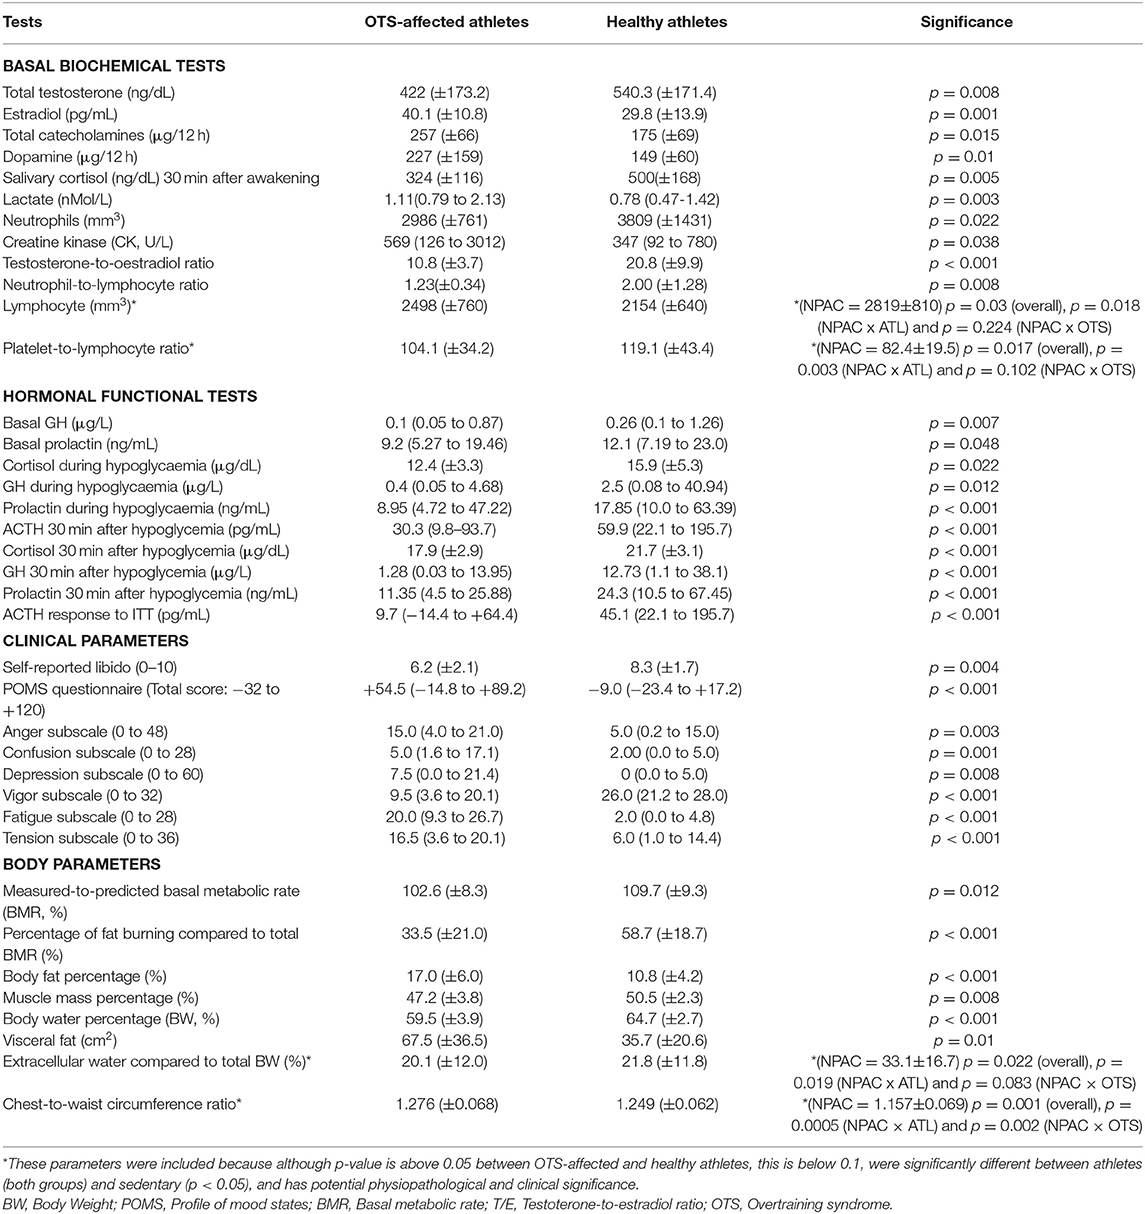
Table 2. Primary results of the markers selected for the present analysis.
From the primary findings, further statistical analyses were employed, including the analyses for predictions and linear correlations, which are presented in Table 3 and Figure 3 [when >0.40 (p < 0.01)], respectively.
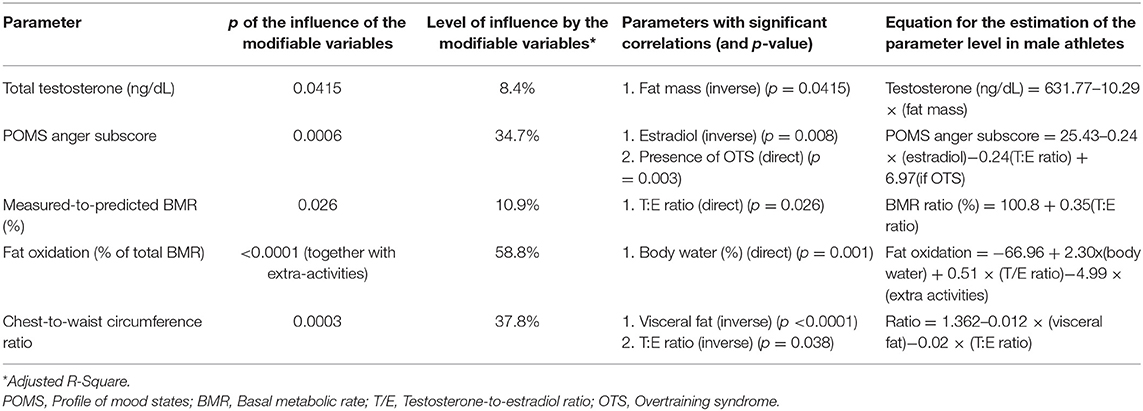
Table 3. Clinical or biochemical parameters as independent predictors of other parameters (multivariate linear regression analysis).
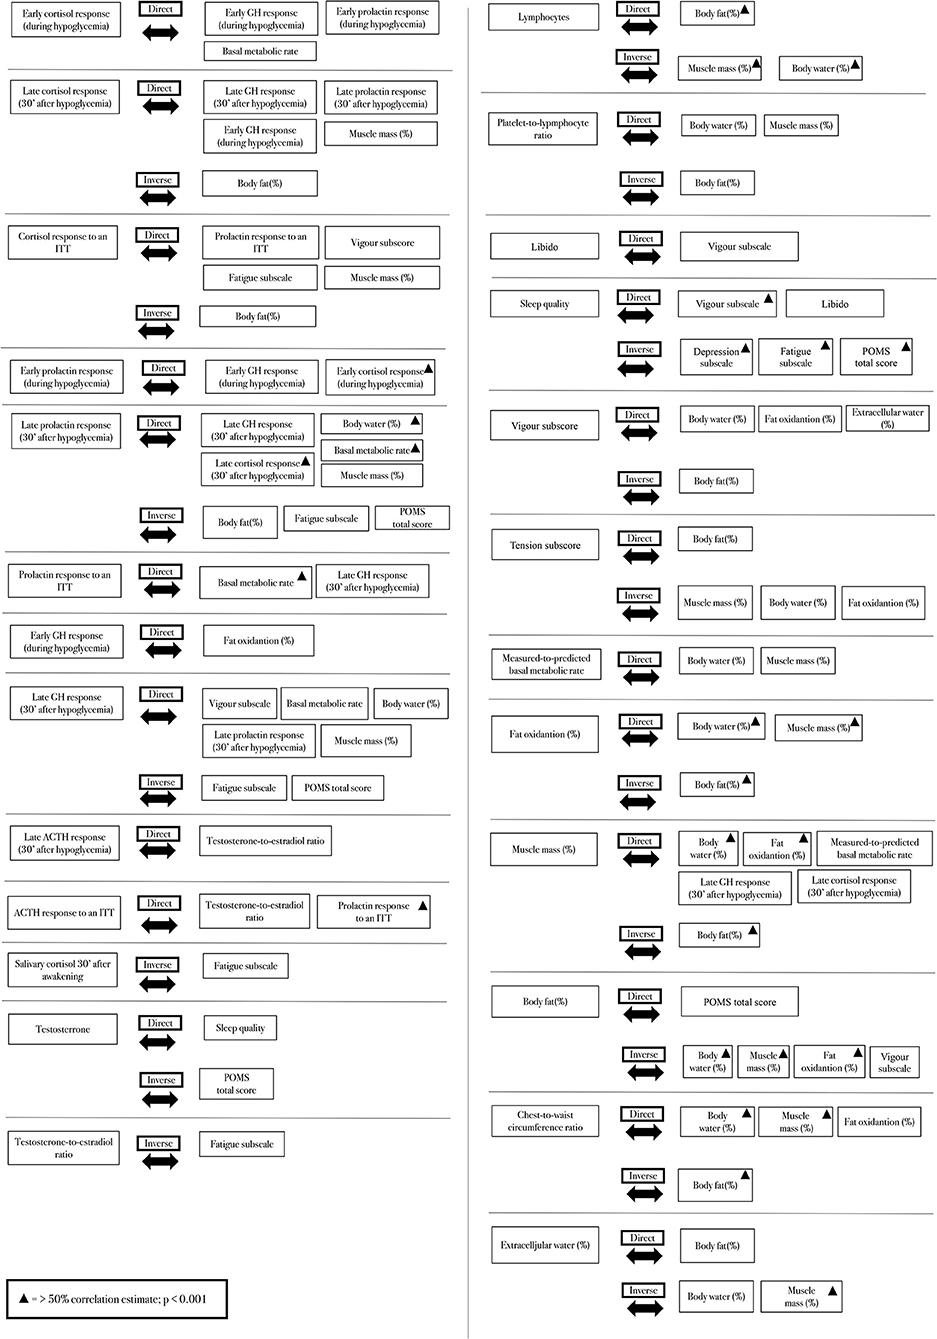
Figure 3. Strict correlations (>0.40) between clinical, hormonal, psychological, and metabolic parameters.
Independent Predictors of Clinical, Metabolic, and Biochemical Biomarkers
None of the hormonal responses to the CST of the adrenal glands or the ITT predicted or was predicted by any of the other clinical or biochemical markers.
Conversely, among the basal hormones, the testosterone-to-estradiol (T:E) ratio, identified in the EROS study as a better predictor of performance and overall status than total testosterone or estradiol alone (21), positively predicted the measured-to-predicted BMR ratio (Figures 4A,B), as well as the chest-to-waist circumference ratio. Total testosterone was inversely predicted by fat mass (Figures 4C,D), and estradiol inversely predicted anger, both fat mass and anger mood were also influenced by the presence of OTS (24).
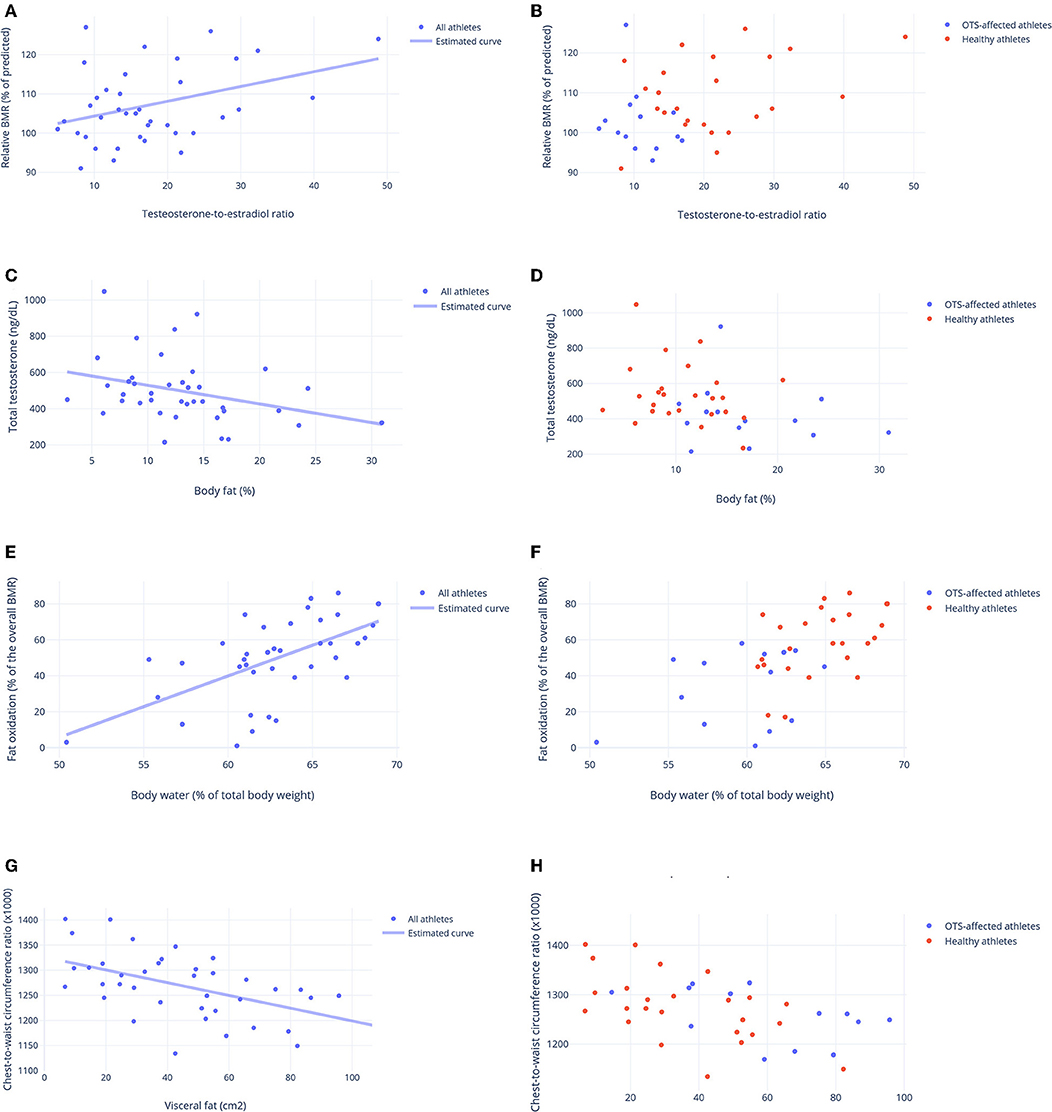
Figure 4. Biological predictors of other clinical, metabolic and biochemical parameters. (A,B) Testosterone-to-estradiol (T:E) ratio as a predictor of basal metabolic ratio (BMR) (relative to the predicted BMR, in %). Estimated equation: BMR ratio (%) = 100.8 + 0.35(T:E ratio)–r = 0.33. (C,D) Body fat (%) as a predictor of total testosterone (ng/dL) Estimated equation: Testosterone (ng/dL) = 631.77–10.29 × (fat mass-%)–r = 0.29. (E,F) Level of hydration (body water, in % of body weight) as a predictor of fat oxidation (% of total BMR) Estimated equation: Fat oxidation = −66.96 + 2.30 × (body water) + 0.51 × (T/E ratio)−4.99 × (extra activities)–r = 0.77. (G,H) Visceral fat (cm2) as a predictor of chest-to-waist circumference ratio. Estimated equation: Ratio = 1.362–0.012 × (visceral fat)−0.02 × (T:E ratio)–r = 0.62. (A,C,E,G) Estimated curve for all athletes, adjusted for OTS, when needed. (B,D,F,H) Results for athletes of OTS and healthy groups. Each point represents the result of one athlete.
Body water content positively predicted fat oxidation (Figures 4E,F) and chest-to-waist circumference was inversely predicted by visceral fat (in addition to the T:E ratio) (Figures 4G,H), which was also predicted by OTS (24). None of the other psychological parameters, muscle mass, other biochemical parameters, or SCR independently predicted or were predicted by any of the other factors evaluated in this study.
Markers not listed in Table 3 were not independent predictors of other clinical or biochemical behaviors.
Linear Correlations
Although none of the hormonal responses to the ITT predicted or was predicted by other parameters, both early and late growth hormone (GH), cortisol, and prolactin responses to the ITT were similar and had strong correlations (Figures 5A–F). These hormonal responses were positively correlated with vigor, fat oxidation, the predicted-to-measured BMR ratio, and muscle mass, and they were inversely correlated with fatigue and fat mass. The correlations between late prolactin response to the ITT (30 min after hypoglycemia) and relative BMR (% of predicted), and between late cortisol response to the ITT (30 min after hypoglycemia) and body fat are shown in Figures 6A,B, respectively.
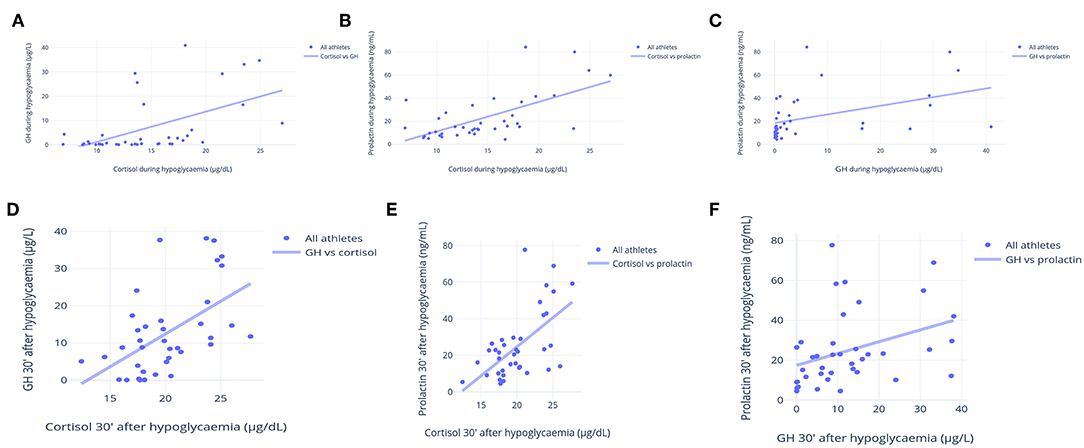
Figure 5. Correlations between cortisol, GH and prolactin responses to an insulin tolerance test (ITT). (A) Early cortisol (μg/dL) and GH (μg/L) responses to ITT (during hypoglycemia) (R = 0.72). (B) Early cortisol (μg/dL) and prolactin (ng/mL) responses to ITT (during hypoglycemia) (R = 0.80). (C) Early GH (μg/L) and prolactin (ng/mL) responses to ITT (during hypoglycemia) (R = 0.69). (D) Late cortisol (μg/dL) and GH (μg/L) responses to ITT (during hypoglycemia) (R = 0.77). (E) Late cortisol (μg/dL) and prolactin (ng/mL) responses to ITT (during hypoglycemia) (R = 0.76). (F) Late GH (μg/L) and prolactin (ng/mL) responses to ITT (during hypoglycemia) (R = 0.69). Each point represents the result of one athlete.
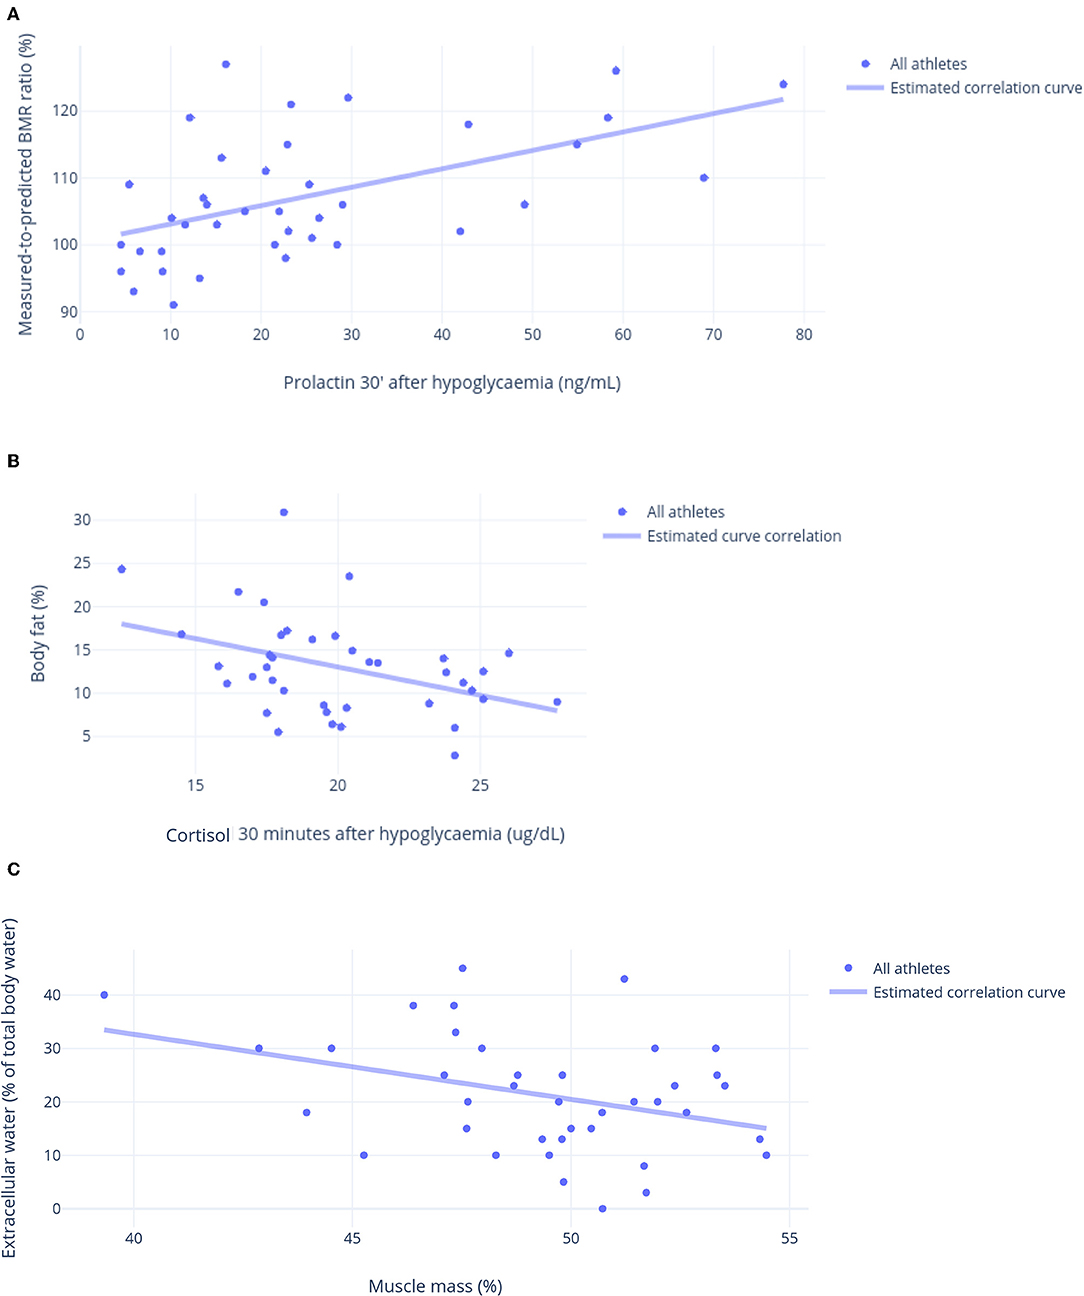
Figure 6. Other linear correlations. (A) Prolactin 30 min after hypoglycemia in response to an insulin tolerance test (ITT) (ng/mL) and relative basal metabolic ratio (% of predicted) (R = 0.71). (B) Cortisol 30 min after hypoglycemia in response to an insulin tolerance test (ITT) (μg/dL) and body fat (%) (R = 0.74). (C) Muscle mass (%) and extracellular water (% of body water) (R = 0.72).
Salivary cortisol 30 min after awakening and the T:E ratio were inversely correlated with fatigue, whereas total testosterone was inversely correlated with the Profile of Mood States (POMS) total score (a negative score indicates a better mood), and it was directly correlated with sleep quality. Immunologic parameters were correlated with body composition: body fat was directly correlated with lymphocytes and inversely correlated with the platelet-to-lymphocyte ratio, whereas body water and muscle mass were correlated with these variables in the opposite directions.
Libido and sleep quality were directly correlated with vigor, while sleep quality was directly correlated with libido and inversely correlated with depression, fatigue, and overall mood. Vigor was directly correlated with body water and fat oxidation, and inversely correlated with body fat; conversely, tension was inversely correlated with body water, muscle mass, and fat oxidation, and directly correlated with body fat.
The predicted-to-measured BMR ratio and fat oxidation had a stronger positive correlation with muscle mass and body water, whereas an inverse correlation was found between fat oxidation and body fat. Even though body fat and muscle mass were strongly and inversely correlated (r >-0.95), they were not always correlated in the opposite direction. In addition to fat oxidation, body water was the only parameter directly correlated with muscle mass, and inversely correlated with body fat. Although muscle mass was directly correlated with late GH and cortisol responses to the ITT, extracellular water (i.e., the presence of edema) and body fat were directly correlated with the POMS total score and inversely correlated with vigor.
Though the chest-to-waist circumference ratio was directly correlated with body water, muscle mass, and fat oxidation, and inversely correlated with body fat, extracellular water was correlated with these variables in the opposite directions (Figure 6C). The parameters that are not mentioned in this report failed to show strong correlations (>0.40).
Linear correlations not presented in Figure 3 were weaker than <0.40 (p > 0.01).
Discussion
The EROS Study and the Present Analysis
The EROS study elucidated some of the physiological adaptive changes that occur in healthy athletes and how these changes are disrupted in OTS (18–24), as this study addressed the major methodological issues in studies of healthy and OTS-affected athletes, using concurrent comparisons between sex-, age-, and BMI-matched healthy athletes and non-athletes, and simultaneous comparisons of a broad range of aspects within the same participants. The prior results for the two groups analyzed here (healthy and OTS-affected athletes) showed multiple clinical, metabolic, and biochemical conditioning processes in the healthy athletes and a loss of 59.1% of these conditioning processes in the OTS-affected athletes (23), which was referred to as “a mix of paradoxical deconditioning processes.”
The concomitant analysis of different biochemical, clinical, and metabolic aspects in the EROS study allowed us to explore the previously uninvestigated interactions, correlations, predictions, and synergistic actions between these parameters, using multivariate regression and other statistical techniques. Therefore, the EROS-CORRELATIONS study analyzed two major sorts of interactions among basal and stimulated hormonal, metabolic, immune, and muscular biomarkers, body composition and metabolism, and psychological patterns: independent predictors and linear correlations, as well as their mechanisms and outcomes.
Noteworthy, some markers previously hypothesized to be potential biomarkers for OTS yielded similar results between OTS and healthy athletes, including the testosterone-to-cortisol ratio (21) and the insulin growth factor-1 (IGF-1) (21). These markers also failed to demonstrate any sort of relationship with other markers, as shown in the raw statistical analysis (https://osf.io/bhpq9).
Biochemical Responses as Predictors of Other Biochemical and Clinical Behaviors
Although fat mass is considered an independent suppressor of the GH response (28), this was not confirmed by our results, in that the body fat of male athletes was not important for the GH response. Although body fat did not have a negative effect on GH release, it reduced testosterone levels; however, the reduction was not due to increased aromatase activity, as the T:E ratio was not reduced by body fat or affected by any of the other markers. Conversely, the T:E ratio positively predicted the measured-to-predicted BMR ratio while neither testosterone nor estradiol had the same effect; the T:E ratio also predicted the chest-to-waist circumference ratio the measure of the torso's “V-shape.” Our findings underscore the importance of evaluating the ratios of different hormones for the prediction of metabolic outcomes. Although an increase in estradiol without a concurrent analysis of testosterone does not necessarily suggest either a beneficial or a harmful outcome, in this study, testosterone level did not predict any of the parameters, such as body metabolism or composition, without the simultaneous analysis of estradiol. These findings are consistent with studies suggesting a simultaneous increase in testosterone and estradiol has synergistic positive effects, which include metabolic parameters (29–33). Conversely, fat mass reduced testosterone levels, which can be justified by exposure of testosterone to a more intense aromatase enzyme under higher body fat (31, 32).
Although estradiol alone did not predict body metabolism or composition parameters, it independently predicted lower anger. Although estradiol receptors are widely distributed in the brain (29, 33, 34), their effects on mood in males are still unclear. Body water content was the only predictor of fat oxidation, which supports the premise that good hydration status, particularly within the cells, is a key requirement for proper fat oxidation, as water is part of this pathway (35–37), while dehydration slightly impaired fat burning.
Linear Correlations
Strong inter-correlations were found among GH, prolactin, and cortisol for early and late responses to stimulation tests. Therefore, it was impossible to distinguish levels of responsiveness among the corticotropic, somatotropic, and lactotropic axes, as these hormones responded simultaneously and equally, which indicates a common, ubiquitous, and enhanced hypothalamic responsiveness in athletes, compared to sedentary controls. Although ACTH was not strictly correlated with the other hormones, its short half-life precluded drawing conclusions about its correlation with other hormones.
Late hormonal responses (30 min after hypoglycemia) were directly correlated with energy levels (higher vigor and lower fatigue levels), indicating a possible role for sustained hormonal release in response to stress in the prevention of burnout in chronically stressful situations. They were also correlated with increased muscle mass, lower body fat, and better hydration, without a distinction between the specific effects of each hormonal response (cortisol, GH, and prolactin). Acute cortisol and GH release promote fat oxidation and lipolysis, but chronic hypercortisolism may lead to the accumulation of visceral and central fat, even when it is mild.
Overall, the hormonal conditioning process that was found to occur in athletes, and identified by enhanced GH, prolactin and cortisol responses to exercise-independent stimulation tests, when compared to sex-, age-, and BMI-matched healthy sedentary controls, and adjusted for body composition, may be one of the underlying reasons for decreased extracellular water, decreased anger, fatigue, depression, confusion mood states, and indirect account for reduced fat, increased muscle, and better hydration (38). Indeed, under OTS, in which the optimization of the hormonal responses is lost (24), the concurrent benefits in response to intense exercise are also lost.
The inverse correlation between salivary cortisol 30 min after awakening and fatigue supported this parameter and the cortisol awakening response as markers of fatigue, as previously demonstrated by different studies (39–42). Indeed, cortisol awakening response (CAR), an indirect marker of cortisol 30 min after awakening, has been extensively used as a marker of fatigue (43–46). Nonetheless, they were not independent predictors of fatigue when analyzed using multivariate regression. Therefore, a lower increase in cortisol level between awakening and 30 min after awakening is unlikely to be the primary cause of fatigue, but rather a possible consequence of poor sleep quality leading to an impaired cortisol awakening response (47), with a blunted cortisol increase 30 min after awakening and a concurrent decrease in energy level (48–50), as well as other disruptions of the HPA axis (50). Thus, conclusions regarding adrenal function using these tools are inappropriate (51).
Testosterone level was directly correlated with sleep quality. Although this does not indicate a causal relationship, it supports the role of sleep quality in testosterone production because its' physiological peak also occurs in the early morning hours, which is affected by sleep quality (52–54).
The T:E ratio was also inversely correlated with fatigue, which implies that the ratio was a better predictor of energy level than either testosterone or estradiol alone. While estradiol alone was not linked to fatigue, its pathological increase, from an exacerbation of aromatase activity and consequent reduction of testosterone, may have increased fatigue, in accordance with the literature (32).
In the EROS study, although sleep duration did not have a role in psychological function, unlike previous studies, that strongly correlated sleep duration with mood states (49, 55, 56). Sleep quality was strongly correlated with better psychological outcomes, including lower depression and fatigue, and higher vigor, indicating that sleep quality led to a global improvement in mood, similarly to what has been unanimously observed (49, 55, 57–59). We speculate that sleep duration was not demonstrated to a major factor of mood states or any other characteristic in athletes because in higher quality sleep duration tends to play a less important role (60, 61).
Other moderate-to-strong linear correlations were identified. Body water was inversely correlated with lymphocyte and directly correlated with platelet-to-lymphocyte ratio. However, little data has been identified in the literature, specifically for these correlations (62–69), since immune function and hydration has been more assessed in athletes, in response to exercises (67–69). Specific absolute and lymphocytes subpopulation counting have been assessed in athletes and in patients at high cardiovascular risk, with indirect but inconsistent correlations between lymphocytes and hydration status (70–75). Platelet-to-lymphocyte ratio has been proposed as an inflammatory marker of cardiovascular risk, acute pancreatitis and sarcopenia (76–80), with some speculations that higher ratio could indicate better hydration status, similarly to the direct linear correlation that we found. This occurs perhaps due to a direct correlation between platelet count and total body water (65, 66, 81), although this associations remain controversial (64–68).
Associations Between Improved Mood States and Body Composition and Metabolism
Vigor was directly correlated with better hydration, better fat oxidation, and less body fat, whereas libido was exclusively correlated with vigor, indicating improved overall body metabolism and composition, hydration, and fat oxidation. Since vigor has also been correlated with enhanced hormonal responses to stimulations and better sleep quality (24) in the present study, both of which have also been correlated with improved body metabolism and composition patterns, we hypothesize that vigor is an additional consequence of hormonal response and sleep quality, similarly to body composition and metabolism, and has no direct correlations of causal relationship with these parameters.
Conversely, while other moods were not significantly correlated with body metabolism or composition, tension had correlations in the opposite direction than those found for vigor. Oppositely to vigor, which unlikely leads to changes in hormonal responses, tension is likely the mood mostly correlated with disrupted hormonal responses (50). Once in our study tension was the mood state most strictly predicted by sleep quality, and that Impaired sleep independently leads to impaired muscle recovery (62), this may justify the correlations between vigor (positive) and tension (negative) and body muscle identified by the EROS study.
Also, although oxidative stress leads to muscle hypertrophy, chronic stress mediated by the HPA axis, leads to the opposite direction (82–85). Indeed, alterationsof the HPA axis disrupt the metabolism of the muscle tissue, toward a negative balance between protein generation and degradation, eventually leading to muscle mass loss (86–89). Conversely, impaired HPA axis also leads to concurrent independent body fat gain (84), as multiple mechanisms mediated by the HPA axis induce increase of fat cell size and induce a pro-inflammatory status irrespective of caloric balance, proportion of macronutrient intake, and sleeping patterns, since a post-receptor modification from cortisone to cortisol by enhanced activity of 11beta-hydroxysteroid dehydrogenase type 1(11beta-HSD1) (90, 91). In addition,disruption of the muscle metabolism, herein induced by altered cortisol regulation, has also demonstrated to have direct effects on the metabolism and accumulation of fat (92). Since the HPA axis is chronically and more severely enhanced by high tension levels, more than any other mood state, it would be expected, from this perspective, to find negative correlations between tension levels and body composition. Indeed, higher tension, which have been correlated with impaired hydration and fat oxidation, muscle catabolism, and increased body fat, are possibly due to the harmful metabolic effects of the chronic stimulation of the HPA axis (82–85), although direct effects of tension, depression, and anger on increased body fat has been observed (86).
In additional, overall mood states can hypothetically be indirect signals of hydration status, although direct relationships are unlikely.
Hydration as a Key Characteristic for Athletes
Level of hydration is a key characteristic for the overall health status in humans, since water is a major participant of multiple reactions of metabolism and thermoregulation (37). Hydration, measured by the % of body water in relation to total body weight, was associated with multiple parameters (20, 22, 34), including both characteristics of body metabolism(the predicted-to-measured BMR ratio and fat oxidation), which is reasonable since water boosts fat metabolism (35, 36, 93, 94, 96) and overall metabolic rate (35, 94, 96–99), being considered as a potential thermogenic (35, 36, 93, 94, 96–98).
The need for a minimum amount of available water content for fat oxidation in catabolic states is conceivable in the context of a direct correlation between hydration and fat oxidation (35, 96). Conversely, the amount of body fat was inversely correlated with fat oxidation, which is expected, once more body fat may be a consequence of less fat utilization as source of energy, even under glycogen- and glucose-depleted circumstances, as observed by some studies (100, 101). Despite the previous reports on the correlation between body fat and fat oxidation, it is still unclear whether a larger fat mass resulted from reduced fat oxidation, or if a greater fat mass impaired fat oxidation through a non-classical inflammatory response that is enhanced in adipocytes when these are enlarged. Finally, since dehydration probably leads to lower fat oxidation, body water was expectedly found to be inversely correlated with body fat and the chest-to-waist circumference ratio.
Similar to the correlation between fat oxidation and body water, the measured-to-predicted BMR ratio was positively correlated with hydration status and muscle mass, which reinforces the extensive descriptions on the literature that body water content, hydration status, and muscle mass are the major components of the metabolic rate (94, 96–99, 102–104). Moreover, hydration has been correlated with vigor levels and other mood states at lesser extent, which is supported by the literature (105).
In regards with the location of the water—whether intra- or extracellular—extracellular water accounts for ~40% of total body water (106), which was similar to that observed in the healthy sedentary of the EROS study. However, in healthy athletes extracellular water was shown to be reduced, possibly as a mechanism of facilitation for the optimization of intracellular metabolic pathways. Among which most reactions require water to occur. In the EROS study, in the groups of athletes ~80% of the water was located intracellularly, which can be considered as an improvement of the water balance for metabolic purposes (107). Conversely, fat mass is inversely correlated with relative and absolute intracellular water, and consequently lower body water. Some authors speculate that this is possibly due to the fact that enlarged fat cells tend to become more hydrophobic and to contain less water. However, this is still a hypothesis to be further demonstrated.
We observed an inverse correlation between hydration status and extracellular water, i.e., better hydration was correlated with less edema, indicating that the amount of water consumed may redirect water toward inside cells (the preferred space), rather than interstitially (third space; extracellular water). However, external factors such as disturbed hormonal secretion, excessive sodium intake, and hypercaloric diets may lead to excessive extracellular water, which becomes the primary cause of dehydration: resulted from shifts in water compartment redistribution (106, 108). Indeed, dehydration may not only be a result from redistribution of water, but overall low water content can also induce further dehydration by its accumulation in the extracellular water, as a mechanism of protection against further water wasting, secondarily to vasopressin (ADH) and renin-angiotensin-aldosterone-system (RAAS) metabolism (109). In addition, interactions between water content, the RAAS, the HPA axis, the direct aldosterone actions and their relationship with chronic stress have been reported (105, 109).
In the EROS study, the major influences that drove the water destination were the metabolic environment, sleep quality (worse sleep leads to worse hydration and increased edema), the amount of muscle mass, eating patterns, and mood. Muscle mass was positively correlated with body water and it may have indirectly prevented edema, while body fat may have had the opposite effect, similarly to the observed in the literature (86, 98).
Implications of the Findings
The use of additional statistical techniques in this study facilitated the identification of independent predictors of linear correlations among clinical, metabolic, and biochemical parameters and other parameters, which has improved our understanding of hormonal and metabolic behaviors, and their multiple interactions and influences in athletes. They also yielded information to speculate on new potential markers and new understandings of current markers.
The summary of the findings and their possible implications are presented in Table 3. Hydration status, and, to a lesser extent, muscle mass, were the two major determinants of metabolic rate and fat oxidation (35, 93–99, 102–104). These results support the importance of adequate water intake and maintaining and building lean muscle for adequate metabolism and fat oxidation. The body fat effect on GH release was attenuated in athletes, while its effect on testosterone was maintained, suggesting that athletes with excessive body fat might not benefit from some of effects of exercise, which is a reason for sports professionals to have a good body shape.
Since the hormonal responses to an ITT were strictly correlated, i.e., the level of increase of GH, cortisol, ACTH, and prolactin was similar within each athlete (Figure 5), the level of hypothalamic responsiveness to stimulation seemed to be diffuse, rather than specific for certain axes. Energy levels were strongly correlated with hormonal status, including a prolonged optimization of hormonal responses and a better cortisol response to awakening, although a causal relationship was undefined. In addition to energy levels, better hormonal responses were correlated with better body composition, of which the causal relationship remains uncertain.
Sleep quality seemed to be the most important factor in mood, rather than any other factor, such as hormonal levels or eating patterns, which has been demonstrated to play an essential role on overall cognitive and psychological functions (REF), in accordance with our findings. The level of hydration was inversely correlated with edema and better hydration was linked to less edema, depending on the location of the water in the body, regulated by external factors rather than the amount of water intake.
Testosterone, Estradiol, and Testosterone-To-Estradiol (T:E) Ratio
Testosterone, estradiol, and their ratio (T:E ratio) had different roles and influences. While testosterone was inversely related to body fat, positively linked to sleep quality, and indirectly linked to improved psychological outcomes, alone, it did not predict any of the parameters. Conversely, estradiol unexpectedly predicted anger, because of its actions on the male brains of the athletes. The T:E ratio had the most important roles in body metabolism and composition, and was linked to energy level. Hence, the balance between testosterone and estradiol might be more important than either testosterone or estradiol alone. This is extensively supported by the literature, since the T:E ratio predicts multiple outcomes, including cardiovascular changes (29, 30), while many of the neuroprotective and psychological effects of estradiol in males are mediated by testosterone (32–34), which requires a balance between these hormones to obtain the health benefits. The unaltered balance is more precisely assessed by the T:E ratio, rather than each hormone alone.
The T:E ratio is a significant ratio that has a promising role in the evaluation of athletes. It was found to be a better predictor of metabolic and psychological parameters than either testosterone or estradiol alone, supporting the hypothesis that it is a potential novel parameter. We based this hypothesis on a new understanding of the role of estradiol in males, and identified two types of estradiol increase: (1) a physiological increase, secondary to an increase in testosterone, when high testosterone levels are maintained and (2) a pathological increase, caused by an aberrant exacerbation of aromatase activity, leading to a decrease in testosterone. We found the most appropriate way to differentiate these situations objectively was to examine the T:E ratio. This ratio indicates whether an increase in estradiol is followed by an increase in testosterone; it should remain unaffected in the case of a physiological increase. These data were supported by a recent study showing that increased estradiol benefitted males in terms of increasing their libido, muscle mass, and bone mass, and reducing their fat mass, but only when accompanied by increased testosterone levels (26–28), which occurs when increased estradiol is actually desirable and the T:E ratio is unaffected (29). Conversely, the estradiol increase that we identified as a marker of OTS was due to a pathological conversion from testosterone, indicated by a substantial decrease in the T:E ratio, which was most likely a response to an anti-anabolic environment. For practical purposes, the T:E ratio should be above 13.7:1 (21).
Summary of the Findings
The EROS-CORRELATIONS study demonstrated that testosterone was predicted by fat mass, estradiol predicted anger, and the T:E ratio predicted the measured-to-predicted BMR ratio and chest-to-waist circumference, while hydration status predicted fat oxidation. Early and late somatotropic, corticotropic, and lactotropic responses were strong and strongly correlated, showing a diffuse hypothalamic rather than axis-specific response to stimulation. Late hormonal responses to stimulations, increased cortisol after awakening, and the T:E ratio was correlated with energy level. Sleep quality was the major factor correlated with most of the study's psychological measures, while fat oxidation, hydration, muscle mass, and body fat were highly inter-correlated, and edema was inversely correlated with hydration and muscle mass, and directly correlated with fat mass. The most remarkable findings are described in Table 4.
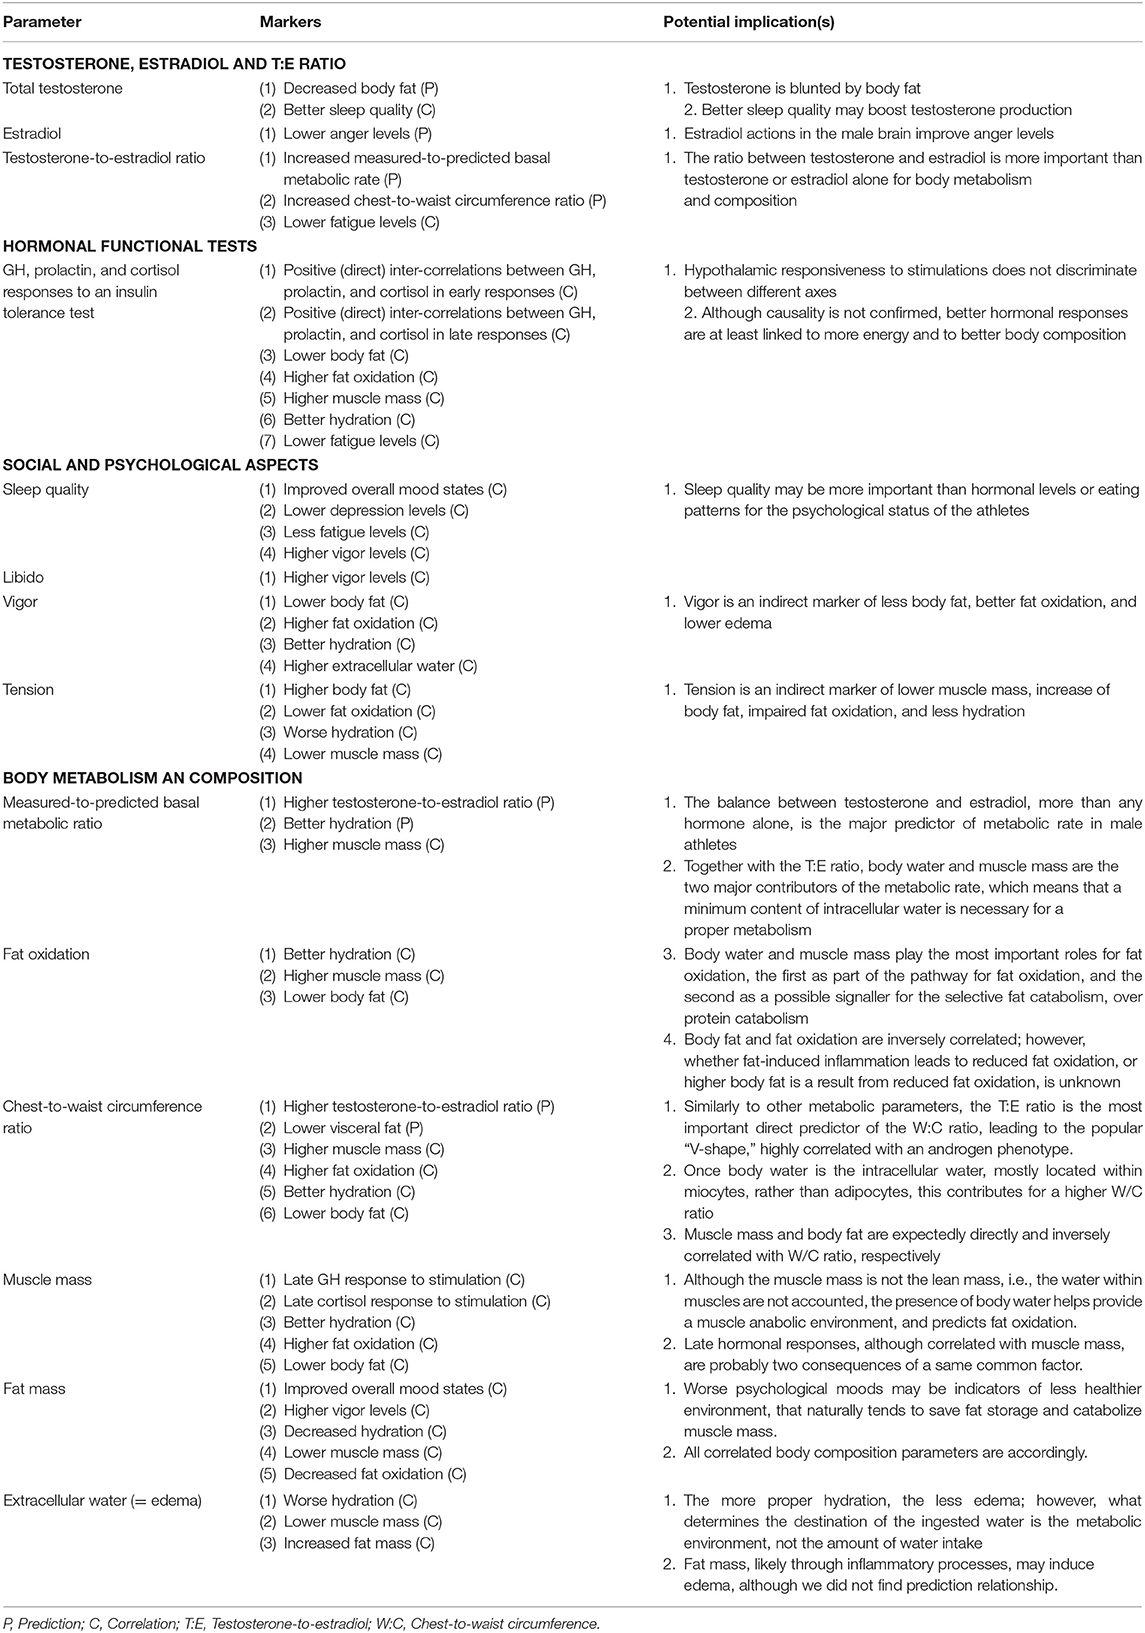
Table 4. Most remarkable findings of the EROS-CORRELATIONS study.
Limitations
The findings of the present study are valid only for male athletes that practice both endurance and strength sports, as basal hormone levels and responses to stimulations are highly sex-specific and may be sport-specific. Hence, different arms of the EROS study focused on purely strength, purely endurance, purely explosive, purely stop-and-go, and mixed sports, conducted with male and female participants, should provide data that are more specific. Given the unexpected findings regarding several hormones and other biochemical markers, we suggest additional parameters for further studies, including luteinizing hormone, follicle-stimulating hormone, sex hormone-binding globulin the tumor necrosis factor-alpha, interleukin-1 beta, lactate dehydrogenase (LDH), free thyroxin-4, and cortisol binding globulin. Longer stimulation tests, including thyrotrophic and gonadotrophic responses (given the unexpected response of the lactotropic axis), and an examination of the associations between exercise-dependent and exercise-independent tests should also be examined. Also, the estradiol levels in males may lose absolute precise using chemoiluminescence, compared to liquid chromatography mass spectrometry/tandem mass (LC/MS-MS/MS). However, the relative precision is highly accurate, which allows the in-between (pairwise) group comparisons as fully satisfactory (110–115).
Final Discussion
We found multiple correlations and predictions between clinical, hormonal, biochemical markers, that occurred as a web of influences, as multiple and multi-directional chain-reactions, that allowed us speculate on several new mechanisms to occur in response to sports. The identification of a complex web of interactions among many different aspects allowed us to hypothesize that sports performance results from a combination of hormonal, energy, and water availability, and psychological and muscular status The predictions, correlations, and interactions revealed in the present study show that further studies should not evaluate each aspect separately, as this is unlikely to provide answers to important questions.
Data Availability Statement
The datasets generated for this study are available on request to the corresponding author.
Ethics Statement
The studies involving human participants were reviewed and approved by Ethical committee of the Federal University of São Paulo (Approval Number: 1093965). The patients/participants provided their written informed consent to participate in this study.
Author Contributions
FC and CK developed the central idea of the present manuscript. FC performed the tests of the EROS study, compilated the data, analyzed the results, and participated in the discussions. CK actively participated in the discussion, supervised and reviewed the results, helped with the final version of the manuscript, and gave the last word before the submission. All authors have read and approved the manuscript.
Conflict of Interest
The authors declare that the research was conducted in the absence of any commercial or financial relationships that could be construed as a potential conflict of interest.
The handling editor is currently co-organizing a Research Topic with one of the authors FC and CK, and confirms the absence of any other collaboration.
Acknowledgments
We acknowledge the Department of Sports Medicine and the Division of Endocrinology, Department of Medicine, from the Federal University of São Paulo, DASA Laboratórios da América, and Corpometria Insitute.
References
1. Karjalainen JJ, Kiviniemi AM, Hautala AJ, Piira OP, Lepojärvi ES, Perkiömäki JS, et al. Effects of physical activity and exercise training on cardiovascular risk in coronary artery disease patients with and without type 2 diabetes. Diabetes Care. (2015) 38:706–15. doi: 10.2337/dc14-2216
2. Myers J, McAuley P, Lavie CJ, Despres JP, Arena R, Kokkinos P. Physical activity and cardiorespiratory fitness as major markers of cardiovascular risk: their independent and interwoven importance to health status. Prog Cardiovasc Dis. (2015) 57:306–14. doi: 10.1016/j.pcad.2014.09.011
3. McKenzie F McKenzie F, Biessy C, Ferrari P, Freisling H, Rinaldi S, et al. Healthy lifestyle and risk of cancer in the european prospective investigation into cancer and nutrition cohort study. Medicine. (2016) 95:e2850. doi: 10.1097/MD.0000000000002850
4. Zhao G, Li C, Ford ES, Fulton JE, Carlson SA, Okoro CA, et al. Leisure-time aerobic physical activity, muscle-strengthening activity and mortality risks among US adults: the NHANES linked mortality study. Br J Sports Med. (2014) 48:244–9. doi: 10.1136/bjsports-2013-092731
5. Carlson SA, Adams EK, Yang Z, Fulton JE. Percentage of deaths associated with inadequate physical activity in the United States. Prev Chronic Dis. (2018) 15:E38. doi: 10.5888/pcd18.170354
6. Loprinzi PD, Addoh O, Wong Sarver N, Espinoza I, Mann JR. Cross-sectional association of exercise, strengthening activities, and cardiorespiratory fitness on generalized anxiety, panic and depressive symptoms. Postgrad Med. (2017) 129:676–85. doi: 10.1080/00325481.2017.1336054
7. Machado S, Filho ASS, Wilbert M, Barbieri G, Almeida V, Gurgel A, et al. Physical exercise as stabilizer for alzheimer's disease cognitive decline: current status. Clin Pract Epidemiol Ment Health. (2017) 13:181–4. doi: 10.2174/1745017901713010181
8. Warburton DER, Bredin SSD. Health benefits of physical activity: a systematic review of current systematic reviews. Curr Opin Cardiol. (2017) 32:541–56. doi: 10.1097/HCO.0000000000000437
9. Maessen MF Eijsvogels TM, Stevens G, van Dijk AP, Hopman MT. Benefits of lifelong exercise training on left ventricular function after myocardial infarction. Eur J Prev Cardiol. (2017) 24:1856–66. doi: 10.1177/2047487317728765
10. Piepoli MF, Villani GQ. Lifestyle modification in secondary prevention. Eur J Prev Cardiol. (2017) 24(3_suppl):101–7. doi: 10.1177/2047487317703828
11. Porter C, Reidy PT, Bhattarai N, Sidossis LS, Rasmussen BB. Resistance exercise training alters mitochondrial function in human skeletal muscle. Med Sci Sports Exerc. (2015) 47:1922–31. doi: 10.1249/MSS.0000000000000605
12. Lindgren M, Alex C, Shapiro PA, McKinley PS, Brondolo EN, Myers MM, et al. Effects of aerobic conditioning on cardiovascular sympathetic response to and recovery from challenge. Psychophysiology. (2013) 50:963–73. doi: 10.1111/psyp.12078
13. Maughan RJ, Burke LM, Dvorak J, Larson-Meyer DE, Peeling P, Phillips SM, et al. IOC consensus statement: dietary supplements and the high-performance athlete. Br J Sports Med. (2018) 52:439–55. doi: 10.1136/bjsports-2018-099027
14. Chennaoui M, Arnal PJ, Sauvet F, Léger D. Sleep and exercise: a reciprocal issue? Sleep Med Rev. (2015) 20:59–72. doi: 10.1016/j.smrv.2014.06.008
15. Meeusen R, Duclos M, Foster C, European College of Sport Science, American College of Sports Medicine. Prevention, diagnosis, and treatment of the overtraining syndrome: joint consensus statement of the european college of sport science and the american college of sports medicine. Med Sci Sports Exerc. (2013) 45:186–205. doi: 10.1249/MSS.0b013e318279a10a
16. Kreher JB, Schwartz JB. Overtraining syndrome: a practical guide. Sports Health. (2012) 4:128–38. doi: 10.1177/1941738111434406
17. Rietjens GJ, Kuipers H, Adam JJ, Saris WH, van Breda E, van Hamont D, et al. Physiological, biochemical and psychological markers of strenuous training-induced fatigue. Int J Sports Med. (2005) 26:16–26. doi: 10.1055/s-2004-817914
18. Cadegiani FA, Kater CE. Body composition, metabolism, sleep, psychological and eating patterns of overtraining syndrome: results of the EROS study (EROS-PROFILE). J Sports Sci. (2018) 36:1902–10. doi: 10.1080/02640414.2018.1424498
19. Cadegiani FA, Kater CE. Hypothalamic-pituitary-adrenal (HPA) axis functioning in overtraining syndrome: findings from Endocrine and Metabolic Responses on Overtraining Syndrome (EROS) - EROS-HPA axis. Sports Med Open. (2017) 3:45. doi: 10.1186/s40798-017-0113-0
20. Cadegiani FA, Kater CE. Hormonal responses to a non-exercise stress test in athletes with overtraining syndrome: results from the Endocrine and metabolic Responses on Overtraining Syndrome (EROS) - EROS-STRESS. J Sci Med Sport. (2018) 21:648–53. doi: 10.1016/j.jsams.2017.10.033
21. Cadegiani FA, Kater CE. Basal hormones and biochemical markers as predictors of OTS: results from the Endocrine and metabolic Responses on Overtraining Syndrome (EROS) study - EROS-BASAL. J Athl Train. (2019) 54:906–14. doi: 10.4085/1062-6050-148-18
22. Cadegiani FA, Kater CE, Gazola M. Clinical and biochemical characteristics of high-intensity functional training (HIFT) and overtraining syndrome: findings from the EROS study (The EROS-HIFT). J Sports Sci. (2019) 3:1296–307. doi: 10.1080/02640414.2018.1555912
23. Cadegiani FA, Kater CE. Novel insights of overtraining syndrome discovered from the EROS study. BMJ Open Sport Exerc Med. (2019) 5:e000542. doi: 10.1136/bmjsem-2019-000542
24. Cadegiani FA, Kater CE. Novel causes and consequences of overtraining syndrome: the EROS-DISRUPTORS study. BMC Sports Sci Med Rehabil. (2019) 11:21. doi: 10.1186/s13102-019-0132-x
25. Shortell T. An Introduction to Data Analysis & Presentation. Available online at: http://www.shortell.org/book/chap18.html (accessed November 9, 2019).
26. McSeveny A, Conway R, Wilkes S, Smith M. Guideline for Interpreting Correlation Coefficient by Ith Phanny To accompany: International Mathematics For the Middle Year 5. Pearson Australia 2009 ITH PHANNY.
27. Moore DS, Notz WI, Flinger MA. The Basic Practice of Statistics, 6th Edn.. New York, NY: W. H. Freeman and Company (2013).
28. Rahim A, O'Neill P, Shalet SM. The effect of body composition on hexarelin-induced growth hormone release in normal elderly subjects. Clin Endocrinol. (1998) 49:659–64. doi: 10.1046/j.1365-2265.1998.00586.x
29. van Koeverden ID, de Bakker M, Haitjema S, van der Laan SW, de Vries JPM, Hoefer IE, et al. Testosterone to oestradiol ratio reflects systemic and plaque inflammation and predicts future cardiovascular events in men with severe atherosclerosis. Cardiovasc Res. (2019) 115:453–62. doi: 10.1093/cvr/cvy188
30. Chan YX, Knuiman MW, Hung J, Divitini ML, Handelsman DJ, Beilby JP, et al. Testosterone, dihydrotestosterone and estradiol are differentially associated with carotid intima-media thickness and the presence of carotid plaque in men with and without coronary artery disease. Endocr J. (2015) 62:777–86. doi: 10.1507/endocrj.EJ15-0196
31. Aguirre LE, Colleluori G, Fowler KE, Jan IZ, Villareal K, Qualls C, et al. High aromatase activity in hypogonadal men is associated with higher spine bone mineral density, increased truncal fat and reduced lean mass. Eur J Endocrinol. (2015) 173:167–74. doi: 10.1530/EJE-14-1103
32. Xu X, Wang L, Luo D, Zhang M, Chen S, Wang Y, et al. Effect of testosterone synthesis and conversion on serum testosterone levels in obese men. Horm Metab Res. (2018) 50:661–70. doi: 10.1055/a-0658-7712
33. Arevalo MA, Azcoitia I, Garcia-Segura LM. The neuroprotective actions of oestradiol and oestrogen receptors. Nat Rev Neurosci. (2015) 16:17–29. doi: 10.1038/nrn3856
34. Russell N, Grossmann M. Mechanisms in endocrinology: estradiol as a male hormone. Eur J Endocrinol. (2019) 1:EJE-18–1000.R2. doi: 10.1530/EJE-18-1000
35. Charrière N, Miles-Chan JL, Montani JP, Dulloo AG. Water-induced thermogenesis and fat oxidation: a reassessment. Nutr Diabetes. (2015) 5:e190. doi: 10.1038/nutd.2015.41
36. Purdom T, Kravitz L, Dokladny K, Mermier C. Understanding the factors that effect maximal fat oxidation. J Int Soc Sports Nutr. (2018) 15:3. doi: 10.1186/s12970-018-0207-1
37. Jequier E, Constant F. Water as an essential nutrient: the physiological basis of hydration. Eur J Clin Nutr. (2018) 64:115–23. doi: 10.1038/ejcn.2009.111
38. Cadegiani FA, Kater CE. Enhancement of hypothalamic-pituitary activity in male athletes: evidence of a novel hormonal mechanism of physical conditioning. BMC Endoc Dis. (2019) 1:117. doi: 10.1186/s12902-019-0443-7
39. Oosterholt BG, Maes JH, Van der Linden D, Verbraak MJ, Kompier MA. Burnout and cortisol: evidence for a lower cortisol awakening response in both clinical and non-clinical burnout. J Psychosom Res. (2015) 78:445–51. doi: 10.1016/j.jpsychores.2014.11.003
40. Grossi G, Perski A, Ekstedt M, Johansson T, Lindström M, Holm K. The morning salivary cortisol response in burnout. J Psychosom Res. (2005) 59:103–11. doi: 10.1016/j.jpsychores.2005.02.009
41. Sjörs A, Ljung T, Jonsdottir IH. Long-term follow-up of cortisol awakening response in patients treated for stress-related exhaustion. BMJ Open. (2012) 2:e001091. doi: 10.1136/bmjopen-2012-001091
42. Nater UM, Maloney E, Boneva RS, Gurbaxani BM, Lin JM, Jones JF, et al. Attenuated morning salivary cortisol concentrations in a population based study of persons with chronic fatigue syndrome and well controls. J Clin Endocrinol Metab. (2008) 93:703–9. doi: 10.1210/jc.2007-1747
43. Stalder T, Kirschbaum C, Kudielka BM, Adam EK, Pruessner JC, Wust S, et al. Assessment of the cortisol awakening response: expert consensus guidelines. Psychoneuroendocrinology. (2016) 63:414–32. doi: 10.1016/j.psyneuen.2015.10.010
44. Elder GJ, Wetherell MA, Barclay NL, Ellis JG. The cortisol awakening response–applications and implications for sleep medicine. Sleep Med Rev. (2014) 18:215–24. doi: 10.1016/j.smrv.2013.05.001
45. Clow A, Hucklebridge F, Stalder T, Evans P, Thorn L. The cortisol awakening response: more than a measure of HPA axis function. Neurosci Biobehav Rev. (2010) 35:97–103. doi: 10.1016/j.neubiorev.2009.12.011
46. Smyth N, Thorn L, Hucklebridge F, Evans P, Clow A. Detailed time course of the cortisol awakening response in healthy participants. Psychoneuroendocrinology. (2015) 62:200–3. doi: 10.1016/j.psyneuen.2015.08.011
47. Wilhelm I, Born J, Kudielka BM, Schlotz W, Wust S. Is the cortisol awakening rise a response to awakening? Psychoneuroendocrinology. (2007) 32:358–66. doi: 10.1016/j.psyneuen.2007.01.008
48. Zhang J, Ma RC, Kong AP, So WY, Li AM, Lam SP, et al. Relationship of sleep quantity and quality with 24-h urinary catecholamines and salivary awakening cortisol in healthy middle-aged adults. Sleep. (2011) 34:225–33. doi: 10.1093/sleep/34.2.225
49. Pires GN, Bezerra AG, Tufik S, Andersen ML. Effects of acute sleep deprivation on state anxiety levels: a systematic review and meta-analysis. Sleep Med. (2016) 24:109–18. doi: 10.1016/j.sleep.2016.07.019
50. Obasi EM, Chen TA, Cavanagh L, Smith BK, Wilborn KA, McNeill LH, et al. Depression, perceived social control, and hypothalamic-pituitary-adrenal axis function in African-American adults. Health Psychol. (2019). doi: 10.1037/hea0000812. [Epub ahead of print].
51. Cadegiani FA, Kater CE. Adrenal fatigue does not exist: a systematic review. BMC Endocr Disord. (2016) 16:48. doi: 10.1186/s12902-016-0128-4
52. Abu-Samak MS, Mohammad BA, Abu-Taha MI, Hasoun LZ, Awwad SH. Associations between sleep deprivation and salivary testosterone levels in male university students: a prospective cohort study. Am J Mens Health. (2018) 12:411–9. doi: 10.1177/1557988317735412
53. Lee DS, Choi JB, Sohn DW. Impact of sleep deprivation on the hypothalamic-pituitary-gonadal axis and erectile tissue. J Sex Med. (2019) 16:5–16. doi: 10.1016/j.jsxm.2018.10.014
54. Arnal PJ, Drogou C, Sauvet F, Regnauld J, Dispersyn G, Faraut B, et al. Effect of sleep extension on the subsequent testosterone, cortisol and prolactin responses to total sleep deprivation and recovery. J Neuroendocrinol. (2016) 28:12346. doi: 10.1111/jne.12346
55. Banks S, Dinges DF. Behavioral and physiological consequences of sleep restriction. J Clin Sleep Med. (2007) 3:519–28. doi: 10.1080/15402000701244445
56. Pérez-Fuentes MDC, Molero Jurado MDM, Simón Márquez MDM, Barragán Martín AB, Gázquez Linares JJ. Emotional effects of the duration, efficiency, and subjective quality of sleep in healthcare personnel. Int J Environ Res Public Health. (2019) 16:E3512. doi: 10.3390/ijerph16193512
57. Park YK, Kim JH, Choi SJ, Kim ST, Joo EY. Altered regional cerebral blood flow associated with mood and sleep in shift workers: cerebral perfusion magnetic resonance imaging study. J Clin Neurol. (2019) 15:438–47. doi: 10.3988/jcn.2019.15.4.438
58. Schwarz J, Axelsson J, Gerhardsson A, Tamm S, Fischer H, Kecklund G, et al. Mood impairment is stronger in young than in older adults after sleep deprivation. J Sleep Res. (2019) 28:e12801. doi: 10.1111/jsr.12801
59. Lo JC, Ong JL, Leong RL, Gooley JJ, Chee MW. Cognitive performance, sleepiness, and mood in partially sleep deprived adolescents: the need for sleep study. Sleep. (2016) 39:687–98. doi: 10.5665/sleep.5552
60. Chaput JP, Dutil C, Sampasa-Kanyinga H. Sleeping hours: what is the ideal number and how does age impact this? Nat Sci Sleep. (2018) 10:421–30. doi: 10.2147/NSS.S163071
61. Grandner MA, Drummond SP. Who are the long sleepers? Towards an understanding of the mortality relationship. Sleep Med Rev. (2007) 11:341–60. doi: 10.1016/j.smrv.2007.03.010
62. Popkin BM, D'Anci KE, Rosenberg IH. Water, hydration, and health. Nutr Rev. (2010) 68:439–58. doi: 10.1111/j.1753-4887.2010.00304.x
63. Armstrong LE. Challenges of linking chronic dehydration and fluid consumption to health outcomes. Nutr Rev. (2012) 70(Suppl 2):S121–7. doi: 10.1111/j.1753-4887.2012.00539.x
64. Liska D, Mah E, Brisbois T, Barrios PL, Baker LB, Spriet LL. Narrative review of hydration and selected health outcomes in the general population. Nutrients. (2019) 11:E70. doi: 10.3390/nu11010070
65. El-Sharkawy AM, Sahota O1, Lobo DN. Acute and chronic effects of hydration status on health. Nutr Rev. (2015) 73(Suppl 2):97–109l. doi: 10.1093/nutrit/nuv038
66. Shirreffs SM. Markers of hydration status. Eur J Clin Nutr. (2003) 57:S6-9. doi: 10.1038/sj.ejcn.1601895
67. Svendsen IS, Killer SC, Gleeson M. Influence of hydration status on changes in plasma cortisol, leukocytes, and antigen-stimulated cytokine production by whole blood culture following prolonged exercise. ISRN Nutr. (2014) 2014:561401. doi: 10.1155/2014/561401
68. Penkman MA, Field CJ, Sellar CM, Harber VJ, Bell GJ. Effect of hydration status on high-intensity rowing performance and immune function. Int J Sports Physiol Perform. (2008) 3:531–46. doi: 10.1123/ijspp.3.4.531
69. Borgman MA, Zaar M, Aden JK, Schlader ZJ, Gagnon D, Rivas E, et al. Hemostatic responses to exercise, dehydration, and simulated bleeding in heat-stressed humans. Am J Physiol Regul Integr Comp Physiol. (2019) 316:R145–56. doi: 10.1152/ajpregu.00223.2018
70. Roh HT, Cho SY, So WY, Paik IY, Suh SH. Effects of different fluid replacements on serum HSP70 and lymphocyte DNA damage in college athletes during exercise at high ambient temperatures. J Sport Health Sci. (2016) 5:448–55. doi: 10.1016/j.jshs.2015.09.007
71. Hom LL, Lee EC, Apicella JM, Wallace SD, Emmanuel H, Klau JF, et al. Eleven days of moderate exercise and heat exposure induces acclimation without significant HSP70 and apoptosis responses of lymphocytes in college-aged males. Cell Stress Chaperones. (2012) 17:29–39. doi: 10.1007/s12192-011-0283-5
72. Kim YN, Shin HS. Relationships of total lymphocyte count and subpopulation lymphocyte counts with the nutritional status in patients undergoing hemodialysis/peritoneal dialysis. Kosin Med J. (2017) 32:58–71. doi: 10.7180/kmj.2017.32.1.58
73. Altunayoglu Cakmak V, Ozsu S, Gulsoy A, Akpinar R, Bulbul Y. The significance of the relative lymphocyte count as an independent predictor of cardiovascular disease in patients with obstructive sleep apnea syndrome. Med Princ Pract. (2016) 25:455–60. doi: 10.1159/000447697
74. Dmitrieva NI, Burg MB. Elevated sodium and dehydration stimulate inflammatory signaling in endothelial cells and promote atherosclerosis. PLoS One. (2015) 10:e0128870. doi: 10.1371/journal.pone.0128870
75. Mitchell JB, Dugas JP, McFarlin BK, Nelson MJ. Effect of exercise, heat stress, and hydration on immune cell number and function. Med Sci Sports Exerc. (2002) 34:1941–50. doi: 10.1097/00005768-200212000-00013
76. Balta S, Ozturk C. The platelet-lymphocyte ratio: a simple, inexpensive and rapid prognostic marker for cardiovascular events. Platelets. (2015) 26:680–1. doi: 10.3109/09537104.2014.979340
77. Ye GL, Chen Q, Chen X, Liu YY, Yin TT, Meng QH, et al. The prognostic role of platelet-to-lymphocyte ratio in patients with acute heart failure: a cohort study. Sci Rep. (2019) 9:10639. doi: 10.1038/s41598-019-47143-2
78. Akboga MK, Canpolat U, Yayla C, Ozcan F, Ozeke O, Topaloglu S, et al. Association of platelet to lymphocyte ratio with inflammation and severity of coronary atherosclerosis in patients with stable coronary artery disease. Angiology. (2016) 67:89–95. doi: 10.1177/0003319715583186
79. Liaw FY, Huang CF, Chen WL, Wu LW, Peng TC, Chang YW, et al. Higher platelet-to-lymphocyte ratio increased the risk of sarcopenia in the community-dwelling older adults. Sci Rep. (2017) 7:16609. doi: 10.1038/s41598-017-16924-y
80. Gasparyan AY, Ayvazyan L, Mukanova U, Yessirkepov M, Kitas GD. The platelet-to-lymphocyte ratio as an inflammatory marker in rheumatic diseases. Ann Lab Med. (2019) 39:345–57. doi: 10.3343/alm.2019.39.4.345
81. Eccles R, Mallefet P. Observational study of the effects of upper respiratory tract infection on hydrationstatus. Multidiscip Respir Med. (2019) 14:36. doi: 10.1186/s40248-019-0200-9
82. Yang DF, Shen YL, Wu C, Huang YS, Lee PY, Er NX, et al. Sleep deprivation reduces the recovery of muscle injury induced by high-intensity exercise in a mouse model. Life Sci. (2019) 235:116835. doi: 10.1016/j.lfs.2019.116835
83. Wang JP, Chi RF, Wang K, Ma T, Guo XF, Zhang XL, et al. Exp oxidative stress impairs myocyte autophagy, resulting in myocyte hypertrophy. Physiology. (2018) 103:461–72. doi: 10.1113/EP086650
84. Ng TP, Lu Y, Choo RWM, Tan CTY, Nyunt MSZ, Gao Q, et al. Dysregulated homeostatic pathways in sarcopenia among frail older adults. Aging Cell. (2018) 17:e12842. doi: 10.1111/acel.12842
85. Berr CM, Stieg MR, Deutschbein T, Quinkler M, Schmidmaier R, Osswald A, et al. Persistence of myopathy in Cushing's syndrome: evaluation of the German Cushing's Registry. Eur J Endocrinol. (2017) 176:737–46. doi: 10.1530/EJE-16-0689
86. Solomon AM, Bouloux PM. Modifying muscle mass—the endocrine perspective. J Endocrinol. (2006) 191:349–60. doi: 10.1677/joe.1.06837
87. Pedersen BK, Febbraio MA. Muscles, exercise and obesity: skeletal muscle as a secretory organ. Nat Rev Endocrinol. (2012) 8:457–65. doi: 10.1038/nrendo.2012.49
88. Lemche E, Chaban OS, Lemche AV. Neuroendorine and epigenetic mechanisms subserving autonomic imbalance and HPA dysfunction in the metabolic syndrome. Front Neurosci. (2016) 10:142. doi: 10.3389/fnins.2016.00142
89. Romanello V, Sandri M. Mitochondrial quality control and muscle mass maintenance. Front Physiol. (2015) 6:422. doi: 10.3389/fphys.2015.00422
90. Peng K, Pan Y, Li J, Khan Z, Fan M, Yin H, et al. 11beta-hydroxysteroid dehydrogenase type 1(11beta-HSD1) mediates insulin resistance through JNK activation in adipocytes. Sci Rep. (2016) 6:37160. doi: 10.1038/srep37160
91. Chapman K, Holmes M, Seckl J. 11beta-hydroxysteroid dehydrogenases: intracellular gate-keepers of tissue glucocorticoid action. Physiol Rev. (2013) 93:1139–206. doi: 10.1152/physrev.00020.2012
92. Hu F, Liu F. Mitochondrial stress: a bridge between mitochondrial dysfunction and metabolic diseases? Cell Signal. (2011) 23:1528–33. doi: 10.1016/j.cellsig.2011.05.008
93. Brennan K, Gallo S, Slavin M, Herrick J, Jonge LD. Water Consumption Increases Resting Fat Oxidation. New Orleans, LA: Poster presentation at Obesity Week 2016 (2016).
94. Stookey JJD. Negative, null and beneficial effects of drinking water on energy intake, energy expenditure, fat oxidation and weight change in randomized trials: a qualitative review. Nutrients. (2016) 8:19. doi: 10.3390/nu8010019
95. Keller U, Szinnai G, Bilz S, Berneis K. Effects of changes in hydration on protein, glucose and lipid metabolism in man: impact on health. Eur J Clin Nutr. (2003) 57 (Suppl 2):S69–74. doi: 10.1038/sj.ejcn.1601904
96. Boschmann M, Steiniger J, Franke G, Birkenfeld AL, Luft FC, Jordan J. Water drinking induces thermogenesis through osmosensitive mechanisms. J Clin Endocrinol Metab. (2007) 92:3334–7. doi: 10.1210/jc.2006-1438
97. Boschmann M, Steiniger J, Hille U, Tank J, Adams F, Sharma AM, et al. Water-induced thermogenesis. J Clin Endocrinol Metab. (2003) 88:6015–9. doi: 10.1210/jc.2003-030780
98. Dennis EA, Dengo AL, Comber DL, Flack KD, Savla J, Davy KP, et al. Water consumption increases weight loss during a hypocaloric diet intervention in middle-aged and older adults. Obesity. (2010) 18:300–7. doi: 10.1038/oby.2009.235
99. González-Alonso J, Calbet JA, Nielsen B. Muscle blood flow is reduced with dehydration during prolonged exercise in humans. J Physiol. (1998) 513(Pt 3):895–905. doi: 10.1111/j.1469-7793.1998.895ba.x
100. Klaas RW, Smeets A, Lejeune PM, Wouters-Adriaens MPE, Margriet S Westerterp P, et al. Dietary fat oxidation as a function of body fat. Am J Clin Nutr. (2008) 87:132–5. doi: 10.1093/ajcn/87.1.132
101. Zurlo F, Lillioja S, Del Puente AE, Nyomba BL, Raz I, Saad MF, et al. Low ratio of fat to carbohydrate oxidation as predictor of weight gain: study of 24-h RQ. Am J Physiol. (1990) 259:E650–7. doi: 10.1152/ajpendo.1990.259.5.E650
102. MacKenzie-Shalders KL, Byrne NM, King NA, Slater GJ. Are increases in skeletal muscle mass accompanied by changes to resting metabolic rate in rugby athletes over a pre-season training period? Eur J Sport Sci. (2019) 19:885–92. doi: 10.1080/17461391.2018.1561951
103. McPherron AC, Guo T, Bond ND, Gavrilova O. Increasing muscle mass to improve metabolism. Adipocyte. (2013) 2:92–8. doi: 10.4161/adip.22500
104. Müller MJ, Langemann D, Gehrke I, Later W, Heller M, Glüer CC, et al. Effect of constitution on mass of individual organs and their association with metabolic rate in humans–a detailed view on allometric scaling. PLoS ONE. (2011) 6:e22732. doi: 10.1371/journal.pone.0022732
105. Moyen NE, Ganio MS, Wiersma LD, Kavouras SA, Gray M, McDermott BP, et al. Hydration status affects mood state and pain sensation during ultra-endurance cycling. J Sports Sci. (2015) 33:1962–9. doi: 10.1080/02640414.2015.1021275
106. Horowitz M, Samueloff S. Plasma water shifts during thermal dehydration. J Appl Physiol Respir Environ Exerc Physiol. (1979) 47:738–44. doi: 10.1152/jappl.1979.47.4.738
107. Stefanaki C, Pervanidou P, Boschiero D, Chrousos GP. Chronic stress and body composition disorders: implications for health and disease. Hormones. (2018) 17:33–43. doi: 10.1007/s42000-018-0023-7
108. Ritchie RF, Ledue TB, Craig WY. Patient hydration: a major source of laboratory uncertainty. Clin Chem Lab Med. (2007) 45:158–66. doi: 10.1515/CCLM.2007.052
109. Murck H, Schussler P, Steiger A. Renin-angiotensin-aldosterone system: the forgotten stress hormone system: relationship to depression and sleep. Pharmacopsychiatry. (2012) 45:83–95. doi: 10.1055/s-0031-1291346
110. William R, Hankinson SE, Sluss PM, Vesper HW, Wierman ME. Challenges to the measurement of estradiol: an endocrine society position statement. Clin Endocrinol Metabol. (2013) 98:1376–87. doi: 10.1210/jc.2012-3780
111. Fiers T, Casetta B, Bernaert B, Vandersypt E, Debock M, Kaufman JM. Development of a highly sensitive method for the quantification of estrone and estradiol in serum by liquid chromatography tandem mass spectrometry without derivatization. J Chromatogr B Analyt Technol Biomed Life Sci. (2012) 893–4:57–62. doi: 10.1016/j.jchromb.2012.02.034
112. Stanczyk FZ, Jurow J, Hsing AW. Limitations of direct immunoassays for measuring circulating estradiol levels in postmenopausal women and men in epidemiologic studies. Cancer Epidemiol Biomarkers Prev. (2010) 19:903–6. doi: 10.1158/1055-9965.EPI-10-0081
113. Dorgan JF, Fears TR, McMahon RP, Friedman LA, Patterson BH, Greenhut SF. Measurement of steroid sex hormones in serum: a comparison of radioimmunoassay and mass spectrometry. Steroids. (2002) 67:151–8. doi: 10.1016/S0039-128X(01)00147-7
114. Christina W, Catlin DH, Demers LM, Starcevic B, Swerdloff RS. Measurement of total serum testosterone in adult men: comparison of current laboratory methods versus liquid chromatography-tandem mass spectrometry. J Clin Endocrinol Metabol. (2004) 89:534–43. doi: 10.1210/jc.2003-031287
115. Huhtaniemi IT, Tajar A, Lee DM, O'Neill TW, Finn JD, Bartfai G, et al. Comparison of serum testosterone and estradiol measurements in 3174 European menusing platform immunoassay and mass spectrometry; relevance for the diagnostics in aging men. Eur J Endocrinol. (2012) 166:983–91. doi: 10.1530/EJE-11-1051
Keywords: hormonal conditioning, endocrinology of physical activity, sports endocrinology, hormones and sports, endocrine and metabolic responses on overtraining syndrome (EROS) study, overtraining syndrome
Citation: Cadegiani FA and Kater CE (2019) Inter-correlations Among Clinical, Metabolic, and Biochemical Parameters and Their Predictive Value in Healthy and Overtrained Male Athletes: The EROS-CORRELATIONS Study. Front. Endocrinol. 10:858. doi: 10.3389/fendo.2019.00858
Received: 30 May 2019; Accepted: 22 November 2019;
Published: 10 December 2019.
Edited by:
Katia Collomp, University of Orléans, FranceReviewed by:
Jean-Frédéric Brun, INSERM U1046 Physiologie et médecine expérimentale du coeur et des muscles, FranceGuillaume Py, Université de Montpellier, France
Copyright © 2019 Cadegiani and Kater. This is an open-access article distributed under the terms of the Creative Commons Attribution License (CC BY). The use, distribution or reproduction in other forums is permitted, provided the original author(s) and the copyright owner(s) are credited and that the original publication in this journal is cited, in accordance with accepted academic practice. No use, distribution or reproduction is permitted which does not comply with these terms.
*Correspondence: Flavio A. Cadegiani, c3VwZXJlbmRvY3Jpbm9sb2d5QGdtYWlsLmNvbQ==; ZmxhdmlvLmNhZGVnaWFuaUB1bmlmZXNwLmJy