 Luan Wen
 Cara He†
 Robert J. Denver
- Department of Molecular, Cellular and Developmental Biology, The University of Michigan, Ann Arbor, MI, United States
Thyroid hormone (T3) plays several key roles in development of the nervous system in vertebrates, controlling diverse processes such as neurogenesis, cell migration, apoptosis, differentiation, and maturation. In anuran amphibians, the hormone exerts its actions on the tadpole brain during metamorphosis, a developmental period dependent on T3. Thyroid hormone regulates gene transcription by binding to two nuclear receptors, TRα and TRβ. Our previous findings using pharmacological and other approaches supported that TRα plays a pivotal role in mediating T3 actions on neural cell proliferation in Xenopus tadpole brain. Here we used Xenopus tropicalis (X. tropicalis) tadpoles with an inactivating mutation in the gene that encodes TRα to investigate roles for TRα in mitosis and gene regulation in tadpole brain. Gross morphological analysis showed that mutant tadpoles had proportionally smaller brains, corrected for body size, compared with wildtype, both during prometamorphosis and at the completion of metamorphosis. This was reflected in a large reduction in phosphorylated histone 3 (pH3; a mitosis marker) immunoreactive (ir) nuclei in prometamorphic tadpole brain, when T3-dependent cell proliferation is maximal. Treatment of wild type premetamorphic tadpoles with T3 for 48 h induced gross morphological changes in the brain, and strongly increased pH3-ir, but had no effect in mutant tadpoles. Thyroid hormone induction of the direct TR target genes thrb, klf9, and thibz was dysregulated in mutant tadpoles. Analysis of gene expression by RNA sequencing in the brain of premetamorphic tadpoles treated with or without T3 for 16 h showed that the TRα accounts for 95% of the gene regulation responses to T3.
Introduction
Thyroid hormone (T3) plays several key roles in neurological development of vertebrates, influencing dendrite and axon development, synaptogenesis, myelination, cell migration, proliferation, and differentiation (1–3). Thyroid hormone deficiency during fetal and early postnatal life leads to severe, irreversible neurodevelopmental defects in mammals, a condition in humans known as cretinism (1, 4).
The hormone is also essential for development in non-mammalian vertebrates, which is perhaps best exemplified by the dependence of amphibian tadpole metamorphosis on T3 (5). Tadpoles of Xenopus species are important model organisms for investigating the molecular and cellular mechanisms of T3 action during vertebrate development (6).
Thyroid hormone regulates gene transcription by binding to ligand-activated transcription factors (T3 receptors; TRs) (7, 8). All jawed vertebrates that have been studied have two TR genes, designated alpha and beta. In mammals, multiple TR isoforms originate from the two genes, some that bind T3 and are functional, others that do not bind T3. They are produced by differential promoter usage or mRNA processing (3); similar TR protein diversity has not been described in amphibians. Mammalian and amphibian TR genes exhibit cell type and developmental stage-specific expression patterns, which supports that the subtypes/isoforms serve different functions in development and physiology (7, 9, 10). The mRNAs for the Thra gene, which codes for the functional isoform TRα1, is widely distributed in rodent brain from early development through adulthood, and most studies support that this protein is the major TR subtype involved with brain development (7). By contrast, mRNAs for Thrb (coding for TRβ1 and TRβ2, among several other isoforms) are expressed in the brain during postnatal life, and have a more limited distribution in the brain, being restricted to the retina, cochlea and hypothalamus, and also the pituitary gland (11–13).
The expression patterns of TR genes in Xenopus species have broad similarities to mammals. For example, thra mRNA is detected in the tadpole shortly after hatching and continues to be produced at a high, mostly constant level through metamorphosis in all tissues that have been studied (5). By contrast, thrb mRNA is not detected until the beginning of metamorphosis, at which time it is autoinduced by the rising plasma T3 titer. In tadpole brain, thra mRNA shows wide distribution; it is detected in virtually all cells in tadpole brain, and exhibits particularly strong signal in neurogenic zones (10, 14). The thrb mRNA was detected by in situ hybridization histochemistry (ISHH), and the protein by immunohistochemistry (IHC) only after treatment with T3, and analysis of TRβ in tadpole brain showed that the protein is found in specific brain nuclei throughout the brain, predominantly outside of neurogenic zones lining the ventricles (10).
Several lines of evidence in mammals support that TRα is critical for mediating T3 action on neurogenesis (15), oligodendrocyte differentiation (16), and astrocyte maturation (17). Previously, we showed that the TRα selective agonist CO23 induced brain cell proliferation, while the TRβ-selective agonists GC1 and GC24, used at concentrations that preferentially activate TRβ, had no effect (10). In the current study we used gene knockout technology to investigate a role for TRα in mediating T3 action on cell proliferation and gene regulation in tadpole brain. Mitosis is low in the premetamorphic tadpole brain, then it increases strongly and peaks during prometamorphosis, and this depends on endogenous T3 (10). We compared the volume and gross morphology of the tadpole brain, and we analyzed mitosis by IHC for phosphorylated histone 3 (pH3) which is a marker for M phase of the cell cycle. We conducted RNA-sequencing (RNA-seq) on a micro-dissected region of the tadpole brain that contains the preoptic area/thalamus/hypothalamus, and which houses neurosecretory neurons that project axons to the median eminence to control pituitary hormone secretion; this tadpole brain region is highly dependent on T3 for its development (10, 18, 19). We also conducted time course analyses of gene regulation responses to T3 in wild type and mutant tadpole brain.
Materials and Methods
Animal Care and Treatment
We obtained wildtype (WT) Xenopus tropicalis frogs from NASCO and reared them in dechlorinated tap water at 25C under a 13L:11D photoperiod, and fed them frog brittle (NASCO, Fort Atkinson, WI) or Sera Micron plankton food (tadpoles only). We obtained the heterozygous thra mutant frog line (TRαM5) from Dr. Yun-Bo Shi. This line was created using TALENS targeting exon 4 (the third coding exon) of the X. tropicalis thra gene, leading to the generation of a mutation that results in a predicted non-sense protein after amino acid 54, which is just before the first zinc finger of the DNA binding domain that begins at amino acid 60 (20). Here we designate the homozygous mutant frog line thramt−exon4 to indicate the presence of an inactivating mutation in exon 4, leading to a functional knockout.
We generated homozygous thramt−exon4 tadpoles by crossing heterozygous mutant frogs. Tadpoles were staged using the developmental staging system of Nieuwkoop and Faber (21) (NF). We used PCR-based genotyping to identify homozygous thramt−exon4 tadpoles as previously described (22). We tail clipped tadpoles at NF stage 48, and lysed the tissues in 30 μL Quick™Extraction buffer at 65°C for 15 min, followed by heating to 94°C for 5 min. To analyze the wild type thra allele we used forward primer Fwt 5′- AGCTATCTGGACAAAGACGAGCCG-3′, and for the mutant allele we used forward primer Fm5 5′-ACATCCCCAGCTATCCCCAGCTATG-3′. The common reverse primer was 5′-GCAAACTTTTTGGCTCAGAGGCCAC-3′. We used the same PCR program for both primer sets: 94°C 30 s, 68°C 60 s for 35 cycles.
For treatment of tadpoles with 3,5,3′-triiodothyronine (T3; sodium salt, Sigma-Aldrich, St. Louis, MO), we dissolved the hormone in 0.01N NaOH to make a 500 μM stock solution, then we added the stock to the aquarium water to a final concentration of 5 nM T3 for all experiments; controls received an equivalent amount of 0.01N NaOH. For the RNA-seq experiment, we treated NF stage 54 tadpoles with vehicle or T3 added to the aquarium water for 16 h before harvesting tissues for RNA isolation. For time course analyses using RTqPCR we treated NF stage 54 tadpoles with T3 for 0, 8, 16, or 42 h before harvesting tissues for analysis. For morphometric analyses and immunohistochemistry for cell proliferation we treated tadpoles with T3 or vehicle for 42 h before tissue harvest. All procedures involving animals were conducted under an approved animal use protocol (PRO00006809) in accordance with the guidelines of the Institutional Animal Care and Use Committee at the University of Michigan.
For morphometric analyses we euthanized tadpoles or newly metamorphosed frogs by immersion in 0.1% benzocaine, then recorded body weight and body length (using calipers; snout-tail tip for tadpoles, snout-vent for frogs) before dissecting the head and fixing it in 4% paraformaldehyde dissolved in MOPS buffer (0.1 M MOPS, 10 mM EGTA, 1 mM MgSO4, pH 7.4; Sigma-Aldrich) at 4°C overnight. We then dissected the fixed tadpole brain and captured images using a Leica stereoscope. All images were captured at the same magnification (10 X) and illumination settings. We used ImageJ software to quantify brain length, width and height for untreated NF stage 56 and 66 animals (n = 6 or 8/genotype, NF 56 or 66, respectively). We calculated brain volume by multiplying brain length, width and height, and normalized each animal's brain volume to its body length. We also analyzed brain morphology of NF stage 54 tadpoles after treatment with 5 nM T3 for 48 h; here we measured brain length and width (n = 5/treatment and genotype).
Total RNA Extraction, RNA Sequencing, and Reverse Transcriptase Quantitative PCR (RTqPCR)
We micro-dissected the region of the tadpole brain containing the preoptic area/thalamus/hypothalamus for isolation of RNA as previously described (23). For each biological replicate we pooled tissue from 5 tadpoles. We isolated total RNA from tadpole brain using Tri Reagent (Sigma-Aldrich, St. Louis, MO) and the Direct-zol RNA kit (Zymogen) following the manufacturers' instructions. The quality of the RNA was analyzed using a Bioanalyzer, and libraries were prepared by the University of Michigan DNA Sequencing Core. We used 3 biological replicates for each genotype and hormone treatment, for a total of 12 samples sequenced on two lanes using the Illumina Hiseq-4000 platform with 50 nt read length single-end sequencing. We conducted quality processing on raw reads using FastQC (v0.11.7), and we mapped aligned reads to the X. tropicalis genome (v4.1) using Bowtie. We conducted gene-level read counts using RSEM to count the number of reads overlapping each of 22,820 custom-annotated X. tropicalis genes. This custom annotation (the MNHN gene model) was built by Nicolas Buisine and Laurent Sachs based on their unpublished high-throughput RNA paired-end tag sequencing to identify the 5′ and 3′ ends of transcripts that were expressed in different X. tropicalis tissues, including the brain. We then conducted differential expression analysis using limma.
We used RTqPCR to validate gene expression changes identified by RNA-seq, and also for analysis of the kinetics of gene transcription responses to exogenous T3 in the two genotypes. We synthesized cDNA from 1 μg total RNA using the High Capacity cDNA Synthesis Kit (Applied Biosystems Inc., Foster City, CA). We conducted real-time qPCR using ABsolute Blue qPCR SYBR Low ROX Mix (ABgene Thermo Scientific, Surrey, UK) and Fast 7500 Real-Time PCR System (ABI) or StepOne Real Time PCR Systems (Life Technologies). We designed oligonucleotide primers to span exon-exon boundaries using the program Prime Blast (NCBI) (Table 1). For most genes we used a relative quantification method (24, 25) to compare mRNA levels by generating standard curves for each gene using a pool of cDNA. To compare levels of thra and thrb mRNAs in brains of tadpoles of the two genotypes we used an absolute quantification method. We constructed standard curves using the plasmids pCR-TOPO-xtTRα and T7TS-xtTRβ that contain full-length cDNAs for thra and thrb, respectively. The two cDNA inserts were of similar size (thra-1936 nt; thrb-2223 nt). We normalized mRNA levels to the reference gene ef1α, which did not change after treatment with T3 (data not shown).
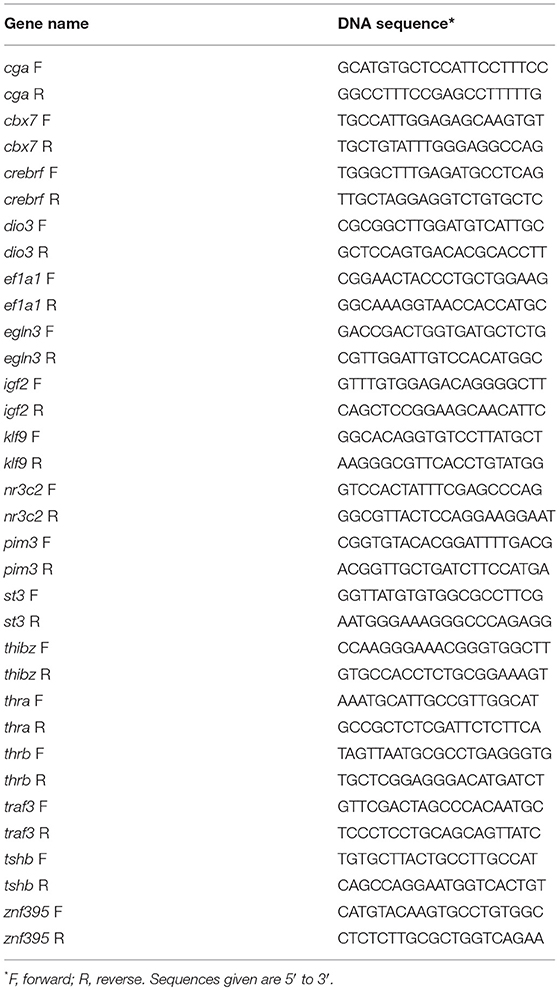
Table 1. Oligonucleotide primer sequences used for reverse transcriptase quantitative polymerase chain reaction.
Immunohistochemistry (IHC)
We conducted IHC on tadpole brain to detect mitotic cells using a rabbit antiserum raised against human pH3 (phosphorylated histone 3, Millipore), which marks cells in M phase of the cell cycle (10). We analyzed untreated tadpole brains from the two genotypes (n = 4–7/genotype) at NF stage 56 when cell proliferation is highest during metamorphosis (10). We also treated NF stage 54 tadpoles of the two genotypes with T3 for 42 h (n = 4–5/genotype and treatment), which induces a robust cell proliferation response in WT tadpole brain (10). We euthanized animals by immersion in 0.1% benzocaine, then dissected the head and fixed it in 4% paraformaldehyde in MOPS buffer at 4°C overnight. After fixation we dissected the brain from the skull, saturated the tissue in 30% sucrose overnight at 4°C, embedded it in OCT compound (Fisher Scientific), snap-froze the sample, and stored at −80°C until processing. We produced transverse, 14 μm cryosections, dried them for 2 h at 42°C, and then stored the slides at −80°C until analysis. For IHC, we first washed the cryo-sections in Tris-buffered saline plus 0.1% tween-20 (TBST) three times, then blocked with 10% normal goat serum diluted in TBST for 1 h at room temperature. We incubated the sections with primary antibody (1:500 dilution) overnight at 4°C, and then washed with TBST three times. We then detected primary immune complexes by incubating with a secondary antibody conjugated with Cy3 (1:1,000 dilution, Jackson ImmunoResearch Laboratories, Inc., West Grove, PA) at room temperature for 2 h, washed three times in TBST, and mounted the sections using a mounting medium that contained DAPI for counterstaining (Vector Laboratories).
We captured digital micrographic images at 100X using an Olympus IX81 inverted microscope (Olympus, Tokyo, Japan) and a Retiga 1300R Fast digital video camera (QI Imaging, Tuscon, AZ). We carefully matched sections for anatomical level following the Xenopus brain atlas developed by Tuinhof et al. (26), with modifications by Yao et al. (27). Images were analyzed in a blinded manner. We randomly selected 5 sections per brain within the region bound by the anterior preoptic area and hypothalamus/thalamus using a random number generator, and we manually counted cells immunoreactive for pH3 (pH3-ir) (10).
Statistics and Data Analysis
We analyzed data using the computer program SYSTAT (v. 13; Systat Software, San Jose, CA). Differences between treatments were analyzed by one-way ANOVA followed by Fisher's least significant difference (Fisher's LSD) post hoc-test, by two-way ANOVA, or by Student's independent sample t-test (α = 0.05). Derived values were Log10-transformed before statistical analysis if the variances were found to be heterogeneous. We used linear regression analysis to analyze time course gene expression data.
Results
Brain Size and Cell Proliferation Are Reduced in thramt−exon4 Animals
We compared brain size in WT and thramt−exon4 tadpoles at NF stage 56, the developmental stage when T3-dependent neural cell proliferation is maximal (10), and in newly metamorphosed frogs (NF stage 66). The NF stage 56 thramt−exon4 tadpoles were 25% smaller (body length from snout to tip of tail) than WT animals, but their brain volume was 46% smaller (Figure 1A). Brain volume, corrected for body length was 28% smaller in thramt−exon4 tadpoles compared with WT. The NF stage 66 (newly metamorphosed frogs) thramt−exon4 animals were 8% smaller (snout to vent length) than WT animals, but their brain volume was 28% smaller (Figure 1B). Brain volume corrected for body length was 22% smaller in newly metamorphosed thramt−exon4 frogs compared with WT (Figure 1B).
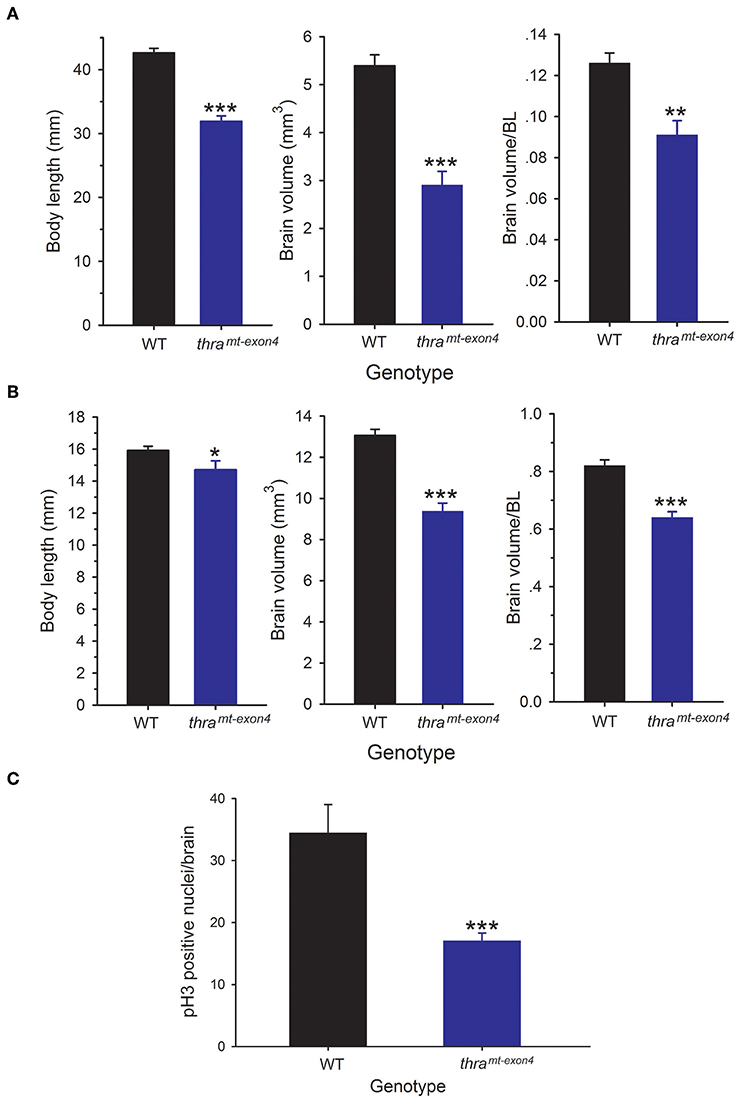
Figure 1. Brain size and cell proliferation is reduced in thramt−exon4 animals. We measured body length and brain volume in wild type (WT) and thramt−exon4 animals at two stages of development. Brain volume was measured on fixed brains as described in the Materials and Methods. Bars are the mean ± SEM. (A) Comparison of body length and brain volume of WT and thramt−exon4 prometamorphic tadpoles (NF stage 56; n = 6/genotype). (B) Comparison of body length and brain volume of WT and thramt−exon4 newly metamorphosed frogs (NF stage 66; n = 8/genotype). (C) Comparison of phosphorylated histone 3 (pH3) immunoreactive nuclei in the brain of WT and thramt−exon4 NF stage 56 tadpoles (n = 4–6/genotype). *p < 0.01, **p < 0.001, ***p < 0.0001, unpaired Student's t-test.
Our earlier findings showed that cell proliferation in Xenopus tadpole brain peaks at NF stage 56 (10). To investigate if the smaller brain size in NF stage 56 thramt−exon4 tadpoles was correlated with reduced cell proliferation, we conducted immunohistochemistry for pH3, a marker for cells in M phase of the cell cycle. This analysis showed a significant (50.5%) reduction in pH3-immunoreactive cell nuclei in thramt−exon4 tadpole brains compared with WT (Figure 1C).
TRα Is Required for T3-Dependent Morphological Changes, and Induction of Cell Proliferation in Tadpole Brain
Treatment of NF stage 54 (early prometamorphic) WT tadpoles with T3 (5 nM for 42 h) caused significant changes in tadpole brain morphology, decreasing brain length by 28%, and increasing brain width by 24% (Figures 2A,B). By contrast, exogenous T3 had no significant effect on brain morphology in thramt−exon4 tadpoles. Our previous work showed that exogenous T3 can induce cell proliferation in NF stage 54 Xenopus tadpole brain, measured by BrdU incorporation or pH3-ir. We saw the expected increase in pH3-ir after T3 treatment in WT tadpoles (~2.7 fold increase), but in thramt−exon4 tadpoles T3 treatment reduced pH3-ir by ~30% compared with vehicle-treated animals (Figure 2C).
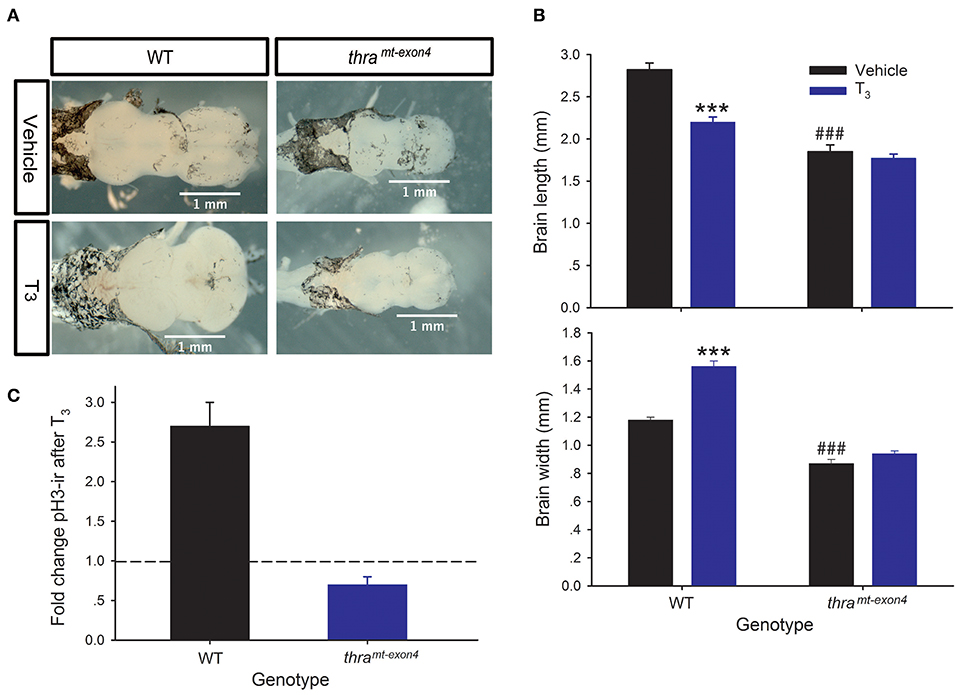
Figure 2. Thyroid hormone receptor α is required for T3-dependent morphological changes, and induction of cell proliferation in tadpole brain. We treated wild type (WT) and thramt−exon4 premetamorphic (NF stage 54) tadpoles with T3 (5 nM) or vehicle added to the aquarium water for 42 h, then measured brain size and phosphorylated histone 3 immunoreactivity (pH3-ir) in the brain as described in the Materials and Methods. Bars are the mean ± SEM. (A) Exogenous T3 caused dramatic morphological changes in the brains of WT, but not thramt−exon4 tadpoles. Shown are dorsal images of fixed tadpole brains. (B) Exogenous T3 decreased length, and increased width of WT tadpole brain, but had no effect in thramt−exon4 animals (***p < 0.0001, unpaired Student's t-test). In vehicle-treated tadpoles, the baseline brain length and width were both smaller in thramt−exon4 compared with WT (###p < 0.0001, unpaired Student's t-test). (C) Treatment with T3 strongly increased pH3-ir in WT (p < 0.0001, unpaired Student's t-test), but decreased it in thramt−exon4 tadpole brain (p < 0.0001). Shown is the fold change in total brain pH3-ir nuclei in each genotype. The dashed line indicates fold change of 1.0 = no change.
Thyroid Hormone Receptor α Is the Major TR Expressed in Tadpole Brain
Using RTqPCR with absolute quantification, we found that baseline thra mRNA was ~12.5 times higher than baseline thrb mRNA, confirming that TRα is the major TR subtype in tadpole brain (Figure 3A). The baseline thra mRNA was significantly lower in thramt−exon4 tadpole brain compared with WT (21% lower), while the baseline thrb mRNA was significantly higher in thramt−exon4 (~2 fold; Figure 3A). Treatment with T3 for 42 h had no significant effect on thra mRNA level in either genotype; whereas, T3 treatment caused a large induction of thrb mRNA in the brains of WT (7.9 fold increase) tadpoles, and a significant but lower induction in thramt−exon4 animals (3.2 fold increase).
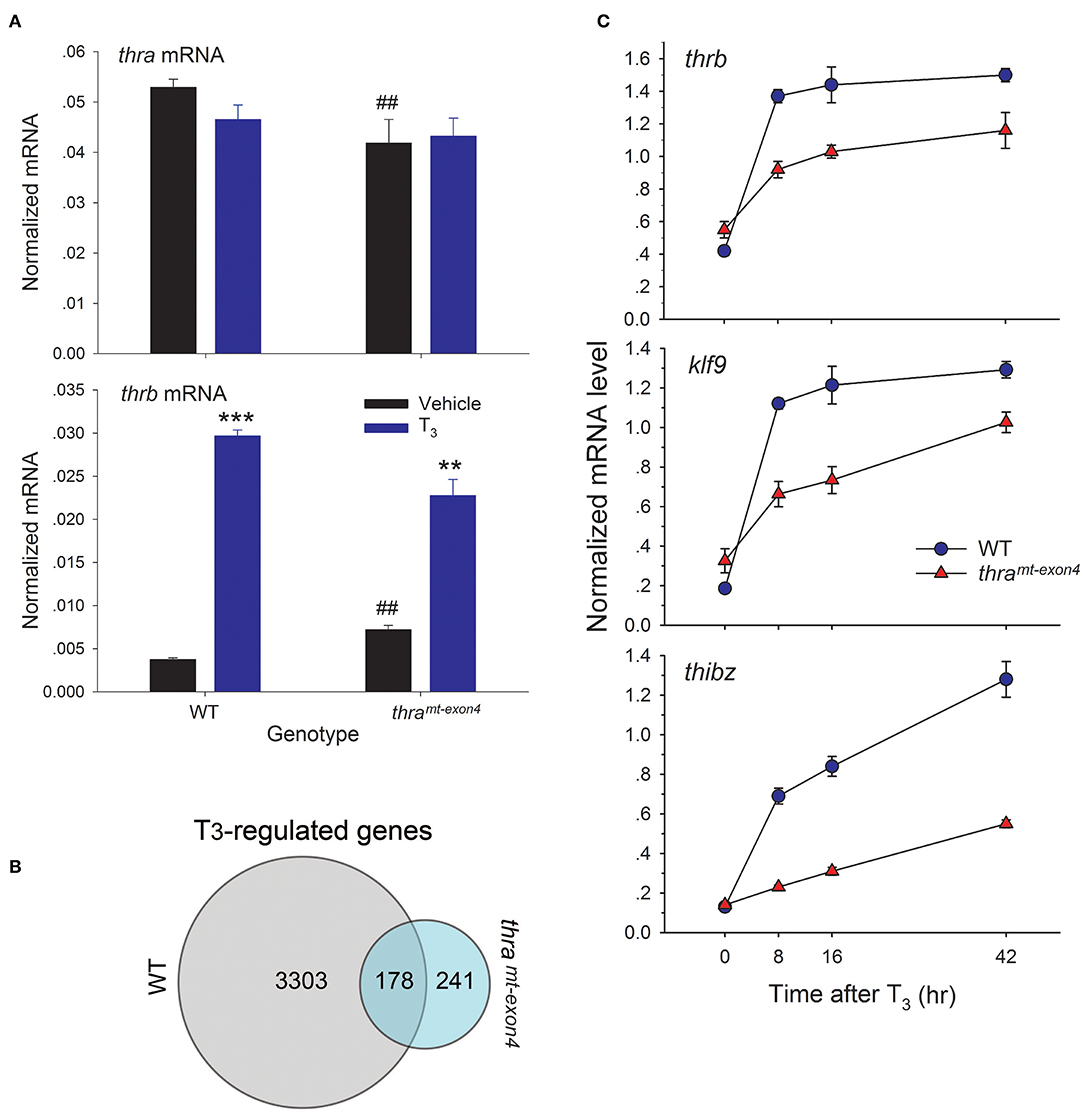
Figure 3. Gene transcription responses to exogenous T3 are impaired in thramt−exon4 tadpole brain. We treated wild type (WT) and thramt−exon4 premetamorphic (NF stage 54) tadpoles with T3 (5 nM) or vehicle added to the aquarium water for different times, then measured target gene mRNA levels in brain (region of the preoptic area/thalamus/hypothalamus) by RTqPCR using absolute quantification (for thra and thrb, panel A) or relative quantification (genes in panel B). (A) Thyroid hormone receptor α is the major TR subtype expressed in tadpole brain. Comparison of baseline mRNA levels, and effects of T3 treatment for 42 h on thra and thrb mRNA levels in WT and thramt−exon4 tadpole brain. Bars represent the mean ± SEM (n = 4/genotype/treatment). Note that the baseline (vehicle-treated) thra mRNA level is 14 times greater than thrb mRNA in WT tadpole brain. The baseline thra mRNA was significantly lower, while the thrb mRNA was significantly higher in thramt−exon4 compared with WT tadpole brain (##p < 0.001, Student's unpaired t-test). Treatment with T3 had no effect on thra mRNA, but strongly induced thrb mRNA in both genotypes (**p < 0.001, ***p < 0.0001, Student's unpaired t-test). (B) Venn diagram representing the numbers of T3-regulated genes determined by RNA-seq conducted on RNA isolated from brains of wild type and thramt−exon4 NF stage 54 tadpoles treated with or without T3 for 16 h. (C) Time course of induction by T3 in tadpole brain of mRNAs for three direct T3 response genes, thrb, klf9, and thibz (note that these three genes are included in the 178 genes that overlap between WT and thramt−exon4). Points represent the mean ± SEM (n = 4/genotype/time point). The mRNA level for each of the genes was elevated at 8 h in both genotypes (p < 0.001, ANOVA), and the slope of each curve was significantly different between WT and thramt−exon4 (p < 0.0001, linear regression analysis).
The Vast Majority of Gene Regulation Responses to Exogenous T3 Are Lost in thramt−exon4 Tadpole Brain
We used RNA sequencing to analyze T3-dependent changes in gene transcription in tadpole brain after exposure to exogenous T3 for 16 h, comparing WT and thramt−exon4 (NF stage 54). We chose this time point for analysis because it should capture most or all direct T3-dependent gene regulation responses, including the delayed immediate early genes (23, 28, 29). We identified 3,481 unique mRNAs that were induced or repressed in WT vs. 419 in thramt−exon4 (thramt−exon4 only 12% of WT), and 178 genes that overlapped between the two genotypes (Figure 3B). That is, only 5.1% (178/3481) of genes regulated by T3 in WT were regulated in the brain of thramt−exon4 animals. Interestingly, 241 genes (57.5% of all T3 regulated genes in thramt−exon4) were regulated by T3 only in thramt−exon4 animals. The RNA-seq dataset has been deposited in the Gene Expression Omnibus archive at the National Center for Biotechnology Information (GEO accession #GSE130816).
We investigated the kinetics of transcriptional activation by T3 of three well-known direct T3 response genes, thrb, klf9, and thibz. These genes are included in the 178 genes that overlap between WT and thramt−exon4. All three genes were strongly induced at the 8 h time point in WT tadpole brain, and their mRNAs remained elevated (i.e., they reached a maximum by 8 h: thrb and klf9) or continued to increase (thibz) through 42 h (Figure 3C). By contrast, although all three genes were induced by T3 in the brains of thramt−exon4 tadpoles, the level of induction at 8 h was significantly lower than in WT for all three genes. The kinetics of gene induction, measured as the normalized mRNA level at four time points, and analyzed by linear regression, showed significantly slower kinetics for all three genes in thramt−exon4 animals (slopes of curves 0 vs. 8 h; thrb: WT = 0.95, thramt−exon4 = 0.37; klf9: WT = 0.94, thramt−exon4 = 0.34; thibz: WT = 0.56, thramt−exon4 = 0.09).
We also compared the induced and repressed gene lists between wild type and thramt−exon4 tadpoles. This showed that only 5.9% (109 of 1,855) of the genes induced by T3 in WT were regulated after loss of thra (Figure 4A). Many of the well-known T3-induced genes are in this gene list (Supplemental Table 1), suggesting that TRβ is sufficient to mediate T3 regulation of a core set of TH response genes. However, in comparing the level of gene induction by T3 of these 109 genes (log2 fold change >0.5), we found that the majority of these genes exhibited impaired responses to the hormone (Supplemental Table 1); four examples that we validated by RTqPCR are shown in Figure 4B. While exogenous T3 caused significant increases in mRNA levels in both genotypes, the level of gene induction was reduced in thramt−exon4 compared with WT (fold change; dio3: WT = 3.2, thramt−exon4 = 2.6; st3: WT = 4.9, thramt−exon4 = 1.5; igf2: WT = 5.3, thramt−exon4 = 1.5; nc3r2: WT = 2.5, thramt−exon4 = 1.7). There were 169 genes that were induced by T3 in thramt−exon4 but not in WT.
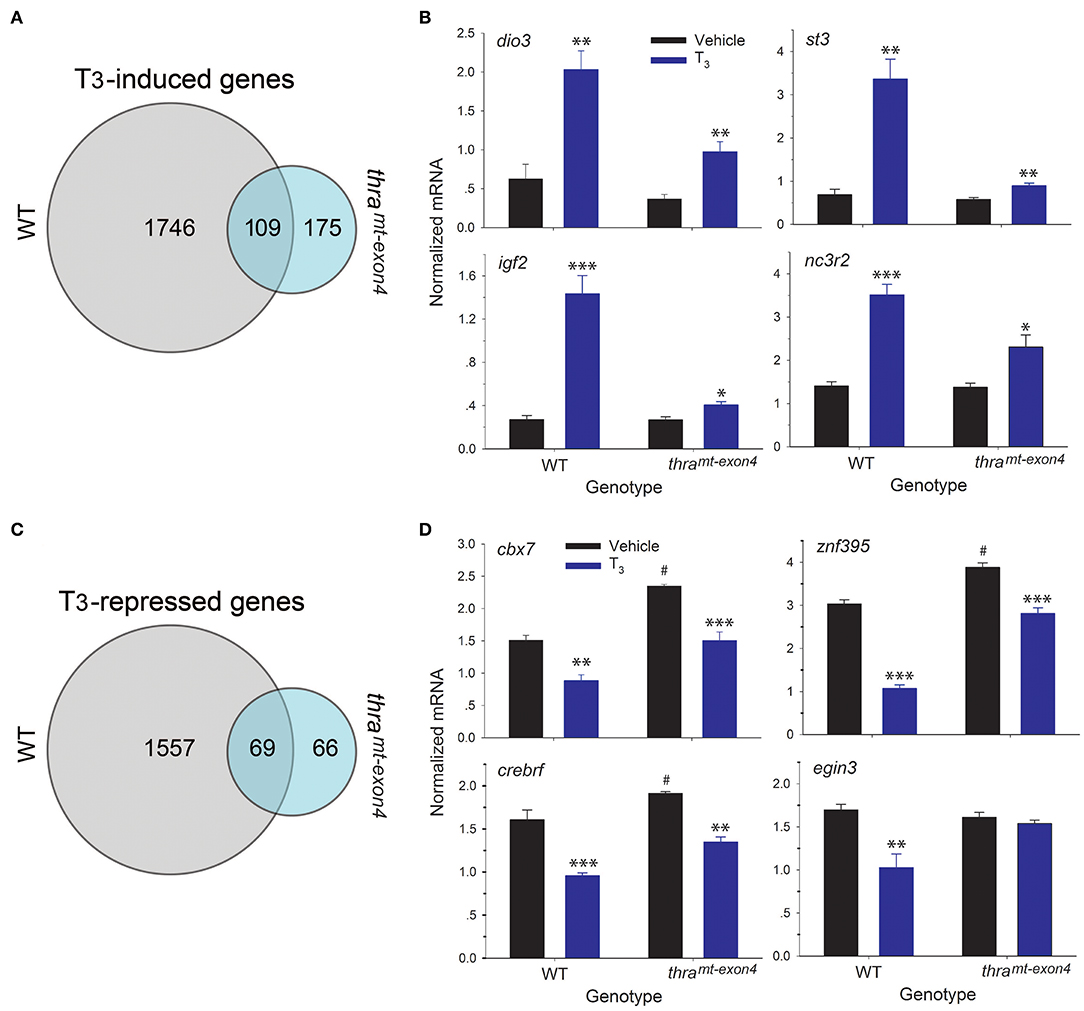
Figure 4. RNA sequencing shows that the majority of gene regulation responses to exogenous T3 are lost in thramt−exon4 tadpole brain. We treated wild type (WT) and thramt−exon4 premetamorphic (NF stage 54) tadpoles with T3 (5 nM) added to the aquarium water for 16 h, then analyzed mRNA levels in brain (region of the preoptic area/thalamus/hypothalamus) by RNA-sequencing or RTqPCR using relative quantification. (A) Venn diagram representing the numbers of T3-induced genes determined by RNA-sequencing conducted on RNA isolated from tadpole brains treated with or without T3. (B) Validation of gene regulation for four T3-induced genes found within the overlap between the WT and thramt−exon4 gene sets (109 genes). (C) Venn diagram representing the numbers of T3-repressed genes determined by RNA-sequencing conducted on RNA isolated from tadpole brains treated with or without T3. (D) Validation of gene regulation for four T3-repressed genes found within the overlap between the WT and thramt−exon4 gene sets (69 genes). Bars represent the mean ± SEM (n = 4/genotype/treatment). For comparisons of vehicle with T3 treated: *p < 0.01, **p < 0.001, ***p < 0.0001, Student's unpaired t-test. For comparisons of baseline mRNA levels (vehicle treated) among the two genotypes: #p < 0.01, Student's unpaired t-test.
For T3-repressed genes, only 4.2% (69 of 1,626) of the genes repressed by T3 in WT were regulated after loss of thra (Figure 4C). For genes common to WT and thramt−exon4, the majority had elevated baseline mRNA levels (fold change; dio3: WT = 3.2, thramt−exon4 = 2.6; st3: WT = 4.9, thramt−exon4 = 1.5; igf2: WT = 5.3, thramt−exon4 = 1.5; nc3r2: WT = 2.5, thramt−exon4 = 1.7). In comparing the level of gene repression by T3 of these 70 genes (log2 fold change > −0.5), we found that many of these genes exhibited reduced responses to the hormone (Supplemental Table 1); three examples that we validated by RTqPCR are shown in Figure 4D. While exogenous T3 caused significant decreases in mRNA levels in both genotypes, the level of gene repression was slightly reduced in thramt−exon4 compared with WT (% change relative to baseline; cbx7: WT = −70.2%, thramt−exon4 = −56%; znf395: WT = −184%, thramt−exon4 = −38%; crebrf : WT = −68%, thramt−exon4 = −42%). Also shown in Figure 4D is one example of a gene (egin3) that was repressed by T3 in WT (% change relative to baseline: −65%), but was not regulated in thramt−exon4; also, this gene's baseline mRNA level was not different among the two genotypes. There were 50 genes that were repressed by T3 in thramt−exon4 but not in WT.
Lastly, we identified 10 core cell cycle control genes in the list of genes regulated by T3 in WT, and then looked for these genes in the T3 regulated list from thramt−exon4 tadpoles. This showed several cyclins and cyclin-dependent kinases and an E2F transcription factor were regulated by T3 in WT brain (Table 2). However, none of these genes were changed by T3 in thramt−exon4 tadpole brain. We will provide a full gene ontology and pathway analysis of T3-regulated genes in wild type tadpole brain in a future publication.
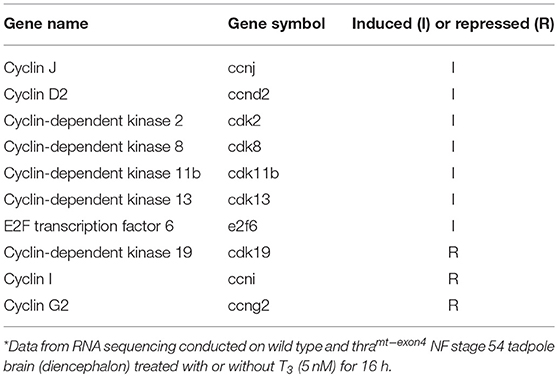
Table 2. Core cell cycle control genes regulated by T3 in wild type by not in thramt−exon4 premetamorphic tadpole brain*.
Thyroid hormone receptors, in the absence of ligand, are resident in chromatin bound to DNA, where they generate a closed chromatin state and repress gene transcription by recruiting corepressor complexes (8). Unliganded TRs function to repress gene transcription in premetamorphic tadpoles prior to endogenous TH synthesis, and this action is hypothesized to be important for maintaining the tadpole stage, a life cycle stage important for growth and dispersal (i.e., the dual-function model) (30). We hypothesized that loss of TRα would lead to de-repression of genes that are typically induced by T3, which would be reflected in increased baseline mRNA levels for these genes in thramt−exon4 tadpoles. Our RNA-seq analysis found 212 genes whose baseline mRNA levels were increased in thramt−exon4 tadpoles compared to WT; however, only 74 of these genes (35%) were regulated by T3 in WT (Figure 5A). Two examples of these genes analyzed by RTqPCR are shown in Figure 5B (fold change in baseline in thramt−exon4, pim3: 1.6; traf3: 1.5; see also thrb in Figure 3A). Of the 212 genes, 138 exhibited increased baseline mRNA levels thramt−exon4, but these genes were not regulated by T3 in WT.
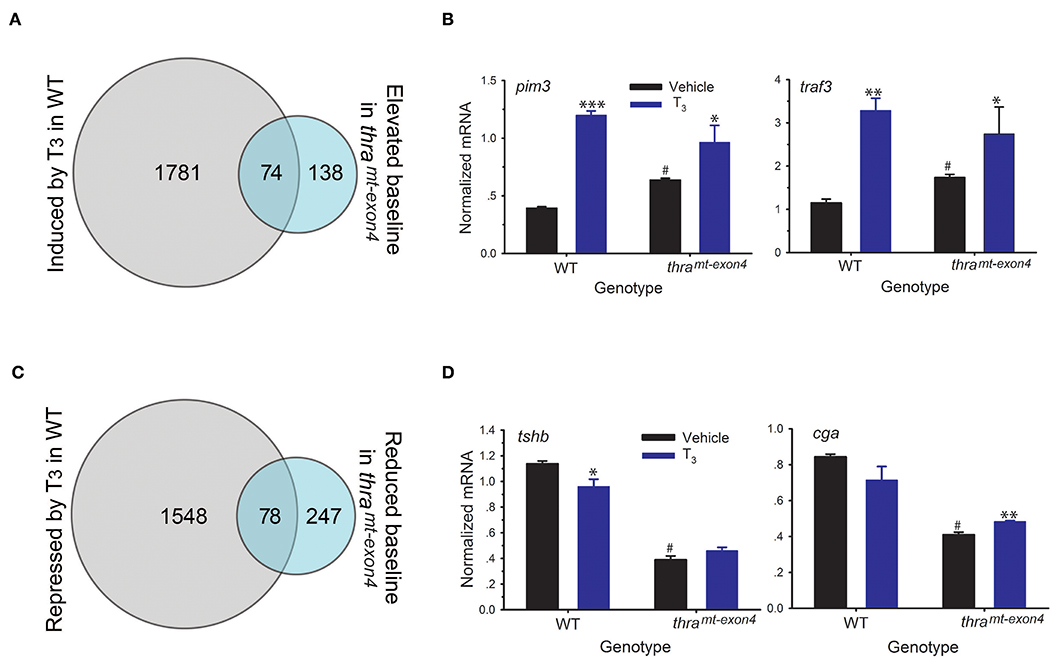
Figure 5. Effects of loss of TRα on baseline gene transcription in premetamorphic tadpole brain. We treated wild type (WT) and thramt−exon4 premetamorphic (NF stage 54) tadpoles with T3 (5 nM) added to the aquarium water for 16 h, then analyzed mRNA levels in brain (region of the preoptic area/thalamus/hypothalamus; including the pituitary) by RNA-sequencing or RTqPCR using relative quantification. (A) Venn diagram representing the number of T3-induced genes in WT and the number of genes whose baseline mRNA level was elevated in thramt−exon4 tadpoles, determined by RNA-sequencing conducted on RNA isolated from tadpole brains treated with or without T3. (B) Validation of gene regulation for two T3-induced genes found within the overlap between the T3 induced WT and elevated baseline in thramt−exon4 gene sets (74 genes). (C) Venn diagram representing the number of T3-repressed genes in WT and the number of genes whose baseline mRNA level was reduced in thramt−exon4 tadpoles, determined by RNA-sequencing conducted on RNA isolated from tadpole brains treated with or without T3. (D) Validation of gene regulation for two T3-repressed genes found within the overlap between the T3 repressed WT and reduced baseline in thramt−exon4 gene sets (78 genes). Bars represent the mean ± SEM (n = 4/genotype/treatment). For comparisons of vehicle with T3 treated: *p < 0.01, **p < 0.001, ***p < 0.0001, Student's unpaired t-test. For comparisons of baseline mRNA levels (vehicle treated) among the two genotypes: #p < 0.01, Student's unpaired t-test.
We also found 325 genes whose baseline mRNA level was reduced in thramt−exon4 tadpoles compared with WT (Figure 5C). Of the 325 genes, 78 (25%) corresponded to genes that were repressed by T3 in WT. The remaining 247 genes with elevated baseline mRNA levels in thramt−exon4 were not regulated by T3 in WT. Two examples of these genes analyzed by RTqPCR are shown in Figure 5D, one that was repressed by T3 in WT (tshb: change in baseline in thramt−exon4 = −66%) and one that was not significantly affected by T3 in WT (cga: change in baseline in thramt−exon4 = −51%). These two genes code for subunits of the glycoprotein hormone thyroid stimulating hormone (TSH; tshb—TSHβ, cga—common glycoprotein subunit alpha); note that the region of the tadpole brain that we dissected for RNA-seq analysis contained the pituitary gland.
Discussion
Here we show that TRα is required for T3-dependent cell expansion in Xenopus tadpole brain during metamorphosis, which supports previous findings that used non-genetic approaches (10). The thra mRNA is 135 times more abundant than thrb mRNA, supporting that this is the major TR subtype in premetamorphic tadpole brain (10, 31). Furthermore, we found that TRα is required for 95% of the gene regulation responses to T3 in premetamorphic tadpole brain. Genes that were regulated by T3 in both genotypes exhibited impaired gene regulation responses in TRa knockout tadpole brain, both in their kinetics and magnitude of induction.
In the unliganded state, TRs are resident in chromatin where they recruit co-repressors to generate a compact chromatin state, and repress gene transcription. Hormone binding to TRs results in the exchange of co-repressors for co-activators, which generates an open chromatin environment promoting gene transcription (8). Current evidence supports that TRs have two general roles in tadpoles related to their repressor and activator functions, which is referred to as the dual function model (30, 32–34). During premetamorphosis, before the thyroid gland is developed and producing T3, when existing TRs are in the unliganded form, TRs (predominantly TRα) repress gene transcription required for transformation of the tadpole into the juvenile adult, thereby maintaining the tadpole stage. When T3 production rises during prometamorphosis, the aporeceptor is converted to a transcriptional activator, recruiting histone modifying enzymes that generate an open chromatin structure required for active transcription. The TRα is hypothesized to be necessary to establish competence of cells to respond to T3 (30).
Earlier findings from our laboratory showed that mitosis in neurogenic zones of the tadpole brain increased dramatically at the beginning of metamorphosis, and reached a peak at NF stage 56, which correlated with rising plasma T3 concentration (10). Neural cell proliferation can be induced precociously by the addition of T3 to the aquarium water of premetamorphic tadpoles (NF stage 50–52); whereas, we found that cell proliferation in prometamorphic tadpole brain was reduced to premetamorphic levels by treatment with the goitrogen methimazole, which blocks the endogenous rise in plasma T3. We also provided strong evidence that the action of T3 on neural cell proliferation is mediated by TRα. For example, using ISHH and IHC, we found that TRα is highly expressed in neurogenic zones of tadpole brain, with strongest expression in proliferating cells. Furthermore, treatment with the TRα selective agonist CO23 induced mitosis. By contrast, we found that TRβ was expressed outside of neurogenic zones where neural cells undergo migration and differentiation, and treatment of tadpoles with two TRβ selective ligands, GC1 and GC24, at concentrations that preferentially activate TRβ, failed to induce cell proliferation (10, 35). These findings, using pharmacological agents combined with histochemistry, support the view that the TRα mediates hormone action on mitosis in tadpole brain.
Our current findings using mutant tadpoles deficient in TRα provide additional support for this model. We found that the thramt−exon4 tadpoles had proportionally smaller brains corrected for body size, both during prometamorphosis when cell proliferation is maximal, and in the newly metamorphosed juvenile frog. This may be explained by our finding that early prometamorphic thramt−exon4 tadpoles had fewer pH3-positive cell nuclei in their brains compared with WT. These differences between the two genotypes is likely due to complete impairment of T3 dependent cell proliferation, since we found that premetamorphic thramt−exon4, unlike WT tadpoles, were totally resistant to exogenous T3 effects on gross morphological changes, and pH3-ir in the brain. Taken together with our previous work (10), these new findings provide strong support for an essential role for TRα in T3-dependent neurogenesis in Xenopus tadpole brain.
We saw a small (~30%), but statistically significant decrease in pH3-ir after T3 treatment in thramt−exon4 tadpole brain. This may be due to the upregulation of thrb in the absence of the proliferative actions of liganded TRα, since several lines of evidence support that TRβ functions to limit cell proliferation, and induce cell differentiation. The level of thrb mRNA in tadpole brain is low or non-detectable during premetamorphosis, then rises during prometamorphosis in response to increasing plasma T3 titer, and peaks at metamorphic climax when most cells in the brain have exited the cell cycle, migrated, and are in the process of differentiating and maturing (10, 23). Experiments using the TRβ specific T3 analog GC1 support the view that TRβ functions in cell differentiation and apoptosis (10, 36). Thyroid hormone receptor β is expressed predominantly outside of neurogenic zones in tadpole brain (10), consistent with a role in cell migration and differentiation. We hypothesize that the reduction in pH3-ir that we observed in thramt−exon4 tadpole brain after treatment with T3 is due to the actions of TRβ, which is autoinduced in thramt−exon4 tadpole brain as it is in WT (see Figure 3A). With the loss of TRα, the ability of T3 to induce cell proliferation is lost; whereas, induction of TRβ may promote neural progenitors to exit the cell cycle and to differentiate.
Our results support that TRα is the major TR subtype expressed in tadpole brain, and its loss leads to profound deficits in gene regulation responses to T3. Until now, analysis of gene regulation in thra mutant tadpoles was limited to a handful of known T3 regulated genes (20, 22, 37, 38). Here we used RNA-seq after treatment with T3 to provide an unbiased, transcriptomic analysis of the effects of loss of TRα on gene regulation in tadpole brain. This showed that only 5.1% of the genes regulated by T3 in WT tadpole brain were similarly regulated in thramt−exon4 animals. Furthermore, genes that were regulated by T3 in both genotypes exhibited impaired responses to the hormone in thramt−exon4 tadpole brain. For three well-known direct T3 response genes (thrb, klf9, thibz), we saw impaired kinetics in response to the hormone, and also a reduction in the maximal level of gene induction. This suggests that, while this subset of genes can be regulated by TRβ, and indeed, their delayed response likely reflects the time required to autoinduce thrb and produce functional TRβ protein, TRα is required for the initial and maximal response to the hormone. Taken together, the data support that TRα is required for cells to become competent to respond to the hormone, and to maintain a sustained response (30).
Interestingly, we found that 57.5% of the genes regulated by T3 in thramt−exon4 were only regulated in the mutant genotype and not in WT. This may be explained by TRα having a normal function of counteracting T3 actions on gene transcription mediated by TRβ, which are unmasked when TRα is lost. This is supported by findings in the mammalian pituitary thyrotrophic cell line Tα1T, where TRα is recruited to the Tshb gene promoter only after knockdown of TRβ (39).
The loss of TRα also affected the baseline mRNA level of some genes (212 increased, 325 decreased in thramt−exon4). However, only 35% of the genes whose baseline mRNA levels were increased after loss of TRα were induced by T3 in WT. The increase in baseline mRNA levels of T3 regulated genes after loss of TRα is likely due to loss of the repressor actions of unliganded TRα, as has been shown previously (20, 22, 37, 38). Interestingly, baseline transcription (vehicle treated) of a subset of genes (325) was reduced in the absence of TRα, supporting that this unliganded nuclear receptor is necessary to support gene transcription in the absence of hormone. Of these genes, 24% were also repressed by T3 in WT. Taken together, our findings support that TRα is not only required for gene regulation responses to T3 in tadpole brain, but also plays an important role in maintaining normal baseline gene transcription. This supports studies conducted on other tadpole tissues that showed dysregulation of baseline gene transcription in TRα knockout tadpoles (20, 22, 37, 38).
Lastly, our RNA-seq analysis provides a molecular basis for the loss of T3-dependent cell proliferation that we saw in thramt−exon4 tadpole brain. We found 10 core cell cycle control genes that were induced by T3 in WT, but not in thramt−exon4 tadpole brain. These included several cyclins, cyclin-dependent kinases and an E2F transcription factor. Taken together, our findings support the view that the TRα is the major TR subtype expressed in tadpole brain, and it is required for T3 action on cell proliferation. The vast majority of genes regulated by T3 in tadpole brain, both induced and repressed, depend on TRα.
Data Availability
The datasets generated for this study can be found in GEO, GSE130816.
Ethics Statement
All procedures involving animals were conducted under an approved animal use protocol (PRO00006809) in accordance with the guidelines of the Institutional Animal Care and Use Committee at the University of Michigan.
Author Contributions
LW designed and conducted experiments, analyzed data, and helped to write the manuscript. CH conducted experiments, analyzed data, and helped to write the manuscript. CS analyzed data and helped to write the manuscript. RD designed experiments, analyzed data, and wrote the manuscript.
Funding
This research was supported by NSF grant IOS 1456115 to RD.
Conflict of Interest Statement
The authors declare that the research was conducted in the absence of any commercial or financial relationships that could be construed as a potential conflict of interest.
Acknowledgments
We are grateful to Yun-Bo Shi for providing the TRαM5 frog line (thramt−exon4) and the plasmids pCR-TOPO-xtTRα and T7TS-xtTRβ. We thank Nicolas Buisine and Laurent Sachs for supplying the custom annotation for the X. tropicalis genome.
Supplementary Material
The Supplementary Material for this article can be found online at: https://www.frontiersin.org/articles/10.3389/fendo.2019.00396/full#supplementary-material
References
1. Porterfield SP, Hendrich CE. The role of thyroid hormones in prenatal and neonatal neurological development–current perspectives. Endocr Rev. (1993) 14:94–106. doi: 10.1210/er.14.1.94
2. Oppenheimer JH, Schwartz HL. Molecular basis of thyroid hormone-dependent brain development. Endo Rev. (1997) 18:462–74. doi: 10.1210/edrv.18.4.0309
3. Flamant F, Gauthier K, Richard S. Genetic investigation of thyroid hormone receptor function in the developing and adult brain. In: Douglas Forrest ST, editor. Current Topics in Developmental Biology: Nuclear Receptors in Development and Disease, Vol. 125. Cambridge, MA: Academic Press; Elsevier (2017). p. 303–35.
5. Shi YB. Amphibian Metamorphosis: From Morphology to Molecular Biology. New York, NY: Wiley-Liss (2000).
6. Buchholz DR. More similar than you think: frog metamorphosis as a model of human perinatal endocrinology. Dev Biol. (2015) 408:188–95. doi: 10.1016/j.ydbio.2015.02.018
7. Nunez J, Celi FS, Ng L, Forrest D. Multigenic control of thyroid hormone functions in the nervous system. Mol Cell Endocrinol. (2008) 287:1–12. doi: 10.1016/j.mce.2008.03.006
8. Cheng SY, Leonard JL, Davis PJ. Molecular aspects of thyroid hormone actions. Endocr Rev. (2010) 31:139–70. doi: 10.1210/er.2009-0007
9. Yaoita Y, Brown DD. A correlation of thyroid hormone receptor gene expression with amphibian metamorphosis. Genes Dev. (1990) 4:1917–24. doi: 10.1101/gad.4.11.1917
10. Denver RJ, Hu F, Scanlan TS, Furlow JD. Thyroid hormone receptor subtype specificity for hormone-dependent neurogenesis in Xenopus laevis. Dev Biol. (2009) 326:155–68. doi: 10.1016/j.ydbio.2008.11.005
11. Mellstrom B, Naranjo JR, Santos A, Antonio, Gonzalez M, Bernal J. Independent expression of the alpha and beta c-erba genes in developing rat brain. Molecul Endocrinol. (1991) 5:1339–50. doi: 10.1210/mend-5-9-1339
12. Bradley DJ, Towle HC, Young WS III. Spatial and temporal expression of alpha- and beta-thyroid hormone receptor mRNAs, including the beta 2-subtype, in the developing mammalian nervous system. J Neurosci. (1992)12:2288–302. doi: 10.1523/JNEUROSCI.12-06-02288.1992
13. Jones I, Srinivas M, Ng L, Forrest D. The thyroid hormone receptor beta gene: structure and functions in the brain and sensory systems. Thyroid. (2003) 13:1057–68. doi: 10.1089/105072503770867228
14. Kawahara A, Baker BS, Tata JR. Developmental and regional expression of thyroid hormone receptor genes during Xenopus metamorphosis. Development. (1991) 112:933–43.
15. Lemkine GF, Raji A, Alfama G, Turque N, Hassani Z, Alegria-Prevot O, et al. Adult neural stem cell cycling in vivo requires thyroid hormone and its alpha receptor. FASEB J. (2005) 19:863–5. doi: 10.1096/fj.04-2916fje
16. Billon N, Tokumoto Y, Forrest D, Raff M. Role of thyroid hormone receptors in timing oligodendrocyte differentiation. Dev Biol. (2001) 235:110–20. doi: 10.1006/dbio.2001.0293
17. Morte B, Manzano J, Scanlan TS, Vennstrom B, Bernal J. Aberrant maturation of astrocytes in thyroid hormone receptor alpha 1 knockout mice reveals an interplay between thyroid hormone receptor isoforms. Endocrinology. (2004) 145:1386–91. doi: 10.1210/en.2003-1123
18. Denver RJ. The molecular basis of thyroid hormone-dependent central nervous system remodeling during amphibian metamorphosis. Comp Biochem Physiol C-Pharmacol Toxicol Endocrinol. (1998) 119:219–28. doi: 10.1016/S0742-8413(98)00011-5
19. Kikuyama S, Kawamura K, Tanaka S, Yamamoto K. Aspects of amphibian metamorphosis - hormonal control. Int Rev Cytol. (1993) 145:105–48. doi: 10.1016/S0074-7696(08)60426-X
20. Wen L, Shi YB. Unliganded thyroid hormone receptor α controls developmental timing in Xenopus tropicalis. Endocrinology. (2015) 156:721–34. doi: 10.1210/en.2014-1439
21. Nieuwkoop PD, Faber J. Normal Table of Xenopus laevis (Daudin). New York, NY: Garland Publishing Inc. (1994).
22. Wen L, Shibata Y, Su D, Fu LZ, Luu N, Shi YB. Thyroid hormone receptor a controls developmental timing and regulates the rate and coordination of tissue-specific metamorphosis in Xenopus tropicalis. Endocrinology. (2017) 158:1985–98. doi: 10.1210/en.2016-1953
23. Hu F, Knoedler JR, Denver RJ. A mechanism to enhance cellular responsivity to hormone action: kruppel-like factor 9 promotes thyroid hormone receptor-β autoinduction during postembryonic brain development. Endocrinology. (2016) 157:1683–93. doi: 10.1210/en.2015-1980
24. Crespi E, Denver R. Leptin (ob gene) of the South African clawed frog Xenopus laevis. Proc Natl Acad Sci USA. (2006) 103:10092–97. doi: 10.1073/pnas.0507519103
25. Yao M, Stenzel-Poore M, Denver RJ. Structural and functional conservation of vertebrate corticotropin-releasing factor genes: evidence for a critical role for a conserved cyclic AMP response element. Endocrinology. (2007) 148:2518–31. doi: 10.1210/en.2006-1413
26. Tuinhof R, Ubink R, Tanaka S, Atzori C, van Strien FJC, Roubos EW. Distribution of pro-opiomelanocortin and its peptide end products in the brain and hypophysis of the aquatic toad, Xenopus laevis. Cell Tissue Res. (1998) 292:251–65. doi: 10.1007/s004410051056
27. Yao M, Westphal N, Denver R. Distribution and acute stressor-induced activation of corticotrophin-releasing hormone neurones in the central nervous system of Xenopus laevis. J Neuroendocrinol. (2004) 16:880–93. doi: 10.1111/j.1365-2826.2004.01246.x
28. Furlow JD, Kanamori A. The transcription factor basic transcription element-binding protein 1 is a direct thyroid hormone response gene in the frog Xenopus laevis. Endocrinology. (2002) 143:3295–305. doi: 10.1210/en.2002-220126
29. Bagamasbad P, Howdeshell KL, Sachs LM, Demeneix BA, Denver RJ. A role for basic transcription element-binding protein 1 (BTEB1) in the autoinduction of thyroid hormone receptor beta. J Biol Chem. (2008) 283:2275–85. doi: 10.1074/jbc.M709306200
30. Shi YB, Wong J, PuzianowskaKuznicka M, Stolow MA. Tadpole competence and tissue-specific temporal regulation of amphibian metamorphosis: roles of thyroid hormone and its receptors. Bioessays. (1996) 18:391–9. doi: 10.1002/bies.950180509
31. Eliceiri BP, Brown DD. Quantitation of endogenous thyroid hormone receptors alpha and beta during embryogenesis and metamorphosis in Xenopus laevis. J Biol Chem. (1994) 269:24459–65.
32. Sachs LM, Damjanovski S, Jones PL, Li Q, Amano T, Ueda S, et al. Dual functions of thyroid hormone receptors during Xenopus development. Comp Biochem Physiol B-Biochem Mol Biol. (2000) 126:199–211. doi: 10.1016/S0305-0491(00)00198-X
33. Buchholz DR, Paul BD, Fu LZ, Shi YB. Molecular and developmental analyses of thyroid hormone receptor function in Xenopus laevis, the African clawed frog. Gen Compar Endocrinol. (2006) 145:1–19. doi: 10.1016/j.ygcen.2005.07.009
34. Buchholz DR, Shi YB. Dual function model revised by thyroid hormone receptor alpha knockout frogs. Gen Compar Endocrinol. (2018) 265:214–8. doi: 10.1016/j.ygcen.2018.04.020
35. Furlow JD, Yang HY, Hsu M, Lim W, Ermio DJ, Chiellini G, et al. Induction of larval tissue resorption in Xenopus laevis tadpoles by the thyroid hormone receptor agonist GC-1. J Biol Chem. (2004) 279:26555–62. doi: 10.1074/jbc.M402847200
36. Furlow JD, Neff ES. A developmental switch induced by thyroid hormone: Xenopus laevis metamorphosis. Trends Endocrinol Metabol. (2006) 17:38–45. doi: 10.1016/j.tem.2006.01.007
37. Choi JY, Suzuki KT, Sakuma T, Shewade L, Yamamoto T, Buchholz DR. Unliganded thyroid hormone receptor α regulates developmental timing via gene repression in Xenopus tropicalis. Endocrinology. (2015) 156:735–44. doi: 10.1210/en.2014-1554
38. Choi J, Ishizuya-Oka A, Buchholz DR. Growth, development, and intestinal remodeling occurs in the absence of thyroid hormone receptor α in tadpoles of Xenopus tropicalis. Endocrinology. (2017) 158:1623–33. doi: 10.1210/en.2016-1955
Keywords: thyroid hormone (T3), metamorphosis, Xenopus, neurogenesis, development, knockout (KO)
Citation: Wen L, He C, Sifuentes CJ and Denver RJ (2019) Thyroid Hormone Receptor Alpha Is Required for Thyroid Hormone-Dependent Neural Cell Proliferation During Tadpole Metamorphosis. Front. Endocrinol. 10:396. doi: 10.3389/fendo.2019.00396
Received: 02 April 2019; Accepted: 05 June 2019;
Published: 28 June 2019.
Edited by:
Marco António Campinho, Center of Marine Sciences (CCMAR), PortugalReviewed by:
Larissa C. Faustino, Albert Einstein College of Medicine, United StatesPaul Webb, California Institute for Regenerative Medicine, United States
Copyright © 2019 Wen, He, Sifuentes and Denver. This is an open-access article distributed under the terms of the Creative Commons Attribution License (CC BY). The use, distribution or reproduction in other forums is permitted, provided the original author(s) and the copyright owner(s) are credited and that the original publication in this journal is cited, in accordance with accepted academic practice. No use, distribution or reproduction is permitted which does not comply with these terms.
*Correspondence: Robert J. Denver, cmRlbnZlckB1bWljaC5lZHU=
†Present Address: Luan Wen, Shenzhen Key Laboratory of Synthetic Genomics and Center for Synthetic Genomics, Institute of Synthetic Biology, Shenzhen Institutes of Advanced Technology, Chinese Academy of Sciences, Shenzhen, China
Cara He, Department of Integrative Biology, University of California, Berkeley, Berkeley, CA, United States
Christopher J. Sifuentes, Takara Bio USA, Ann Arbor, MI, United States