 María Paz Hernández-Cáceres1,2‡Lilian Toledo-Valenzuela1,2‡Francisco Díaz-Castro2,3Yenniffer Ávalos1,2†Paulina Burgos1,2Carla Narro1,2Daniel Peña-Oyarzun2,4,5Jasson Espinoza-Caicedo1,2Flavia Cifuentes-Araneda1,2Fernanda Navarro-Aguad6Cecilia Riquelme6Rodrigo Troncoso2,3,4Alfredo Criollo2,4,5
 Eugenia Morselli1,2*
- 1Laboratory of Autophagy and Metabolism, Department of Physiology, Faculty of Biological Sciences, Pontificia Universidad Católica de Chile, Santiago, Chile
- 2Autophagy Research Center, Santiago, Chile
- 3Research Laboratory of Nutrition and Physical Activity, Institute of Nutrition and Food Technology, Universidad de Chile, Santiago, Chile
- 4Advanced Center for Chronic Diseases and Center for Molecular Studies of the Cell, Universidad de Chile, Santiago, Chile
- 5Facultad de Odontología, Instituto de Investigación en Ciencias Odontológicas, Universidad de Chile, Santiago, Chile
- 6Laboratory of Differentiation and Pathology, Department of Cell and Molecular Biology, Faculty of Biological Sciences, Pontificia Universidad Católica de Chile, Santiago, Chile
Chronic consumption of high fat diets (HFDs), rich in saturated fatty acids (SatFAs) like palmitic acid (PA), is associated with the development of obesity and obesity-related metabolic diseases such as type II diabetes mellitus (T2DM). Previous studies indicate that PA accumulates in the hypothalamus following consumption of HFDs; in addition, HFDs consumption inhibits autophagy and reduces insulin sensitivity. Whether malfunction of autophagy specifically in hypothalamic neurons decreases insulin sensitivity remains unknown. PA does activate the Free Fatty Acid Receptor 1 (FFAR1), also known as G protein-coupled receptor 40 (GPR40); however, whether FFAR1 mediates the effects of PA on hypothalamic autophagy and insulin sensitivity has not been shown. Here, we demonstrate that exposure to PA inhibits the autophagic flux and reduces insulin sensitivity in a cellular model of hypothalamic neurons (N43/5 cells). Furthermore, we show that inhibition of autophagy and the autophagic flux reduces insulin sensitivity in hypothalamic neuronal cells. Interestingly, the inhibition of the autophagic flux, and the reduction in insulin sensitivity are prevented by pharmacological inhibition of FFAR1. Our findings show that dysregulation of autophagy reduces insulin sensitivity in hypothalamic neuronal cells. In addition, our data suggest FFAR1 mediates the ability of PA to inhibit autophagic flux and reduce insulin sensitivity in hypothalamic neuronal cells. These results reveal a novel cellular mechanism linking PA-rich diets to decreased insulin sensitivity in the hypothalamus and suggest that hypothalamic autophagy might represent a target for future T2DM therapies.
Introduction
Obesity is currently considered a global epidemic both in developed and developing countries. Excessive accumulation of body fat promotes obesity-associated metabolic dysfunctions, such as insulin resistance, type II diabetes mellitus (T2DM), cardiovascular diseases, neurodegeneration, and certain cancers (1).
Consumption of high fat diets (HFDs), and especially of diets high in saturated fatty acids (SatFAs) such as the palmitic acid (PA), increases body weight and is associated with the onset of several metabolic diseases, such as insulin resistance and T2DM (2, 3). Previous studies from our and other groups show that SatFAs accumulate in the central nervous system (CNS), specifically in the hypothalamus (4–7). Interestingly, fatty acid (FA) sensing neurons reside in the hypothalamus and play important roles in feeding behavior, as well as lipid and glucose metabolism. Due to their critical role in the regulation of energy homeostasis, these neuronal populations have been implicated in development of obesity and T2DM (8, 9).
Macroautophagy, hereafter referred to as “autophagy,” is a conserved adaptive mechanism that maintains the balance between synthesis, degradation, and recycling of cellular components (10). Autophagy supports cellular homeostasis and studies in multiple cell types have demonstrated autophagic dysregulation following chronic consumption of HFDs (11). Previous studies from our and other groups have shown that hypothalamic autophagic flux is defective in rodents chronically fed with HFDs (12, 13). Consistently, previous work demonstrates that the inhibition of autophagy in proopiomelanocortin (POMC) neurons leads to metabolic disorders, including obesity and insulin resistance (14–16); however the mechanism by which this occurs is still largely unknown.
Evidence exists of crosstalk between autophagy and insulin signaling pathways. For example, hyperinsulinemia reduces the autophagic response in different peripheral tissues and cell types (17–20), whereas inhibition of autophagy (by autophagy related gene 7 -ATG7- tissue-specific knockout) promotes insulin resistance in liver tissue (21) and reduces insulin secretion in pancreatic β-cells (22, 23). However, whether inhibition of autophagy directly reduces neuronal insulin sensitivity is currently unknown.
The Free Fatty Acid Receptor 1 (FFAR1), also known as G protein-coupled receptor 40 (GPR40), is a seven-transmembrane domain receptor activated by medium and long-chain fatty acids, including PA (24, 25). Previous studies in GPR40−/− mice show that this receptor plays a significant role in the chain of events linking obesity and metabolic disorders, as GPR40−/− mice are protected from obesity-induced hyperinsulinemia, hyperglycemia, and glucose intolerance (26). Moreover, FFAR1 is required to mediate the insulin response to FA in the pancreas (27–29). However, its function in the hypothalamus, specifically in the context of autophagy and insulin sensitivity, is not known.
Here, we demonstrate that exposure to the SatFA PA inhibits the autophagic flux and reduces insulin sensitivity in N43/5 cells, a hypothalamic neuronal cell line. Furthermore, our findings show that autophagy malfunction promotes insulin resistance in hypothalamic neuronal cells. In addition, our data suggest FFAR1 may link PA with reduced insulin sensitivity and impaired autophagic flux in hypothalamic neuronal cells. Altogether, these results suggest activation of autophagy should be considered as treatment for insulin resistance.
Materials and Methods
Cell Culture and Treatments
N43/5 cells (Cellutions Biosystems) were cultured in Dulbecco's modified eagle medium (DMEM) high glucose (11995-040, Gibco, USA) supplemented with 10% of fetal bovine serum (FBS) (10437028, Gibco), 100 U/ml penicillin streptomycin (15140122, Gibco) and maintained at 37 °C with 5% CO2. To evaluate the changes in the autophagic flux in response to PA exposure, cells were incubated with DMEM high glucose supplemented with 2% of FBS 24 h before treatments and then exposed to 100 μM PA (P0500, Sigma-Aldrich, St. Louis, MO, USA) conjugated to fatty acid-free bovine serum albumin (BSA) (152401, MP Biomedicals, Santa Ana, CA, USA). BSA treatment was used as control. To assess the autophagic flux and insulin response, cells were incubated at the time points indicated in each experiment with the autophagic flux inhibitor Bafilomycin A1 (BafA1, 100 nM) (B1793, Sigma-Aldrich) or with its vehicle DMSO (BM-0660, Winkler). To determine the effect of 6-h treatment with PA or BafA1 on insulin signaling, cells were serum starved in medium DMEM/F-12 (11330-32, Gibco) overnight prior to treatments. Then, cells were co-treated with insulin (1 nM) (I0516, Sigma-Aldrich) or phosphate-buffered saline (PBS). To evaluate the involvement of FFAR1 in PA-mediated inhibition of the autophagic flux or reduction in insulin signaling, cells were pre-incubated with the FFAR1 antagonist GW1100 (1 μM; CAS 306974-70-9, Calbiochem, San Diego, CA, USA) for 20 min or with its vehicle (DMSO), followed by co-incubation with PA or BSA at the indicated time point, depending on the readouts.
Animals
Animal care and procedures were approved by the Ethical Committee of the Pontificia Universidad Católica de Chile. Male C57BL/6 mice were housed in a temperature-controlled environment in groups of two to four at 22–24°C using a 12 h light/dark cycle. Mice were fed a standard chow (Prolab® RMH3000).
Animals Gavage
Mice (n = 3–5/group) received an intragastric gavage of nutritionally complete diet as described by Benoit et al. (30). Briefly, the PA diet contains 20 g fat/100 g diet (19 g of ethyl palmitate dissolved in medium-chain triglyceride and 1 g of soybean oil to provide essential fatty acids), while the control diet contains 3 g ethyl palmitate and 1 g soybean oil/100 g diet. This liquid diet was injected into the stomach of the mice using a gavage-feeding needle. Mice were given 3 equally sized feedings daily at 7:00 AM, 12:00 PM, and 5:00 PM for 3 days. At the end of day 3, mice were sacrificed 3 h after the final gavage. Brains were removed, hypothalami dissected and stored in RNAlater (Ambion, Life Technologies) at 4 °C. 24 h later, tissues were homogenized in 1 ml of TRIzol (Ambion, Life Technologies) and RNA was extracted using the RNeasy Kit (Qiagen Sciences, Inc., Germantown, MD, USA) according to the manufacturer's instructions. Total RNA (1 μg) was reverse transcribed using the SuperScript III First-Strand Synthesis System (Invitrogen) according to the manufacturer's instructions and cDNA was used for RT-PCR assays.
siRNA Transfections
Cells were cultured in six-well plates and transfected at 50% confluence with siRNAs targeting murine Beclin 1 (BECN1) (SASI_Mm01_00048143, Sigma-Aldrich) or murine autophagy related gene 7 (ATG7) (SASI_Mm01_00044616, Sigma-Aldrich). Transfection was performed using Lipofectamine RNAiMAX® Transfection Reagent (Invitrogen, Carlsbad, CA, USA) according to the manufacturer's instructions. As negative control, cells were incubated with Lipofectamine RNAiMAX® Transfection Reagent only. 48 h after siRNA transfection, cells were treated as indicated or directly lysed for protein or RNA extraction.
Western Blot Analysis
Cells were lysed in RIPA buffer and 30–40 μg of denatured proteins from each sample were resolved in 8–12% SDS-PAGE. Gels were transferred to nitrocellulose membranes and incubated with 5% BSA (BM-0150, Winkler, RM, Chile)-tris-buffered saline-0.1% Tween-20 (TBS-T) to block nonspecific binding. Membranes were incubated with the primary antibodies anti LC3A/B (4108, Cell Signaling Technology, Danvers, MA, USA), SQSTM1 (H00008878-M01, Abnova, Jhouzih St., Taipei, Taiwan), p-Insulin Receptor β (Tyr1150/1151) (3024, Cell Signaling Technology), IR (ab131238, Abcam), p-AKT (Ser473) (9271, Cell Signaling Technology), AKT (9272, Cell Signaling Technology), BECN1 (H-300; sc-11427, Santa Cruz Biotechnology, Inc., Dallas, Texas, USA), at dilution of 1:1,000 in 5% BSA-TBS-T overnight on a rocking platform at 4 °C. Then, membranes were washed 3 times for 10 min in TBS-T and revealed with the appropriate horseradish peroxidase-labeled secondary antibodies (Goat Anti-Mouse IgG (H + L)-HRP Conjugate, 1706516; Goat Anti-Rabbit IgG (H + L)-HRP Conjugate, 1706515; Bio-Rad, CA, USA) and the chemiluminescent substrate. GAPDH (1:1000; sc-365062, Santa Cruz Biotechnology, Inc.) and β-actin (1:10,000; A1978, Sigma-Aldrich) were used as loading control. To evaluate insulin signaling the same samples were run on parallel gels, one for p-AKT and the other for AKT. Analysis of data was performed by comparing p-AKT vs. β-actin and AKT vs. β-actin. The obtained ratios were analyzed.
Immunofluorescence and Fluorescence Microscopy
For fluorescence microscopy determinations in N43/5 cells, cells cultured on coverslips were fixed with cold methanol (−20 °C) for 10 min. Cells were blocked in 3% BSA in PBS for 1 h and then incubated with the following primary antibodies overnight at 4 °C. The primary antibodies used are LC3A/B (1:250; Cell Signaling Technology), p62/SQSTM1 (1:300; Abnova). Primary antibodies staining was followed by conjugation with its respective secondary antibody (1:300; Alexa Fluor®, Life Technologies) for 1 h at room temperature. Nuclei were counterstained with Hoechst 33342 (10 mg/ml) (Molecular Probes, Eugene, OR, USA) or with ProLong® Gold Antifade Mountant (P36931, Molecular Probes, Eugene, OR, USA). Images were taken in an inverted fluorescence microscopy (Nikon Eclipse Ti, Tokio, Japon).
For fluorescence microscopy determinations on brain sections, mice were anesthetized and perfused with 10% formalin. Brains were dissected and post-fixed in 10% formalin for 24 h followed by treatment with 30% sucrose in PBS. Brain sections were cut at 30 μm using a Thermo Scientific HM 450 sliding microtome (Thermo Scientific). The sections were permeabilized in 0.01% Triton and blocked in 3% bovine BSA (BM-0150 Winkler) for 1 h. Brain sections were incubated overnight at 4 °C with the primary antibody against GPR40 (Y17; sc-28416, Santa Cruz Biotechnology, Inc.) in combination with either a marker of neurons (NeuN; MAB377, Millipore, Burlington, MA, USA), astrocytes (GFAP; G9269, Sigma-Aldrich) or microglia (IBA-1; 019-19741, Wako, USA), followed by conjugation with the respective secondary antibodies (Alexa Fluor, Life Technologies) for 1 h at room temperature. Sections were placed on gelatinized slides, mounted with VECTASHIELD anti-fading medium with DAPI (Vector Laboratories), and coverslipped. Pictures containing the arcuate nucleus (ARC) region of the hypothalamus were taken in a confocal fluorescence microscopy (Carl Zeiss, LSM700, Oberkochen, Germany).
Real Time PCR (RT-PCR)
For analysis of gene expression, mice were anesthetized and decapitated. Tissues were stored in RNAlater (Ambion, Life Technologies) at 4° C, and 24 h later, hypothalami dissected and then homogenized in 1 ml of TRIzol (Ambion, Life Technologies). RNA was extracted using the RNeasy Kit (Qiagen Sciences, Inc., Germantown, MD, USA) according to the manufacturer's instructions. Total RNA (1 μg) was reverse transcribed using the SuperScript III First-Strand Synthesis System (Invitrogen) according to the manufacturer's instructions.
For analysis of Atg7 gene expression in N43/5 cells, RNA was extracted using the E.Z.N.A.® Total RNA Kit (OMEGA Bio-Tek, Norcross, GA, USA) according to the manufacture's indications. cDNA was synthesized using iScriptTM cDNA kit (Bio-Rad) from 1 μg of total RNA.
Quantitative PCR reactions were carried out on a Step One System Real Time PCR (Applied Biosystems) using Fast SYBR Green Master Mix (4385370, Life Technologies). Specific forward and reverse primers sequences used to evaluate gene expression are indicated in Supplemental Table 1. Hprt1 was used as housekeeping gene. The ΔΔCT method was used for relative quantification analysis.
Intracellular Calcium Measurement
Intracellular calcium (Ca2+) was determined using a spectrofluorometric technique described by Darling R.A. and collaborators (31). N43/5 cells were loaded with 1.5 μM Fura 2-AM (Molecular Probes) for 45 min at 37 °C. Cells were excited at a wavelength of 340 and 380 nm in a Nikon Diaphot microscope equipped with a Photon Technology International spectrofluorometer (Lawrenceville, NJ). To confirm the presence of a functional FFAR1 in our cellular model, cells were pre-incubated with its antagonist GW1100 (1 μM) for 20 min. After 10 min of stabilization, the intensity ratio was continuously recorded and cultures were co-stimulated for 210 seconds with 100 μM PA or BSA. Fluorescence emission intensity was detected with a photomultiplier and analyzed using a fluorescence analysis program (FELIX version 1.1).
2-NBDG Uptake
To assess the insulin-dependent glucose uptake, N43/5 cells were stimulated with insulin 1 nM for 30 min and incubated with the fluorescent analog of glucose (2-NBDG, 300 mM) for 15 min at 37 °C as previously described (32). To evaluate the involvement of FFAR1 in PA-mediated inhibition of insulin-dependent glucose uptake, cells were pre-incubated with the FFAR1 antagonist GW1100. Cells were transferred to an inverted Nikon Ti Eclipse microscope equipped with 40X oil objective [numerical aperture, N.A. 1.3]. A Xenon lamp was coupled to the monochromator device (Cairn Research Ltd, Faversham, UK). Digital images were acquired by means of a cooled CCD camera (Hamamatsu ORCA 03, Japan). Images were quantified by ImageJ software (NIH, Bethesda, MD).
Results and Statistical Analysis
Results are shown as mean ± SEM from at least 3 independent experiments. Two groups were compared using two-tailed Student's t tests. For more than two groups, one- or two-way ANOVA was used, as appropriate, followed by post hoc adjustment. All analyses were performed with GraphPad software (San Diego, CA, USA). P value of < 0.05 was considered statistically significant.
Results
Palmitic Acid Inhibits the Autophagic Flux in N43/5 Cells
We and others have previously shown that autophagy is dysregulated in vivo in the hypothalamus of male mice chronically fed with HFDs (12, 13, 33). Interestingly, we also demonstrated that in the brain of mice fed with the same diet for 16 weeks, SatFAs are significantly increased (4, 6, 7). Among those PA represents the most abundant SatFA, thus, we decided to evaluate whether its increase affects basal autophagy in hypothalamic neurons. We exposed N43/5 cells, a model of POMC neurons (34), to 100 μM PA, a concentration of PA similar to the one identified in the brain of obese mice chronically exposed to HFDs (7). As indicated by western blot, the levels of the autophagy receptor Sequestosome 1/p62 (SQSTM1), which is degraded during the autophagic process, increased compared to control (BSA vs. PA: **p < 0.01; Figures 1A,D), suggesting PA inhibited autophagic flux. This result was supported by measuring levels of microtubule-associated protein light chain 3 II (LC3II) in presence and absence of Bafilomycin A1 (BafA1), a classic autophagic flux inhibitor which prevents fusion of autophagosomes and lysosomes (Figures 1A–C). PA exposure increased the levels of LC3II; however, addition of BafA1 had not effect (BSA vs. PA: **p < 0.01; BafA1 vs. BafA1 + PA: non-significant; Figures 1A–C). Consistent with this, immunofluorescence studies in N43/5 cells stained against LC3 showed that treatment with PA stimulated the formation of autophagic puncta per se already 1 h following PA exposure (Figures 1E,F and Supplemental Figures 1A,B). However, exposure to BafA1 did not further enhance the PA-triggered induction of LC3 puncta (Figures 1E,F and Supplemental Figures 1A,B). Finally, in addition to LC3 puncta, PA treatment also increased the number of SQSTM1 puncta, already 1 h following PA treatment (Figures 1E,G and Supplemental Figures 1A,C). Importantly, the levels of Atg5, Atg7, Atg16, Beclin 1, Fip200, and Gabarap are not increased by PA exposure, and Lc3 and Sqstm1 levels, even if affected, are significantly increased only 6 and 4 h, respectively, following PA exposure (Supplemental Figures 1D–K), thus suggesting PA treatment specifically affects the autophagic flux.
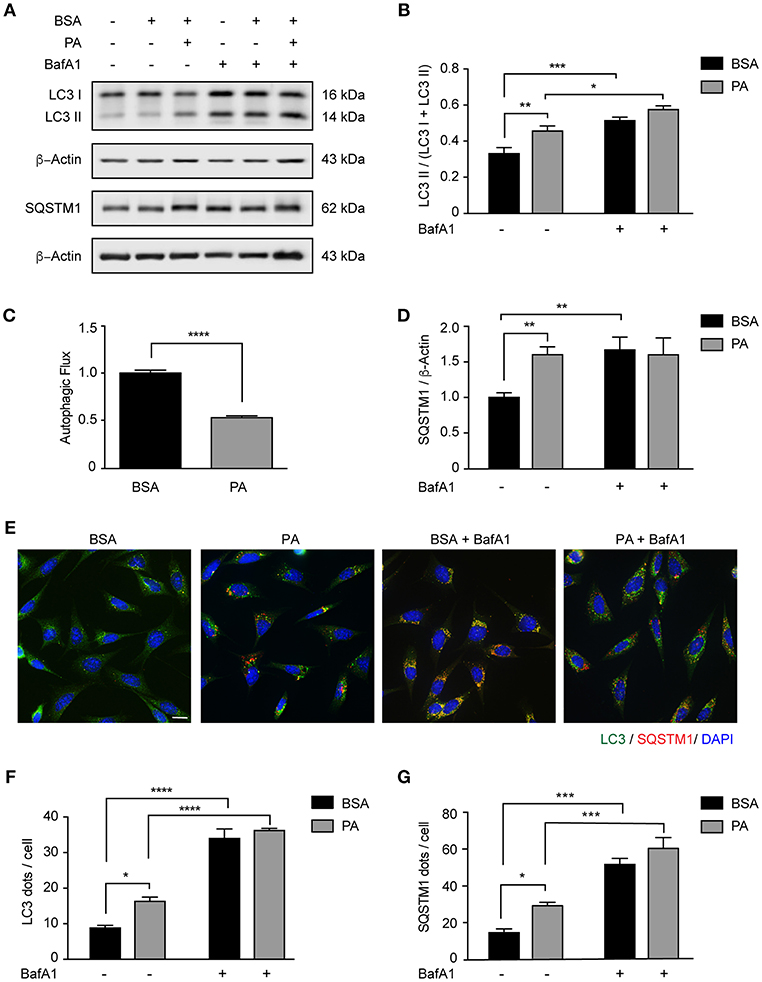
Figure 1. Palmitic acid inhibits the autophagic flux in N43/5 cells. (A) Representative western blot of LC3 and SQSTM1 levels in N43/5 cell lysates, incubated with vehicle (BSA) or PA (100 μM) for 6 h, in presence or absence of BafA1 (100 nM), with their respective quantifications (B,D). (C) Autophagic flux calculated as the difference in LC3II levels in presence and absence of BafA1 (100 nM). (E) Representative images of N43/5 cells treated with BSA or PA (100 μM) for 6 h in presence or absence of BafA1 (100 nM) and stained against LC3 (green) and SQSTM1 (red). Nuclei are stained with DAPI (blue). Quantification of LC3 (F) and SQSTM1 (G) dots per cell. Size bar: 10 μm. Data are presented as mean ± SEM. Two ways ANOVA followed by Sidak's multiple comparisons test. *p < 0.05, **p < 0.01, ***p < 0.001, ****p < 0.0001. n = 3.
Importantly, as PA is not the only SatFA increased in the brain of male mice chronically fed with HFDs, to determine if the inhibition of the autophagic flux is specific to PA or not, we evaluated the effect of stearic acid (SA) on autophagy on N43/5 cells. The results we obtained show also SA inhibits the autophagic flux (Supplemental Figure 2). Indeed, as indicated by western blot, the levels of SQSTM1 are significantly increased when compared to BSA (BSA vs. SA: *p < 0.05; Supplemental Figures 2C,D). Consistent with this, the levels of LC3II, which are increased by SA per se, were not affected by BafA1 (BSA vs. SA: **p < 0.01, BafA1 + BSA vs. BafA1 + SA: non-significant; Supplemental Figures 2A,B). Accordingly, SA stimulated the formation of autophagic puncta, as assessed by immunofluorescence (Supplemental Figures 2E,F) and exposure to BafA1 did not further enhance the SA-triggered induction of LC3 puncta (Supplemental Figures 2E,F). Finally, in addition to LC3 puncta, SA treatment also increased the number of SQSTM1 puncta (Supplemental Figures 2E,G). Altogether, these data indicate that SatFAs inhibit the basal rate of autophagy in N43/5 hypothalamic neurons.
Palmitic Acid Reduces Insulin Sensitivity in N43/5 Cells
Consumption of HFDs causes hypothalamic insulin resistance in rodents (35). Importantly, insulin activates neurons located in the arcuate nucleus of the hypothalamus (such as POMC neurons), thereby reducing food intake. In conditions of chronic caloric excess (as occurs in HFDs feeding), insulin resistance develops and contributes to pathological weight gain (36). Moreover, consumption of HFDs increases PA levels in the hypothalamus (4, 5), and intracerebroventricular injection of PA blunts hypothalamic insulin signaling (30). Here, we evaluated the sensitivity of our cellular model to insulin, and whether PA exposure could reduce insulin sensitivity in the same cell type. Following exposure to insulin, levels of AKT phosphorylation (p-AKT) increased (Figures 2A,B), showing that N43/5 hypothalamic neuronal cells are, indeed, sensitive to insulin. Critically, PA treatment reduced phosphorylation levels (BSA + Ins vs. PA + Ins: **p < 0.01; Figures 2A,B) and consistently, PA exposure inhibited insulin-induced glucose uptake (BSA + Ins vs. PA + Ins: **p < 0.01; Figures 2C,D). Importantly, these effects seem not be specific of PA, as also SA exposure reduces insulin sensitivity, as indicated by p-AKT levels in presence and absence of insulin (BSA + Ins vs. SA + Ins: ****p < 0.0001; Supplemental Figure 3). Altogether these results indicate SatFAs reduce insulin sensitivity in N43/5 cells.
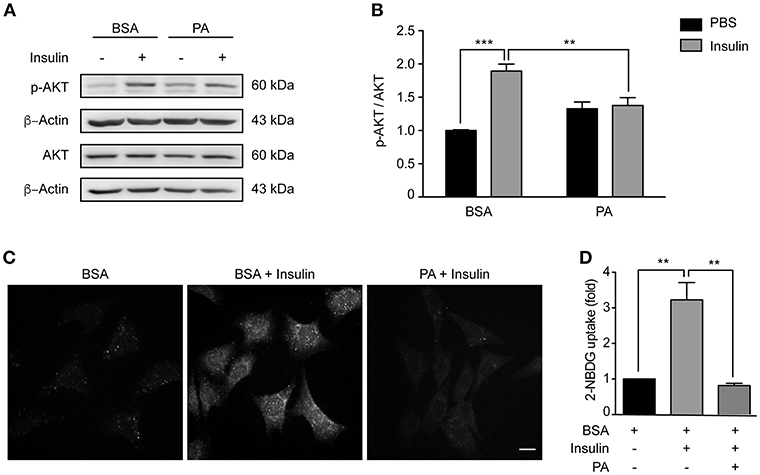
Figure 2. Palmitic acid reduces insulin sensitivity in N43/5 cells. (A) Representative western blot showing relative levels of AKT phosphorylation (Ser473) induced by 15 min of insulin or PBS treatment in N43/5 cells pre-incubated with PA (100 μM) or BSA for 6 h, with its respective quantification (B). (B) Data are presented as mean ± SEM. Two ways ANOVA followed by Sidak's multiple comparisons test. **p < 0.01, ***p < 0.001. n = 3. (C) Representative images of 2-NBDG uptake in N43/5 cells incubated with vehicle (BSA) or PA for 6 h and then stimulated with insulin 1 nM for 30 min, with its representative quantification (D). Size bar: 10 μm. (D) Data are presented as mean ± SEM. One-way ANOVA followed by Holm-Sidak's multiple comparisons test. **p < 0.01. n = 3.
Inhibition of Autophagy Reduces Insulin Sensitivity in N43/5 Cells
Our data indicate PA inhibits the autophagic flux and reduces insulin sensitivity. In the next series of experiments, we determined if this response is specific to PA or if other compounds that inhibit the autophagic flux also affect the insulin response. First, we exposed N43/5 cells to BafA1 or vehicle for 6 h and added insulin during the last 3 or 15 min. While insulin treatment increased p-Insulin Receptor (IR) and p-AKT levels (3 and 15 min following insulin treatment, respectively), again suggesting N43/5 cells are sensitive to insulin, pretreatment with BafA1 prevented the increase in their phosphorylation (Ins vs. BafA1 + Ins: **p < 0.01 for p-IR and *p < 0.05 for p-AKT; Figures 3A–C). Importantly, the reduction in insulin sensitivity is confirmed by the reduction in glucose uptake, which is blunted by BafA1 treatment (Ins vs. BafA1 + Ins: *p < 0.05; Figures 3D,E). No differences were seen in Glut4 expression, suggesting the effect of BafA1 does not occur at the transcriptional level (Supplemental Figure 4). In addition, BafA1 exposure increased the levels of LC3II and SQSTM1 (Figure 3A), suggesting that inhibition of the autophagic flux reduces the insulin response in hypothalamic neuronal cells.
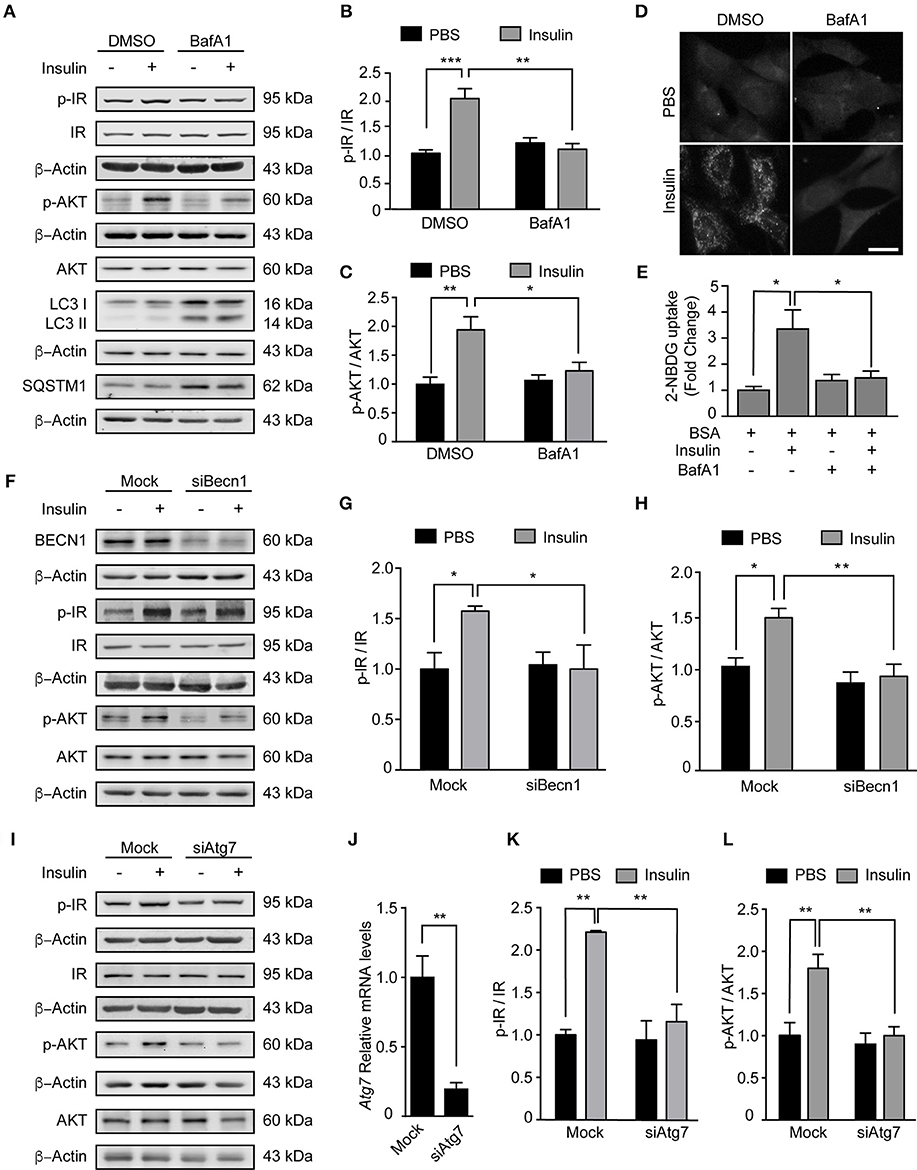
Figure 3. Inhibition of autophagy reduces insulin sensitivity in N43/5 cells. (A) Representative western blots of the indicated proteins of N43/5 cells pre-incubated with BafA1 (100 nM) or its vehicle (DMSO) during 6 h and then stimulated with insulin for 3 min to evaluate IR phosphorylation (Tyr1150/1115) or 15 min to evaluate AKT phosphorylation. (B,C) Quantification of IR (Tyr1150/115) and AKT (Ser473) phosphorylation in cells exposed to the treatments as indicated in (A). (B,C) Data are presented as mean ± SEM. Two ways ANOVA followed by Sidak's multiple comparisons test. *p < 0.05, **p < 0.01, ***p < 0.001. n = 3. (D) Representative images and quantification (E) of 2-NBDG uptake in N43/5 cells pre-incubated with BafA1 (100 nM) or its vehicle (DMSO) during 6 h and then stimulated with insulin for 30 min. Size bar: 10 μm. (E) Data are presented as mean ± SEM. One-way ANOVA followed by Holm-Sidak's multiple comparisons test. *p < 0.05. n = 3. Representative blot of the indicated proteins of N43/5 cells transfected with siRNA against BECN1 (F) or ATG7 (I) followed by insulin or PBS treatment for 3 min to evaluate IR phosphorylation or 15 min to evaluate AKT phosphorylation, with its respective quantifications (G,H,K,L). (G,H,K,L) Data are presented as mean ± SEM. Two ways ANOVA followed by Sidak's multiple comparisons test. *p < 0.05, **p < 0.01. n = 3. (J) mRNA levels of Atg7 in N43/5 cells transfected with a siRNA to downregulate ATG7. As control condition, cells were incubated with Lipofectamine RNAiMAX reagent only (Mock). Data are presented as mean ± SEM. Unpaired t test. **p < 0.01. n = 3.
Then, we assessed if inhibition of autophagy, and not only the inhibition of the autophagic flux, could affect the response to insulin in our cellular model. To do this, we downregulated the expression of two autophagy essential genes Beclin1 and Atg7 (Figures 3F,J) and evaluated the levels of IR and p-AKT in response to insulin treatment. Interestingly, downregulation of both autophagy essential genes significantly reduced the levels of p-IR and p-AKT following insulin treatment (Ins vs. siBeclin + Ins: *p < 0.05 for p-IR and **p < 0.01 for p-AKT. Ins vs. siAtg7 + Ins: **p < 0.01 for p-IR and p-AKT; Figures 3F–L). Glut4 expression levels were increased following Atg7 downregulation, while no differences were identified following BafA1 exposure or Beclin1 downregulation (Supplemental Figure 4). Altogether these results indicate inhibition of autophagy, by downregulation of autophagy essential genes, reduces insulin sensitivity of N43/5 cells in vitro.
Palmitic Acid Activates FFAR1 in N43/5 Cells
Given the increased PA in the hypothalamus of HFDs animals (5), we addressed whether PA affects the levels of FFAR1. Consistent with previous work (37, 38), we identified FFAR1 in hypothalamic neurons but not astrocytes or microglia (Figures 4A,B). To determine the effect of PA on FFAR1 levels we gavaged male mice with PA. Importantly, this experiment was performed only in male mice as the increase in PA concentration in the brain, and more specifically in the hypothalamus, was identified only in male mice (4–7). Our data showed Ffar1 mRNA levels increased following PA gavage (BSA vs. PA *p < 0.05; Figure 4C). Furthermore, consistently with the results we obtained in N43/5 cells, Sqstm1 levels increased, while Atg genes were not affected (Supplemental Figure 5).
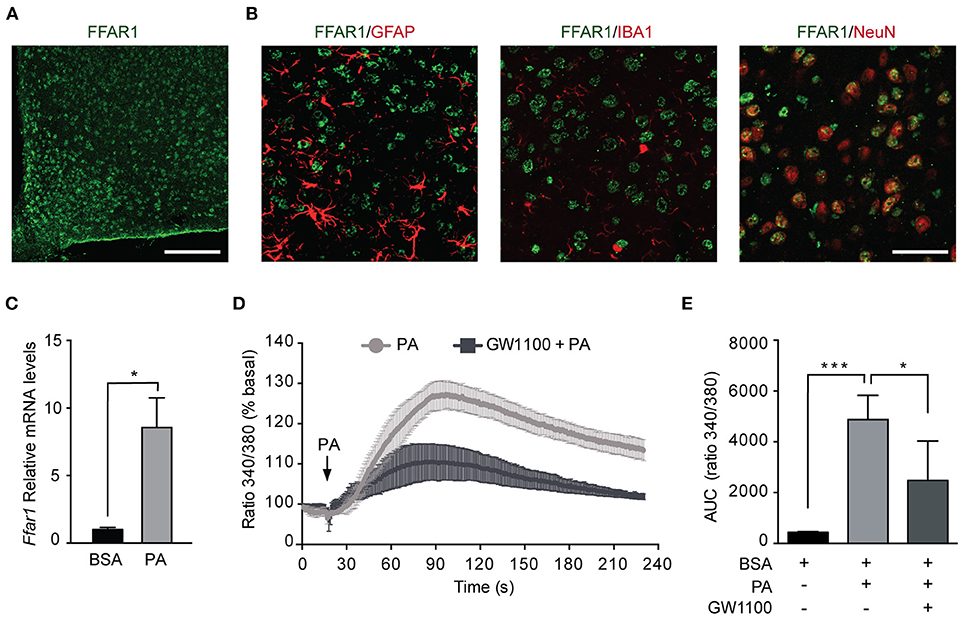
Figure 4. Palmitic acid activates FFAR1 in N43/5 cells. (A) Representative confocal images showing FFAR1 immunoreactivity in the arcuate (ARC) nucleus of the hypothalamus of male mice. Scale bar: 125 μM. (B) Representative confocal images showing colocalization between FFAR1 and glial fibrillary acidic protein (GFAP), which stains astrocytes, or ionized calcium-binding adapter molecule 1 (IBA-1), which stains microglia or neuronal nuclei (NeuN), which stains neurons, in the hypothalamus. Scale bar: 25 μM. (C) mRNA levels of Ffar1 in hypothalamic tissue in mice gavaged with BSA or PA for 3 days. Data are presented as mean ± SEM. Unpaired t test. BSA, n = 3; PA, n = 4. (D) Representative plot showing the percent increase in intracellular Ca2+ levels induced by PA (100 μM), in the presence or absence of FFAR1 antagonist GW1100 (1 μM). (E) Area under the curves (AUC) represented in (D). Data are shown as mean ± SEM. One-way ANOVA followed by Holm-Sidak's multiple comparisons test. *p < 0.05, ***p < 0.001. n = 4.
The activation of FFAR1 by FAs triggers the phospholipase C (PLC)/ Inositol trisphosphate (IP3) signaling pathway leading to Ca2+ release from the endoplasmic reticulum (24, 39). Thus, to determine if PA exposure activates FFAR1 in our cell model, we assessed intracellular Ca2+ levels following PA treatment. Intracellular Ca2+ levels were significantly increased in N43/5 cells after exposure to PA relative to vehicle (BSA vs. PA ***p < 0.001; Figures 4D,E). Importantly, this increase was significantly reduced in cultures exposed to GW1100, a specific FFAR1 antagonist, prior to PA treatment (PA vs. GW1100 + PA *p < 0.05; Figures 4D,E). These data suggest that PA, among other factors, activates FFAR1 in N43/5 cells.
FFAR1 Pharmacological Inhibition Restores Autophagy and Insulin Sensitivity
Our data indicate that PA inhibits the autophagic flux and activates FFAR1 (Figures 1, 4); thus, we determined if the activation of FFAR1 by PA is mechanistically involved in the inhibition of the autophagic flux. We exposed N43/5 cells to the FFAR1 antagonist GW1100 prior to PA treatment. GW1100 pretreatment reduced the levels of LC3II in cells pre-exposed to PA (PA vs. GW1100+PA *p < 0.05; Figures 5A,B). As we previously showed that PA inhibits the autophagic flux (Figure 1), these results suggest FFAR1 inhibition restores the autophagic flux in cells treated with PA (Figure 5C).
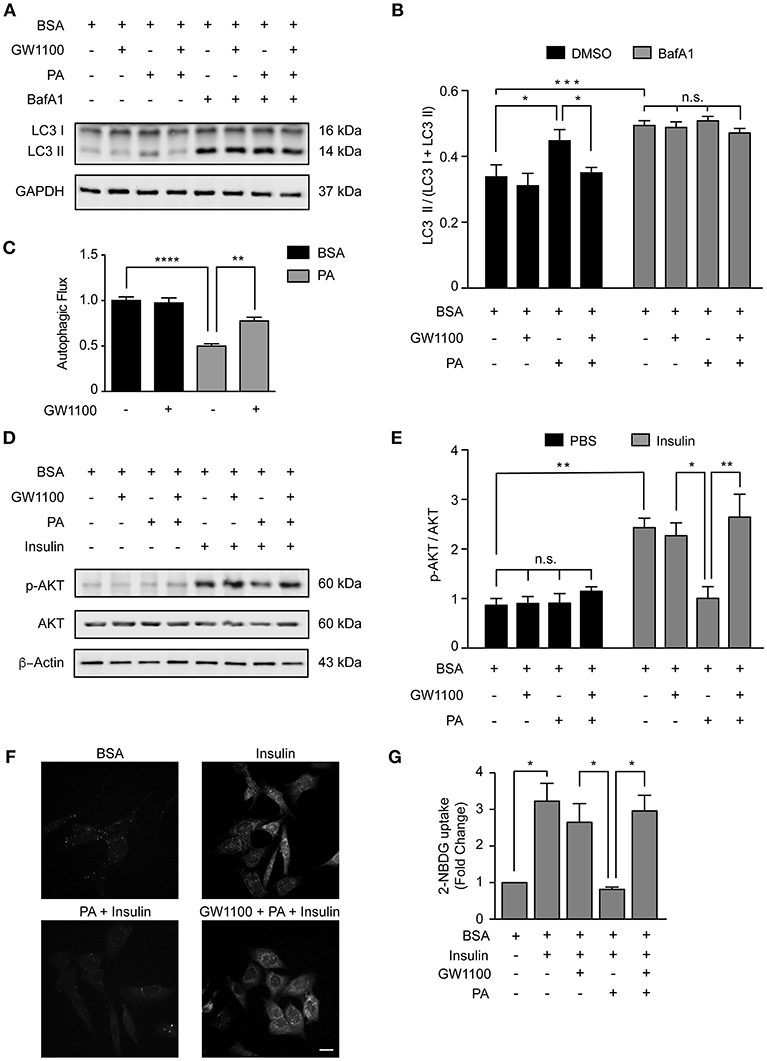
Figure 5. FFAR1 pharmacological inhibition restores autophagy and insulin sensitivity. (A) Representative western blot of LC3 levels in N43/5 cell lysates, incubated with vehicle (BSA), GW1100 (1 μM), or PA (100 μM) for 1 h as indicated, in presence or absence of BafA1 (100 nM), with its respective quantification (B). (B) Data are presented as mean ± SEM. Two ways ANOVA followed by Sidak's multiple comparisons test. *p < 0.05, ***p < 0.001. n = 3. In case of GW1100 and PA treatment, cells were pre-exposed to GW1100 for 20 min, followed by GW1100 and PA exposure for 1 h. (C) Autophagic flux calculated as the difference in LC3II levels in presence and absence of BafA1 (100 nM). Data are shown as mean ± SEM. One-way ANOVA followed by Holm-Sidak's multiple comparisons test. **p < 0.01, ****p < 0.0001. (D) Representative western blot of N43/5 cell lysates, incubated with vehicle (BSA), GW1100 (1 μM) or PA (100 μM) for 15 min in presence or absence of insulin (1 nM) for additional 15 min, as indicated, with its respective quantification (E). In case of GW1100 and PA treatment, cells were pre-treated with GW1100 for 20 min, followed by GW1100 and PA exposure for 15 min. Data are presented as mean ± SEM. Two ways ANOVA followed by Sidak's multiple comparisons test. *p < 0.05, **p < 0.01. n = 3. (F) Representative images of 2-NBDG uptake in N43/5 cells incubated with vehicle (BSA), GW1100, PA and then stimulated with insulin 1 nM for 30 min, with its representative quantification (G). Size bar: 10 μm. Data are shown as mean ± SEM. One-way ANOVA followed by Holm-Sidak's multiple comparisons test. *p < 0.05. n = 3.
Interestingly, pharmacological inhibition of FFAR1 activity in cells exposed to PA also restored insulin sensitivity in N43/5 cells. Indeed, PA exposure reduced p-AKT levels when cells were stimulated with insulin (Figures 2, 5D,E). However, p-AKT levels in cells treated with insulin were similar between control cells (treated with BSA) and cells pre-treated with GW1100, prior to PA exposure (PA + Ins vs. GW1100 + PA + Ins *p < 0.05; Figures 5D,E). Consistently, glucose uptake, significantly reduced by PA treatment, is restored by GW1100 pretreatment (Figures 5F,G). Again, no significant differences were seen in Glut4 mRNA levels following treatments (Supplemental Figure 6). These data indicate FFAR1 pharmacological inhibition promotes insulin sensitivity in N43/5 cells exposed to PA.
Discussion
Here, we demonstrate that exposure to the SatFA PA inhibits the autophagic flux and reduces insulin sensitivity in N43/5 hypothalamic neurons (Figures 1, 2). Furthermore, we show that inhibition of autophagy and the autophagic flux reduces insulin sensitivity in the same cellular model (Figure 3). Lastly, our data indicate that PA activates FFAR1 in hypothalamic neuronal cells (Figure 4) and that the inhibition of the autophagic flux and the reduction in insulin sensitivity are prevented by pharmacological inhibition of FFAR1 (Figure 5).
Chronic consumption of HFDs promotes the accumulation of PA in the hypothalamus of male mice (4–7); thus, we decided to determine whether this increase in PA might affect autophagy, which also appears dysfunctional in the hypothalamus following chronic consumption of HFDs. Importantly, previous studies indicate autophagy malfunction in hypothalamic POMC neurons contributes to obesity-associated metabolic dysfunctions, including increased plasma insulin levels, hyperglycemia, glucose intolerance, impaired lipolysis, and leptin resistance (14–16). Taken together, these data suggest that HFDs-induced SatFAs accumulation in the CNS in male mice promotes a vicious cycle where autophagy inhibition might further enhance obesity-associated diseases. In this context, our data indicate that, at least in our cellular model, exposure to PA inhibits the autophagic flux, a condition that also affects insulin sensitivity. Future research, should confirm these data in in vivo models. Special attention should be paid to assess the possible sexual dimorphism is this response, especially considering previous studies indicating the sex-dependent function of POMC neurons in the regulation of energy homeostasis (40, 41).
The existence of a crosstalk between autophagy and insulin sensitivity has been previously suggested and identified in peripheral metabolic tissues (22, 23, 42). Interestingly, it was recently demonstrated that autophagy degrades insulin-containing vesicles in β-cells of autophagy-hyperactive mice, whereas in insulin-sensitive cells, autophagy enhances insulin response (42). Indeed, induction of autophagy, by different means, in skeletal muscle, hepatocytes, podocytes and adipocytes (43–45), stimulates insulin sensitivity; suggesting increased autophagy might be a general mechanism to boost insulin response. Despite this, there are no reports that determine if this crosstalk also occurs in the CNS, or specifically, in the hypothalamus where insulin sensitive neurons key in the regulation of food intake and peripheral glucose homeostasis reside. In the present study, we evaluated if inhibition of autophagy or autophagic flux blockade in a hypothalamic neuronal cell line affects insulin response. Our data indicate that this might be the case, as downregulation of different autophagy essential genes (Atg7 and Beclin1), as well as inhibition of the autophagic flux using a classic autophagy inhibitor (Bafilomycin A1), reduced the ability of the neuron to respond to insulin, as indicated by IR and p-AKT level and the reduction in glucose uptake following Bafilomycin A1 exposure. How this might be occurring has not been elucidated; however, a possibility is that, by inhibiting autophagy we prevent the degradation of negative regulators of the insulin signaling pathway, such as the protein phosphatase and tensin homolog (PTEN), which can be degraded by the autophagic/lysosomal pathway (46). In addition, based on these results, it is tempting to speculate that the maintenance of the autophagic balance in hypothalamic neurons might be key in the regulation of peripheral glucose homeostasis, as well as food intake. Future studies in neuron-specific transgenic mouse models need to be performed to confirm this hypothesis in vivo.
Sensing lipids is a mechanism through which the hypothalamus controls energy balance. Brain lipid sensing is important to control feeding behavior, hepatic glucose production, and insulin secretion (8). Fatty acids sensitive neurons can increase/decrease their activity in response to FAs (8). Different types of proteins can act as receptors of fatty acids, such as fatty acid transporters, fatty acid binding proteins, and fatty acid receptors. Among those, we focused our attention on FFAR1, the activation of which in pancreatic β-cells, leads to insulin secretion (25, 47), suggesting that this receptor might be involved in the chain of events that regulate the insulin response. Importantly, Steneberg et al. demonstrated that FFAR1 overexpression impairs β-cells function, promoting hypoinsulinemia and diabetes following HFDs feeding (26). In addition, in immortalized and primary pancreatic β-cells, FFAR1 activation induces lipotoxicity (48). Altogether these studies suggest that, in pancreatic β-cells, the effects of FFAR1 activation appear to be dual, since it is involved in both homeostatic and pathologic effects. In addition, FFAR1 overexpression causes hypoinsulinemia and autophagy hyperactivation reduces insulin release in β-cells, suggesting that an additional crosstalk might be occurring between FFAR1 and autophagy, specifically in pancreatic β-cells. Considerably less information is available regarding FFAR1 function in the CNS, where its role is still elusive. Our data, supported by previously published studies (37), show that, within the hypothalamus, FFAR1 is only expressed by neurons and not by astrocytes and microglial cells. Dragano et al. also confirmed FFAR1 is expressed in hypothalamic neurons (both in neuropeptide Y (NPY) and POMC neurons) and acts to maintain whole body energy homeostasis by decreasing energy efficiency and reducing hypothalamic inflammation when FFAR1 is chemically activated by receptor specific agonists (38). Additional studies demonstrate that polyunsaturated fatty acids (PUFAs)-mediate FFAR1 activation in the hypothalamus to produce an anti-inflammatory and neuroprotective effect (37, 49–52). This apparent discrepancy in the effects of FFAR1 is most likely attributable to a ligand-dependent activation of distinct allosteric sites on the receptor by the different molecular structures (53). Furthermore, differences between SatFAs-mediated activation of the receptor in hypothalamic neurons in vitro vs. in vivo have not been investigated. In this study, we show PA-mediated FFAR1 activation in N43/5 hypothalamic neuronal cells reduces insulin sensitivity and the autophagic flux. Future research, using in vivo models, should evaluate if hypothalamic stimulation of this receptor may lead to the development of metabolic diseases, by affecting whole-body insulin sensitivity.
In summary, our study identifies a new role of autophagy in N43/5 hypothalamic neuronal cells in the regulation of insulin sensitivity. In addition, we identified PA as negative modulator of the autophagic flux in the same cell type. Finally, our data suggest FFAR1 mediates the ability of PA to reduce insulin sensitivity promoted by autophagic flux inhibition in hypothalamic neuronal cells (Figure 6).
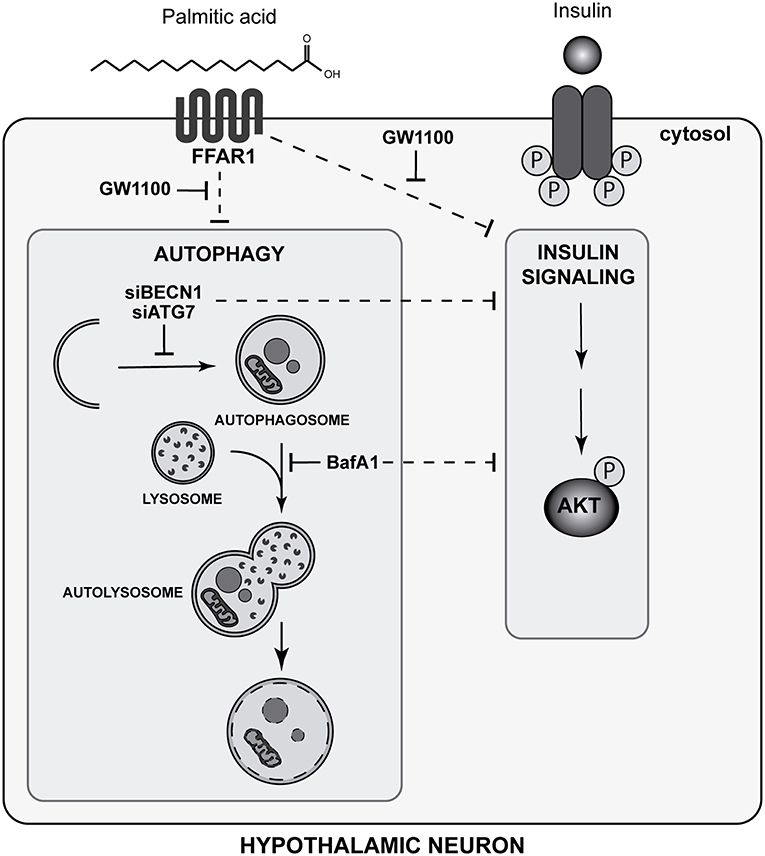
Figure 6. Palmitic acid-mediated FFAR1 activation decreases autophagic flux and insulin sensitivity in hypothalamic neuronal cells (Graphical abstract). The FFAR1 antagonist GW1100 prevents autophagic flux inhibition and restores insulin sensitivity, as indicated by AKT phosphorylation levels, in cells exposed to PA. Downregulation of autophagy essential genes (ATG7 and Beclin 1 -BECN1-), as well as pharmacological inhibition of the autophagic flux by BafA1, reduces the increase in AKT and IR phosphorylation levels stimulated by insulin.
These results may help understanding the cellular mechanisms that drive to insulin resistance induced by PA in hypothalamic neurons.
Author Contributions
EM and MH-C conceived and planned the experiments. MH-C, LT-V, YÁ, FD-C, CN, JE-C, and DP-O carried out the experiments. EM took the lead in writing the manuscript. All the authors contributed to the interpretation of the results and provided critical feedback and helped shape the research, analysis, and manuscript.
Funding
This work was founded by: grants from Fondo Nacional de Desarrollo Cientifico y Tecnologico, FONDECYT 1160820 to EM, 1171075 to AC, 1150584 to CR and 3180209 to YÁ; by the CONICYT PIA 172066 to EM, RT, and AC; by CONICYT PhD fellowships 21151609 to MH-C, by CONICYT PCI REDI170147 to YÁ, by the International Centre for Genetic Engineering and Biotechnology, ICGEB (CRP/CHL16-06 to EM) and FONDECYT-VID: EN29/18 to RT.
Conflict of Interest Statement
The authors declare that the research was conducted in the absence of any commercial or financial relationships that could be construed as a potential conflict of interest.
Acknowledgments
The authors acknowledge the services provided by UC CINBIOT Animal Facility funded by PIA CONICYT*ECM-07*Program for Associative Research, of the Chilean National Council for Science and Technology. The authors thank Aaron P. Frank for critically reading and revising the manuscript. In addition, we thank everyone in the Morselli lab for constructive discussions and criticisms.
Supplementary Material
The Supplementary Material for this article can be found online at: https://www.frontiersin.org/articles/10.3389/fendo.2019.00176/full#supplementary-material
References
1. Hotamisligil GS. Inflammation, metaflammation and immunometabolic disorders. Nature. (2017) 542:177–85. doi: 10.1038/nature21363
2. Milanski M, Degasperi G, Coope A, Morari J, Denis R, Cintra DE, et al. Saturated fatty acids produce an inflammatory response predominantly through the activation of TLR4 signaling in hypothalamus: implications for the pathogenesis of obesity. J Neurosci. (2009) 29:359–70. doi: 10.1523/JNEUROSCI.2760-08.2009
3. Dorfman MD, Thaler JP. Hypothalamic inflammation and gliosis in obesity. Curr Opin Endocrinol Diabetes Obes. (2015) 22:325–30. doi: 10.1097/MED.0000000000000182
4. Morselli E, Fuente-Martin E, Finan B, Kim M, Frank A, Garcia-Caceres C, et al. Hypothalamic PGC-1alpha protects against high-fat diet exposure by regulating ERalpha. Cell Rep. (2014) 9:633–45. doi: 10.1016/j.celrep.2014.09.025
5. Valdearcos M, Robblee MM, Benjamin DI, Nomura DK, Xu AW, Koliwad SK. Microglia dictate the impact of saturated fat consumption on hypothalamic inflammation and neuronal function. Cell Rep. (2014) 9:2124–38. doi: 10.1016/j.celrep.2014.11.018
6. Morselli E, Frank AP, Palmer BF, Rodriguez-Navas C, Criollo A, Clegg DJ. A sexually dimorphic hypothalamic response to chronic high-fat diet consumption. Int J Obes. (2016) 40:206–9. doi: 10.1038/ijo.2015.114
7. Rodriguez-Navas C, Morselli E, Clegg DJ. Sexually dimorphic brain fatty acid composition in low and high fat diet-fed mice. Mol Metab. (2016) 5:680–9. doi: 10.1016/j.molmet.2016.06.014
8. Migrenne S, Le Foll C, Levin BE, Magnan C. Brain lipid sensing and nervous control of energy balance. Diabetes Metab. (2011) 37:83–8. doi: 10.1016/j.diabet.2010.11.001
9. Moulle VS, Picard A, Le Foll C, Levin BE, Magnan C. Lipid sensing in the brain and regulation of energy balance. Diabetes Metab. (2014) 40:29–33. doi: 10.1016/j.diabet.2013.10.001
10. Singh R, Cuervo AM. Autophagy in the cellular energetic balance. Cell Metab. (2011) 13:495–504. doi: 10.1016/j.cmet.2011.04.004
11. Zhang Y, Sowers JR, Ren J. Targeting autophagy in obesity: from pathophysiology to management. Nat Rev Endocrinol. (2018) 14:356–76. doi: 10.1038/s41574-018-0009-1
12. Morselli E, Criollo A, Rodriguez-Navas C, Clegg DJ. Chronic high fat diet consumption impairs metabolic health of male mice. Inflamm Cell Signal. (2014) 1:e561. doi: 10.14800/ics.561
13. Portovedo M, Ignacio-Souza LM, Bombassaro B, Coope A, Reginato A, Razolli DS, et al. Saturated fatty acids modulate autophagy's proteins in the hypothalamus. PLoS ONE. (2015) 10:e0119850. doi: 10.1371/journal.pone.0119850
14. Coupe B, Ishii Y, Dietrich MO, Komatsu M, Horvath TL, Bouret SG. Loss of autophagy in pro-opiomelanocortin neurons perturbs axon growth and causes metabolic dysregulation. Cell Metab. (2012) 15:247–55. doi: 10.1016/j.cmet.2011.12.016
15. Kaushik S, Arias E, Kwon H, Lopez NM, Athonvarangkul D, Sahu S, et al. Loss of autophagy in hypothalamic POMC neurons impairs lipolysis. EMBO Rep. (2012) 13:258–65. doi: 10.1038/embor.2011.260
16. Quan W, Kim HK, Moon EY, Kim SS, Choi CS, Komatsu M, et al. Role of hypothalamic proopiomelanocortin neuron autophagy in the control of appetite and leptin response. Endocrinology. (2012) 153:1817–26. doi: 10.1210/en.2011-1882
17. Lopez-Vicario C, Alcaraz-Quiles J, Garcia-Alonso V, Rius B, Hwang SH, Titos E, et al. Inhibition of soluble epoxide hydrolase modulates inflammation and autophagy in obese adipose tissue and liver: role for omega-3 epoxides. Proc Natl Acad Sci USA. (2015) 112:536–41. doi: 10.1073/pnas.1422590112
18. Jia G, DeMarco VG, Sowers JR. Insulin resistance and hyperinsulinaemia in diabetic cardiomyopathy. Nat Rev Endocrinol. (2016) 12:144–53. doi: 10.1038/nrendo.2015.216
19. Liu H, Javaheri A, Godar RJ, Murphy J, Ma X, Rohatgi N, et al. Intermittent fasting preserves beta-cell mass in obesity-induced diabetes via the autophagy-lysosome pathway. Autophagy. (2017) 13:1952–68. doi: 10.1080/15548627.2017.1368596
20. Qian Q, Zhang Z, Orwig A, Chen S, Ding WX, Xu Y, et al. S-Nitrosoglutathione reductase dysfunction contributes to obesity-associated hepatic insulin resistance via regulating autophagy. Diabetes. (2018) 67:193–207. doi: 10.2337/db17-0223
21. Yang L, Li P, Fu S, Calay ES, Hotamisligil GS. Defective hepatic autophagy in obesity promotes ER stress and causes insulin resistance. Cell Metab. (2010) 11:467–78. doi: 10.1016/j.cmet.2010.04.005
22. Ebato C, Uchida T, Arakawa M, Komatsu M, Ueno T, Komiya K, et al. Autophagy is important in islet homeostasis and compensatory increase of beta cell mass in response to high-fat diet. Cell Metab. (2008) 8:325–32. doi: 10.1016/j.cmet.2008.08.009
23. Jung HS, Chung KW, Won Kim J, Kim J, Komatsu M, Tanaka K, et al. Loss of autophagy diminishes pancreatic beta cell mass and function with resultant hyperglycemia. Cell Metab. (2008) 8:318–24. doi: 10.1016/j.cmet.2008.08.013
24. Briscoe CP, Peat AJ, McKeown SC, Corbett DF, Goetz AS, Littleton TR, et al. Pharmacological regulation of insulin secretion in MIN6 cells through the fatty acid receptor GPR40: identification of agonist and antagonist small molecules. Br J Pharmacol. (2006) 148:619–28. doi: 10.1038/sj.bjp.0706770
25. Covington DK, Briscoe CA, Brown AJ, Jayawickreme CK. The G-protein-coupled receptor 40 family (GPR40-GPR43) and its role in nutrient sensing. Biochem Soc Trans. (2006) 34(Pt 5):770–3. doi: 10.1042/BST0340770
26. Steneberg P, Rubins N, Bartoov-Shifman R, Walker MD, Edlund H. The FFA receptor GPR40 links hyperinsulinemia, hepatic steatosis, and impaired glucose homeostasis in mouse. Cell Metab. (2005) 1:245–58. doi: 10.1016/j.cmet.2005.03.007
27. Kebede M, Ferdaoussi M, Mancini A, Alquier T, Kulkarni RN, Walker MD, et al. Glucose activates free fatty acid receptor 1 gene transcription via phosphatidylinositol-3-kinase-dependent O-GlcNAcylation of pancreas-duodenum homeobox-1. Proc Natl Acad Sci USA. (2012) 109:2376–81. doi: 10.1073/pnas.1114350109
28. Kristinsson H, Smith DM, Bergsten P, Sargsyan E. FFAR1 is involved in both the acute and chronic effects of palmitate on insulin secretion. Endocrinology. (2013) 154:4078–88. doi: 10.1210/en.2013-1352
29. Verma MK, Sadasivuni MK, Yateesh AN, Neelima K, Mrudula S, Reddy M, et al. Activation of GPR40 attenuates chronic inflammation induced impact on pancreatic beta-cells health and function. BMC Cell Biol. (2014) 15:24. doi: 10.1186/1471-2121-15-24
30. Benoit SC, Kemp CJ, Elias CF, Abplanalp W, Herman JP, Migrenne S, et al. Palmitic acid mediates hypothalamic insulin resistance by altering PKC-theta subcellular localization in rodents. J Clin Invest. (2009) 119:2577–89. doi: 10.1172/JCI36714
31. Darling RA, Zhao H, Kinch D, Li AJ, Simasko SM, Ritter S. Mercaptoacetate and fatty acids exert direct and antagonistic effects on nodose neurons via GPR40 fatty acid receptors. Am J Physiol Regul Integr Comp Physiol. (2014) 307:R35–43. doi: 10.1152/ajpregu.00536.2013
32. Bernal-Sore I, Navarro-Marquez M, Osorio-Fuentealba C, Diaz-Castro F, Del Campo A, Donoso-Barraza C, et al. Mifepristone enhances insulin-stimulated Akt phosphorylation and glucose uptake in skeletal muscle cells. Mol Cell Endocrinol. (2018) 461:277–83. doi: 10.1016/j.mce.2017.09.028
33. Meng Q, Cai D. Defective hypothalamic autophagy directs the central pathogenesis of obesity via the IkappaB kinase beta (IKKbeta)/NF-kappaB pathway. J Biol Chem. (2011) 286:32324–32. doi: 10.1074/jbc.M111.254417
34. Oh TS, Cho H, Cho JH, Yu SW, Kim EK. Hypothalamic AMPK-induced autophagy increases food intake by regulating NPY and POMC expression. Autophagy. (2016) 12:2009–25. doi: 10.1080/15548627.2016.1215382
35. Posey KA, Clegg DJ, Printz RL, Byun J, Morton GJ, Vivekanandan-Giri A, et al. Hypothalamic proinflammatory lipid accumulation, inflammation, and insulin resistance in rats fed a high-fat diet. Am J Physiol Endocrinol Metab. (2009) 296:E1003–1012. doi: 10.1152/ajpendo.90377.2008
36. De Souza CT, Araujo EP, Bordin S, Ashimine R, Zollner RL, Boschero AC, et al. Consumption of a fat-rich diet activates a proinflammatory response and induces insulin resistance in the hypothalamus. Endocrinology. (2005) 146:4192–9. doi: 10.1210/en.2004-1520
37. Nakamoto K, Nishinaka T, Sato N, Mankura M, Koyama Y, Kasuya F, et al. Hypothalamic GPR40 signaling activated by free long chain fatty acids suppresses CFA-induced inflammatory chronic pain. PLoS ONE. (2013) 8:e81563. doi: 10.1371/journal.pone.0081563
38. Dragano NRV, Solon C, Ramalho AF, de Moura RF, Razolli DS, Christiansen E, et al. Polyunsaturated fatty acid receptors, GPR40 and GPR120, are expressed in the hypothalamus and control energy homeostasis and inflammation. J Neuroinflamm. (2017) 14:91. doi: 10.1186/s12974-017-0869-7
39. Fujiwara K, Maekawa F, Yada T. Oleic acid interacts with GPR40 to induce Ca2+ signaling in rat islet beta-cells: mediation by PLC and L-type Ca2+ channel and link to insulin release. Am J Physiol Endocrinol Metab. (2005) 289:E670–677. doi: 10.1152/ajpendo.00035.2005
40. Xu Y, Nedungadi TP, Zhu L, Sobhani N, Irani BG, Davis KE, et al. Distinct hypothalamic neurons mediate estrogenic effects on energy homeostasis and reproduction. Cell Metab. (2011) 14:453–65. doi: 10.1016/j.cmet.2011.08.009
41. Wang C, He Y, Xu P, Yang Y, Saito K, Xia Y, et al. TAp63 contributes to sexual dimorphism in POMC neuron functions and energy homeostasis. Nat Commun. (2018) 9:1544. doi: 10.1038/s41467-018-03796-7
42. Yamamoto S, Kuramoto K, Wang N, Situ X, Priyadarshini M, Zhang W, et al. Autophagy differentially regulates insulin production and insulin sensitivity. Cell Rep. (2018) 23:3286–99. doi: 10.1016/j.celrep.2018.05.032
43. Xin W, Li Z, Xu Y, Yu Y, Zhou Q, Chen L, et al. Autophagy protects human podocytes from high glucose-induced injury by preventing insulin resistance. Metab Clin Exp. (2016) 65:1307–15. doi: 10.1016/j.metabol.2016.05.015
44. Ahlstrom P, Rai E, Chakma S, Cho HH, Rengasamy P, Sweeney G. Adiponectin improves insulin sensitivity via activation of autophagic flux. J Mol Endocrinol. (2017) 59:339–50. doi: 10.1530/JME-17-0096
45. Zhou W, Ye S. Rapamycin improves insulin resistance and hepatic steatosis in type 2 diabetes rats through activation of autophagy. Cell Biol Int. (2018) 42:1282–91. doi: 10.1002/cbin.11015
46. Wang M, Wu H, Li S, Xu Z, Li X, Yang Y, et al. SYNJ2BP promotes the degradation of PTEN through the lysosome-pathway and enhances breast tumor metastasis via PI3K/AKT/SNAI1 signaling. Oncotarget. (2017) 8:89692–706. doi: 10.18632/oncotarget.21058
47. Itoh Y, Kawamata Y, Harada M, Kobayashi M, Fujii R, Fukusumi S, et al. Free fatty acids regulate insulin secretion from pancreatic beta cells through GPR40. Nature. (2003) 422:173–6. doi: 10.1038/nature01478
48. Yamashima T. Dual effects of the non-esterified fatty acid receptor 'GPR40' for human health. Prog Lipid Res. (2015) 58:40–50. doi: 10.1016/j.plipres.2015.01.002
49. Nakamoto K, Nishinaka T, Matsumoto K, Kasuya F, Mankura M, Koyama Y, et al. Involvement of the long-chain fatty acid receptor GPR40 as a novel pain regulatory system. Brain Res. (2012) 1432:74–83. doi: 10.1016/j.brainres.2011.11.012
50. Nakamoto K, Aizawa F, Nishinaka T, Tokuyama S. Regulation of prohormone convertase 2 protein expression via GPR40/FFA1 in the hypothalamus. Eur J Pharmacol. (2015) 762:459–63. doi: 10.1016/j.ejphar.2015.06.013
51. Khan MZ, He L. The role of polyunsaturated fatty acids and GPR40 receptor in brain. Neuropharmacology. (2017) 113(Pt B):639–51. doi: 10.1016/j.neuropharm.2015.05.013
52. Nakamoto K, Aizawa F, Miyagi K, Yamashita T, Mankura M, Koyama Y, et al. Dysfunctional GPR40/FFAR1 signaling exacerbates pain behavior in mice. PLoS ONE. (2017) 12:e0180610. doi: 10.1371/journal.pone.0180610
Keywords: saturated fatty acids, G-protein coupled receptor 40, central nervous system, AKT, insulin resistance, autophagy, glucose uptake
Citation: Hernández-Cáceres MP, Toledo-Valenzuela L, Díaz-Castro F, Ávalos Y, Burgos P, Narro C, Peña-Oyarzun D, Espinoza-Caicedo J, Cifuentes-Araneda F, Navarro-Aguad F, Riquelme C, Troncoso R, Criollo A and Morselli E (2019) Palmitic Acid Reduces the Autophagic Flux and Insulin Sensitivity Through the Activation of the Free Fatty Acid Receptor 1 (FFAR1) in the Hypothalamic Neuronal Cell Line N43/5. Front. Endocrinol. 10:176. doi: 10.3389/fendo.2019.00176
Received: 20 August 2018; Accepted: 01 March 2019;
Published: 26 March 2019.
Edited by:
Maria Ines Vaccaro, Universidad de Buenos Aires, ArgentinaReviewed by:
Angelo Poletti, University of Milan, ItalyFranck Oury, Institut National de la Santé et de la Recherche Médicale (INSERM), France
Copyright © 2019 Hernández-Cáceres, Toledo-Valenzuela, Díaz-Castro, Ávalos, Burgos, Narro, Peña-Oyarzun, Espinoza-Caicedo, Cifuentes-Araneda, Navarro-Aguad, Riquelme, Troncoso, Criollo and Morselli. This is an open-access article distributed under the terms of the Creative Commons Attribution License (CC BY). The use, distribution or reproduction in other forums is permitted, provided the original author(s) and the copyright owner(s) are credited and that the original publication in this journal is cited, in accordance with accepted academic practice. No use, distribution or reproduction is permitted which does not comply with these terms.
*Correspondence: Eugenia Morselli, ZW1vcnNlbGxpQGJpby5wdWMuY2w=
†Present Address: Yenniffer Ávalos, Departamento de Biología, Facultad de Química y Biología, Universidad de Santiago de Chile, Santiago, Chile
‡These authors have contributed equally to this work