
95% of researchers rate our articles as excellent or good
Learn more about the work of our research integrity team to safeguard the quality of each article we publish.
Find out more
ORIGINAL RESEARCH article
Front. Endocrinol. , 20 December 2013
Sec. Molecular and Structural Endocrinology
Volume 4 - 2013 | https://doi.org/10.3389/fendo.2013.00196
This article is part of the Research Topic The use of BRET to study receptor-protein interactions View all 13 articles
 Mohammed Akli Ayoub1,2,3*
 Jean-Philippe Pin1,2,3
G protein-coupled receptors are well recognized as being able to activate several signaling pathways through the activation of different G proteins as well as other signaling proteins such as β-arrestins. Therefore, understanding how such multiple GPCR-mediated signaling can be integrated constitute an important aspect. Here, we applied bioluminescence resonance energy transfer (BRET) to shed more light on the G protein coupling profile of trypsin receptor, or protease-activated receptor 2 (PAR2), and its interaction with β-arrestin1. Using YFP and Rluc fusion constructs expressed in COS-7 cells, BRET data revealed a pre-assembly of PAR2 with both Gαi1 and Gαo and a rapid and transient activation of these G proteins upon receptor activation. In contrast, no pre-assembly of PAR2 with Gα12 could be detected and their physical association can be measured with a very slow and sustained kinetics similar to that of β-arrestin1 recruitment. These data demonstrate the coupling of PAR2 with Gαi1, Gαo, and Gα12 in COS-7 cells with differences in the kinetics of GPCR-G protein coupling, a parameter that very likely influences the cellular response. Moreover, this further illustrates that pre-assembly or agonist-induced G protein interaction depends on receptor-G protein pairs indicating another level of complexity and regulation of the signaling of GPCR-G protein complexes and its multiplicity.
Recently the study of the interaction of GPCRs with their specific signaling and regulatory proteins has been widely studied using energy transfer-based approaches BRET and FRET (bioluminescence/fluorescence resonance energy transfer) (1–5). These methods allow the measurements, in real-time and live cells, of either the recruitment of specific proteins (i.e., G protein subunits, RGS, arrestins, GRKs …) to the activated receptor or conformational changes within their preassembled or newly formed complexes (6–10). Consequently, interesting conclusions have been reported regarding GPCR-G protein coupling, interaction between G protein subunits, and GPCR-arrestin association in terms of structure, pharmacology, and kinetic of activation/deactivation. Indeed, many studies have shown the possibility of GPCRs to form preassembled complexes even in the absence of receptor activation [for review (1, 3)]. However, others clearly demonstrate that receptor-G protein association is exclusively mediated by agonist activation with expected or unexpected kinetics [for review (1, 3)].
One of the important GPCR families is protease-activated receptors (PARs) which is composed by four subtypes, PAR1, protease-activated receptor 2 (PAR2), PAR3, and PAR4, which play crucial roles in a number of physiological processes such as thrombosis, vascular development, cell proliferation, and tumorigenesis (11). Therefore they are considered as interesting targets for the treatment of various pathologies like inflammation, cancer, and stroke (12). PARs are known to be activated by various serine proteases such as thrombin, trypsin, plasmin, and the factor Xa (13, 14). PARs activation occurs through a highly specific protease-mediated cleavage of the N-terminal extremity of the receptor unmasking a new N terminus that acts as a tethered ligand which directly activates the transmembrane core of the cleaved receptor (13–15). PARs are characterized by the diversity and overlapping of their signaling pathways involving various G protein classes: Gαi/o, Gαq/11, Gα12/13 proteins as well as arrestins promoting multiple downstream signaling responses in various cellular models (15–19). Furthermore, PARs undergo a rapid desensitization, internalization, and degradation involving the phosphorylation of the receptor by G protein-coupled receptor kinases and the recruitment of arrestins (18, 19). However, except for the prototype member, PAR1, the G protein coupling profile of the different members of PARs is not really a consensus matter and little information is available regarding their coupling to G proteins. This is true for PAR2 which is typically Gαq/11-coupled receptor leading to an increase in intracellular calcium via PLC/IP3 pathway (16, 18, 20, 21). However, a study in the Xenopus oocyte system has reported that PAR2-mediated intracellular signaling events were a pertussis toxin (PTX)-sensitive indicating a role of PAR-Gαi/Gαo coupling (22). Also, PAR2 activation in the epithelial cells elicited a calcium response in both PTX-sensitive and PTX-insensitive depending on the cell model used (23). Recently PAR2 activating peptide SLIGRL has been shown to induce smooth muscle contraction by triggering the activation of Gαq, Gαi1, and Gα13 (24). However, it has been shown that PAR2, in contrast to PAR1, does not couple to Gαi and Gαo families in COS-7 cells (25). Together, these studies indicate that the pattern of G protein coupling of PAR2 strongly depends on the cellular model considered since the differences can be due to factors such receptor density, the availability of G proteins and other interacting proteins … etc. [For review (1)].
Many recent studies have used BRET to investigate GPCR-G protein coupling (1, 3) including PARs (6, 7, 26). Indeed, our recent data using both BRET and time-resolved FRET (TR-FRET) technologies revealed the existence of preassembled complexes between PAR1 and Gαi1 protein (6, 7), as well as Gαo (27) in COS-7 cells. In contrast, the physical association of PAR1 with Gα12, but not Gα13, was exclusively observed upon receptor activation with a very slow and stable kinetic indicating the recruitment of Gα12 to the activated PAR1 in parallel to β-arrestin1 recruitment (7). In this study, we aimed to investigate the physical interaction of PAR2 with Gαi1, Gαo, Gα12, and β-arrestin1 before and upon receptor activation by BRET, in real-time and live cells, using Rluc-tagged Gα proteins and YFP-tagged PAR2.
Human cDNA for PAR2 were cloned into pcDNA3.1+ (Guthrie Research Institute, Sayre, PA, USA). PAR2-YFP fusion protein and Rluc-tagged G proteins were generated as previously described (6). PAR2-ΔC-YFP mutant corresponds to the δ Tail mutant reported by Seatter et al. removing the entire C-terminus from Serine 348 (28). Such truncation was generated using the similar strategy for PAR1-ΔC-YFP previously reported (6). Rluc-β-arrestin1 were generously provided by M. G. Scott (Institut Cochin, Paris, France). Bovine trypsin pancreas was from Calbiochem Merck KgaA (Darmstadt, Germany) and Ser-Leu-Iso-Gly-Arg-Leu-NH2 (SLIGRL) peptide was from Tocris Cookson Inc., Ellisville, MO, USA. Ninety-six-well white microplates were from Greiner Bio-One SAS (Courtaboeuf, France). Coelenterazine h substrate was from Promega (Charbonnières, France).
COS-7 cells were grown in complete medium [DMEM supplemented with 10% (v/v) fetal bovine serum, 4.5 g/l glucose, 100 U/ml penicillin, 0.1 mg/ml streptomycin, and 1 mM glutamine] (all from Invitrogen, Carlsbad, CA, USA). Transient transfections were performed by reverse transfection in 96-well plate using Lipofectamine 2000 following the manufacturer’s protocol. Briefly, for each well the different combinations of coding plasmids were used as follow: 25 ng of PAR2-YFP (WT and ΔC mutant), 50 ng of Gαi1/o-Rluc or Rluc-β-arrestin 1, and 150 ng of Gα12-Rluc. The plasmid mixes and Lipofectamine 2000 (0.5 μl/well) were first preincubated 5 min at room temperature in serum-free DMEM (2 × 25 μl/well). Then the two solutions of serum-free DMEM containing plasmids and Lipofectamine were mixed and incubated 20 min at room temperature. Cells (105 in 150 μl/well) in DMEM supplemented with 10% FCS were then incubated with the final plasmid-Lipofectamine mix (50 μl/well).
Forty-eight hours after transfection cells were washed with PBS and preincubated in the absence or presence of trypsin or SLIGRL as indicated in PBS at 37°C. Cells were then washed and resuspended in PBS for BRET measurements. The kinetic and dose-response analysis of BRET signals was performed as described previously (6). The BRET Ratio was defined as the subtraction of the ratio of the emission at 530 ± 25 nm over the emission at 485 ± 20 nm of cells expressing the Rluc fusion protein alone from the same ratio of cells co-expressing Rluc and YFP fusion proteins. Then the resulted values were multiplied by 1000. However, the ligand-induced BRET was calculated by subtracting the BRET Ratio for a PBS-treated cell sample from the same ratio for the aliquot of the same cells treated with agonist. In this calculation only ligand-promoted BRET changes are represented and the PBS-treated cell sample represents the background eliminating the requirement for measuring an Rluc-only control sample especially when fast kinetics and dose-response analysis are performed.
All data were represented using Prism GraphPad software (San Diego, CA, USA). Kinetic and dose-response curves were fitted with non-linear regression equations using the different equations as indicated.
The pattern of G protein coupling for PAR2 is still not completely clarified when compared to PAR1 which is known to activate Gαo, Gαi1/2, Gαq as well as Gα12/13 pathways in various in vitro and in vivo models (14, 29). Therefore, we wanted to investigate the putative coupling of PAR2 with Gαi1, Gαo, and Gα12, as this has been previously demonstrated for PAR1 (6, 7, 27). For this, we used BRET approach allowing real-time assessment of the receptor-G protein complexes in live cells and BRET measurements were performed in COS-7 cells transiently co-expressing Gα-Rluc and PAR2-YFP fusion proteins and stimulated or not with its specific agonist, trypsin. As shown in Figure 1A, significant constitutive BRET signal was measured between PAR2-YFP and either Gαi1-Rluc or Gαo-Rluc compared to Gα12-Rluc. This was observed at similar relative expression levels of PAR2-YFP as well as Rluc-tagged G proteins measured by fluorescence and luminescence, respectively (Figure 1B). Interestingly, the stimulation with 100 nM of trypsin for 2 min (for Gαi and Gαo) or 30 min for (Gα12) specifically increased the BRET signal between all the Gα-Rluc and PAR2-YFP indicating functional coupling of PAR2 with Gαi1, Gαo, and Gα12 (Figure 1A). Together, these data suggest a possible pre-assembly between PAR2 and Gαi1 and Gαo, but not Gα12. The agonist-induced BRET increase clearly demonstrates a functional coupling of PAR2 with these G proteins which is characterized by conformational changes within the preassembled PAR2-Gαi1 and PAR2-Gαo complexes and probably Gα12 recruitment as previously shown for PAR1 (6, 7, 27).
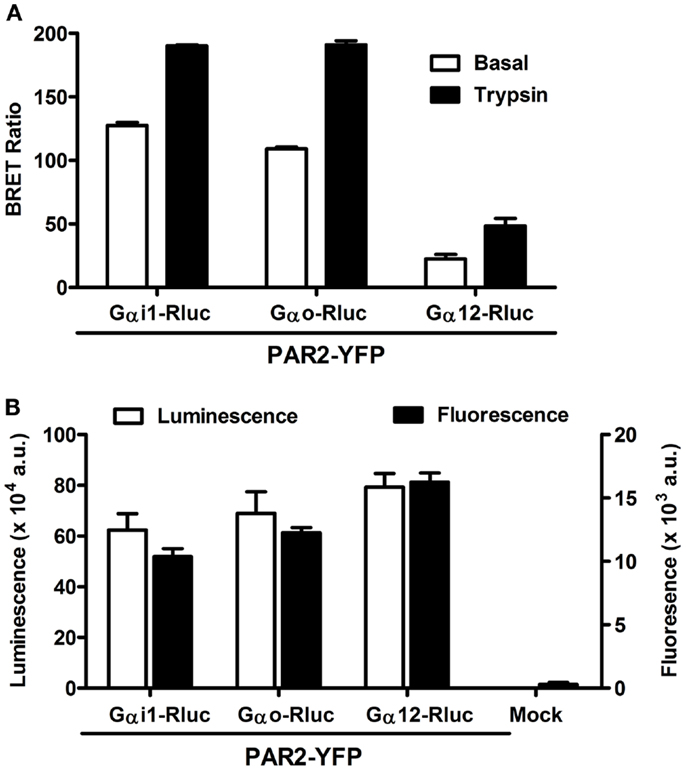
Figure 1. Bioluminescence resonance energy transfer between PAR2 and Gα proteins in live COS-7 cells. (A) BRET measurements in COS-7 cells co-expressing PAR2-YFP and either Gαi1-Rluc, Gαo-Rluc, or Gα12-Rluc in the absence (□) and presence of stimulation with 100 nM of trypsin (■) for 2 min (for Gαi and Gαo) or 30 min for (Gα12). (B) Quantification of the luciferase (Rluc) activity (□) and YFP fluorescence (■) of BRET partners measured in BRET assay. Data are means ± SEM of three independent experiments performed in triplicate.
Next, we performed real-time kinetics before and after agonist addition using the injection system available on the Mithras LB-490. As result, the injection of 100 nM of trypsin rapidly increased the BRET signal between PAR2-YFP and Gαi1-Rluc (Figure 2A) as well as Gαo-Rluc (Figure 2B) and the increased signal remained stable ~5 min after ligand injection. The t1/2 values are in second interval as indicated in Table 1. However, no ligand-induced BRET increase was observed between PAR2-YFP and Gα12-Rluc within the first 4 min post-stimulation (Figure 2C). These observations are comparable to what we previously reported on PAR1-Gαi1 coupling (6, 7) indicating similar pre-assembly properties and activation kinetics.
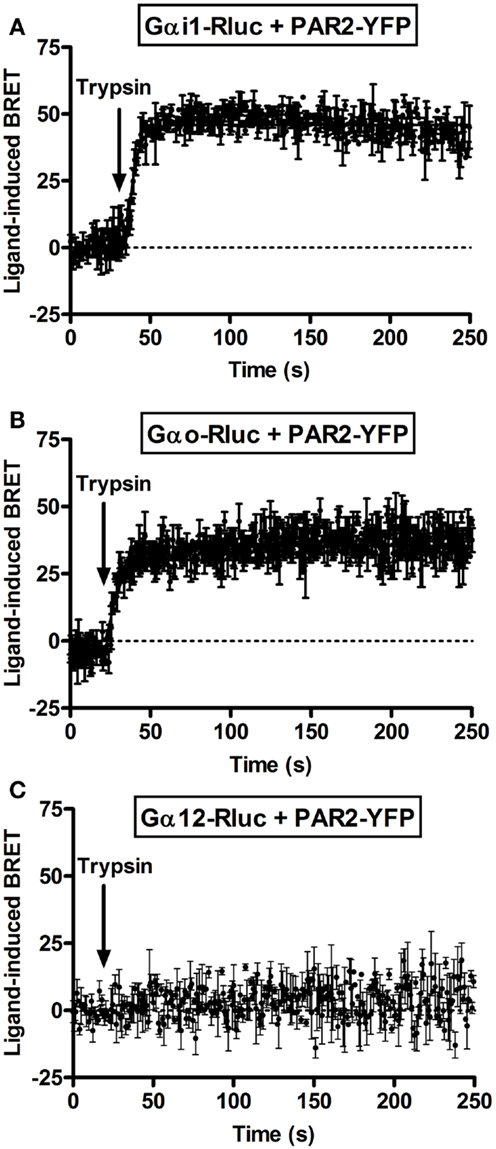
Figure 2. Kinetic analysis of ligand-induced BRET increase between PAR2 and Gα proteins. COS-7 cells transiently co-expressing PAR2-YFP and either Gαi1-Rluc (A), Gαo-Rluc (B), or Gα12-Rluc (C) were used for BRET experiments and repetitive signals were recorded before and immediately after the injection of 100 nM of trypsin. The curves were fitted using “Plateau then increase to top” equation of Prism GraphPad software and Y = IF[X < X0, Plateau, Plateau + (Top − Plateau)*(1 − exp(−K* (X−X0)))] constraining the plateau to a theoretical value of 0. Data are mean ± SEM of three independent experiments performed in single points.
Next, we performed long-term kinetics (up to 15–20 min) in the absence or presence of trypsin stimulation. As shown above, for both Gαi1-Rluc (Figure 3A) and Gαo-Rluc (Figure 3C) we observed a basal BRET signal and trypsin promoted a rapid BRET increase in the first seconds of stimulation and the signal was stable for ~4 min before its slow decline in a time-dependent manner. The kinetic analysis using “Plateau followed by one phase decay” equation of Prism GraphPad software resulted in decay t1/2 values close to 10 min (Table 1) for both Gαi1-Rluc (Figure 3B) and Gαo-Rluc (Figure 3D). This analysis demonstrates a reversible trypsin-induced BRET increase reflecting a rapid activation of PAR2-Gαi1 and PAR2-Gαo complexes which is then likely followed by their desensitization. In contrast, a very low BRET signal was measured between Gα12-Rluc and PAR2-YFP as expected (Figure 3E) consistent with the data in Figure 1A. Interestingly, in the presence of trypsin we observed a gradual increase in the BRET signal between Gα12-Rluc and PAR2-YFP (Figure 3E) which reached a plateau after 15 min of stimulation (Figure 3F) with a t1/2 value close to 5 min (Table 1).
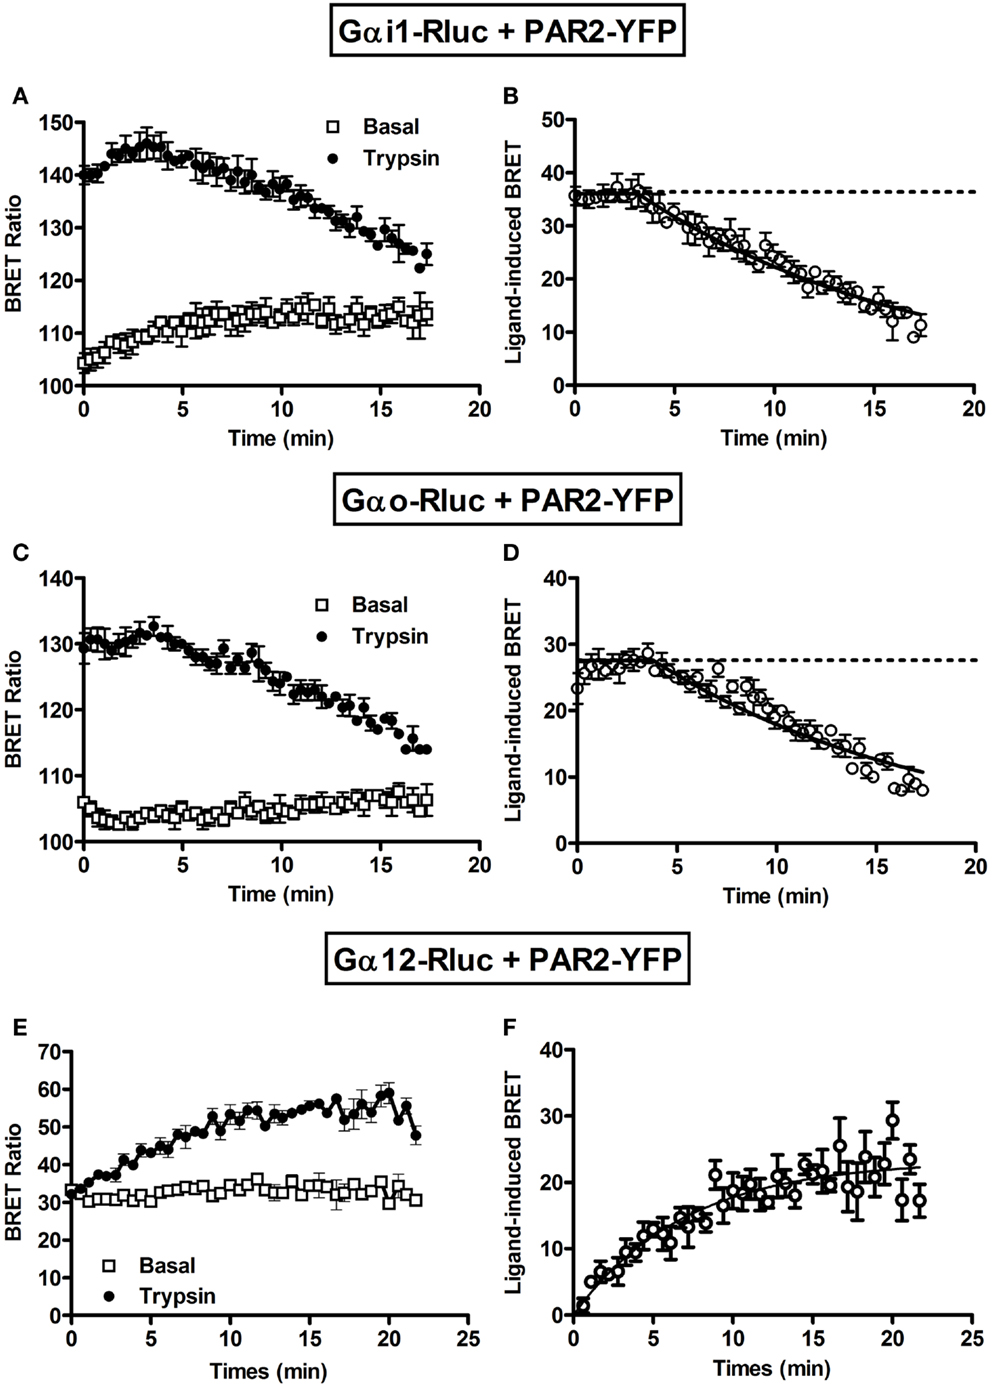
Figure 3. Long-term kinetic analysis of trypsin-induced BRET increase between PAR2 and Gα proteins. COS-7 cells transiently co-expressing PAR2-YFP and either Gαi1-Rluc (A,B) or Gαo-Rluc (C,D) or Gα12-Rluc (E,F) were used for BRET experiments in the absence (□) or presence of 100 nM of trypsin (●). For this, repetitive signals were recorded every ~35 s immediately after trypsin addition during 18–20 min. The panels (B,D,F) represent the Prism GraphPad fits of trypsin-induced BRET increase using either “Plateau followed by one phase decay” equation (Y = IF[X < X0, Y0, Plateau + (Y0 − Plateau)*exp(−K*(X−X0))]) constraining the plateau to a theoretical value of 0 for Gαi1 and Gαo or “One phase exponential association” equation (Y = Ymax*(1−exp(−K*X)) for Gα12. Data are mean ± SEM of three independent experiments performed in single points.
Together, our data indicate a pre-assembly of PAR2 with Gαi1 and Gαo but not Gα12 and nicely demonstrate the rapid agonist-promoted activation of the preassembled PAR2-G protein complexes. For Gαi1 and Gαo BRET increase likely reflects conformational changes within the preassembled complexes leading to their activation followed by their time-dependent desensitization. In contrast, the kinetic data with Gα12 suggest a delayed recruitment in time-dependent manner of the G protein to the activated PAR2. All these observations are in fact consistent with our previous data on PAR1-Gαi1 coupling (6, 7) suggesting similar profile and properties with regard to G protein coupling.
To further profile PAR2-G protein interactions and demonstrate the specificity of ligand-induced BRET increase between Rluc-tagged Gα and PAR2-YFP being associated to the activation of receptor-G protein complex we carried out dose-response analysis. After stimulation of cells with increasing doses of trypsin according to the kinetic profile of Gαi1-Rluc, Gαo-Rluc, and Gα12-Rluc, shown in Figure 3, a significant BRET increase was measured in a dose-dependent manner for Gαi1-Rluc/PAR2-YFP (Figure 4A), Gαo-Rluc/PAR2-YFP (Figure 4B), or Gα12-Rluc/PAR2-YFP (Figure 4C) complexes. To further demonstrate the specificity of trypsin effects, we also performed dose-response experiments using PAR2-selective peptide agonist, SLIGRL, which does not require receptor cleavage to activate PAR2 (20). As shown in Figure 5, SLIRGL also induced a significant BRET increase was measured in a dose-dependent manner between Gαi1-Rluc (Figure 5A), Gαo-Rluc (Figure 5B), or Gα12-Rluc (Figure 5C) and PAR2-YFP. Both trypsin and SLIGRL increased BRET signals with their expected and respective potencies (20) consistent with ligand-induced BRET increase being reflecting PAR2-G protein complex activation (Table 2).
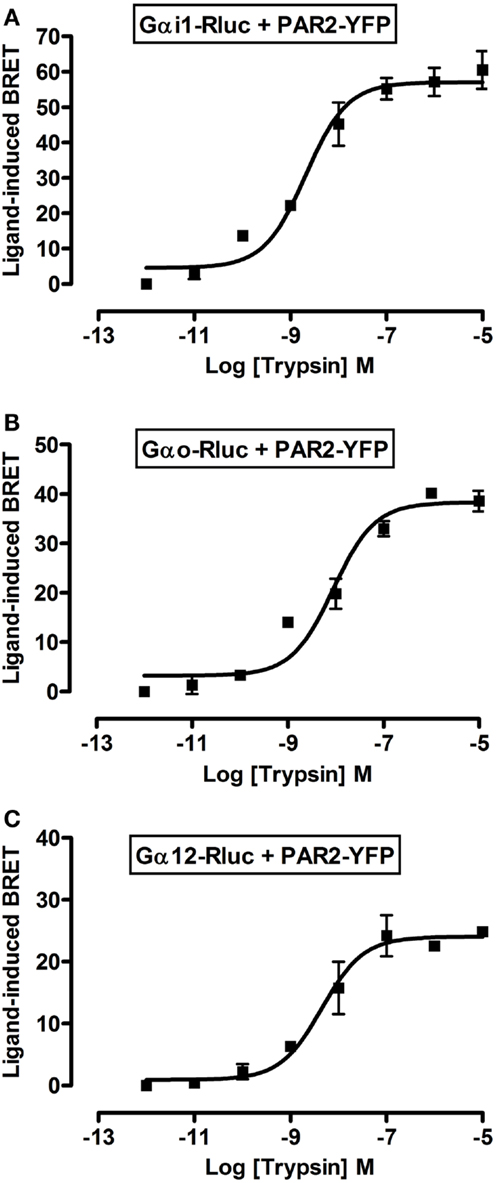
Figure 4. Dose-response analysis of trypsin-induced BRET increase between PAR2 and Gα proteins. COS-7 cells transiently co-expressing PAR2-YFP and either Gαi1-Rluc (A), Gαo-Rluc (B), or Gα12-Rluc (C) were used for BRET experiments in the presence of increasing concentrations of trypsin as indicated. Data are means ± SEM of three independent experiments performed in duplicate.
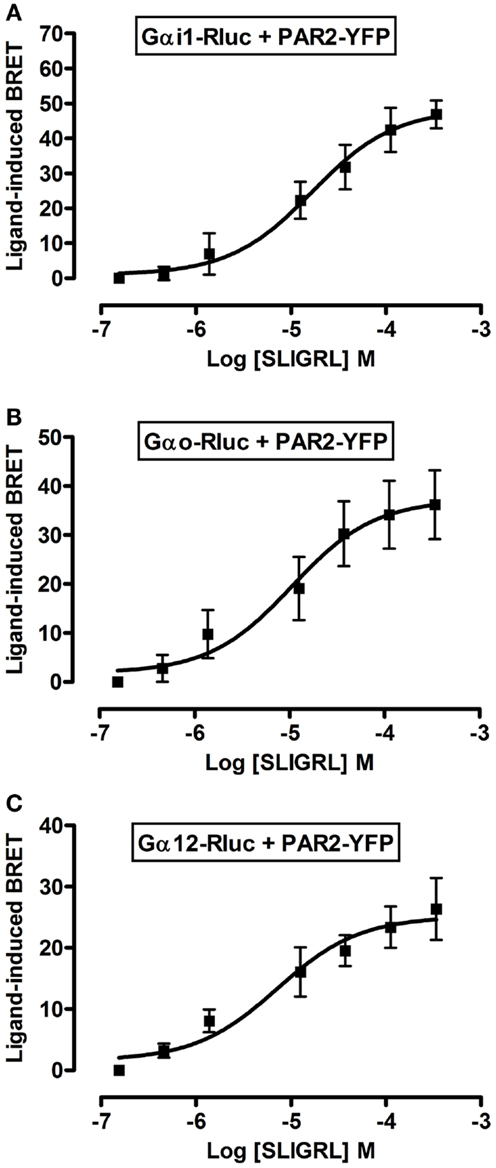
Figure 5. Dose-response analysis of SLIGRL-induced BRET increase between PAR2 and Gα proteins. COS-7 cells transiently co-expressing PAR2-YFP and either Gαi1-Rluc (A), Gαo-Rluc (B), or Gα12-Rluc (C) were used for BRET experiments in the presence of increasing concentrations of SLIGRL as indicated. Data are means ± SEM of three to four independent experiments performed in duplicate.
Finally, we examined the interaction of PAR2 with β-arrestin 1 using BRET. Indeed, the activation of PAR2 is known to be followed by its desensitization and phosphorylation at multiple serine/threonine residues in the C-terminal tail (18, 28, 30). Such phosphorylation constitutes a key step for β-arrestin recruitment to PAR2 promoting receptor internalization through clathrin-coated pits (30). As expected no significant basal BRET can be measured Rluc-β-arrestin 1 and PAR2-YFP and both 100 nM of trypsin (Figure 6A) and 10 μM SLIGRL (Figure 6B) nicely increased BRET signals. The BRET increase was time-dependent before it reached a plateau corresponding to a saturation of all the phosphorylated PAR2 with the recruited β-arrestin 1. After normalization of the data in Figures 6A and 6B to the percentage of maximal BRET in each case we noticed a slight shift in the kinetics between trypsin and SLIGRL curves (Figure 6C) with the t1/2 values indicated in Table 1. This difference in the kinetics may be due to differences in the binding and activation properties of trypsin and SLIGRL. To demonstrate the specificity of the ligand-induced BRET increase as well as the requirement of PAR2 phosphorylation for β-arrestin 1 recruitment, we used a mutant of PAR2 (PAR2-ΔC-YFP) lacking a large part of its C-terminus (from serine 348) containing multiple serine/threonine residues (28). As shown in Figure 6D, the deletion of PAR2 C-terminus completely abolished the ligand-promoted BRET increase demonstrating its implication in PAR2-β-arrestin 1 association. Moreover, both trypsin (Figure 6E) and SLIGRL (Figure 6F) induced β-arrestin 1 recruitment to PAR2 in a dose-dependent manner with similar potencies (Table 2). These BRET observations clearly show a recruitment of β-arrestin 1 to PAR2 involving the C-terminus of the receptor as previously shown (28).
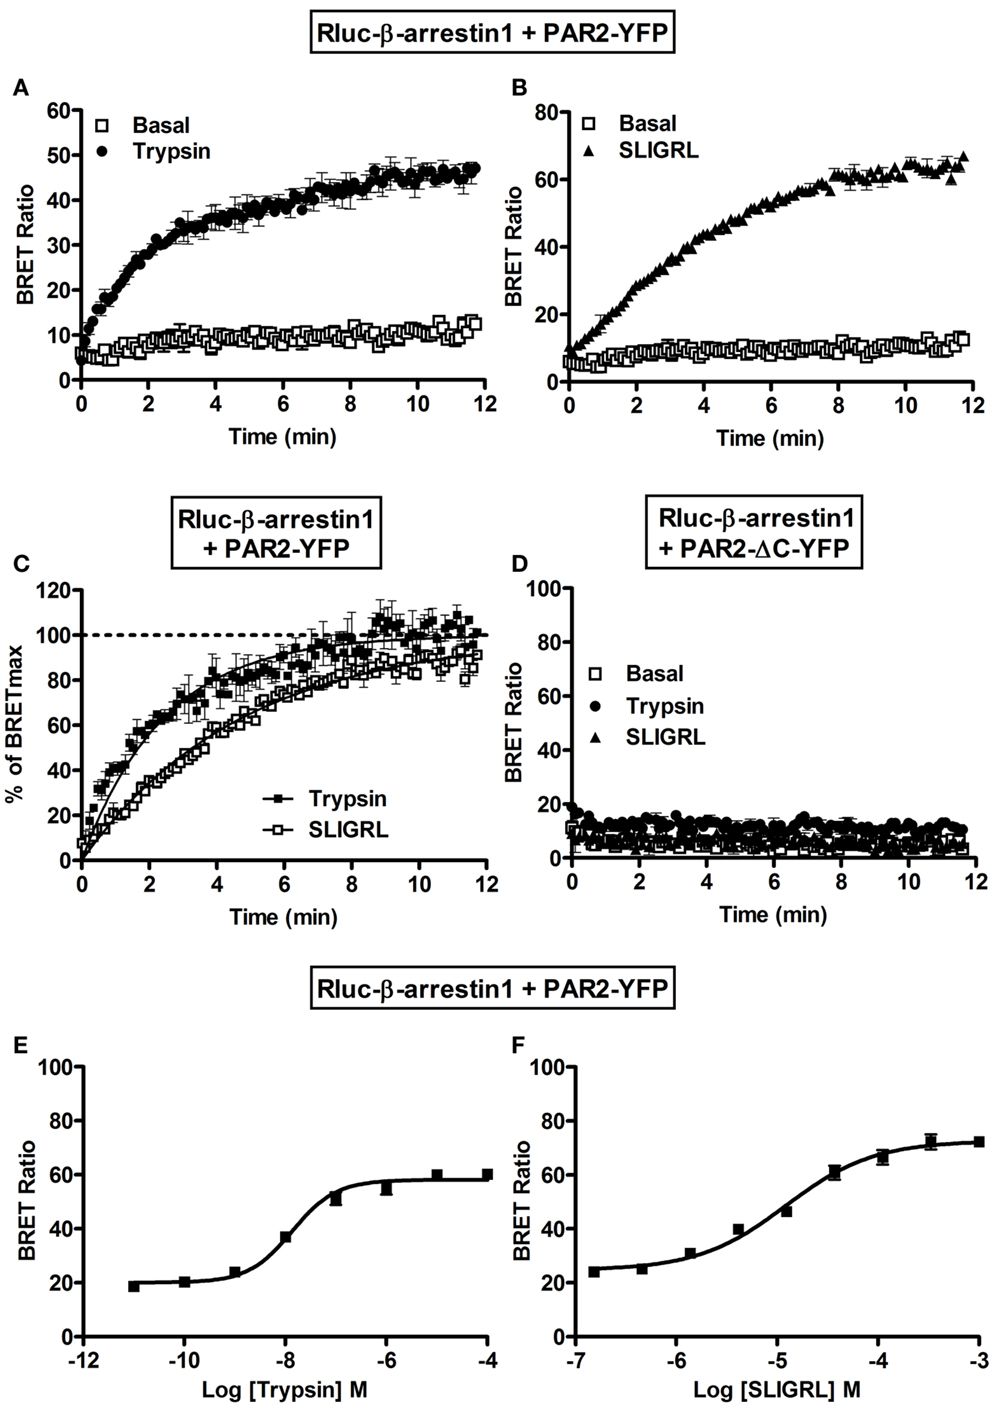
Figure 6. Recruitment of β-arrestin 1 to the activated PAR2 studied by BRET. Time-course analysis on BRET signals measured in COS-7 cells transiently co-expressing Rluc-β-arrestin 1 and either PAR2-YFP (A,B,C) or PAR2-ΔC-YFP (D) in the absence (□) or presence of 100 nM of trypsin (●) or 10 μM of SLIGRL (Δ). (C) Represents the normalization of the curves in (A,B) together on the percentage of the maximal ligand-induced BRET signals and the curves were fitted by Prism GraphPad fits of trypsin-induced BRET increase using “One phase exponential association” equation (Y = Ymax*(1−exp(−K*X))). Dose-response analysis on the increase of BRET signals between Rluc-β-arrestin 1 and PAR2-YFP upon stimulation with increasing concentrations of trypsin (E) or SLIGRL (F) as indicated. Data are means ± SEM of three independent experiments performed in duplicate.
In this study we investigated the interaction of PAR2 with three different G protein subunits, Gαi1, Gαo, and Gα12 as well as β-arrestin1 in live COS-7 cells and in real-time using BRET. We demonstrated the existence of preassembled PAR2-Gαi1 and PAR2-Gαo complexes which are nicely activated by trypsin and SLIGRL (PAR2-selective peptide agonist) indicating the coupling of PAR2 to Gαi1 and Gαo proteins in our model. However, the association of PAR2 with Gα12 protein was exclusively observed upon receptor activation similarly to β-arrestin1 recruitment suggesting different coupling mode of PAR2 with Gα12. The dose-response analysis indicated the activation of PAR2-G protein complexes with the known potencies of both trypsin and SLIGRL (20). Together, these findings are similar to what we previously reported on thrombin receptor (PAR1) (6, 7, 27) as well as other studies with other GPCR-G protein pairs (8, 31, 32).
The kinetic analysis showed that PAR2 activation led to a rapid and transient BRET increase between the receptor and either Gαi1 or Gαo proteins with t1/2 values fluctuating from 1 to 4 s. Such BRET increase likely reflects conformational changes within the activated preassembled complexes as shown for PAR1 (6, 7). Also, the rapid activation of the preassembled complexes is rather slower but still consistent with the activation kinetics observed with other GPCRs (33–35). This is in agreement with the fast kinetic for the activation of these classes of G proteins leading to rapid modulation of intracellular cAMP levels. In fact, such GPCR-G protein pre-assembly has been reported to be important to favor a certain GPCR-G protein stoichiometry required for rapid and targeted downstream cellular responses (36).
Moreover, long-term kinetic analysis revealed that the rapid agonist-induced activation of PAR2-Gαi/Gαo complexes is followed by the desensitization in time-dependent manner of the preassembled complexes. These observations are supported by the assessment of β-arrestin 1 recruitment to the activated PAR2 which showed a time-dependent association between PAR2 and β-arrestin 1 upon receptor activation with either trypsin or SLIGRL. Moreover, we further demonstrated the importance of PAR2 C-terminus for such interaction as previously reported (18, 30).
For the interaction with Gα12 protein, the data with PAR2 support our previous data with PAR1 (7). This G protein seems to be recruited to PAR2 according to an agonist-dependent process with recruitment kinetics similar to that of β-arrestin 1 (Table 1). This kinetics may be reconciled with the kinetics the activation of the small G protein RhoA and p115RhoGEF, two major protein effectors of G12/13 family (37, 38), as well as the involvement of G12/13 in slow and long-term cellular responses such as proliferation, differentiation, and migration (39, 40). However, our previous study clearly indicated that slow and sustained Gα12 recruitment cannot be considered general to all GPCRs since its pre-assembly has been demonstrated with other GPCRs (7). Therefore, whether such pre-assembly with Gαi1/o versus agonist-dependent Gα12 recruitment constitute a general feature of protease-activated receptor family or rather reflect similarities in G protein coupling between PAR1 and PAR2 this needs further investigations. Our study demonstrating the functional interaction of PAR2 with Gαi1, Gαo, and Gα12 in COS-7 cells, in a similar way to PAR1 (6, 7) shed more light on the G protein coupling of PAR2. Our observations are in agreement with the previous studies showing the coupling of PAR2 to Gαi1 in the rabbit gastric muscle cells (24) as well as PAR2 forming a stable complex with Gα12 in COS-7 cells (25). However, the latter also reported that PAR2 did not activate Gαi1- and Gαo-dependent signaling pathways (25) illustrating the complexity of PAR2-G protein coupling which appears to be strongly dependent on the cellular model considered.
Finally, our study further illustrates that the GPCR-G protein pre-assembly and agonist-dependent G protein recruitment depend on the receptor-G protein pair and the cellular background of the model used. This may constitute an important level of integration and regulation of the multiple coupling of GPCRs (1, 41–43), especially when considering the new concepts of GPCR biased signaling and heteromerization.
The authors declare that the research was conducted in the absence of any commercial or financial relationships that could be construed as a potential conflict of interest.
This work was supported by grants from French Ministry of Research and the Agence Nationale pour la Recherche (contract ANR-05-PRIB-02502).
1. Ayoub MA, Al-Senaidy A, Pin JP. Receptor-G protein interaction studied by bioluminescence resonance energy transfer: lessons from protease-activated receptor 1. Front Endocrinol (2013) 3:82. doi: 10.3389/fendo.2012.00082
2. Kocan M, Pfleger KD. Study of GPCR-protein interactions by BRET. Methods Mol Biol (2011) 746:357–71. doi:10.1007/978-1-61779-126-0_20
3. Lohse MJ, Nuber S, Hoffmann C. Fluorescence/bioluminescence resonance energy transfer techniques to study G-protein-coupled receptor activation and signaling. Pharmacol Rev (2012) 64(2):299–336. doi:10.1124/pr.110.004309
4. Pin JP, Ayoub MA, Maurel D, Perroy J, Trinquet E. Energy transfer technologies to monitor the dynamics and signaling properties of g – protein – coupled receptors in living cells. In: Pebay-Peyroula E, editor. Biophysical Analysis of Membrane Proteins – Investigating Structure and Function. (Vol. 13), Weinheim: Wiley-VCH (2008). p. 311–34.
5. Vilardaga JP, Bunemann M, Feinstein TN, Lambert N, Nikolaev VO, Engelhardt S, et al. GPCR and G proteins: drug efficacy and activation in live cells. Mol Endocrinol (2009) 23(5):590–9. doi:10.1210/me.2008-0204
6. Ayoub MA, Maurel D, Binet V, Fink M, Prezeau L, Ansanay H, et al. Real-time analysis of agonist-induced activation of protease-activated receptor 1/Galphai1 protein complex measured by bioluminescence resonance energy transfer in living cells. Mol Pharmacol (2007) 71(5):1329–40. doi:10.1124/mol.106.030304
7. Ayoub MA, Trinquet E, Pfleger KD, Pin JP. Differential association modes of the thrombin receptor PAR1 with Galphai1, Galpha12, and beta-arrestin 1. FASEB J (2010) 24(9):3522–35. doi:10.1096/fj.10-154997
8. Gales C, Van Durm JJ, Schaak S, Pontier S, Percherancier Y, Audet M, et al. Probing the activation-promoted structural rearrangements in preassembled receptor-G protein complexes. Nat Struct Mol Biol (2006) 13(9):778–86. doi:10.1038/nsmb1134
9. Maurice P, Daulat AM, Turecek R, Ivankova-Susankova K, Zamponi F, Kamal M, et al. Molecular organization and dynamics of the melatonin MT(1) receptor/RGS20/G(i) protein complex reveal asymmetry of receptor dimers for RGS and G(i) coupling. EMBO J (2010) 29(21):3646–59. doi:10.1038/emboj.2010.236
10. Qin K, Sethi PR, Lambert NA. Abundance and stability of complexes containing inactive G protein-coupled receptors and G proteins. FASEB J (2008) 22(8):2920–7. doi:10.1096/fj.08-105775
11. Coughlin SR. Protease-activated receptors in hemostasis, thrombosis and vascular biology. J Thromb Haemost (2005) 3(8):1800–14. doi:10.1111/j.1538-7836.2005.01377.x
12. Ossovskaya VS, Bunnett NW. Protease-activated receptors: contribution to physiology and disease. Physiol Rev (2004) 84(2):579–621. doi:10.1152/physrev.00028.2003
13. Cottrell GS, Coelho AM, Bunnett NW. Protease-activated receptors: the role of cell-surface proteolysis in signalling. Essays Biochem (2002) 38:169–83.
14. Coughlin SR. Thrombin signalling and protease-activated receptors. Nature (2000) 407(6801):258–64. doi:10.1038/35025229
15. Macfarlane SR, Seatter MJ, Kanke T, Hunter GD, Plevin R. Proteinase-activated receptors. Pharmacol Rev (2001) 53(2):245–82.
16. Marinissen MJ, Servitja JM, Offermanns S, Simon MI, Gutkind JS. Thrombin protease-activated receptor-1 signals through Gq- and G13-initiated MAPK cascades regulating c-Jun expression to induce cell transformation. J Biol Chem (2003) 278(47):46814–25. Epub 2003 Sep 3.
17. Soh UJ, Dores MR, Chen B, Trejo J. Signal transduction by protease-activated receptors. Br J Pharmacol (2010) 160(2):191–203. doi:10.1111/j.1476-5381.2010.00705.x
18. Stalheim L, Ding Y, Gullapalli A, Paing MM, Wolfe BL, Morris DR, et al. Multiple independent functions of arrestins in the regulation of protease-activated receptor-2 signaling and trafficking. Mol Pharmacol (2005) 67(1):78–87. doi:10.1124/mol.104.006072
19. Trejo J. Protease-activated receptors: new concepts in regulation of G protein-coupled receptor signaling and trafficking. J Pharmacol Exp Ther (2003) 307(2):437–42. doi:10.1124/jpet.103.052100
20. Al-Ani B, Wijesuriya SJ, Hollenberg MD. Proteinase-activated receptor 2: differential activation of the receptor by tethered ligand and soluble peptide analogs. J Pharmacol Exp Ther (2002) 302(3):1046–54. doi:10.1124/jpet.302.3.1046
21. Nystedt S, Emilsson K, Larsson AK, Strombeck B, Sundelin J. Molecular cloning and functional expression of the gene encoding the human proteinase-activated receptor 2. Eur J Biochem (1995) 232(1):84–9. doi:10.1111/j.1432-1033.1995.tb20784.x
22. Schultheiss M, Neumcke B, Richter HP. Endogenous trypsin receptors in xenopus oocytes: linkage to internal calcium stores. Cell Mol Life Sci (1997) 53(10):842–9. doi:10.1007/s000180050104
23. Ubl JJ, Grishina ZV, Sukhomlin TK, Welte T, Sedehizade F, Reiser G. Human bronchial epithelial cells express PAR-2 with different sensitivity to thermolysin. Am J Physiol Lung Cell Mol Physiol (2002) 282(6):L1339–48.
24. Sriwai W, Mahavadi S, Al-Shboul O, Grider JR, Murthy KS. Distinctive G protein-dependent signaling by protease-activated receptor 2 (PAR2) in smooth muscle: feedback inhibition of RhoA by cAMP-independent PKA. PLoS One (2013) 8(6):e66743. doi:10.1371/journal.pone.0066743
25. McCoy KL, Traynelis SF, Hepler JR. PAR1 and PAR2 couple to overlapping and distinct sets of G proteins and linked signaling pathways to differentially regulate cell physiology. Mol Pharmacol (2010) 77(6):1005–15. doi:10.1124/mol.109.062018
26. McLaughlin JN, Patterson MM, Malik AB. Protease-activated receptor-3 (PAR3) regulates PAR1 signaling by receptor dimerization. Proc Natl Acad Sci U S A (2007) 104(13):5662–7. doi:10.1073/pnas.0700763104
27. Ayoub MA, Damian M, Gespach C, Ferrandis E, Lavergne O, De Wever O, et al. Inhibition of heterotrimeric G-protein signaling by a small molecule acting on Galpha subunit. J Biol Chem (2009) 284(42):29136–45. doi:10.1074/jbc.M109.042333
28. Seatter MJ, Drummond R, Kanke T, Macfarlane SR, Hollenberg MD, Plevin R. The role of the C-terminal tail in protease-activated receptor-2-mediated Ca2+ signalling, proline-rich tyrosine kinase-2 activation, and mitogen-activated protein kinase activity. Cell Signal (2004) 16(1):21–9. doi:10.1016/S0898-6568(03)00095-0
29. Barnes JA, Singh S, Gomes AV. Protease activated receptors in cardiovascular function and disease. Mol Cell Biochem (2004) 263(1–2):227–39. doi:10.1023/B:MCBI.0000041864.14092.5b
30. DeFea KA, Zalevsky J, Thoma MS, Dery O, Mullins RD, Bunnett NW. Beta-arrestin-dependent endocytosis of proteinase-activated receptor 2 is required for intracellular targeting of activated ERK1/2. J Cell Biol (2000) 148(6):1267–81. doi:10.1083/jcb.148.6.1267
31. Nobles M, Benians A, Tinker A. Heterotrimeric G proteins precouple with G protein-coupled receptors in living cells. Proc Natl Acad Sci U S A (2005) 102(51):18706–11. doi:10.1073/pnas.0504778102
32. Qin K, Dong C, Wu G, Lambert NA. Inactive-state preassembly of G(q)-coupled receptors and G(q) heterotrimers. Nat Chem Biol (2011) 7(10):740–7. doi:10.1038/nchembio.642
33. Bunemann M, Frank M, Lohse MJ. Gi protein activation in intact cells involves subunit rearrangement rather than dissociation. Proc Natl Acad Sci U S A (2003) 100(26):16077–82. doi:10.1073/pnas.2536719100
34. Gales C, Rebois RV, Hogue M, Trieu P, Breit A, Hebert TE, et al. Real-time monitoring of receptor and G-protein interactions in living cells. Nat Methods (2005) 2(3):177–84. doi:10.1038/nmeth743
35. Hein P, Frank M, Hoffmann C, Lohse MJ, Bunemann M. Dynamics of receptor/G protein coupling in living cells. EMBO J (2005) 24(23):4106–14. doi:10.1038/sj.emboj.7600870
36. Philip F, Sengupta P, Scarlata S. Signaling through a G protein-coupled receptor and its corresponding G protein follows a stoichiometrically limited model. J Biol Chem (2007) 282(26):19203–16. doi:10.1074/jbc.M701558200
37. Kozasa T, Jiang X, Hart MJ, Sternweis PM, Singer WD, Gilman AG, et al. p115 RhoGEF, a GTPase activating protein for Galpha12 and Galpha13. Science (1998) 280(5372):2109–11. doi:10.1126/science.280.5372.2109
38. Tanabe S, Kreutz B, Suzuki N, Kozasa T. Regulation of RGS-RhoGEFs by Galpha12 and Galpha13 proteins. Methods Enzymol (2004) 390:285–94. doi:10.1016/S0076-6879(04)90018-3
39. Dhanasekaran N, Dermott JM. Signaling by the G12 class of G proteins. Cell Signal (1996) 8(4):235–45. doi:10.1016/0898-6568(96)00048-4
40. Riobo NA, Manning DR. Receptors coupled to heterotrimeric G proteins of the G12 family. Trends Pharmacol Sci (2005) 26(3):146–54. doi:10.1016/j.tips.2005.01.007
41. Hamm HE. The many faces of G protein signaling. J Biol Chem (1998) 273(2):669–72. doi:10.1074/jbc.273.2.669
42. Hermans E. Biochemical and pharmacological control of the multiplicity of coupling at G-protein-coupled receptors. Pharmacol Ther (2003) 99(1):25–44. doi:10.1016/S0163-7258(03)00051-2
Keywords: BRET, PAR2, trypsin, G proteins, β-arrestin, pre-assembly
Citation: Ayoub MA and Pin J-P (2013) Interaction of protease-activated receptor 2 with G proteins and β-arrestin 1 studied by bioluminescence resonance energy transfer. Front. Endocrinol. 4:196. doi: 10.3389/fendo.2013.00196
Received: 21 November 2013; Paper pending published: 04 December 2013;
Accepted: 08 December 2013; Published online: 20 December 2013.
Edited by:
Ross Bathgate, Florey Neuroscience Institutes, AustraliaReviewed by:
Nicola J. Smith, Victor Chang Cardiac Research Institute, AustraliaCopyright: © 2013 Ayoub and Pin. This is an open-access article distributed under the terms of the Creative Commons Attribution License (CC BY). The use, distribution or reproduction in other forums is permitted, provided the original author(s) or licensor are credited and that the original publication in this journal is cited, in accordance with accepted academic practice. No use, distribution or reproduction is permitted which does not comply with these terms.
*Correspondence: Mohammed Akli Ayoub, Department of Molecular Pharmacology, CNRS UMR5203 – INSERM U661, Institute of Functional Genomics, Universities of Montpellier 1 & 2, Montpellier, France e-mail:bWF5b3ViQGtzdS5lZHUuc2E=
Disclaimer: All claims expressed in this article are solely those of the authors and do not necessarily represent those of their affiliated organizations, or those of the publisher, the editors and the reviewers. Any product that may be evaluated in this article or claim that may be made by its manufacturer is not guaranteed or endorsed by the publisher.
Research integrity at Frontiers

Learn more about the work of our research integrity team to safeguard the quality of each article we publish.