 Elizabeth Williams
 Syaribah N. Brice1,2
94% of researchers rate our articles as excellent or good
Learn more about the work of our research integrity team to safeguard the quality of each article we publish.
Find out more
ORIGINAL RESEARCH article
Front. Disaster Emerg. Med., 11 February 2025
Sec. Emergency Health Services
Volume 3 - 2025 | https://doi.org/10.3389/femer.2025.1462764
Objective: Emergency department (ED) frequent attenders (FA) have been the subject of discussion in many countries. This group of patients have contributed to the high expenses of health services and strained capacity in the department. Studies related to ED FAs aim to describe the characteristics of patients such as demographic and socioeconomic factors. The analysis may explore the relationship between these factors and multiple patient visits. However, the definition used for classifying patients varies across studies. While most studies used frequency of attendance to define the FA, the derivation of the frequency is not clear.
Methods: We propose a mathematical methodology to define the time interval between ED returns for classifying FAs. K-means clustering and the Elbow method were used to identify suitable FA definitions. Recursive clustering on the smallest time interval cluster created a new, smaller cluster and formal FA definition.
Results: Applied to a case study dataset of approximately 336,000 ED attendances, this framework can consistently and effectively identify FAs across EDs. Based on our data, a FA is defined as a patient with three or more attendances within sequential 21-day periods.
Conclusion: This study introduces a standardized framework for defining ED FAs, providing a consistent and effective means of identification across different EDs. Furthermore, the methodology can be used to identify patients who are at risk of becoming a FA. This allows for the implementation of targeted interventions aimed at reducing the number of future attendances.
Emergency departments (EDs) are the first point of contact for patients who require urgent medical care. The ED is a complex system influenced by many factors, including the patient, the staff, the hospital, and the community. The ED is a dynamic system that is constantly changing. The number of patients attending EDs has increased over the years, with attendances in England rising by 20% between 2008 and 2018 (1). This increase in attendances has resulted in EDs becoming overcrowded, with patients experiencing long waiting times. The increase in attendance has also led to a rise in the number frequent attenders (FAs). FAs, sometimes referred to as frequent flyers or frequent users, are patients who attend EDs multiple times within a given period. Although this group of patients represents a small minority, they contribute significantly to the volume of ED attendances, which continues to increase each year (2–4).
It is important to recognize that the high utilization of ED services by FAs is not simply a reflection of these patients being a burden on the healthcare system. Rather, FAs are often dealing with complex, chronic medical and social issues that are not being adequately addressed elsewhere in the care system. Conditions such as asthma (5), cancer (6), neurological issues (7) and mental health and alcoholism concerns (4, 8) contribute significantly to individuals making multiple visits to the ED.
ED FAs are associated with an increased risk of admission, mortality (9), and hospital length of stay (LOS) (10). Ultimately, they contribute to the high utilization of ED personnel or other services such as ambulance services (11, 12), primary care (13), community health centers (14), and social services (15). The challenge is to identify these patients systematically and provide them with coordinated, comprehensive care.
Studies related to FAs aim to investigate the factors that influence repeated visits, the broader impact of FA attendances on health and social services and the efficacy of intervention programmes in mitigating attendances. These influencing factors encompass a spectrum, ranging from the clinical challenges faced by patients to their demographic profiles, environmental context and behavioral patterns. While exploring factors associated with FAs is a prevalent focus in the literature, it is worthwhile noting that the definition of an FA can vary. The most commonly employed criterion for identifying FAs involves their attendance frequency. Typically, a FA is defined as a patient who attends the ED more than a determined threshold within a given period. Table 1 demonstrates the different definitions used in the literature across different countries. Within these papers, there was no justification for how they defined a FA. When different definitions are employed within the same country, a significant challenge arises in determining the true prevalence of FAs. Recognizing and accurately identifying FAs is critical because they are known to contribute to the high expenses of health services (16–18). It is important to recognize that these individuals have needs that require attention, even if those needs are not clearly linked to a specific medical condition (19). This means they may face ongoing challenges in their daily lives, such as social, emotional or psychological issues, that do not always show up in traditional medical assessments but significantly impact their overall well-being (20).
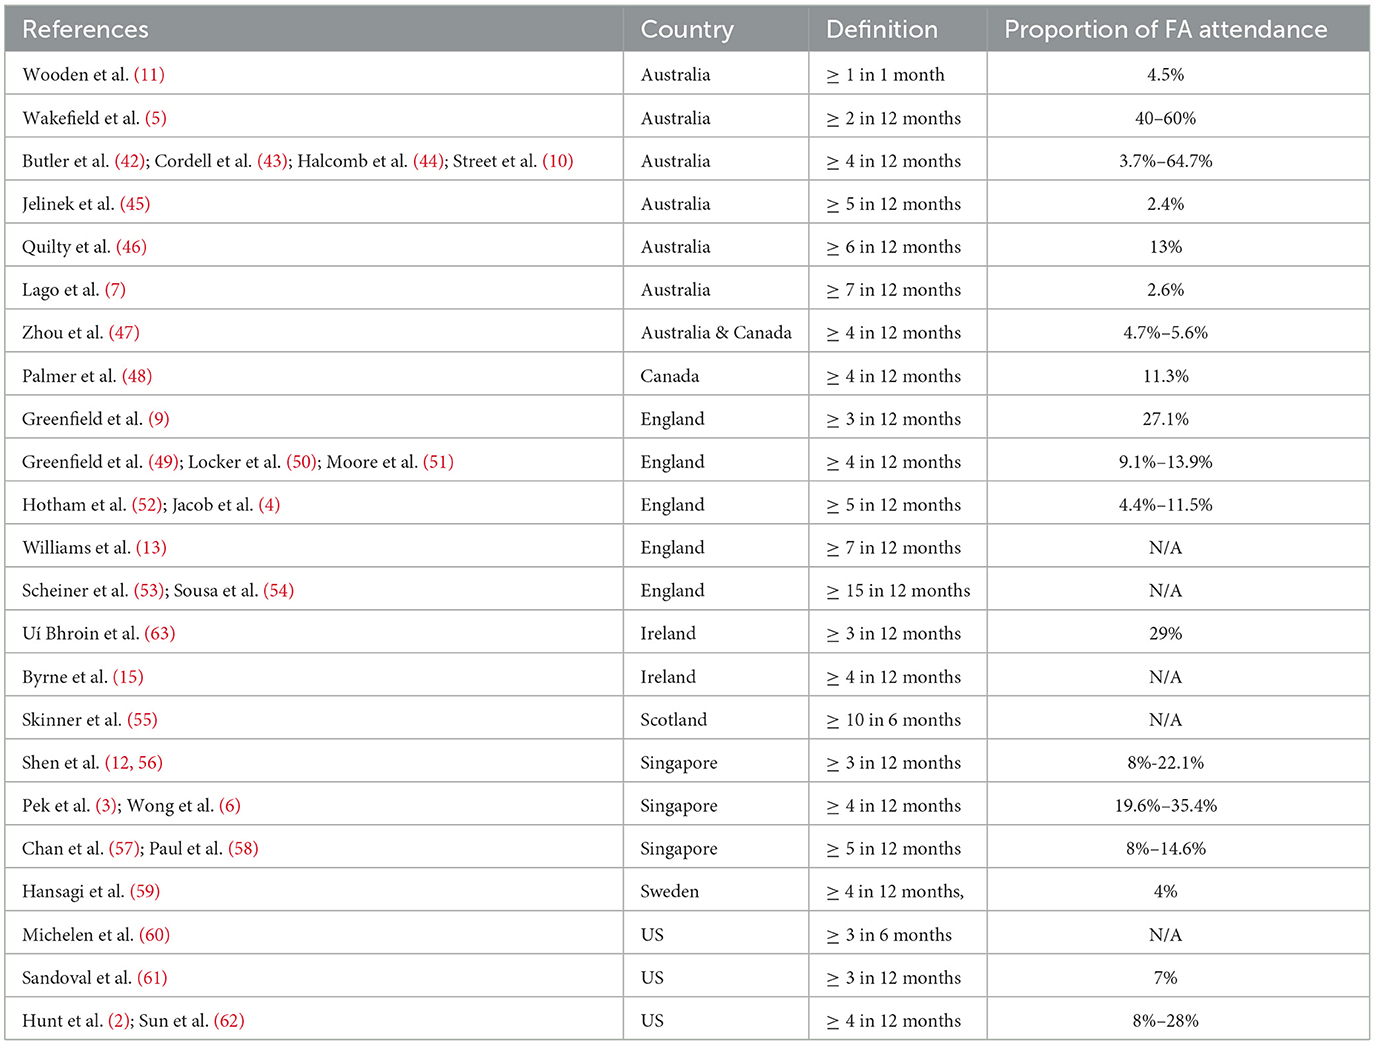
Table 1. Published definitions of frequent attenders of EDs.
The definition of FAs should be tailored to each ED, driven by data and reflective of the unique patient characteristics and demographics of each ED. Acknowledging the variability across different EDs, a data-driven approach ensures a more relevant understanding of FAs within each setting. Furthermore, the definition should be dynamic enough to operate in real-time, allowing the prompt identification of individuals who are at risk of becoming FAs. This real-time capability is crucial for swiftly implementing targeted interventions aimed at reducing the number of future attendances by ensuring the needs of these individuals are met.
By aligning the definition with the specific attributes of each ED's patient population and incorporating a real-time capability, healthcare providers can enhance their ability to proactively address the complex medical, social and environmental factors that put certain individuals at risk of becoming FAs (21). Rather than simply viewing FAs as a challenge posed by the patients themselves, this approach recognizes it as a reflection of shortcomings in the broader system of care (22). With this understanding, providers can work to implement holistic, patient-centered interventions that connect FAs with the appropriate resources and support they need.
This study aims to introduce a mathematical methodology for determining the time interval between successive visits to EDs that qualifies a patient as a FA. This proposed methodology holds the potential to establish a standardized framework applicable not only to the specific ED under investigation but also transferable for defining FAs in other EDs. The distinctive advantage of employing a mathematical approach lies in its precision and adaptability. Unlike alternative methods, a mathematical methodology offers a systematic and data-driven way to objectively identify FAs based on time intervals between visits. Furthermore, this method's versatility enhances its applicability to a wide range of EDs, accommodating the variability in patient demographics and characteristics. By offering a standardized yet flexible approach, the proposed mathematical methodology provides a valuable tool for healthcare providers seeking a consistent and effective means of identifying FAs.
This study employed a retrospective cohort design, utilizing data from a major ED department in Wales, UK. Spanning a six-year period, from January 2017 to December 2022, the research sought to explore patterns of ED visits and define FAs based on time intervals between return visits. The retrospective cohort design allowed for the examination of historical data to discern trends and associations.
The study population consisted of adult patients, defined as individuals aged 17 years or older, who sought medical attention at the ED between January 2017 and December 2022, who were classified as a ‘Major' patient. The ED defines a major patient as one who requires very urgent emergency care (23). The decision to focus exclusively on ‘Major' patients in this study was guided by the need to align the model with the clinical and operational priorities of EDs. Major patients are characterized by high-acuity conditions that necessitate significant resources and urgent care. Their frequent attendances impose a disproportionate burden on ED resources, making them a critical group for targeted intervention strategies (24). However, it is important to note that this classification is inherently subjective and may vary across institutions. By tailoring the model to identify patterns specific to this cohort, the study aims to address the most pressing challenges associated with ED overcrowding and resource allocation.
Our initial dataset contained 336,898 patients. We applied data preprocessing to retain only patients with complete demographic and clinical information relevant to our analysis. First, 66 patients were removed due to missing National Health Service (NHS) numbers. Next, 233 patients lacked recorded admission or discharge dates and times, leading to their exclusion. We also filtered out 512 patients based on implausible age data, specifically those recorded as being over 120 years old. Finally, 46 patients were removed due to incomplete information on gender.
This filtering, designed with the specific purpose of enabling the ability to track patients and time between visits, resulted in a total of 184,051 patients, contributing to a total of 336,041 ED visits. Of these visits, 152,183 (45%) were identified as return visits, denoting subsequent visits made after the initial identified visit. Notably, 34.6% of patients made more than one visit within the specified six-year timeframe. This comprehensive dataset provided a robust foundation for the subsequent analyzes.
This research introduces an innovative approach to defining FAs by shifting from traditional frequency-based definitions to a time interval-based definition. Our research investigated diverse statistical clustering methodologies to establish an enhanced definition of frequent ED users that goes beyond simple visit counts. While previous research typically relied on basic frequency measurements to classify FAs, we sought to develop a more sophisticated approach by considering both the number of visits and the temporal spacing between them. Although Monte Carlo methods, which are well-known in healthcare management for their probabilistic sampling approach, might seem an appropriate choice given their familiarity in ED settings, we opted for a deterministic clustering approach. Unlike Monte Carlo simulations, which provide probabilistic approximations that vary between runs, our selected methodology needed to deliver consistent, reproducible classifications of frequent attenders. This requirement for deterministic outcomes, combined with our focus on identifying distinct patterns in visit frequency and timing, led us to explore various clustering techniques.
We systematically evaluated multiple clustering algorithms to determine their effectiveness. Our approach aligns with machine learning model selection principles, including data preparation, feature selection and model optimization, as detailed by Ramlakhan et al. (25), to ensure robust and reproducible outcomes. Initially, we investigated hierarchical clustering through the agglomerative approach, which demonstrated strengths in gradual cluster formation but proved impractical for our extensive ED dataset due to its computational demands. We then explored Density-Based Spatial Clustering of Applications with Noise (DBSCAN) and the Ordering Points to Identify the Clustering Structure (OPTICS) algorithms, which excel at identifying irregularly shaped clusters and isolating outliers. However, these methods presented challenges in our context due to their requirement for specific density parameters, which proved difficult to optimize given the variable patterns of ED utilization.
We also considered Gaussian Mixture Models (GMM) for their probabilistic approach to cluster assignment. Yet, the underlying assumption of normally distributed data made this method suboptimal for our ED visit patterns, which typically follow non-Gaussian distributions. The K-modes algorithm was also evaluated, particularly for its strength in categorical data analysis, but it failed to adequately capture the temporal aspects of visit patterns that were crucial to our study.
After comprehensive testing, K-means clustering initially emerged as the optimal methodology. However, due to the wide range of time scales present in the data, we extended this to a two-stage K-means approach. The initial K-means method was selected based on several factors: its computational efficiency when handling large datasets, its ability to effectively process both visit frequency and inter-visit intervals and its straightforward implementation approach. To determine the ideal number of clusters for each stage, we employed the Elbow method, which helped us identify the point where additional clusters provided minimal additional benefit, thus optimizing the balance between model complexity and accuracy.
The final framework, combining two-stage K-means clustering with Elbow method optimization, represents a significant advancement in identifying ED frequent attenders. This hierarchical approach provides a more nuanced understanding compared to traditional counting methods by first grouping patients based on their temporal visit patterns, followed by sub-clustering based on visit frequencies. Our methodology offers a more comprehensive and accurate way to identify and understand patterns in ED utilization, particularly when dealing with varying time scales, which can better inform healthcare resource allocation and intervention strategies.
In the broader literature, K-means clustering has been successfully used on ED data to predict patient outcomes and ED utilization. For example, Grant et al. (26) applied K-means to identify patients with complex profiles, predicting diverse healthcare utilization and mortality outcomes. Additionally, Liu et al. (27) used K-means clustering to create a triage system within EDs, with Huang et al. (28) clustering patients against medical utilization, discovering that their FA population, more often utilised other medical services.
To provide insight into the mathematical model for the clustering algorithm, the K-means method clusters together ED patient data points with similar returns to ED times. K-means clustering is an iterative machine learning algorithm designed to partition a dataset into K clusters, where each data point is assigned to the cluster with the nearest mean. The goal is to minimize the within-cluster sum of squares, which is represented by the objective function:
where n is the number of data points, is the jth data point in cluster i and ci is the centroid of cluster i. is the Euclidean distance between the data point and the centroid.
To provide a definition for FA, recursive clustering was applied to the cluster with the smallest LOS mean (n1). This means the K-means clustering algorithm was then performed again on the smallest cluster to create m new clusters from cluster n1. The cluster with the smallest LOS mean (m1) was then used to define a FA. This method is known as two-stage K-means clustering (29). In two-stage clustering, the initial clustering identifies broad groups in the data. Then, clustering is applied a second time to divide the groups into more granular segments. Applying this technique to healthcare data has provided useful insights in many cases (30–32). For more detail about the K-means method, we have provided a step-by-step applied example in the Supplementary material.
Determining the optimal number of clusters is an important step in the K-means clustering method. The Elbow method is a heuristic method used to determine the optimal number of clusters (K) in a dataset. The idea is to perform the K-means algorithm for a range of values K, calculate the sum of squared distances from each point to its assigned center (J), and plot the results. The ‘elbow' point is often considered the point where the rate of decrease of J slows down, suggesting that the addition of more clusters does not significantly reduce the within-cluster sum of squares. The algorithm uses the same objective function as the K-means clustering algorithm, Equation 1. The Elbow method offers an empirical approach to determine the appropriate number of clusters based on the data itself. However, it is important to note that identifying the exact location of the elbow involves a qualitative assessment and subjective judgement.
This study examines the impact of FAs on ED resources by quantifying ‘hours of patient ED time', representing the cumulative hours FAs spend in EDs. This metric serves as an indicator of the system burden created by FAs. We calculated this based on the average duration each patient remained in the ED per visit. Estimating ‘hours of patient ED time' allows for a clearer assessment of how reducing specific frequent attendance patterns could alleviate ED capacity strains, aligning with the NHS four-hour wait target for patients.
This section will present the results of applying the K-means clustering and Elbow method to the ED data. The results discussed will include the descriptive statistics of the data, the clustering results, and the definition of a FA.
The K-means clustering and Elbow method as discussed previously was performed on the six years' worth of data from 1st January 2017 to 31st December 2022. The total number of patients included in the dataset was 184,051 who made a total of 336,041 visits. The proportion of male and female patients is 48% and 52% respectively. The distribution of male and female patients' ages is significantly different (Kruskal Wallis test = 201.9, p < 0.001). The mean age for male patients is 49 years old (Q1 = 30, Q3 = 66) compared to the mean age for female patients of 48.6 years old (Q1 = 27, Q3 = 69). The average total time spent in the ED department was calculated to be 10.7 hours (sd = 16.8 hours) per patient. However, the median total time spent was found to be 5.6 hours with 50% of patients staying in the ED between three and 11 hours. At an aggregated level, there was no significant difference between male and female patients' time spent in the ED (p = 0.25). Within 30 days of attending the ED, 25% of patients will present again. Around 36.2% female patients have return visits compared to 33.1% male patients.
The Elbow method was performed on the data, with the results showing the elbow occurs at K = 3. Therefore, the K-means clustering algorithm was performed with K = 3. The results show three determined clusters between 0 and 324 days, 325 and 913 days and, 914 and 2171 days (Table 2). The smallest cluster is between 0 and 324 days, with 68.58% of patients falling into this cluster. The mean time between visits for this cluster is approximately three months.
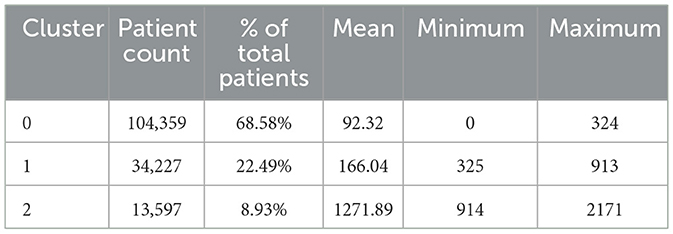
Table 2. Results from the K-means clustering algorithm.
Since returning within 324 days provides too broad of a definition for a FA, the K-means clustering algorithm was performed again on this cluster. Taking the smallest cluster of returning between 0 and 324 days, the Elbow method was performed again to determine the optimal number of clusters. The results show an Elbow method of eight clusters. Therefore, performing the K-means algorithm with eight clusters results in the smallest cluster being between 0 and 21 days. Overall, there are 31.4% of patients falling into this cluster. The mean time between visits for this cluster is 7.08 days (Table 3). This cluster accounts for 9.72% of all attendances. In practice, this represents 10.1% of patients. In our analysis, we found that age did not significantly impact the clustering results, indicating that the observed patterns in patient characteristics were consistent across both adult and elderly populations.
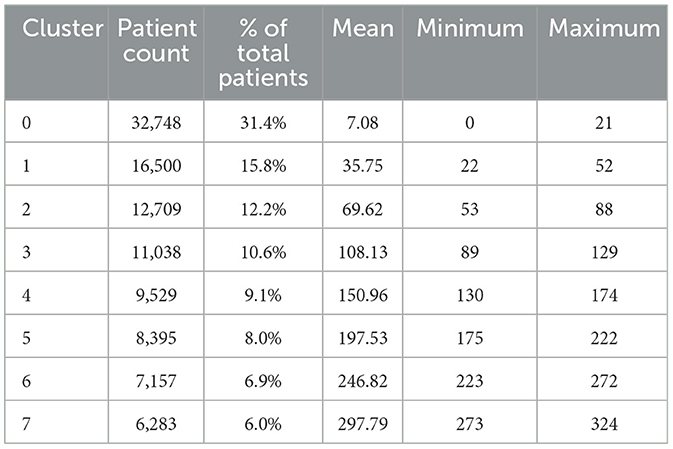
Table 3. Results from the two-stage K-means clustering algorithm.
The results from the two-stage K-means clustering algorithm show that the smallest cluster is between 0 and 21 days. In order to provide a formal definition, this cluster can be examined further.
Our provisional definition will specify a threshold number of visits within each 21 day period as qualifying for FA status. As illustrated in Figure 1 the 21 day count is reset after each visit, so the frequency pattern is evaluated over rolling 21 day windows. This approach quantifies FA based on the number of admissions within sequential 21 day periods, rather than just looking at the initial admissions. By scrutinizing the admission patterns in this manner, we can precisely define FAs as exhibiting a high number of admissions in 21 days, recurrently over time. This definition captures the essence of multiple frequent admissions over successive short intervals, which is the key characteristic of FAs.
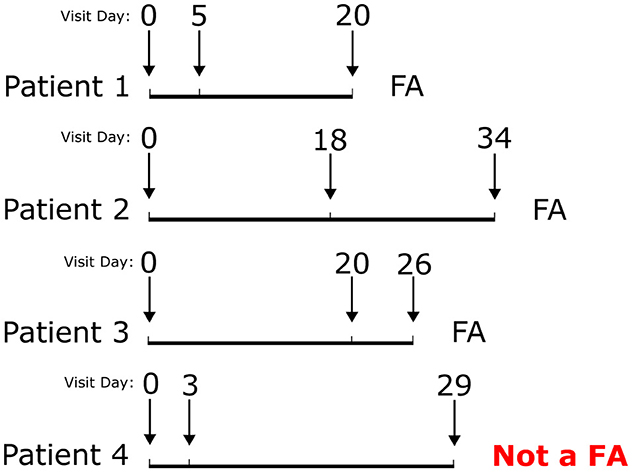
Figure 1. Visualization of FA definition.
Analysis of the 0 to 21 day cluster, reveals patients in this group exhibit a high rate of recurrent readmissions over short time intervals. Specifically, on average, if a patient in this cluster attends within 21 days of discharge, they will have an additional 1.8 attendances in the subsequent 21 days. As depicted within Figure 1, there is a pattern of multiple repeat admissions within 21 day subsequential periods. Therefore, based on the ED data used, we propose a FA is defined as a patient who has three or more attendances within sequential 21 day periods.
The selection of the 21-day period was guided by the results of K-means clustering, which identified this as the smallest cluster with frequent and recurrent attendances. This interval aligns with acute care utilization patterns observed in FAs and represents a meaningful timeframe for intervention. The choice of three attendances within the 21-day window reflects a balance between sensitivity and specificity. While two attendances in this period may signify episodic or transient patterns, three or more visits indicate sustained and potentially preventable reliance on ED services. This threshold ensures the definition targets a group whose frequent usage imposes significant demands on resources.
It is acknowledged that patients attending less frequently, such as once per month, may not meet the FA definition if they only accumulate two attendances in any successive 21-day clusters. However, this reflects an intentional focus on patients with more intense usage patterns, who are most likely to benefit from targeted care interventions. Those with less frequent but consistent visits are typically better served by outpatient or primary care pathways rather than interventions aimed at reducing high-frequency ED usage.
This study introduced a novel application of K-means clustering and the Elbow method to define frequent ED attenders based on time intervals, instead of visit frequency. Applied to six years of data from one major ED, the technique found a pattern of repeat visits within 21 day periods. This identified a data driven definition of a FA as a patient who has three or more attendances within sequential 21 day periods, capturing recurrent high utilization of ED services over short intervals. When compared to the literature, as shown in Table 1, the 9% FA rate is comparable with other studies, demonstrating the validity of the approach. The proposed methodology offers a standardized framework to quantify FAs in an adaptive way which can be tailored to each ED's unique patient population.
Using the suggested framework, the definition for a FA is three attendances within sequential 21-day periods. This definition is data-driven and tailored to the specific ED dataset analyzed. However, applying the framework to different ED data would likely result in a different definition, reflecting the variability in patient demographics and attendance patterns across settings. While it is challenging to directly compare frequency-based methods with time-interval approaches, our methodology offers greater precision by identifying FAs more quickly. By focusing on shorter intervals, it can detect changes in attendance patterns, including seasonal variations, more quickly. This allows for earlier identification of FAs and enables the timely implementation of targeted interventions, which is crucial for managing the high resource demands associated with frequent attendance.
While this study introduced a methodology using data from a single ED, the overall mathematical approach has the potential for broader generalisability. The technique provides a standardized framework that could be applied to other EDs to adaptively define FAs based on their specific patients and utilization patterns. However, the generalisability may be influenced by factors such as patient demographics, healthcare system differences and access to primary care.
The optimal clustering patterns and FA definitions may differ across EDs, with substantially different contexts and patient mixes. Therefore, while the method itself is generalisable, with a structured framework provided, the specific resulting FA definition would likely need to be tailored and validated for each ED environment based on its unique characteristics. This includes testing the model on unseen datasets and validating against domain-expert-defined FA populations to ensure its applicability across settings (33–35). This flexible mathematical approach means an adaptive solution can be implemented, rather than imposing a universal standard definition that fails to capture local variability. Additional research across diverse settings is needed to further test the methodology and refine definitions suited to different ED contexts.
The impact of FAs on EDs is substantial, with high utilization leading to increased waiting times, costs and reduced quality of care (36–38). However, it is crucial that this is done in a compassionate, patient-centered manner that recognizes the complex needs of this population, rather than simply viewing them as a burden on the system. While the 21-day period is used to identify recurrent patterns of ED use and forecast immediate resource savings, it is important to emphasize that interventions targeting FAs are not expected to yield results within such a short timeframe. The true value of identifying FAs early lies in the ability to implement long-term, coordinated care strategies, such as chronic disease management and mental health support, that can help reduce persistent ED use over time. The 21-day window serves as a tool for early identification, enabling proactive and sustained care that addresses the root causes of frequent ED visits.
If the fourth visit within 21 days is prevented, this would result in 43,075.20 hours of patient ED time saved per year, with an average of 6.3 hours per patient in an ED. If this was able to be increased to prevent third visits onwards within 21 days, this would result in 62,937 hours of patient ED time saved per year.
Calculating the average time patients spend with an ED doctor within our dataset equates to 42 minutes per patient. This is comparable to other ED studies (39, 40). This value can be used to estimate the impact of FAs on ED resources. For example, if we prevent visits from the fourth attendance within 22 days, this would result in 3,418.67 minutes of doctor time saved per year. This equates to 142.44 hours per year. Similarly, if we were to reduce this to the third visit, this would increase to 208.13 hours of doctor time saved per year. By saving doctor hours, this could be used to treat other patients, reducing waiting times, improving the quality of care and reduce the pressures faced on current staff.
It is important to note that the goal of this work is not to simply reduce or restrict FA attendance, as that could further exacerbate the challenges they face in accessing appropriate care. Rather, the aim is to use the identification of FAs as an opportunity to proactively content them with the coordinated, patient-centered services they require to address the root cause driving their high utilization. This compassionate, system-level approach has the potential to improve outcomes for this vulnerable population by supporting them to access care and support from providers suitable for their needs, whilst also alleviating pressures on the emergency care system.
This study has some limitations to consider. Firstly, the data was used from a single ED from a single country, which might not be fully representative of other EDs or healthcare systems. Secondly, even though six years' worth of data was used, this may not have been sufficient to capture the full range of utilization patterns. Our data included the period of Covid19 when traditionally there were fewer attendances to ED (41). This could have resulted in patients not being classified as a FA when they would have been in a non-Covid period. Thirdly, the use of the ‘Major' patient classification in the ED is inherently subjective and can vary across different institutions. The categorization of patients as ‘Major' or ‘Minor' typically relies on clinical judgment, which introduces variability that could impact the generalisability of the model. Another limitation is that the data was limited to the ED and did not include other healthcare services. This means that patients who were classified as a FA may have been using other healthcare services, which could have resulted in a different FA definition. Finally, the study only focused on temporal patterns in defining FAs, whereas with additional clinical and demographic factors, further insight could have been provided into high utilisers of ED services.
In conclusion, this study presents an innovative methodology for defining FAs based on time intervals between ED visits. The approach offers a standardized framework that can be applied to different EDs to define FAs based on their specific patients and utilization patterns. This methodology provides a data driven approach to precisely identify FAs, enabling targeted interventions to reduce future attendances. By shifting from traditional frequency based definitions to a time interval based definition, a FA can be identified more efficiently. This mathematical approach provides a valuable tool for healthcare providers seeking a consistent and effective means of identifying FAs. Future research should focus on utilizing the method with clinical and demographic factors to further refine FA definitions and explore the impact in practice of interventions on FAs.
The datasets presented in this article are not readily available because the data underlying for this article cannot be shared due to patient confidentially and information governance. However, descriptions of the data items and their data types can be shared if requested. Requests to access the datasets should be directed to V2lsbGlhbXNlbTIwQGNhcmRpZmYuYWMudWs=.
EW: Writing – original draft, Conceptualization, Formal analysis, Methodology. SB: Conceptualization, Formal analysis, Methodology, Writing – original draft. DP: Conceptualization, Formal analysis, Methodology, Writing – review & editing.
The author(s) declare financial support was received for the research, authorship, and/or publication of this article. The research reported in this publication was supported by the collaboration between Cardiff University and Cardiff and Vale University Health Board, with funding gratefully received from the Digital and Health Intelligence directorate.
The authors gratefully acknowledge the invaluable insights from the staff of the Emergency Department at Cardiff and Vale University Health Board. Specifically, we would like to express our sincere thanks to Anna Sussex, former National Programme Manager for Frequent Attenders within Public Health Wales and founder of the Welsh Emergency Department Frequent Attender Network, for sharing her knowledge and insights into the ED Frequent Attender programme.
The authors declare that the research was conducted in the absence of any commercial or financial relationships that could be construed as a potential conflict of interest.
All claims expressed in this article are solely those of the authors and do not necessarily represent those of their affiliated organizations, or those of the publisher, the editors and the reviewers. Any product that may be evaluated in this article, or claim that may be made by its manufacturer, is not guaranteed or endorsed by the publisher.
The Supplementary Material for this article can be found online at: https://www.frontiersin.org/articles/10.3389/femer.2025.1462764/full#supplementary-material
1. Budhwani N, Capanna M, Baban A, Isetta M, Oldman A, Daniels N, et al. Care planning or case management for frequent emergency department attendance in adults. Cochr Datab Syst Rev. (2022) 15:CD014662. doi: 10.1002/14651858.CD014662
2. Hunt KA, Weber EJ, Showstack JA, Colby DC, Callaham ML. Characteristics of frequent users of emergency departments. Ann Emerg Med. (2006) 48:18–20. doi: 10.1016/j.annemergmed.2005.12.030
3. Pek PP, Lau CY, Sim X, Tan KB, Mao DRH, Liu Z, et al. Nationwide study of the characteristics of frequent attenders with multiple emergency department attendance patterns. Ann Acad Med. (2022) 51:483–92. doi: 10.47102/annals-acadmedsg.2021483
4. Jacob R, Wong ML, Hayhurst C, Watson P, Morrison C. Designing services for frequent attenders to the emergency department: a characterisation of this population to inform service design. Clini Med. (2016) 16:325–9. doi: 10.7861/clinmedicine.16-4-325
5. Wakefield M, Staugas R, Ruffin R, Campbell D, Beilby J, McCaul K. Risk factors for repeat attendance at hospital emergency departments among adults and children with asthma. Aust N Z J Med. (1997) 27:277–84. doi: 10.1111/j.1445-5994.1997.tb01979.x
6. Wong TH, Lau ZY, Ong WS, Tan KB, Wong YJ, Farid M, et al. Cancer patients as frequent attenders in emergency departments: a national cohort study. Cancer Med. (2018) 7:4434–46. doi: 10.1002/cam4.1728
7. Lago L, Westley-Wise V, Mullan J, Lambert K, Zingel R, Carrigan T, et al. Here one year, gone the next? Investigating persistence of frequent emergency department attendance: a retrospective study in Australia. BMJ Open. (2019) 9:27700. doi: 10.1136/bmjopen-2018-027700
8. Mak CCM, Mao DRH, Siddiqui FJ, Lim A, Davamoni-Thomas J, Tang JP, et al. A new paradigm in management of frequent attenders to emergency departments with severe alcohol use disorder–A pilot study for assertive community treatment in Singapore. Front Health Serv. (2022) 2:1029455. doi: 10.3389/frhs.2022.1029455
9. Greenfield G, Blair M, Aylin PP, Saxena S, Majeed A, Hoffman M, et al. Frequent attendances at emergency departments in England. Emerg Med J. (2020) 37:597–9. doi: 10.1136/emermed-2018-208189
10. Street M, Berry D, Considine J. Frequent use of emergency departments by older people: A comparative cohort study of characteristics and outcomes. Int J Qual Health Care. (2018) 30:624–9. doi: 10.1093/intqhc/mzy062
11. Wooden MD, Air TM, Schrader GD, Wieland B, Goldney RD. Frequent attenders with mental disorders at a general hospital emergency department. EMA - Emerg Med Austral. (2009) 21:191–5. doi: 10.1111/j.1742-6723.2009.01181.x
12. Shen Y, Teo EWK, Liu N, Lam SW, Hock MOE. Data-driven approach to defining the emergency department frequent attender using a cohort of 10 years. J Acute Med. (2018) 8:6–16. doi: 10.6705/j.jacme.201803_8(1).0002
13. Williams ERL, Guthrie E, Mackway-Jones K, James M, Tomenson B, Eastham J, et al. Psychiatric status, somatisation, and health care utilization of frequent attenders at the emergency department: A comparison with routine attenders. J Psychosom Res. (2001) 50:161–7. doi: 10.1016/S0022-3999(00)00228-2
14. Savageau JA, McLoughlin M, Ursan A, Bai Y, Collins M, Cashman SB. Characteristics of frequent attenders at a community health center. J Am Board Family Med. (2006) 19:265–75. doi: 10.3122/jabfm.19.3.265
15. Byrne M, Murphy AW, Plunkett PK, McGee HM, Murray A, Bury G. Frequent attenders to an emergency department: A study of primary health care use, medical profile, and psychosocial characteristics. Ann Emerg Med. (2003) 41:309–18. doi: 10.1067/mem.2003.68
16. Furia G, Vinci A, Colamesta V, Papini P, Grossi A, Cammalleri V, et al. Appropriateness of frequent use of emergency departments: A retrospective analysis in Rome, Italy. Front Public Health. (2023) 11:1150511. doi: 10.3389/fpubh.2023.1150511
17. Ruger JP, Richter CJ, Spitznagel EL, Lewis LM. Analysis of costs, length of stay, and utilization of emergency department services by frequent users: implications for health policy. Ann Emerg Med. (2004) (11):1311–7. doi: 10.1197/j.aem.2004.07.008
18. Williams RM. Frequent emergency department use in Sweden: implications for emergency medicine in the United States. Ann Emerg Med. (2001) (37):627–9. doi: 10.1067/mem.2001.115175
19. Neal RD, Heywood PL, Morley S. ‘I always seem to be there' - a qualitative study of frequent attenders. Br J General Pract. (2000) 50:716–23.
20. Birrenbach T, Hoffmann M, Hautz SC, Kämmer JE, Exadaktylos AK, Sauter TC, et al. Frequency and predictors of unspecific medical diagnoses in the emergency department: a prospective observational study. BMC Emerg Med. (2022) 22:1–10. doi: 10.1186/s12873-022-00665-x
21. Al-Jaroodi J, Mohamed N, Abukhousa E. Health 4.0: on the way to realizing the healthcare of the future. IEEE Accesss. (2020) 8:211189–210. doi: 10.1109/ACCESS.2020.3038858
22. Ablard S, Coates E, Cooper C, Parry G, Mason SM. Can more appropriate support and services be provided for people who attend the emergency department frequently? National Health Service staff views. Emerg Med J. (2017) 34:206546. doi: 10.1136/emermed-2016-206546
23. NHS England. Guidance for Emergency Departments: Initial Assessment. (2024). Available at: https://www.england.nhs.uk/guidance-for-emergency-departments-initial-assessment/ (accessed 7 January, 2025).
24. Iacobucci G. Poor emergency department performance is down to sicker patients, report finds. BMJ. (2022) 356:j1130. doi: 10.1136/bmj.j1130
25. Ramlakhan SL, Saatchi R, Sabir L, Ventour D, Shobayo O, Hughes R, et al. Building artificial intelligence and machine learning models : a primer for emergency physicians. Emerg Med J. (2022) 39:e1. doi: 10.1136/emermed-2022-212379
26. Grant RW, McCloskey J, Hatfield M, Uratsu C, Ralston JD, Bayliss E, et al. Use of latent class analysis and k-means clustering to identify complex patient profiles. JAMA Network Open. (2020) 3:e2029068–e2029068. doi: 10.1001/jamanetworkopen.2020.29068
27. Liu W, Wang Z, Liu X, Yue W, Bell D. A clustering approach to triage categorization in A&E departments. In: 2017 23rd International Conference on Automation and Computing (ICAC) (Huddersfield). (2017). p. 1–6. doi: 10.23919/IConAC.2017.8081975
28. Huang JA, Weng RH, Lai CS, Hu JS. Exploring medical utilization patterns of emergency department users. J Formosan Med Assoc. (2008) 107:119–28. doi: 10.1016/S0929-6646(08)60125-4
29. Salman R, Kecman V, Li Q, Strack R, Test E. Two-stage clustering with k-means algorithm. In:Özcan A, Zizka J, Nagamalai D, , editors. Recent Trends in Wireless and Mobile Networks. CoNeCo WiMo 2011 2011. Communications in Computer and Information Science, vol 162. (Berlin, Heidelberg: Springer) (2011). doi: 10.1007/978-3-642-21937-5_11
30. Ayanore MA, Pavlova M, Groot W. Focused maternity care in Ghana: results of a cluster analysis. BMC Health Serv Res. (2016) 16:395. doi: 10.1186/s12913-016-1654-5
31. You-Shyang C, Ching-Hsue C, Chien-Jung L, Cheng-Yi H, Han-Jhou S. Identifying patients in target customer segments using a two-stage clustering-classification approach: a hospital-based assessment. Comput Biol Med. (2012) 42:213–21. doi: 10.1016/j.compbiomed.2011.11.010
32. Marshman Z, Broomhead T, Rodd HD, Jones K, Burke D, Baker SR. Who attends a Children's Hospital Emergency Department for dental reasons? A two-step cluster analysis approach. Community Dentist Oral Epidemiol. (2016) 45:49–58. doi: 10.1111/cdoe.12258
33. Graham B, Bond R, Quinn M, Mulvenna M. Using data mining to predict hospital admissions from the emergency department. IEEE Access. (2018) 6:10458–69. doi: 10.1109/ACCESS.2018.2808843
34. Ramlakhan S, Saatchi R, Sabir L, Singh Y, Hughes R, Shobayo O, et al. Understanding and interpreting artificial intelligence, machine learning and deep learning in Emergency Medicine. Emerg Med J. (2022) 39:380–5. doi: 10.1136/emermed-2021-212068
35. Yao LH, Leung KC, Tsai CL, Huang CH, Fu LC. A novel deep learning–based system for triage in the emergency department using electronic medical records: retrospective cohort study. J Med Internet Res. (2021) 23:e27008. doi: 10.2196/27008
36. Hoot NR, Aronsky D. Systematic review of emergency department crowding: causes, effects, and solutions. Ann Emerg Med. (2008) 52:126–36. doi: 10.1016/j.annemergmed.2008.03.014
37. Moskop JC, Sklar DP, Geiderman JM, Schears RM, Bookman KJ. Emergency department crowding, part 1–concept, causes, and moral consequences. Ann Emerg Med. (2009) 53:605–11. doi: 10.1016/j.annemergmed.2008.09.019
38. Pines JM, Hilton JA, Weber EJ, Alkemade AJ, Al Shabanah H, Anderson PD, et al. International perspectives on emergency department crowding. Ann Emerg Med. (2011) 18:1358–70. doi: 10.1111/j.1553-2712.2011.01235.x
39. Walker K, Ben-Meir M, Dunlop W, Rosler R, West A, O'Connor G, et al. Impact of scribes on emergency medicine doctors' productivity and patient throughput: multicentre randomised trial. BMJ. (2019) l121:364. doi: 10.1136/bmj.l121
40. Wrede J, Wrede H, Behringer W. Emergency department mean physician time per patient and workload predictors ED-MPTPP. J Clin Med. (2020) 9:3725. doi: 10.3390/jcm9113725
41. Lateef F. The impact of the COVID 19 pandemic on emergency department attendance: what seems to be keeping the patients away? J Emerg Trauma Shock. (2020) 13:246–51. doi: 10.4103/JETS.JETS_133_20
42. Butler A, Love AD, Young JT, Kinner SA. Frequent attendance to the emergency department after release from prison: a prospective data linkage study. J Behav Health Servi Res. (2020) 47:544–59. doi: 10.1007/s11414-019-09685-1
43. Cordell B, Nguyen K, Shahir AK, Lord SJ, Gallego G. Prevalence and characteristics of frequent presenters to Auburn Hospital emergency department. EMA - Emerg Med Austral. (2022) 34:898–906. doi: 10.1111/1742-6723.14011
44. Halcomb E, Smyth E, Ghosh A. Local trends in older people presenting at an emergency department. Collegian. (2017) 24:381–5. doi: 10.1016/j.colegn.2016.08.003
45. Jelinek GA, Jiwa M, Gibson NP, Lynch AM. Frequent attenders at emergency departments: A linked-data population study of adult patients. Med J Austral. (2008) 189:552–6. doi: 10.5694/j.1326-5377.2008.tb02177.x
46. Quilty S, Shannon G, Yao A, Sargent W, McVeigh MF. Factors contributing to frequent attendance to the emergency department of a remote Northern Territory hospital. Med J Australia. (2016) 204:111.e1–111.e7. doi: 10.5694/mja15.00648
47. Zhou JG, Cameron PA, Dipnall JF, Shih K, Cheng I. Using network analyses to characterise Australian and Canadian frequent attenders to the emergency department. Emerg Med Austral. (2022) 35:225–33. doi: 10.1111/1742-6723.14103
48. Palmer E, Leblanc-Duchin D, Murray J, Atkinson P. Emergency department use: is frequent use associated with a lack of primary care provider? Canad Family Phys. (2014) 60:e223–9.
49. Greenfield G, Blair M, Aylin PP, Saxena S, Majeed A, Bottle A. Characteristics of frequent paediatric users of emergency departments in England: an observational study using routine national data. Emerg Med J. (2021) 38:146–50. doi: 10.1136/emermed-2019-209122
50. Locker TE, Baston S, Mason SM, Nicholl J. Defining frequent use of an urban emergency department. Emerg Med J. (2007) 24:398–401. doi: 10.1136/emj.2006.043844
51. Moore L, Deehan A, Seed P, Jones R. Characteristics of frequent attenders in an emergency department: analysis of 1-year attendance data. Emerg Med J. (2009) 26:263–7. doi: 10.1136/emj.2008.059428
52. Hotham R, O'Keeffe C, Stone T, Mason SM, Burton C. Heterogeneity of reasons for attendance in frequent attenders of emergency departments and its relationship to future attendance. Emerg Med J. (2022) 39:10–5. doi: 10.1136/emermed-2020-210412
53. Scheiner N, Cohen S, Davis R, Gale T, Agyare A. The effect of integrated care on self-management and emergency department attendance. BJPsych Bulletin. (2019) 43:117–22. doi: 10.1192/bjb.2019.1
54. Sousa S, Hilder T, Burdess C, Bolton P. 2.5 years on: what are the effects of a ‘frequent attenders' service in the Emergency Department? BJPsych Bulletin. (2019) 43:112–6. doi: 10.1192/bjb.2019.8
55. Skinner J, Carter L, Haxton C. Case management of patients who frequently present to a Scottish emergency department. Emerg Med J. (2009) 26:103–5. doi: 10.1136/emj.2008.063081
56. Shen Y, Tay YC, Teo EWK, Liu N, Lam SW, Ong MEH. Association between the elderly frequent attender to the emergency department and 30-day mortality: A retrospective study over 10 years. World J Emerg Med. (2021) 9:20–5. doi: 10.5847/wjem.j.1920-8642.2018.01.003
57. Chan JSE, Tin AS, Chow WL, Tiah L, Tiru M, Lee CE. Frequent attenders at the emergency department: an analysis of characteristics and utilisation trends. Proc Singapore Healthc. (2018) 27:12–9. doi: 10.1177/2010105817715271
58. Paul P, Heng BH, Seow E, Molina J, Tay SY. Predictors of frequent attenders of emergency department at an acute general hospital in Singapore. Emerg Med J. (2010) 27:843–8. doi: 10.1136/emj.2009.079160
59. Hansagi H, Olsson M, Sjöberg S, Tomson Y, Göransson S. Frequent use of the hospital emergency department is indicative of high use of other health care services. Ann Emerg Med. (2001) 37:561–7. doi: 10.1067/mem.2001.111762
60. Michelen W, Martinez J, Lee A, Wheeler DP. Reducing frequent flyer emergency department visits. J Health Care Poor Underserved. (2006) 17:59–69. doi: 10.1353/hpu.2006.0010
61. Sandoval E, Smith S, Walter J. S-AH S, Olson M, Striefler R, et al. A comparison of frequent and infrequent visitors to an urban emergency department. J Emerg Med. (2010) 38:115–21. doi: 10.1016/j.jemermed.2007.09.042
62. Sun B, Burstin H, Brennan T. Predictors and outcomes of frequent emergency department users. Ann Emerg Med. (2003) 10:320–8. doi: 10.1111/j.1553-2712.2003.tb01344.x
Keywords: emergency department, frequent attender, K-means clustering, health services, health care utilization, targeted interventions
Citation: Williams E, Brice SN and Price D (2025) Mathematical methodology for defining a frequent attender within emergency departments. Front. Disaster Emerg. Med. 3:1462764. doi: 10.3389/femer.2025.1462764
Received: 10 July 2024; Accepted: 13 January 2025;
Published: 11 February 2025.
Edited by:
Muhammad Waseem, Lincoln Medical Center, United StatesReviewed by:
Thomas Swoboda, Touro University Nevada, United StatesCopyright © 2025 Williams, Brice and Price. This is an open-access article distributed under the terms of the Creative Commons Attribution License (CC BY). The use, distribution or reproduction in other forums is permitted, provided the original author(s) and the copyright owner(s) are credited and that the original publication in this journal is cited, in accordance with accepted academic practice. No use, distribution or reproduction is permitted which does not comply with these terms.
*Correspondence: Elizabeth Williams, V2lsbGlhbXNFTTIwQENhcmRpZmYuYWMudWs=
Disclaimer: All claims expressed in this article are solely those of the authors and do not necessarily represent those of their affiliated organizations, or those of the publisher, the editors and the reviewers. Any product that may be evaluated in this article or claim that may be made by its manufacturer is not guaranteed or endorsed by the publisher.
Research integrity at Frontiers
Learn more about the work of our research integrity team to safeguard the quality of each article we publish.