 P. Kolb
 Z. Yao
 A. Blackburn
 R. Gregory
 D. Hedji
 M. McMullin
 T. Junginger
 R. E. Laxdal
95% of researchers rate our articles as excellent or good
Learn more about the work of our research integrity team to safeguard the quality of each article we publish.
Find out more
ORIGINAL RESEARCH article
Front. Electron. Mater , 09 October 2023
Sec. Superconducting Materials
Volume 3 - 2023 | https://doi.org/10.3389/femat.2023.1244126
This article is part of the Research Topic Progress on Superconducting Materials for SRF Applications View all 8 articles
Mid-T heat treatments in the range from 250°C to 400°C on superconducting radio-frequency (SRF) cavities have been shown to provide high quality factors that rise with applied rf field strength in high frequency, electro-polished (EP), elliptical cavities operating at 2 K, similar to nitrogen doped cavities. The rise in quality factor is attributed to a decrease in the temperature dependent part of the surface resistance RBCS. Until now, no results have been reported for these new treatments on quarter-wave resonators (QWR) and half-wave resonators (HWR). The TRIUMF multi-mode coaxial cavities are dedicated test cavities that allow frequency and temperature resolved performance characterization of treatments without changing environments, therefore providing an excellent test vehicle to test these new treatments with rf frequencies ranging from 200 to 1,200 MHz. In this paper, performance measurements from both QWR and HWR cavities are reported and their performance compared with four different treatments: baseline, a conventional 120°C low temperature bake for 48 h, and two mid-T bakes at 300°C and 400°C for 3 h. In addition, sample analysis using SEM, EDX and SIMS of witness samples is also shown. It is found that the mid-T bakes are not directly transferable to low frequency cavities. In the fundamental modes of the two test cavities, no performance gain over the baseline treatment nor a decreasing temperature dependent component with rising rf amplitude was observed. At frequencies above 1 GHz and low temperatures, the mid-T bakes show a reduced field dependence of RBCS compared to both the baseline and 120°C treatments.
Modern nuclear physics experiments, such as the experiments conducted at the ISAC-II (Dilling et al., 2014) facility at TRIUMF, often rely on heavy ion particle accelerators for high energy beams. To deliver these beams in an efficient way often superconducting radio-frequency (SRF) technology is used. A major cost driver for SRF based accelerators are cryogenic losses in SRF cavity walls caused by the rf field used to accelerate the beam. The required cryogenic infrastructure and liquid helium (LHe) as coolant are costly on capital and operational budgets. Cryogenic losses are inversely proportional to the unloaded quality factor Q0. Therefore, increasing the quality factor in SRF cavities is essential to reduce the cryogenic load and therefore reduce operating costs or design accelerators with smaller cryoplants. This is most relevant for SRF based accelerators with a high duty factor, where the active load dominates over the static load. Additionally, increasing the operational accelerating fields, and therefore useable voltage, can lead to shorter, more compact accelerators, reducing real estate expenses.
Several novel heat treatments that increase Q0 more than conventional treatments have been developed and applied to 1.3 GHz single cell elliptical cavities (Grassellino et al., 2013; Grassellino et al., 2017; Gonnella et al., 2019), all on electro-polished (EP) cavities. Coaxial style cavities such as quarter-wave and half-wave resonators (QWR and HWR respectively) used in heavy ion accelerators are often treated with buffered chemical polishing (BCP) due to the more complex geometry and the resulting technical challenges of using EP.
Recently discovered heat treatments at 250°C–500°C in elliptical 1.3 GHz cavities with an EP surface finish have been shown to produce comparable performance to nitrogen doped cavities (He et al., 2021; Ito et al., 2021; Steder et al., 2022), the current state-of-the-art treatment to date for high Q0 at moderate gradients (Dhakal, 2020), while being a simpler cavity processing recipe. The performance increase is a result of oxygen dissolution and diffusion of the native niobium oxide layers (Lechner et al., 2021). At temperatures between 250°C and 500 °C the Nb2O5 layer dissolves and regrows back shallower after air exposure (Semione et al., 2019). This avoids using an external doping agent like nitrogen.
These mid-T or “oxygen diffusion” treatments allow quicker processing compared to N2-doping as they eliminate the injection of N2 into the furnace at high temperatures and a post-doping EP step. This simplified process should also increase consistency in larger cavity productions. Since mid-T bakes show a decreasing RBCS with increasing rf field amplitude (Ito et al., 2021; Sha et al., 2022; Steder et al., 2022; Yang et al., 2022), this treatment is of high interest for low frequency SRF cavities that typically operate at a temperature of 4.2 K. At this operating temperature, the surface resistance Rs is dominated by its temperature dependent component RBCS and the temperature independent part RRes contributes only a small fraction. A decreasing RBCS at 4 K would be an enormous benefit for SRF based heavy ion accelerators operating in continuous wave (cw) mode at moderate peak surface fields, such as the ISAC-II or FRIB accelerators. The first reported results on BCP’ed 1.3 GHz nine-cell cavities (Yang et al., 2022) do not show the characteristic increase in Q0, but still a larger Q0 than a baseline treatment. This is similar to the difference between EP’ed and BCP’ed N2-doped cavities (Dhakal et al., 2019). Similarly, results on EP’ed 650 MHz ellitpical cavities with either N2-doping (Martinello et al., 2021) or a 300°C bake (Sha et al., 2022) do not show the increasing Q0, suggesting that there is a frequency dependence to both treatments.
In this paper, the effects of two mid-T bakes at 300°C and 400°C on a QWR and a HWR, both with BCP surface finishes, are studied and presented.
This paper presents the used methodology in Section 2, results of cavity measurements and sample studies in Section 3 and findings are discussed in Section 4 before summarizing them in Section 5.
Two dedicated research cavities are used in this study: one QWR and one HWR. The two cavities and many aspects of the data acquisition and processing are described in detail in (Kolb et al., 2020). The cavities are about 40 cm tall and 20 cm in outer diameter, matching roughly the size of a typical 1.3 Ghz single cell cavity. These cavities are simplified versions of the QWR and HWR geometries and designed for excitation of not only the fundamental rf mode, but also higher order TEM modes. This allows the extraction of the frequency dependence of key performance parameters such as quench field and Q0, defined as
with ω as resonant frequency, U as stored energy in the RF field, and P as dissipated power in the cavity walls, without changing to different cavities or different testing parameters such as cooldown speed or external magnetic fields. These two cavities cover a frequency range from 220 MHz to 1.2 GHz, covering commonly used frequencies for SRF cavities.
This work compares performance of the two test cavities with a baseline treatment (bulk BCP—800°C degassing—flash BCP), a commonly used low temperature bake at 120°C for 48 h, and two mid temperature bakes at 300°C and 400°C for 3 h. Between the 120°C, 400°C, and 300°C heat treatments the surface is reset with a 20 μm etch via BCP. The uniformity of the, etch is measured to be 20% with little local variations, with a over-etch at the port side of the cavity (Yao et al., 2019). Measurements of Q0 as a function of peak magnetic surface field BP are done at 4.2 K and 2.0 K, as well as measurements of Q0 during the cooldown between the two temperatures at selected field amplitudes. This allows for the deconvolution of the surface resistance Rs into its temperature dependent and independent components, RBCS and RRes respectively, by fitting the data to.
which is a parameterized version of the BCS surface resistance (Gurevich, 2017) with a0, a1 and a2 as fit parameters. The energy gap Δ is represented by a1 and its temperature dependence is modelled (Halbritter, 1970) as
Further details of the test setup and data processing, including accounting for the non-uniform field distribution across the surface (Delayen et al., 2018), are described in (Kolb et al., 2020). Measurements of Q0 and Bp are done in a zeroed external magnetic field using a set of Helmholtz coils which surround the cavity and cryostat. In this paper, the performance is often presented as G/Q0 with G as the geometry factor defined as
while Rs, RRes and RBCS account for the non-uniform field distribution. Not accounted for in the measurements are differences between the helium bath temperature and the temperature on the rf surface, which can lead to a measurable effect in Q0 at higher field amplitudes if the bath temperature is above the λ point of LHe at 2.17 K (Palmieri et al., 2014).
The high and mid-T heat treatments are processed in TRIUMF’s induction furnace, which is also described in (Kolb et al., 2020; Dhakal et al., 2012). The temperature is controlled via an on/off controller set to the desired temperature. Due to the temperature measurement of the inner conductor of the cavities rather than the heating element and the oversized heater power, and regulation setup, there is an oscillation around the goal temperature as the measured temperature of the inner conductor lags behind the temperature of the heating element. This causes an over- and under-shoot of the measured temperature. A typical mid-T bake is shown in Figure 1, showing the heat treatment of the QWR at 300°C for 3 h. A residual gas analyser (RGA) running during the heat treatment shows the partial pressures of selected atomic masses, which correspond to molecules and elements such as H2, H2O, CO2, N2/CO and Ar. It is important to note that the cavity ports are covered with caps made out of Nb. The purpose of these caps is to prevent line of sight from potentially contaminated furnace surfaces (Angle et al., 2023). The caps are installed in a class 100 clean room environment after the cavity has been rinsed with high pressure pure water as would be typically done before a clean assembly. The cavity is then bagged and transported to the furnace and only just before insertion into the heating chamber the bag is removed. During the heat treatment, a number of witness samples were placed with the cavity in the furnace, but outside the rf volume of the cavity. These samples are used for analysis with secondary electron microscopy (SEM), energy-dispersive x-ray spectroscopy (EDX), performed at the University of Victoria, and secondary ion mass spectroscopy (SIMS), measured at the University of Western Ontario. All cavity cryogenic measurements were conducted at TRIUMF’s SRF facilities.

FIGURE 1. Temperature and residual gas profiles during the heat treatment of the QWR at 300°C. The other mid-T treatments follow similar patterns. The fluctuations around goal temperature are due to the slow response of the cavity temperature regulation.
The 120°C bake (Ciovati, 2004) has previously been shown to be helpful in eliminating the so-called high field Q slope, but also reduces the temperature dependent component of the surface resistance. This treatment is performed right after the baseline measurement and inside the test cryostat with resistive heaters strapped to the cavity. In this case, the heaters and temperature sensors are closer to each other, avoiding a strong temperature swing around the regulation temperature. The cavity rf space is actively pumped during the bake and throughout the cryogenic test. During the heat treatment, the surrounding helium bath space is evacuated to a low mTorr pressure to prevent heat losses and oxidation of the outer cavity surface. As the bake is done in situ, the rf space is not exposed to air after the bake. Witness samples were processed separately in a sample vacuum oven.
Cavity performance measurements were done using standard self-excited loop cw rf measurements. Both 4.2 K and 2.0 K measurements were performed and the results of these fixed temperature characterizations are shown in Figures 2–6 for all discussed treatments. G/Q0 is shown instead of the field distribution corrected Rs, as this measure closely represents the actual measured data. Converting to Rs requires fitting the data to smooth curves, which would result in losing details of the cavity performance in some cases. Measurement uncertainties are derived directly from the standing wave ratio SWR during the calibration decay time measurement of each individual mode. Variable couplers are used to ensure good matching to the cavities at all relevant temperatures and all modes. More details on the error analysis and propagation can be found in (Kolb et al., 2020). It is notable that the 120°C/48 h bake stands out as the best performance overall at 4 K and matches the other treatments at 2 K. The mid-T bakes react differently to the change in rf frequency than the baseline or 120°.
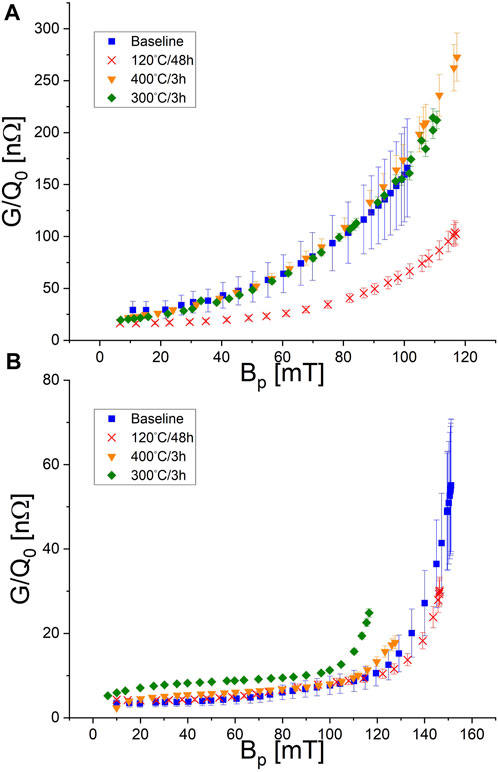
FIGURE 2. (A) At 4 K the 220 MHz mode of the QWR with the 120°C bake performs significantly better with a lower surface resistance over a large range field amplitudes up to the quench field. (B) At 2 K the mid-T bakes increase G/Q0 compared to the baseline and 120°C bake.
At the lowest frequencies, 220 and 390 MHz (Figures 2, 3), the mid-T bakes match the baseline performance in Q0 during the 4 K measurements with some marginal changes in quench field. Decreasing the helium bath temperature to 2 K, the baseline and 120 °C treatments show almost identical performance with G/Q0 less than 10 nΩ until high gradient. The two mid-T bakes perform worse both in Q0 and quench field, with the 300 °C bake increasing G/Q0 by about 20 nΩ. The decrease in Q0 at these low temperatures and low frequencies indicates a strong increase in the temperature independent component RRes of the surface resistance.
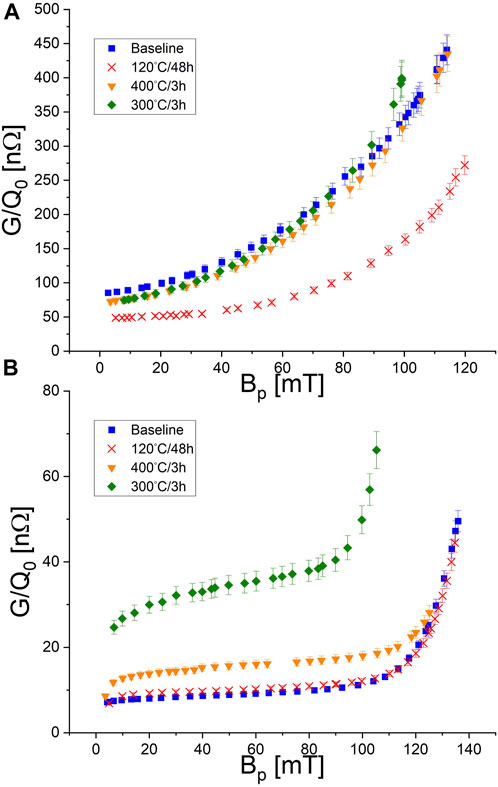
FIGURE 3. (A) 4 K measurement of the 390 MHz mode of the HWR show similar behaviour to the QWR fundamental mode, Figure 2, with the 120°C bake outperforming all others. (B) The baseline and 120°C bake perform similarly, while the mid-T bakes add to Rs.
In the next higher frequency modes, 644 and 780 MHz (Figures 4, 5), again the 120 °C bake is generally the treatment with the highest Q0 values, especially at 4 K. Again the mid-T bakes show a similar performance to the baseline at 4 K, but at low field the Q0 is increased. At 780 MHz a larger Q0 is measured up to a peak surface field of around 70 mT. The lower temperature measurement again reveals a poor performance in the 300 °C bake, again indicating a raised RRes.
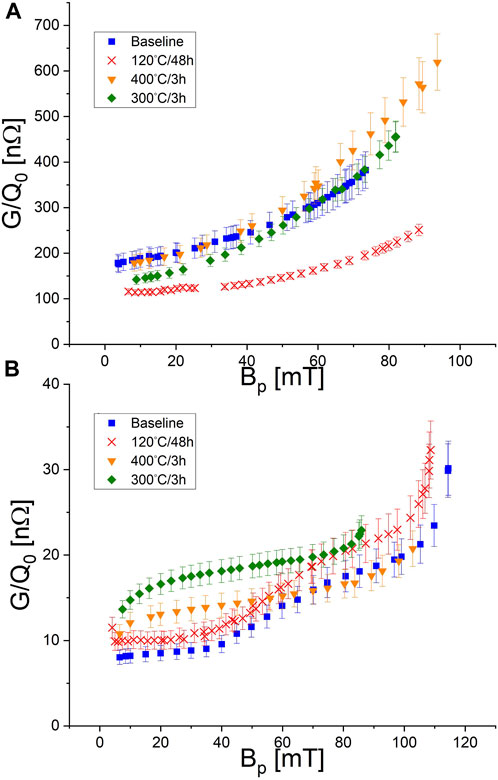
FIGURE 4. (A) At 644 MHz and 4 K first differences between the mid-T bakes and the baseline become noticeable, (B) but at 2 K both the baseline and 120°C still produce the highest Q0 at low field.
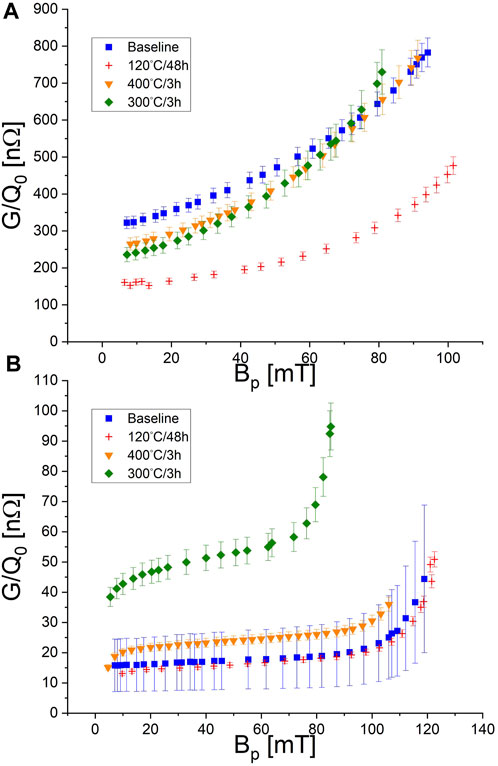
FIGURE 5. (A) At 780 MHz and 4 K the mid-T bakes separate further from the baseline over a larger range of rf fields. (B) At 2 K, the baseline and 120°C outperform the mid-T bakes.
At 1,166 MHz and 2 K (Figure 6), the 400°C mid-T bake outperforms the other treatments. Deconvolution of Rs (Figure 12) shows that both mid-T bakes have a much reduced field dependence of RBCS but with an increased RRes. No decrease of either component with increasing rf amplitude, a signature of mid-T bakes in EP’ed 1.3 GHz elliptical cavities, is observed.
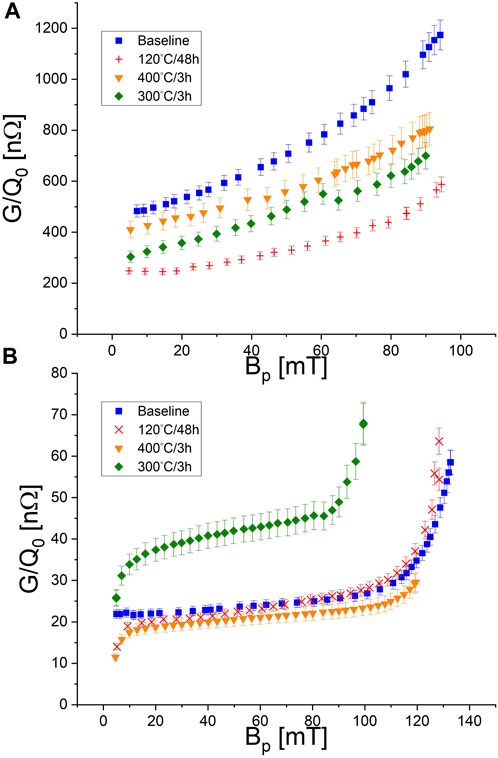
FIGURE 6. (A) At 1,166 MHz, the mid-T bakes show a clear improvement in Q0 compared to the baseline at 4 K. (B) At 2 K the 400°C bake even out performs the conventional treatments.
The witness samples are 12 × 12 mm2x1.5 mm flat coupons made out of high (250+) RRR Nb material. Prior to the witness treatment they had received a deep, etch via BCP and cleaning via an ultrasound bath. As the 120°C cavity bake was done in the cryostat, the witness sample processing for this treatment was completed separately from the cavity in a small sample UHV oven. Therefore, separate samples for the QWR or HWR treatment only exist for the mid-T bake treatments. These samples were treated with the cavity together in the induction furnace, but outside the rf volume due to restricted access into that volume. The same samples are also used in the β-SRF beamline at TRIUMF (Thoeng et al., 2023) where the magnetic screening capabilities are being probed.
Energy dispersive x-ray spectroscopy (EDX) is a technique used for an elemental characterization of the surface of samples. The sample is subjected to an electron beam. This beam can kick out electrons in the sample atoms. A higher shell electron drops down, releasing a photon of a specific energy. This allows an elemental characterization of a sample surface, given that the photon energies are known. A larger count rate indicates a larger abundance of this particular element. Figure 7 shows such a scan for the investigated samples. Clearly visible are the expected peaks of Nb at around 0.2, 1.9, and 2.2 keV. The differences are in the details of the carbon and oxygen peaks at 0.25 and 0.53 keV, respectively. In the baseline, 120°C, and 300°C samples any carbon signature is hidden in the tail of the Nb peak, while a noticeable increase is measurable for the two 400°C samples. Oxygen is slightly suppressed in the HWR 400°C and QWR 300°C samples. This reduced oxygen peak is not seen in the QWR 400°C sample. Overall, there seems to be only minor differences in the carbon and oxygen abundances between the baseline and mid-T bake samples. Secondary electron microscopy (SEM) of the witness samples show some carbon based contaminates, as is shown in Figure 8 from the QWR 300°C witness sample. Similar objects have been seen on the other mid-T baked samples, but not on the baseline or 120°C sample.
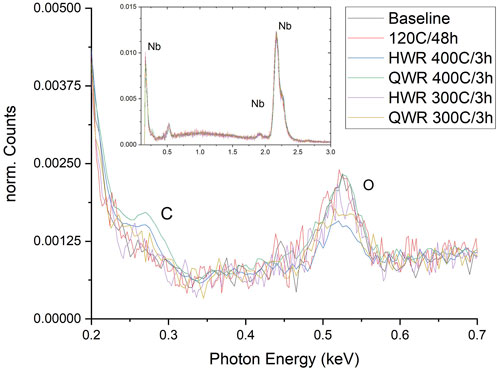
FIGURE 7. EDX data for the baseline, 120°C, and mid-T witness samples. The 400°C bakes shows an enhanced carbon peak with some reduced oxygen for the HWR. The inset shows the whole energy scan with the Nb peaks.
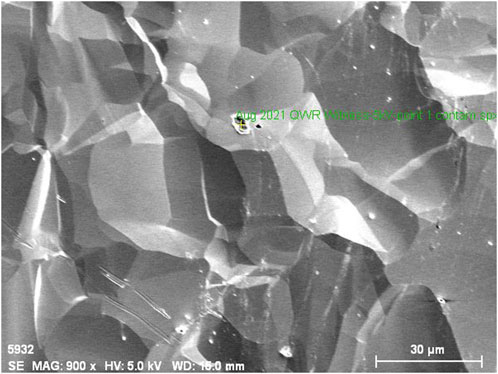
FIGURE 8. This SEM image from the QWR 300°C witness sample shows the sampled area and a contaminating particulate.
The probing depth of EDX is fixed by the energy of the electron beam and depth information is not obtained. In order to get information about the elemental composition as a function depth secondary ion mass spectroscopy (SIMS) was used. In SIMS, the sample is sputtered with a heavy ion beam. For this study an ION-TOF (GmbH) TOF-SIMS IV instrument supplied a 25 keV {Bi_{3} beam pulsed at 10 kHz to bombard the sample surface in an area of about 400 × 400 μm2 to generate secondary ions. This releases atoms and molecules from the sample, which then can be analysed using a time-of-flight mass spectrometer. A larger sputter time results in a deeper probing of the sample. In Figure 9 both the baseline and 400°C QWR witness samples are analysed using this technique. A larger count rate in the carbon content is noticeable at shallower depths with the mid-T sample, while the other traces show only minor differences. The NbO2, Nb2O5, and O2 signatures in the mid-T bake shift to shallower depths compared to the baseline sample. Atomic oxygen shows similar count rates between the two samples. At larger sample depths, all traces converge to similar values, showing that the heat treatment changes only the surface composition.
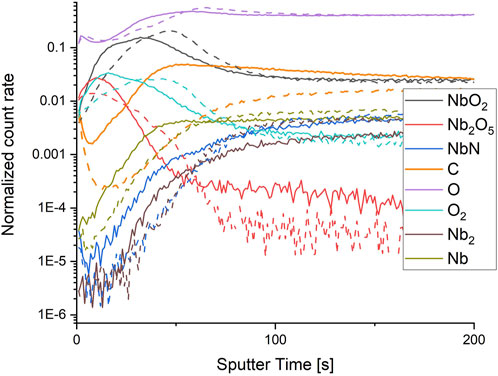
FIGURE 9. SIMS data of the baseline (dashed lines) and 400°C (solid lines) QWR witness sample for a number of elements of interest. A notable change is in the carbon trace with a larger count rate in the mid-T sample.
A similar shift in the Nb2O5 layer has been observed on samples after a mid-T bake (Posen et al., 2020). Increased carbon impurities had also been observed (Yang et al., 2022) in mid-T samples and associated with weaker rf performance.
The rf performance of both cavities shows clear changes between the various heat treatments, frequencies, and temperatures. To analyse the performance, the surface resistance is deconvoluted into its components RBCS and RRes by fitting Rs(T) data collected during the cooldown from 4.2 K to 2 K at fixed rf peak fields Bp from 10 up to 110 mT to Eq. 2. In the higher frequency cases, Rs(T) down to 1.6 K was collected to accurately extract RRes. The obtained fit parameters are used to calculate RBCS. A selection of fits at highest and lowest frequeny and low and high Bp are shown in Figure 10. The extracted RBCS and Rres values are shown in Figure 11, Figure12 for the 220 and 1,166 MHz modes. The baseline and 120°C treatments show in all frequencies and temperatures a strong rf field dependence of RBCS, with the 120°C bake producing significantly lower resistances. The residual resistance RRes is marginally increased as is commonly observed for this treatment. The two investigated mid-T bakes mostly follow similar trends except at low temperatures and high frequency (Figure 12B). There, RBCS has almost no field dependence and is lower than for the 120°C bake. A higher Q0 compared to the 120°C bake is prevented by a larger RRes, which could be a consequence of the higher carbon content as measured by SIMS.
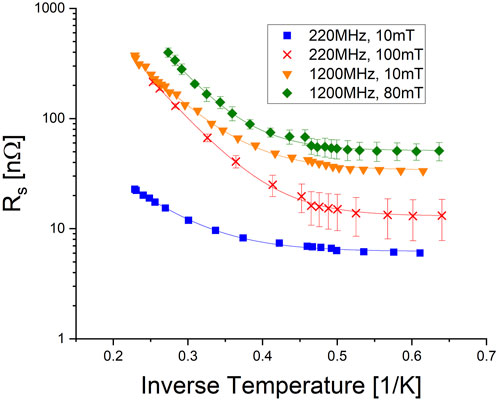
FIGURE 10. The surface resistance Rs is fitted to Eq. 2 to extract parameters a0, a1 and Rres. These parameters are used to calculate RBCS using Eq. 2. Noticeable in the cooldown curve is a discontinuity at 2.17 K, where liquid helium transitions into its superfluid state.

FIGURE 11. The 120°C bake outperforms the other treatments at low rf frequency, 220 MHz in this case, due to a reduced RBCS [(A) 4K and (B) 2K], while increasing RRes (C). Solid lines in (A) and (B) represent fits to Eq. 6.
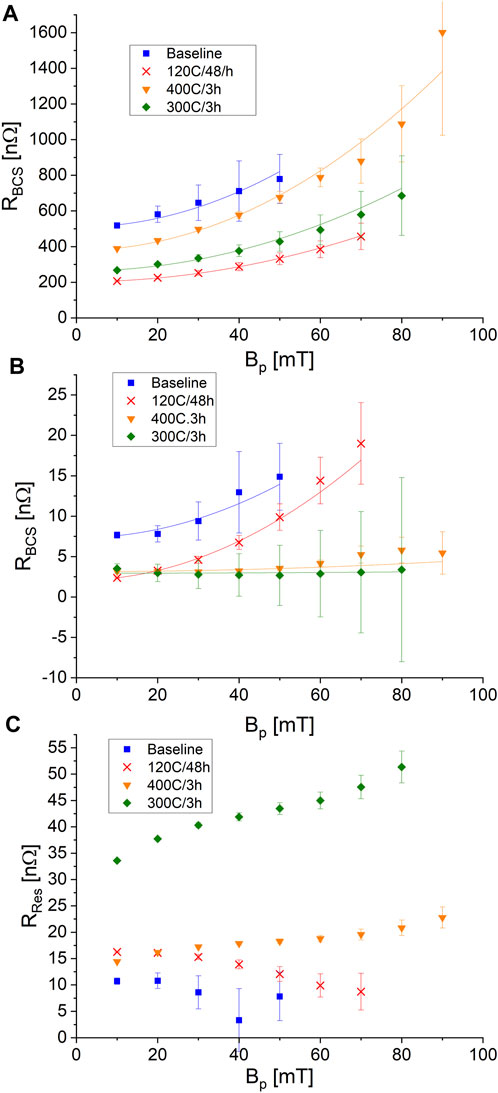
FIGURE 12. Results of the deconvolution of Rs at 1,166 MHz into RBCS at (A) 4 K and (B) 2 K, as well as (C) Rres. The mid-T bakes outperform in RBCS the baseline and 120°C bake at high rf frequency, 1,166 MHz shown here, and low temperature (B) but a large RRes (C) prevents a gain in Q0. Solid lines in (A) and (B) represent fits to Eq. 6.
To quantify the dependence of RBCS on rf field amplitude Bp, the data is fitted with a quadratic function according to
with RBCS(0 mT) as zero-field resistance, B0 as a normalizing constant (chosen to be 100 mT) and γ as field dependency. The quadratic form originates from thermal feedback models (Gurevich, 2006a) and other models (Gurevich, 2006b; Weingarten, 2011) and is here adopted to quantify the changes in field dependence and zero-field resistance of RBCS. Figure 13A shows RBCS(0 mT) at 2 K resolved as function of rf frequency f for the different investigated treatments. For all measured treatments and cavity modes, the baseline treatment results in the highest RBCS(0 mT) while the 120°C bake produces the lowest zero-field resistance. The mid-T bakes fall in between. The baseline and 120°C treatments show a steady increasing RBCS(0 mT) with frequency as would be expected from Eq. 2, with the low temperature bake showing a lower slope, thus a reduced frequency dependence. It is noteworthy that the 400 C treatment shows a lower resistance at 1,166 MHz than at 780 MHz, which is an indication that this heat treatment is only effective at high rf frequencies above 1 GHz. The 300°C bake shows a frequency dependence of RBCS(0 mT) comparable to the 120°C bake.
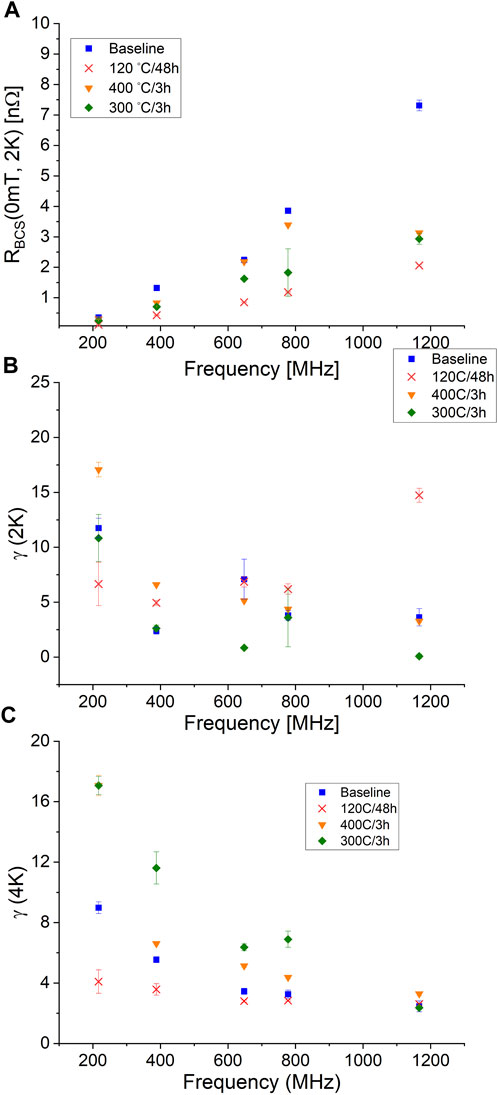
FIGURE 13. (A) R0 at 2 K increases as the frequency increases. The 120°C bake has a significantly reduced R0 compared to the other treatments. Of note is also that the 400°C bake shows a reduced R0 at high frequency. (B) The field dependence as determined by γ on the other hand has no clear correlation with frequency at 2 K, (C) while an overall decreasing trend at 4 K emerges.
The rf amplitude dependence γ for 2 K shows no clear correlation with treatment or rf frequency as can be seen in Figure 13B. For the baseline and mid-T treatments, γ stays roughly constant and at similar values for all but the lowest frequency mode. The 220 MHz mode shows the highest field dependence for these three treatments. At this frequency, γ is significantly higher for the baseline and 400°C bake compared to the other resonant modes. The 120°C bake on the other hand has its highest γ at 1,166 MHz, while γ for the other frequencies stays constant. This together with the changes in R0 by the treatments, shows that the differences in RBCS between treatments are mainly caused by the zero-field resistance R0. At 4 K, Figure 13C, a clearer overall trend emerges as for all treatments γ decreases with higher frequency. The 300 C mid-T bake shows the largest decrease in γ, while the 120 °C low temperature bake barely changes from 220 to 1,166 MHz. Overall γ at 2 K and 4 K are in a comparable range. This shows that much of the perceived Q0slope difference between 4 K and 2 K data is a result of a changed RBCS(0 mT).
Intrinsic pair breaking (Gurevich, 2006b) predicts much smaller values for γ and this model is only valid in the clean limit, which is not the case for the 120C or mid-T baked results. Other models for intrinsic non-linearity losses (Halbritter, 2001) also suggest significantly smaller values than reported here. Thermal feedback can only account for a small contribution of the observed slope (McMullin et al., 2023), especially for the here shown results at 2 K. This means that other mechanisms are responsible for the increasing RBCS.
Using all five available modes from the two cavities, the frequency dependence of RBCS is extracted to test against the theoretical prediction given by Eq. 2 and codes like SRIMP which is based on (Halbritter, 1970). A power law of the form
is used to model the field dependence and the predicted values of x are listed in Table 1 for 4.2 and 2 K.

TABLE 1. Predicted frequency dependencies x (Eq. 7) for the different treatments at 4.2 and 2.0 K based on SRIMP.
At low fields, the baseline treatment matches well to the predicted value at both evaluated temperatures. x for higher field amplitudes trend away from the theoretical value. The low temperature bake at low to medium fields is not far away from the theoretical values, given the uncertainties. The 300°C mid-T bake does not match the predicted behaviour at any temperature or field level. x is consistently below the predicted value for this treatment. This means the oxygen diffusion/doping treatments do not follow quite the same behavior as conventional treatments.
The same analysis to extract x is done for Rres as well and shown in Figure 14C. In all cases, the frequency dependence is not correlated to the field amplitude. Rres seems to follow a trend of ω0.6−0.7, which would match to losses due to the anomalous skin effect (Pippard and Bragg, 1947; Chambers and Frisch, 1952). All this indicates that the residual resistance is due to a normal conducting layer or elements.
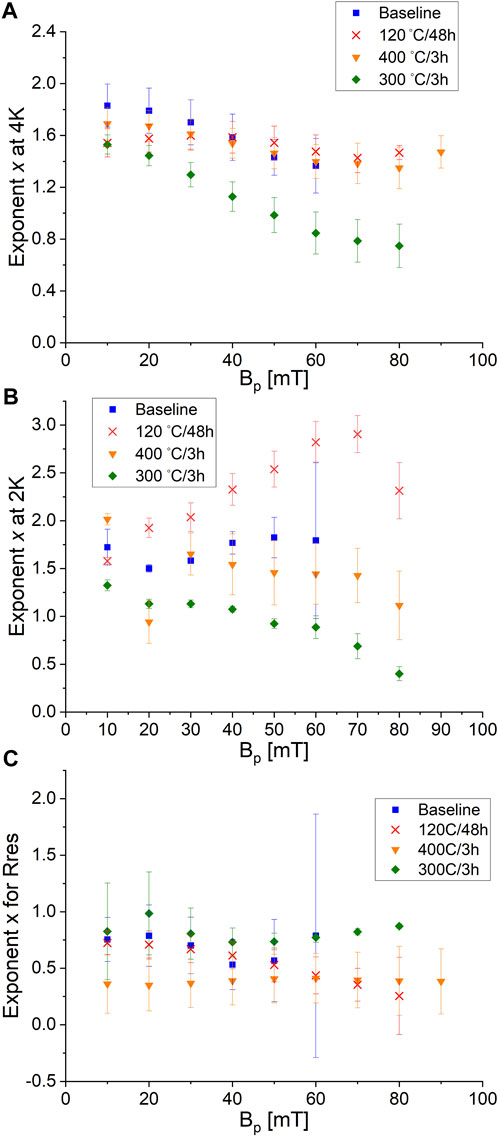
FIGURE 14. The frequency dependence exponent x (Eq. 7) at (A) 4 K and (B) 2 K as a function of rf field amplitude. At 4 K and higher rf fields the 300°C bake shows a much lower frequency dependence than the other treatments, while at the lower temperature the trends separate between the established treatments and the newer mid-T bakes. (C) The residual resistance increases with frequency ∝ f0.6−0.8 with no field dependence.
The sample analysis done with SIMS shows a modification of the oxide layer due to the mid-T bake, which is consistent with previous reports (Posen et al., 2020; Lechner et al., 2021; Yang et al., 2022). The significant CO2 partial pressure during the ramp up of the heat treatment (Figure 1) and the strong carbon concentration in the SIMS measurement indicate that the cavity surfaces could have been contaminated at that time. It is speculated that this contamination causes the high RRes in the mid-T baked cavity measurements.
The changed frequency response of RBCS with the mid-T bakes shows that the treatments have an effect on the cavity performance and that these treatments are strongly rf frequency dependent. This effect and the lack of a decreasing RBCS is similar to the frequency response of N-doped cavities as EP’ed 650 MHz cavities do not show a decreasing RBCS (Martinello et al., 2021). A similar observation was made in a 650 MHz EP’ed cavity with a 300 °C furnace bake (Sha et al., 2022). Only high rf frequencies above 1 GHz seem to be able to produce this characteristic. In addition, to get the highest Q0 out of N-doping, EP is required over BCP (Dhakal et al., 2019). The grain structure seems to play a role as fine grain cavities, which are most commonly used, treated with BCP did not show the otherwise typical rise in Q0 even at 1.3 GHz. Mid-T furnace baked cavities at 1.3 GHz show a similar requirement (Yang et al., 2022).
This all leads to the conclusion that high frequency above 1 GHz and electro-polishing are required to measure decreasing surface resistances in oxygen diffused cavities.
In this paper, the performance of two coaxial multi-mode cavities after four different treatments is presented giving a unique insight into the frequency dependence of RBCS. The investigated baseline and 120°C bakes are established treatments, while mid-T bakes are novel and have not been reported on for low frequency coaxial type cavities before. Mid-T bake recipes have been shown to produce cavity performance similar to N2 doped cavities. Two different mid-T treatment temperatures, 400°C and 300°C, were applied to the QWR and HWR multi-mode cavities and their performance measured at 4.2 and 2.0 K. In addition, Q0 measurements during the cooldown were done to extract the temperature dependence of the surface resistance. Measurements were done in five resonant modes, spanning from 200 MHz to 1.2 GHz, covering a wide range of relevant frequencies for SRF particle accelerators.
In the low frequency modes at 220 and 390 MHz, the mid-T bake treatments at 400°C and 300°C did not improve the performance over either the baseline or the 120°C bake. At 4 K, the 120°C bake produces the highest Q0 in all cases and therefore the lowest RBCS. As rf frequency increases, the mid-T bakes separate from the baseline performance and perform better. At 1.2 GHz and 2 K, RBCS is lower than what was measured for the 120°C bake, but no decreasing resistance with rf field could be observed as it has been in elliptical EP’ed cavities. There is a clear difference in the frequency dependence between the established treatments and the mid-T bakes, especially at higher rf fields as Figure 14 shows. All this leads to the conclusion that there is a strong impact of the rf frequency on the performance of cavities with a mid-T bake.
Witness sample measurements using EDX and SIMS show some changes in the elemental composition and oxide layers. EDX shows that some of the mid-T samples have a heightened carbon content on the surface. This is confirmed with the SIMS measurement of a 400°C mid-T witness sample. A source of the carbon could be the UHV furnace used for the mid-T bakes as the RGA spectrum during the heat treatment shows a significant CO2 peak during the temperature ramp up as shown in Figure 1. In addition, changes to the oxide layer were measured which are consistent with the oxide diffusion treatment. The lack of rising Q0 in these BCP’ed cavities leads to the hypothesis that electro-polishing, and the resulting smoother surface, is needed to reach the full potential of this treatment. This might be a similar phenomenon to N2 doping where BCP’ed cavities do not show the increase in Q0.
The raw data supporting the conclusion of this article will be made available by the authors, without undue reservation.
PK, RG, ZY, and MM collected the cavity performance data. DH, AB, and TJ collected and analysed the SEM and EDX data. TJ organized SIMS measurements, contributed to the data analysis, and funding acquisition. RL contributed to the data analysis, project administration, supervision, and funding acquisition. PK processed, analysed, and visualized the data and wrote the manuscript with contributions and revision by all authors, which approved the submitted version. All authors contributed to the article and approved the submitted version.
Funding is provided by Natural Sciences and Engineering Research Council of Canada (NSERC) grants SAPPJ-2020-00030 (holder TJ) and SAPIN-2019-00040, SAPPJ-2017-00035, and SAPEQ-2015-00005 (holder RL).
The authors would like to thank the technical members of the SRF group, namely Devon Lang, James Keir, Bhalwinder Waraich, Ruminder Sekhon, and cryogenics group, namely David Kishi, Johnson Cheung, Rowan Bjarnson, at TRIUMF who helped tremendously with performing the cavity preparations and tests, as well as the UWO team for the SIMS measurements.
The authors declare that the research was conducted in the absence of any commercial or financial relationships that could be construed as a potential conflict of interest.
All claims expressed in this article are solely those of the authors and do not necessarily represent those of their affiliated organizations, or those of the publisher, the editors and the reviewers. Any product that may be evaluated in this article, or claim that may be made by its manufacturer, is not guaranteed or endorsed by the publisher.
Angle, J. W., Lechner, E. M., Reece, C. E., Stevie, F. A., and Kelley, M. J. (2023). Analysis of furnace contamination on superconducting radio frequency niobium using secondary-ion mass spectrometry. J. Vac. Sci. Technol. B 41. doi:10.1116/6.0002624
Chambers, R. G., and Frisch, O. R. (1952). The anomalous skin effect. Proc. R. Soc. Lond. Ser. A. Math. Phys. Sci. 215, 481–497. doi:10.1098/rspa.1952.0226
Ciovati, G. (2004). Effect of low-temperature baking on the radio-frequency properties of niobium superconducting cavities for particle accelerators. J. Appl. Phys. 96, 1591–1600. doi:10.1063/1.1767295
Delayen, J. R., Park, H., De Silva, S. U., Ciovati, G., and Li, Z. (2018). Determination of the magnetic field dependence of the surface resistance of superconductors from cavity tests. Phys. Rev. Accel. Beams 21, 122001. doi:10.1103/PhysRevAccelBeams.21.122001
Dhakal, P., Ciovati, G., Pudasaini, U., Chetri, S., Balachandran, S., and Lee, P. J. (2019). Surface characterization of nitrogen-doped high purity niobium coupons compared with superconducting rf cavity performance. Phys. Rev. Accel. Beams 22, 122002. doi:10.1103/PhysRevAccelBeams.22.122002
Dhakal, P., Ciovati, G., Rigby, W., Wallace, J., and Myneni, G. R. (2012). Design and performance of a new induction furnace for heat treatment of superconducting radiofrequency niobium cavities. Rev. Sci. Instrum. 83, 065105. doi:10.1063/1.4725589
Dhakal, P. (2020). Nitrogen doping and infusion in srf cavities: A review. Phys. Open 5, 100034. doi:10.1016/j.physo.2020.100034
Dilling, J., Krücken, R., and Ball, G. (2014). Isac overview. Hyperfine Interact. 225, 1–8. doi:10.1007/s10751-013-0877-7
Gonnella, D., Aderhold, S., Bafia, D., Burrill, A., Checchin, M., Ge, M., et al. (2019). “The LCLS-II HE high Q and gradient R&D program,” in Proc. SRF’19 (Geneva, Switzerland: JACoW Publishing). doi:10.18429/JACoW-SRF2019-MOP045
Grassellino, A., Romanenko, A., Sergatskov, D., Melnychuk, O., Trenikhina, Y., Crawford, A., et al. (2013). Nitrogen and argon doping of niobium for superconducting radio frequency cavities: A pathway to highly efficient accelerating structures. Supercond. Sci. Technol. 26, 102001. doi:10.1088/0953-2048/26/10/102001
Grassellino, A., Romanenko, A., Trenikhina, Y., Checchin, M., Martinello, M., Melnychuk, O. S., et al. (2017). Unprecedented quality factors at accelerating gradients up to 45 MVm−1in niobium superconducting resonators via low temperature nitrogen infusion. Supercond. Sci. Technol. 30, 094004. doi:10.1088/1361-6668/aa7afe
Gurevich, A. (2006b). Multiscale mechanisms of srf breakdown. Phys. C. Supercond. 441, 38–43. Proceedings of the 12th International Workshop on RF Superconductivity. doi:10.1016/j.physc.2006.03.024
Gurevich, A. (2017). Theory of RF superconductivity for resonant cavities. Supercond. Sci. Technol. 30, 034004. doi:10.1088/1361-6668/30/3/034004
Gurevich, A. (2006a). Thermal rf breakdown of superconducting cavities. ICFA Beam Dyn. Newslett 39, 34–44.
Halbritter, J. (1970). Fortan-program for the computation of the surface impedance of superconductors. KFK-external Rep. 3, 70–76.
Halbritter, J. (2001). “Material science of Nb RF accelerator cavities: where do we stand 2001?,” in Proc. SRF’01 (Geneva, Switzerland): JACoW Publishing).
He, F., Pan, W., Sha, P., Zhai, J., Mi, Z., Dai, X., et al. (2021). Medium-temperature furnace baking of 1.3 ghz 9-cell superconducting cavities at ihep. Supercond. Sci. Technol. 34, 095005. doi:10.1088/1361-6668/ac1657
Ito, H., Araki, H., Takahashi, K., and Umemori, K. (2021). Influence of furnace baking on Q–E behavior of superconducting accelerating cavities. Prog. Theor. Exp. Phys. 2021. doi:10.1093/ptep/ptab056
Kolb, P., Yao, Z., Junginger, T., Dury, B., Fothergill, A., Vanderbanck, M., et al. (2020). Coaxial multimode cavities for fundamental superconducting rf research in an unprecedented parameter space. Phys. Rev. Accel. Beams 23, 122001. doi:10.1103/PhysRevAccelBeams.23.122001
Lechner, E. M., Angle, J. W., Stevie, F. A., Kelley, M. J., Reece, C. E., and Palczewski, A. D. (2021). RF surface resistance tuning of superconducting niobium via thermal diffusion of native oxide. Appl. Phys. Lett. 119. doi:10.1063/5.0059464
Martinello, M., Bice, D. J., Boffo, C., Chandrasekeran, S. K., Eremeev, G. V., Furuta, F., et al. (2021). Q-factor optimization for high-beta 650 MHz cavities for PIP-II. J. Appl. Phys. 130. doi:10.1063/5.0068531
McMullin, M., Junginger, T., Kolb, P., Laxdal, R. E., and Yao, Z. (2023). “Thermal feedback in coaxial SRF cavities,” in Proc. SRF’23 (Geneva, Switzerland): JACoW Publishing).
Palmieri, V., Rossi, A. A., Stark, S. Y., and Vaglio, R. (2014). Evidence for thermal boundary resistance effects on superconducting radiofrequency cavity performances. Supercond. Sci. Technol. 27, 085004. doi:10.1088/0953-2048/27/8/085004
Pippard, A. B., and Bragg, W. L. (1947). The surface impedance of superconductors and normal metals at high frequencies ii. the anomalous skin effect in normal metals. Proc. R. Soc. Lond. Ser. A. Math. Phys. Sci. 191, 385–399. doi:10.1098/rspa.1947.0122
Posen, S., Romanenko, A., Grassellino, A., Melnychuk, O., and Sergatskov, D. (2020). Ultralow surface resistance via vacuum heat treatment of superconducting radio-frequency cavities. Phys. Rev. Appl. 13, 014024. doi:10.1103/PhysRevApplied.13.014024
Semione, G. D. L., Pandey, A. D., Tober, S., Pfrommer, J., Poulain, A., Drnec, J., et al. (2019). Niobium near-surface composition during nitrogen infusion relevant for superconducting radio-frequency cavities. Phys. Rev. Accel. Beams 22, 103102. doi:10.1103/PhysRevAccelBeams.22.103102
Sha, P., Pan, W., Zhai, J., Mi, Z., Jin, S., Liu, B., et al. (2022). Quality factor enhancement of 650 mhz superconducting radio-frequency cavity for cepc. Appl. Sci. 12, 546. doi:10.3390/app12020546
Steder, L., Bate, C., Remde, H., Reschke, D., Schaffran, J., Trelle, L., et al. (2022). “Medium temperature treatments of superconducting radio frequency cavities at DESY,” in Proc. 31st international linear accelerator conference (LINAC’22) (Geneva, Switzerland: JACoW Publishing), 840–843., no. 31 in International Linear Accelerator Conference. doi:10.18429/JACoW-LINAC2022-THPOGE22
Thoeng, E., McFadden, R. M. L., Saminathan, S., Morris, G. D., Kolb, P., Matheson, B., et al. (2023). A new high parallel-field spectrometer at TRIUMF’s β-NMR facility. Rev. Sci. Instrum. 94, 023305. doi:10.1063/5.0137368
Weingarten, W. (2011). Field-dependent surface resistance for superconducting niobium accelerating cavities. Phys. Rev. St. Accel. Beams 14, 101002. doi:10.1103/PhysRevSTAB.14.101002
Yang, Z., Hao, J., Quan, S., Lin, L., Wang, F., Jiao, F., et al. (2022). Surface resistance effects of medium temperature baking of buffered chemical polished 1.3 ghz nine-cell large-grain cavities. Supercond. Sci. Technol. 36, 015001. doi:10.1088/1361-6668/aca12a
Keywords: coaxical cavity, supercondcuting RF, heat treament, frequency dependence, particle accelarator
Citation: Kolb P, Yao Z, Blackburn A, Gregory R, Hedji D, McMullin M, Junginger T and Laxdal RE (2023) Mid-T heat treatments on BCP’ed coaxial cavities at TRIUMF. Front. Electron. Mater. 3:1244126. doi: 10.3389/femat.2023.1244126
Received: 21 June 2023; Accepted: 14 August 2023;
Published: 09 October 2023.
Edited by:
Marc Wenskat, University of Hamburg, GermanyReviewed by:
Gianluigi Ciovati, Thomas Jefferson National Accelerator Facility, United StatesCopyright © 2023 Kolb, Yao, Blackburn, Gregory, Hedji, McMullin, Junginger and Laxdal. This is an open-access article distributed under the terms of the Creative Commons Attribution License (CC BY). The use, distribution or reproduction in other forums is permitted, provided the original author(s) and the copyright owner(s) are credited and that the original publication in this journal is cited, in accordance with accepted academic practice. No use, distribution or reproduction is permitted which does not comply with these terms.
*Correspondence: P. Kolb, a29sYkB0cml1bWYuY2E=
Disclaimer: All claims expressed in this article are solely those of the authors and do not necessarily represent those of their affiliated organizations, or those of the publisher, the editors and the reviewers. Any product that may be evaluated in this article or claim that may be made by its manufacturer is not guaranteed or endorsed by the publisher.
Research integrity at Frontiers
Learn more about the work of our research integrity team to safeguard the quality of each article we publish.