- 1Xiong’an New Area Power Supply Company, State Grid Hebei Electric Power Co., Ltd., Xiong’an, China
- 2State Grid Hebei Sevice Center Co., Ltd., ShiJiaZhuang, China
- 3Shanghai Electric Power Design Institute Co., Ltd., Shanghai, China
- 4XJ Group Corporation, Xuchang, China
- 5Key Laboratory of Special Motors and High Voltage Electrical Appliances, Ministry of Education Shenyang University of Technology, Shenyang, China
With the introduction of China’s “Carbon Peaking Action Plan Before 2030,” the transformation of the power industry has released huge opportunities and potential. The DC distribution network can well-coordinate the contradiction between distributed power and grid access, fully develop the benefits of distributed energy, and become a new direction for the development of the power industry. However, the current traditional DC–DC converters have problems such as single-topology structure and low power density, which can only complete one-way transmission of energy; hence, the distributed energy cannot be fully utilized. Addressing the problem of distributed energy transfer, this paper is based on a three-port DC–DC converter for a low-voltage DC distribution network to realize energy transfer between the DC distribution network, distributed energy, and low-voltage load. First, the energy transfer modes of the three-port DC–DC converter are introduced. Combined with the converter topology and energy transfer mode, a simplified equivalent model of the converter is established. The voltage gain characteristics and frequency characteristics of this converter are studied. Furthermore, the effects of the excitation inductance to primary resonance inductance ratio parameter k and quality factor Q on the voltage gain characteristics of the converter are discussed. On this basis, the resonant cavity design of the converter is based on the optimal selection of parameters k and Q so that the converter can meet the voltage gain requirements in both forward and reverse operations. The simulation results under different loads verify the reasonableness of the resonant cavity component selection.
1 Introduction
With the emergence of energy shortage and environmental pollution and the increasing demand for electricity and power quality, the traditional AC distribution network faces a series of problems in solving load diversification and reducing energy loss (Boroyevich et al., 2010; Zheng, 2014; Chen, 2017). In the field of electric power, DC distribution using new energy has become the only way for the transformation and upgrading of the traditional manufacturing industry (Tong et al., 2007; Song et al., 2013; Wu et al., 2013). In recent years, China has made great efforts to develop distributed renewable energy and clean energy technology (She et al., 2013). Distributed energy has the problems of scale, dispersion, indirection, and uncertainty (Ortiz, 2010; Bahmani et al., 2016). The DC distribution network can coordinate the contradiction between distributed power and grid access well and maximize the value and benefit of distributed energy (Villar et al., 2008; Villar et al., 2009). At the same time, the DC distribution network is superior to the AC distribution network in voltage grade, control system, and equipment cost and has flexible scheduling function. Therefore, a low-voltage DC power distribution network will be the trend for future development (Heinemann, 2002; Soltau et al., 2014; Zhao et al., 2021).
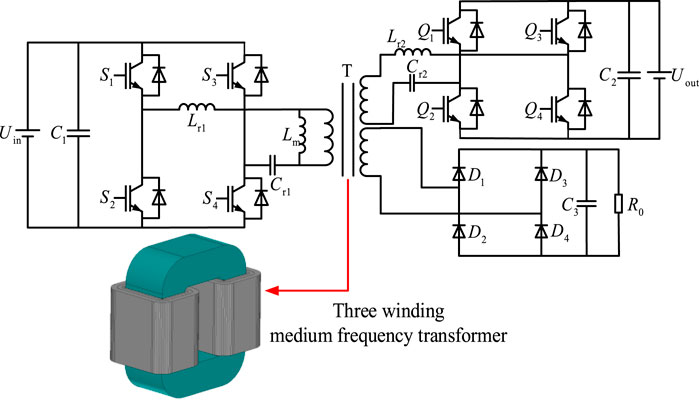
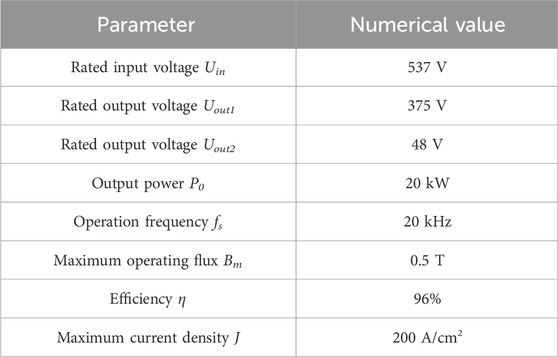
The topological structure of the three-port DC–DC converter is shown in Figure 1. Uin is connected to 380 V AC and outputs 537 V DC voltage by PFC rectification. Uout is connected to a 375-V distributed energy storage system; R0 is connected to a 48 V low-voltage load. The DC bus and distributed energy storage system constitute a capacitor–inductor–inductor–inductor–capacitor (CLLLC) bidirectional DC–DC converter to achieve bidirectional energy flow. The isolation transformer uses a three-winding core structure for ensuring that the voltage supplied by the DC bus adequately meets the requirements of both the distributed energy storage system and low-voltage loads. Furthermore, the topology has the capacity to improve the power density and concurrently diminish the volumetric dimensions of the converter. The bidirectional CLLLC resonator ensures zero voltage on and zero current off of the switching device, further saving energy. The basic parameters of the three-port DC-DC converter and three-winding intermediate frequency transformer are shown in Table 1.
2 Analysis of the energy transmission mode of the converter
In the topology of the three-port DC–DC converter, the three-winding transformer is the core component of the converter’s energy transmission. The isolation transformer is used for energy transmission and conversion. The specific working mode can be divided into three types, as shown in Figure 2.
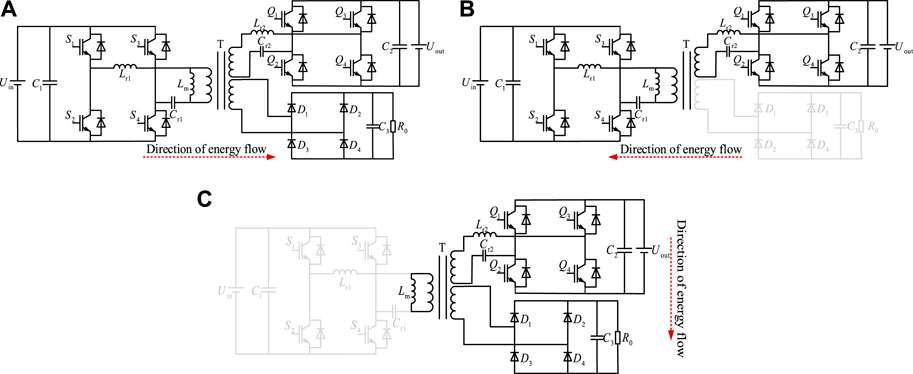
Figure 2. Three-port DC–DC converter energy transfer modes: (A) energy transmission mode 1; (B) energy transmission mode 2; (C) energy transmission mode 3.
Energy transmission mode 1 is the 537-V DC bus to charge mode, power flow from the DC bus side to a 375-V distributed energy storage system, and 48 V low-voltage load, which can be equivalent to a CLLLC bidirectional resonant converter and one-way LLC converter running in parallel; the DC bus port and distributed energy storage port constitute the CLLLC resonant topology of forward operation. The DC bus port and the low-voltage load port form a unidirectional LLC resonant topology. Energy transmission mode 2 is the distributed energy storage feedback DC bus mode. The power flows from the 375 V distributed energy storage side to the 537 V DC bus side, and the energy in distributed energy storage is injected into the grid. In this case, the three-port converter is a CLLLC full-bridge circuit operating in reverse, and the low-voltage 48-V load does not participate in energy transmission. Energy transmission mode 3 is the 375-V distributed energy storage system charging a low-voltage 48-V load, and the power flows from the distributed energy storage side to the low-voltage load side, which can be equivalent to a one-way full-bridge LLC circuit.
There are two resonant frequencies in the converter’s forward operation. The first resonant frequency is generated by the resonance of the front resonant cavity elements Lr1 and Cr1. The second resonant frequency is generated by the resonance between excitation inductor Lm and front resonant cavity elements Lr1 and Cr1, which can be expressed as Equations 1, 2.
The output voltage is controlled by controlling the switching frequency. According to the different resonant frequencies, they are divided into three resonant working states: under-resonant fm < fs < fr, quasi-resonant fs = fm, and over-resonant fs > fr.
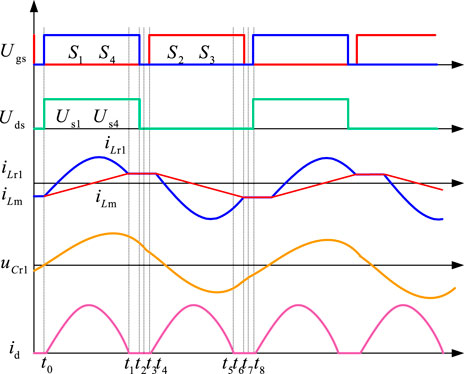
When the three-port DC–DC converter operates forward, it can be divided into three parts: port 1 is four IGBTs that constitute the inverter unit, port 2 is four IGBTs that constitute the rectifier unit, and port 3 is four diodes that constitute the uncontrolled rectifier unit. C1 and C2 are filtering capacitors in the forward and reverse operations, respectively, and C3 is a filtering capacitor of port 3. Lr1 and Cr1 are the resonant inductor and the resonant capacitor at the input stage of the forefront section, respectively. Lm is the excitation inductance of the transformer. Lr2 and Cr2 are the resonant inductors and capacitors of the later stage, respectively. In order to avoid the influence of some parasitic parameters on the working state of the converter, the converter is assumed to be in stable running state first. The switching device is an ideal type device. The initial energy storage of the inductor and capacitor is 0. The filter capacitor is large enough; the output voltage is the voltage source. The forward operation of the converter can be divided into eight stages, among which the first four stages and the last four stages are completely symmetric. In order to facilitate the description of the working process, the switching tube dead time is increased. This paper only analyzes the converter’s working process under the first four time states. The working waveform under the under-resonant state is shown in Figure 3. As shown in Figure 3, the switching tube dead time is large, which can be more intuitive to observe the working process of the converter, and the actual dead time is far less than the period in the figure.
Stage 1 (t0–t1): Before t0, the resonator is in a resonant state, and the switching tubes S2 and S3 are closed. The resonant current is continued through S1 and S4 parallel diodes so that the voltage of the switching tubes S1 and S4 is reduced to 0. At t0, S1 and S4 are switched on, and ZVS is switched on because the voltage of S1 and S4 is 0. In the t0-t1 stage, the direction of the resonator current iLr1 decreases gradually, opposite to the reference direction, and changes with the sine rule; the direction of the current iLm in the excitation inductor Lm with the common reference direction increases gradually linearly with time. Since iLr1 changes faster than iLm, energy is transferred from the input side to the output side through the induced current of the medium frequency transformer. Switch tubes Q2 and Q3 and diodes D1 and D4 switch on. In this stage, the resonant inductor current iLr1 and the excitation inductor current iLm change from negative to positive until they are equal at the end of this stage. At stage 1, the front resonant inductor Lr1, resonant capacitor Cr1, the side resonant inductor Lr2, and resonant capacitor Cr1 all participate in the resonant process, while Lm does not participate. This stage is shown in Figure 4A.
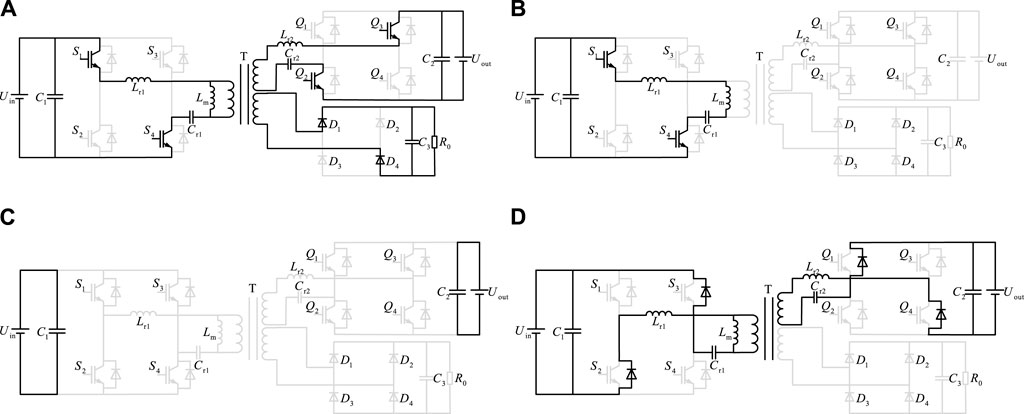
Figure 4. Under-resonant operating condition at fm < fs < fr: (A) stage 1 (t0–t1); (B) stage 2 (t1–t2); (C) stage 3 (t2–t3); (D) stage 4 (t3–t4).
Stage 2 (t1–t2): At time t1, switch tubes S1 and S4 are still on, and the resonant inductor current iLr1 is equal to the excitation inductor current iLm. The input current of this medium-frequency transformer is 0, and switch tubes at the secondary side will be automatically shut down as the input current is 0 so that the ZCS is turned off and the power reflux problem avoided. This stage is shown in Figure 4B.
Stage 3 (t2–t3): At time t2, switch tubes S1 and S4 are closed and are in the off state when they enter the dead zone. The voltage of switch tubes S1 and S4 is the input voltage Uin, as shown in Figure 4C.
Stage 4 (t3–t4): At time t3, switch tubes S2 and S3 have zero potential, the resonant current follows the current along the parallel diodes, and the output voltage of the front resonator is Uin. At this time, switch tubes S2 and S3 can realize ZVS switch-off and reasonably design the dead time to ensure that switch tubes are ZVS on and ZCS off. At time t4, switch tubes S2 and S3 switch on, and at the first half cycle of time t1–t4, switch tubes S2 and S3 switch off, as shown in Figure 4D.
Since the input side switch tubes S1–S4 and output side switch tubes Q1–Q4 adopt the same duty cycle control mode, which in the t0–t4 mode and t4–t8 mode are completely symmetric when the three-port converter is running forward, this paper will not describe it in detail. Theoretically, in order to improve the efficiency of the resonant converter and reduce the switching tube loss, the converter needs to operate in the under-resonant region because of the over-resonant region problem. The parametric design of a single-directional LLC is easy to implement. Although the structure of port 1 and port 2 of the bidirectional three-port resonant converter is symmetric and the work principle is the same, the under-resonant region of port 1 and the resonant region of port 2 will overlap when port 2 runs in reverse; when port 1 forward operates in the full voltage range of the under-resonant region, port 2 reverse operates in the over-resonant region. When port 1 and port 2 operate in the same voltage range, it is almost impossible to achieve under-resonance in both positive and negative operation modes. The resonant frequency in reverse operation can be optimized by the reasonable design of resonant cavity operating parameters so as to reduce the switching tube loss caused by over-resonant operation.
3 Analysis of the converter decoupling equivalent model
The three-port DC–DC converter requires different power transmission branches in different operation modes. A simplified equivalent circuit model is adopted to study the power flow relationship between the three ports of the converter. The influence of leakage inductance and coupling capacitance, stray inductance of the circuit, and filter capacitance of the medium-frequency transformer is ignored in the equivalent model. The equivalent model is shown in Figure 5.

Figure 5. Equivalent circuit of the three-port DC–DC converter. (A) Converter equivalent model. (B) Converter Y-type equivalent model.
In Figure 5B, L′r2 and C′r2 are the resonant inductance and resonant capacitor converted from the secondary side to the primary side of the converter, respectively. U1 is the input square wave voltage at the primary side of the resonator. U2 and U3 are the output square wave voltages of the secondary side of the converter. U′2 and U′3 are from the secondary side converted to the primary side equivalent square wave voltages of the converter. The voltage parameters on the primary and secondary sides and resonant inductance and capacitance of the resonator after conversion are shown in Equations 3, 4.
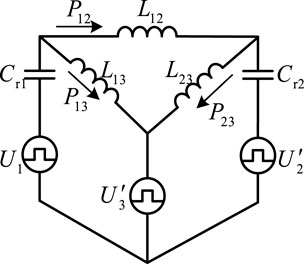
We suppose that the equivalent parallel point voltage of the three-port medium-frequency transformer is U0. After the AC voltage of the three-port transformer transmits power through the respective ports, a common voltage U0 can be formed in the medium-frequency transformer equivalent model. The resonant inductance of the resonator is much larger than the excitation inductance of the medium-frequency transformer. In order to expediently analyze, the role of the transformer excitation inductance is ignored. The △-type equivalent circuit obtained by the Y-△ transformation of the Y-type equivalent circuit in Figure 5B is shown in Figure 6.
In Figure 6, L12, L13, and L32 are energy transfer inductors between ports. According to the Y-△ transformation equation, the inductance expression of the △-type equivalent circuit can be written as Equation 5.
The energy transfer between port 1 and port 2 is only related to the resonant inductors Lr1 and Lr2 of port 1 and port 2 and resonant capacitors Cr1 and Cr2 from Figure 5 but has no coupling relationship with port 3. Similarly, when charging the low-voltage load of port 3, ports 1 and 2 are only related to the resonant device of the port itself, and there is no coupling relationship between ports. Therefore, the three-port DC–DC converter can be equivalent to the simplified circuit model shown in Figure 7.

Figure 7. Simplified equivalent circuit model: (A) equivalent model for ports 1 and 2; (B) equivalent model for ports 1 and 3.
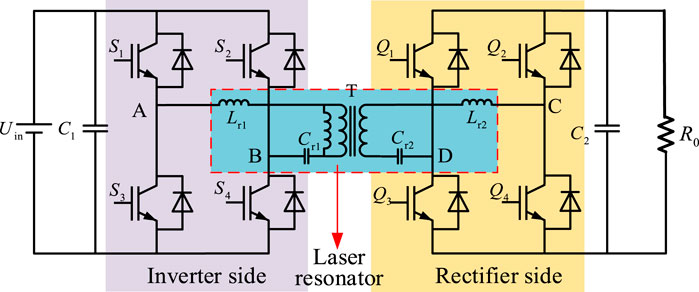
The energy transfer between the ports of the three-port converter is based on the ideal state, and the leakage inductance of the medium frequency transformer will generate cyclic power between the ports in the actual operation process, which can only be eliminated by modulation technology. Port 1 and port 2 can eliminate the cyclic power by the modulation technology. In contrast, port 3 can reduce the cyclic power of the converter only by minimizing the primary-side leakage inductance of the medium-frequency transformer as port 3 is the full-bridge uncontrolled rectifier circuit. The CLLLC resonant converter is mainly divided into three parts, the inverter side, the resonator side, and the rectifier side, as shown in Figure 8.
The converter-simplified equivalent circuit can be considered a bidirectional CLLLC converter and a unidirectional LLC converter running side by side. The forward operation principle of the bidirectional CLLLC converter is the same as that of the LLC converter. This paper considers the forward operation of the CLLLC converter as an example to analyze the frequency characteristics and voltage gain characteristics between port 1 and port 2 of the three-port converter. The resonant converter usually works near the resonant frequency point. The first harmonic analysis (FHA) method is used to decompose the square wave voltage input to the resonator by Fourier decomposition. The harmonic component is ignored. Assume that only the fundamental component completes the energy transmission of the resonant converter.
The drive signals of switch tubes S1 and S4 on the inverter side are complementary to the drive signals of switch tubes S2 and S3, and the switch tubes are conducted alternately. The input voltage at both ends of the resonator is the square wave voltage from Uin to Uin. UAB varies with the switching tube period, as shown in Equation 6. The resonator, a filter network with frequency-selective properties, weakens the higher harmonics. The resonator input voltage UAB mainly depends on the input voltage Uin and the fundamental component of input current ir1 of the converter.
where Uin is the input voltage of the converter; Ts is the switching cycle.
Taking Fourier transform of Equation 6, Equation 7 can be obtained as follows.
The equivalent resistance Req at the input of the resonator is expressed as Equation 8.
The simplified equivalent model of the converter after fundamental equivalent analysis is shown in Figure 9.
The main circuit of port 1 and port 2 of the three-port DC–DC converter is simplified into a purely resistive load resonant network driven by a sinusoidal fundamental voltage by the fundamental wave analysis method. The resonant frequency characteristics and voltage gain characteristics can be solved by the fundamental equivalent circuit based on port 1 and port 2.
4 Characteristic analysis of the three-port DC–DC converter
4.1 Resonance frequency analysis
The resonant converter changes the resonant cavity equivalent input impedance by changing the operating frequency to control the output voltage. Figure 9 shows the fundamental equivalent model between port 1 and port 2 of the converter. The resonator parameters are further defined as follows:
where ωs is the switching angular frequency ωs = 2πfs; UAB and UCD are the input and output fundamental voltage of the resonator, respectively.
The resonator fundamental equivalent transfer function can be expressed as
Substituting Equation 9 into Equation 10,
k = Lm/Lr1, h = n2Lr2/Lr1, and g = Cr2/n2Cr1; the normalized parameters k, h, and g are substituted into Equation 11:
The numerator and denominator are multiplied by Cr1/Lr1; substituting
When the resonator generates resonance, the imaginary part of the transfer function is 0. If the imaginary part in Equation 13 is equal to 0, then
When the resonator generates resonance frequency ωr, it is substituted into Equation 14, and both ω12ωr2 are multiplied:
a = k + kh + h, b = k + k/g + h+1/g, and c = 1/g; we can obtain
It can be obtained by solving Equation 16:
When the resonator produces resonance, the series resonance frequency is greater than that of parallel resonance because the excitation inductance is greater than that of resonance inductance, Lm > Lr1. Therefore, the positive value of the normalized resonance frequency in Equation 17 is shown in Equation 18:
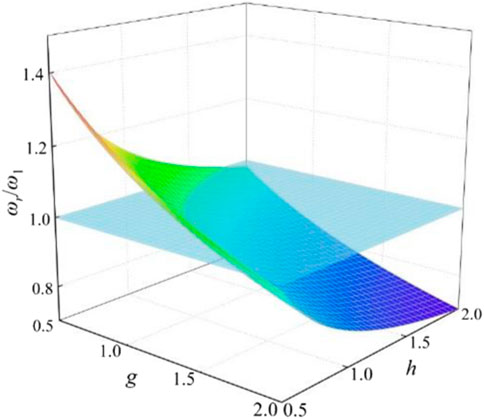
According to Equations 15, 18, the corresponding relationship between ωr/ω1 and the normalized parameters g and h can be drawn, which is shown in Figure 10. Through the space surface and ωr/ω1 = 1, the magnitude relationship of the resonant frequencies ω1, ω2, and ωr is judged as shown in Equation 19:
Equation 19 and Figure 10 show that when the three-port DC–DC converter runs forward, the resonant inductor Lr2 and the resonant capacitor Cr2 of the output side of the resonators at ports 1 and 2 will affect the resonant frequency ωr, which make the resonant frequency ωr between ω1 and ω2. If ω1 and ω2 are equal, then the resonant frequency ωr is equal to both of them ω1 = ω2 = ωr. As a result of the symmetric structure of the forward and reverse operation modes, the frequency characteristics of the resonant converter in reverse operation are the same. Theoretically speaking, the principle of the CLLLC resonant converter is the same as that of a conventional unidirectional LLC resonant converter, which also has three resonant states. The efficiency in the design of the converter can be improved by designing the converter in the state of under-resonance or quasi-resonance.
4.2 Analysis of voltage gain characteristics
The gain characteristics of the resonant converter are deduced and analyzed by using the fundamental analysis method FHA mentioned in the previous section. According to Equation 13, the characteristic impedance
The simplified voltage gain expression can be obtained from Equation 20:
When the switching frequency and resonant frequency of the converter are equal, ωs = ωr, the expression ωr is incorporated into Equation 21. According to the resonant frequency, aωr-b/ωr + c/ωr3 = 0, and the simplified voltage gain is shown in Equation 22:
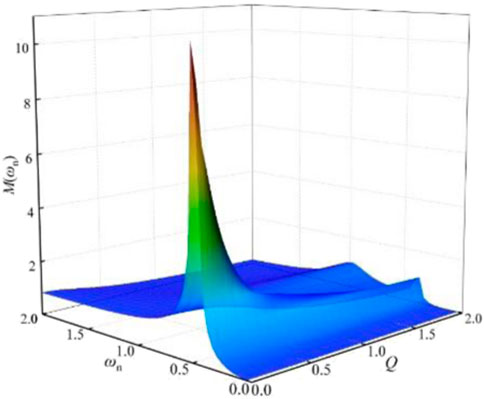
According to Equation 18, when the resonant frequency ωr/ω1 = 1, the voltage gain of the converter is independent of the load, and the voltage gain M of Equation 22 is always 1. When the secondary-side resonant elements Lr2 and Cr2 of the resonator are equivalent to the primary-side resonant elements Lr1 and Cr1 of the resonator, h = g = 1, the corresponding relationship between voltage gain M, quality factor Q, and normalized resonant frequency ωn can be obtained from Equation 22, as shown in Figure 11.
According to Q = Zr/Zeq, when the equivalent parameter Zr of the primary edge resonator is determined, the quality factor is inversely proportional to the equivalent load impedance. From Figure 11, the voltage gain M can be increased by appropriately reducing the converter operating frequency under a light load condition. When the load is constant, the voltage gain decreases gradually with the increase in the working frequency and finally reaches a stable value. When the converter is overloaded, the voltage gain M increases gradually with the decrease in the switching frequency. When ωn < 0.5, the voltage gain decreases rapidly and finally approaches 0. When ωn = 1, the voltage gain of the load-independent converter is always 1. When ωn > 1, the converter works under the over-resonant condition and the voltage gain value basically remains unchanged under the overload condition and gradually decreases with the decrease in load under the light load condition. The voltage gain value under the over-resonant condition is always less than 1. In the design of the resonator, considering the full load of the converter, the characteristic impedance Zr of the original side is reduced as far as possible to obtain a smaller quality factor and a more ideal voltage gain value.
To sum up, the side resonant elements of the resonator have an impact on the voltage gain. In order to meet the voltage gain requirements when the converter runs in reverse, the resonator should be designed with a completely symmetric structure (h = g = 1). When the voltage gain is determined, a larger value of K and quality factor Q is selected as far as possible to ensure that the converter meets the power demand in a wider frequency range.
5 Design of the converter resonator
The above analysis shows that the voltage gain curve of the converter contains functions of ωn, k, Q, g, and h. In the design process of the resonator, the voltage gain of the converter running in reverse is taken as h = g = 1, which means that the resonator is completely symmetric. In the design process, ωn, Q, and k are the key parameters affecting the performance of the converter. ωn is selected as the control variable, which means that the voltage gain curve remains monotonic within the operating frequency range of the demand and meets the voltage gain requirements under all load conditions in the forward and backward operation modes. In addition, the ZVS condition should be satisfied. The resonator elements are determined by optimizing the quality factor Q and the resonant inductance ratio k.
The three-port converter high-voltage side input voltage is 537 V, and the voltage fluctuation range is 525–550 V; the medium-voltage side rated output voltage is 375 V, and the voltage fluctuation range is 350–400 V; the medium-voltage side output power is 18 kW, and the working frequency is 2 kHz. After the above analysis, different values of parameters k and Q were found to affect the voltage gain of the converter. In the ideal case, the transformer ratio is determined. The DC voltage gain is set as 1; when the converter works at the quasi-resonant frequency normalized resonant frequency, ωn = 1, and the transformer theoretical ratio is determined as shown in Equation 23.
The voltage gain values of the highest and lowest input voltages in forward operation are M1max and M1min, respectively as shown in Equation 24.
The voltage gain values of the secondary-side highest and lowest input voltages in reverse operation are M2max and M2min, respectively as shown in Equation 25.
The larger value of the maximum voltage gain and the smaller value of the minimum voltage gain are taken for forward and reverse operation modes. First, the impedance characteristics of the converter are analyzed. When the converter has no load, Q = 0, and the converter gain function taking the maximum operating frequency can be expressed as Equation 26.
When the converter takes the minimum voltage gain Mmin, its value is greater than the no-load voltage gain Mmin > Mn_max. The restriction condition of parameter k can be obtained from Equation 27.
Assume that the maximum operating frequency of the converter is infinite and the parameter k is the maximum value as shown in Equation 28.
According to the parameter k limiting conditions, minimum voltage gain Mmin, ωnmax = 2πfmax/2πfr = fnmax, and normalized quasi-resonant frequency fnmax = fmax/fr, the maximum operating frequency of the converter can be determined as shown in Equation 29.
According to Equation 28, the maximum k value is 10 when the converter has no load. When k = 10, the frequency range of the converter is too wide, which is inconsistent with the actual operation of the converter. Considering the forward and backward operation modes of the converter, the maximum normalized resonant frequency fnmax = 1.25 is taken from Equation 29, and the k value is 3.68.
The condition of the converter to realize ZVS is the switching tube current hysteresis voltage, which is the equivalent input impedance of the inductive resonator. According to Figure 9, the input impedance of the simplified model of the converter fundamental wave can be expressed as Equation 30.
According to the characteristic impedance Zr and inductance coefficient k, the normalized parameter is g = h = 1; the normalized input impedance Zn = Zin/Zr can be expressed as
The condition for the converter to realize ZVS is the switching tube current hysteresis voltage, and the equivalent input impedance is the sensitivity. When the converter is just in the ZVS region, it means that the equivalent input impedance is purely resistive, the phase of the current and voltage is equal, and the imaginary part of Equation 31 is 0, which means that the equivalent input impedance is the dividing line of the inductive capacitance.
According to Equation 32, when the imaginary part of the normalized impedance is 0, two constraints Equations 33, 34 are obtained. In order to realize the converter ZVS and the maximum gain Mmax, the Q-value selection and the minimum operating frequency fmin are discussed.
If Equation 33 is established, it can be concluded that when the equivalent impedance is purely resistive,
If Equation 34 is established, the expression of quality factor Qmax can be obtained:
Substituting Equation 35 into the voltage gain expression Equation 21 yields the minimum normalized frequency at the maximum voltage gain as shown in Equation 36:
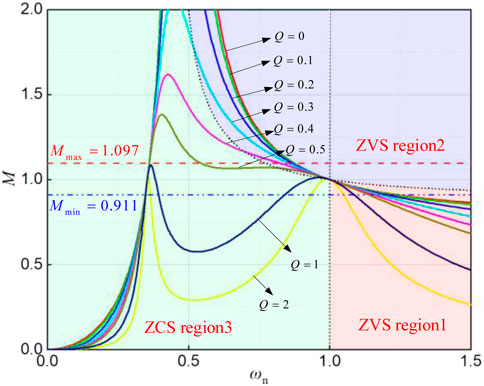
For k = 3.5, the relationship between the maximum and minimum gain of voltage gain and the converter is shown in Figure 12.
As the normalized equivalent impedance is inductive in region 1, the AC square wave voltage across the converter resonator leads a resonant current so that power switches reach ZVS. In region 2, where the normalized equivalent impedance is inductive as well, the switch tube reaches ZVS, and rectifier diodes on the rectifier side reach ZCS. Contrastingly, in region 3, characterized by capacitive normalized equivalent impedance, the switch tube fails to achieve ZVS, and it can be observed that the voltage gain has a large variation within this region. Therefore, different Q-values should be avoided in region 3 when designing the converter resonator.
According to Equation 33, the normalized frequency of the converter is limited to the range
Let F(ωn) = Q2(ωn) and find the derivative. The derivative function is equal to 0. The operating frequency ω0 is found within the operating frequency range
According to Equation 38, when
The converter operating frequency range is
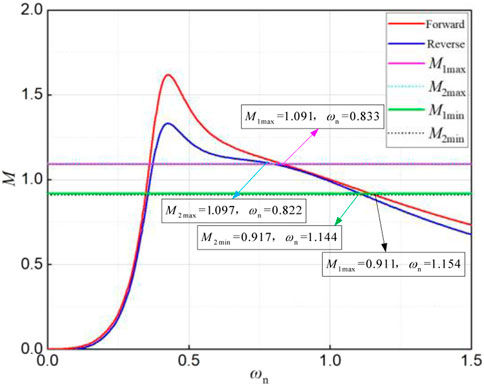
According to Equation 23, the transformer ratio is 1.432. The forward and reverse operation voltage gains are M1max = 1.091, M1min = 0.0911, M2max = 1.097, and M2min = 0.0917.
After comprehensive consideration, the parameter is k = 3.5, and the maximum quality factor Q is calculated as 0.546. When Q = 0.4, the voltage gain is 1.249, which meets the demand.
Load resistance R0 and equivalent resistance Req are calculated as follows:
According to Equation 40, the load resistance and equivalent resistance are 7.812 Ω and 12.99 Ω, respectively. The maximum and minimum resonant frequencies of the converter during rated operation are determined as follows:
Equation 41 shows that the maximum resonant frequency of the converter is 1.585 kHz and the minimum resonant frequency is 2.465 kHz. Based on the quality factor, the resonant inductance and the resonant capacitance of the primary side of the resonator can be calculated as shown in Equations 42, 43.
The resonant inductance and capacitance of the resonator’s secondary side are calculated as Equation 44.
The resonator element is calculated as Lr1 = 0.6 mH, Cr1 = 11 μF, Lr2 = 0.29 mH, and Cr2 = 22 μF.
Figure 13 shows the corresponding relationship between the voltage gain curve and normalized resonant frequency during forward and reverse operation modes. From Figure 13, the working frequencies of the forward and reverse running processes can be determined.
After discussing the value of parameters k and Q, from Figure 13, when the converter runs in the positive and negative directions, the voltage gain in the range of the under-resonant operating frequency meets the requirements.
6 The simulation verification
In order to verify the rationality of theoretical analysis and parameter design, PSIM simulation software is used to simulate the forward operation of the three-port DC–DC converter under ωn = 0.9 and different load conditions. Figure 14A shows the driving waveforms of the converter switch S1 and S3, and Figure 14B shows the waveforms of the input voltage Uin of the resonator and the voltage ULm of the excitation inductor.
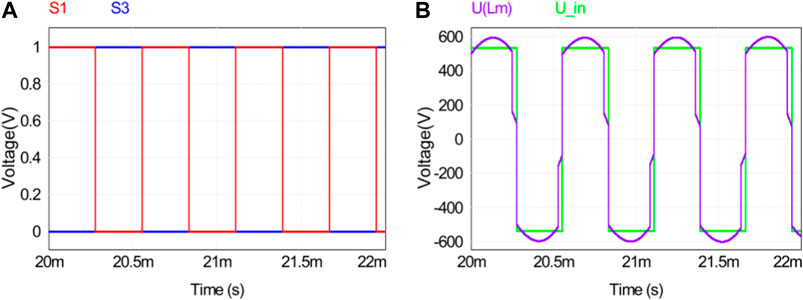
Figure 14. Switching drive and input voltage waveforms. (A) Switch tube drive waveform. (B) Input voltage of the resonator.
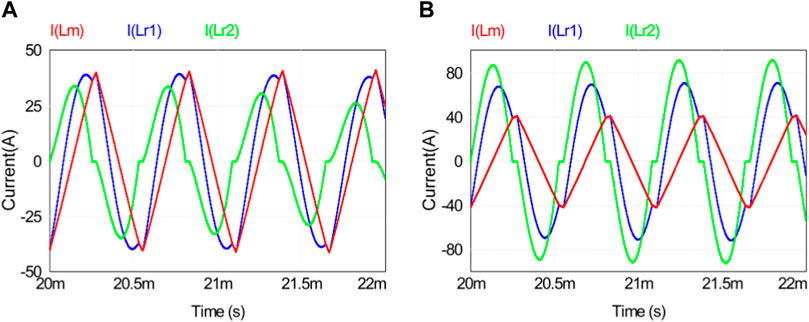
Figure 15 shows the current waveforms of excitation inductors Lm and the original and secondary-side resonant inductors Lr1 and Lr2 under different load conditions when ωn = 0.9. Figure 15 shows that the resonant currents iLr1 and iLr2 lag behind the excitation current iLm, and the switch tube realizes ZVS.
Figure 16 shows the waveforms of the input current ipri and output current isec of the resonator under light-load and full-load conditions. When the load increases, the original and secondary side currents meet the power transmission requirements.
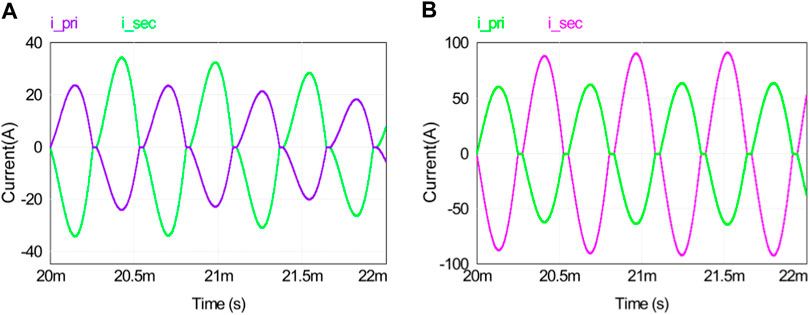
Figure 16. Resonant current waveforms of the converter at different loads: (A) light load and (B) heavy load.
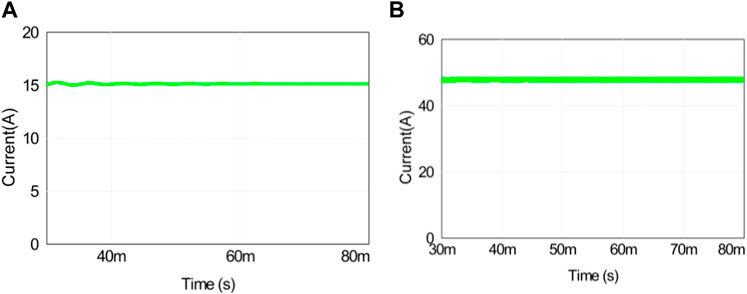
Figure 17 illustrates the output current waveform of port 2 in the three-port converter under both light-load and full-load conditions in a steady state. Figure 18 shows the resonant capacitor current waveforms on the input side and output side of the resonator under light-load and full-load conditions. The figure shows that the voltage and current of the three-port DC/DC converter can meet the power transmission requirements under both light-load and full-load conditions.
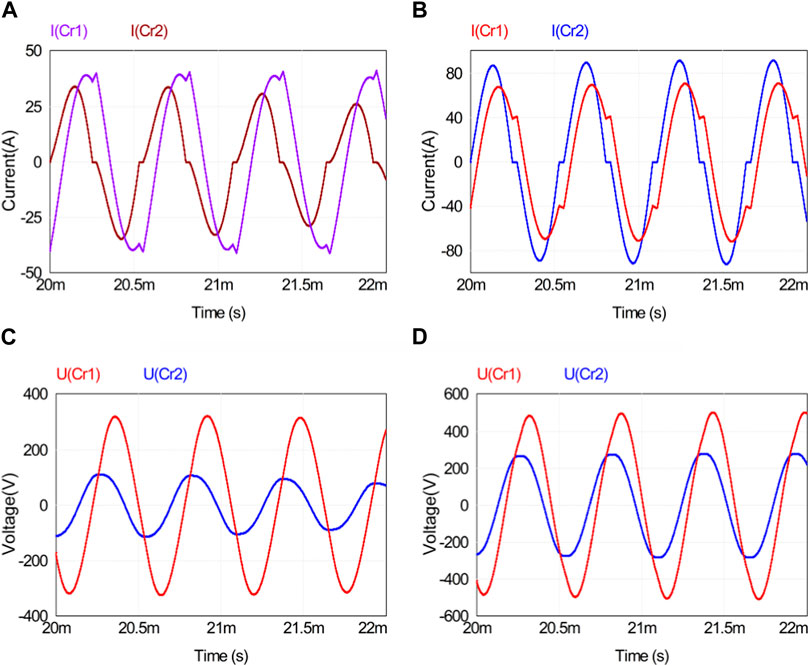
Figure 18. Resonant capacitor current and voltage waveforms at different loads: (A) light-load current waveform; (B) full-load current waveform; (C) light-load voltage waveform; (D) full-load voltage waveform.
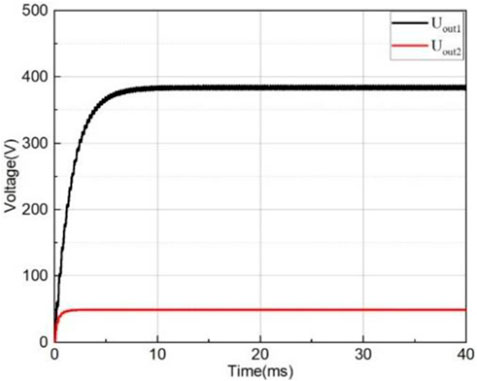
Figure 19 shows that the fixed port 1 input voltage is 537 V, and the output voltage of port 2 and port 3 is stable. Uout1 and Uout2 are stable at 375 and 48 V, respectively, when the converter runs forward.
The simulation study of the forward operation of the converter under different loads shows that the voltage and current waveforms of the resonator components meet the power output requirements, and the parameters of the resonator components are reasonable. In order to further verify the rationality of the resonator design, simulation research was conducted on the reverse operation of the converter. The fixed reverse input voltage was 375 V, and the resonator current and voltage waves during the reverse operation of the converter are shown in Figure 20.
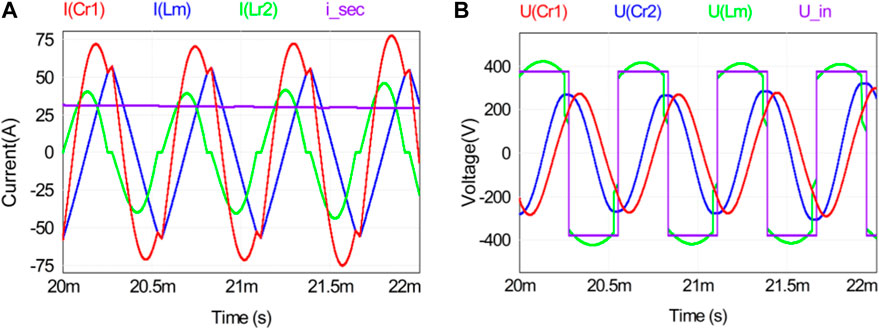
Figure 20. Reverse operation voltage and current waveforms: (A) current waveform and (B) voltage waveform.
The voltage and the current values of the resonator elements are stable in the forward and reverse operation modes, and the converter can meet the power output requirements under different loads.
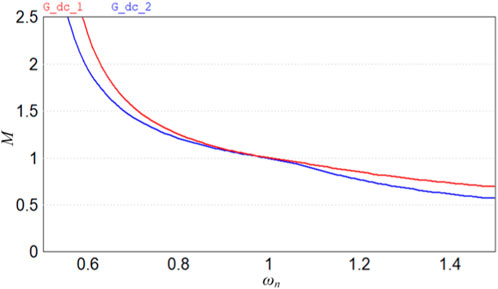
Figure 21 shows the curve of DC voltage gain Gdc with normalized frequency during the forward and reverse operation modes of the converter.
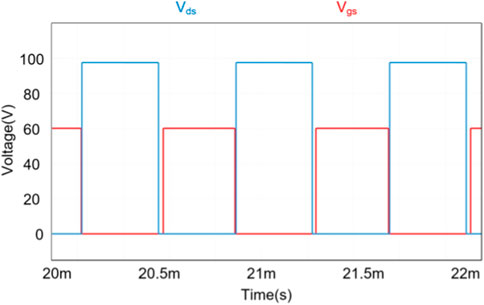
The simulation results given in Figure 21 show that the forward and reverse operation modes of the converter reach the calculated value of voltage gain. The simulation of the forward and reverse operation modes of the converter verified that the resonant cavity parameters of the converter meet the design requirements under the premise of voltage gain and power transmission and realize ZVS in the under resonant range. ZVS implementation is shown in Figure 22.
7 Experiment research
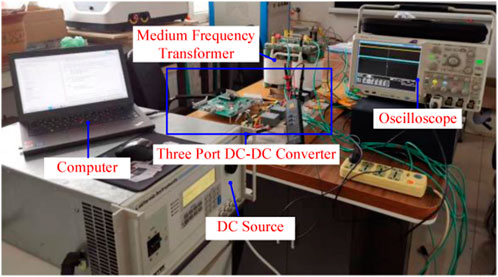
On account of the above theoretical analysis and simulation investigation, a 20-kW three-port DC–DC converter experimental platform is established, as shown in Figure 23. TMS320F28335 is selected as the main control chip to validate the rationality of this design scheme.
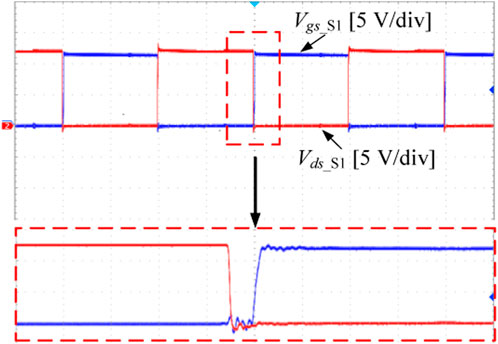
Figure 24 shows the driving output waveform of the converter switch S1, where Vgs_S1 and Vds_S1 are the gate voltage and drain voltage of the switch S1, respectively. The figure shows that the switch tube implements ZVS.
The output voltage waveforms of the medium- and low-voltage sides of the three-port DC–DC converter are shown in Supplementary Figure S1. The figure shows the stability of the output voltages at 375 and 48 V, affirming the validity of the proposed scheme.
8 Conclusion
Addressing the shortage of distributed power supply and the DC distribution network in domestic and abroad situations, this paper proposes a three-port DC-DC converter topology based on a low-voltage DC distribution network, which can effectively combine distributed energy, low-voltage load, and the DC bus. This research analyzes different energy transfer modes of the three-port DC–DC converter, and decoupling analysis is carried out on the main circuit topology structure. The working process of the equivalent model of the three-port DC–DC converter in the first half cycle of four time stages is analyzed in detail when the energy flow is forward. Then, the characteristics of the converter are studied. Based on the fundamental equivalent analysis method, the simplified equivalent model of the converter is established and the resonant frequency characteristics and voltage gain characteristics of the converter are analyzed. According to the different voltage gains, the influence of different values of the converter parameters k and Q on the gain characteristics of the converter is analyzed, and the design of the resonator is completed by choosing the parameters k and Q reasonably. Based on the theoretical derivation and using PSIM simulation software, the forward and reverse operation modes of the converter under different load conditions are simulated and analyzed. The experimental platform of a 20-kW three-port DC–DC converter is built, and experimental investigations are conducted under varied load conditions. The experimental results show that the converter can achieve stable power output under different working conditions. The use of ultra-thin silicon steel sheets in high-power intermediate-frequency applications can effectively reduce the total loss of intermediate-frequency transformers, thereby providing additional confirmation regarding the correctness and feasibility of the proposed scheme for a high-power medium-frequency converter with ultra-thin silicon steel sheets.
Data availability statement
The original contributions presented in the study are included in the article/Supplementary Material; further inquiries can be directed to the corresponding authors.
Author contributions
LH: conceptualization, project administration, resources, and writing–original draft. MZ: conceptualization, investigation, software, visualization, and writing–review and editing. YW: data curation, methodology, resources, visualization, and writing–review and editing. FQ: supervision, validation, and writing–review and editing. DS: formal analysis, investigation, writing–review and editing. XY: formal analysis, methodology, and writing–review and editing. YL: data curation and writing–original draft. ZY: project administration, validation, and writing–review and editing.
Funding
The author(s) declare that financial support was received for the research, authorship, and/or publication of this article. This research was funded by the State Grid Corporation of China (No. kj2021-040), “Development of Intelligent Control Technology and Platform for City Integral Energy System in Xiong’an New Area.”
Conflict of interest
Authors LH, FQ, DS, and XY were employed by State Grid Hebei Electric Power Co., Ltd. Author MZ was employed by State Grid Hebei Service Center Co., Ltd. Author YW was employed by Shanghai Electric Power Design Institute Co., Ltd. Author YL was employed by XJ Group Corporation.
The remaining author declares that the research was conducted in the absence of any commercial or financial relationships that could be construed as a potential conflict of interest.
The authors declare that this study received funding from State Grid Corporation of China. The funder had the following involvement in the study: design, collection, analysis, interpretation of data, the writing of this article, and the decision to submit it for publication.
Publisher’s note
All claims expressed in this article are solely those of the authors and do not necessarily represent those of their affiliated organizations, or those of the publisher, the editors, and the reviewers. Any product that may be evaluated in this article, or claim that may be made by its manufacturer, is not guaranteed or endorsed by the publisher.
Supplementary material
The Supplementary Material for this article can be found online at: https://www.frontiersin.org/articles/10.3389/felec.2024.1369905/full#supplementary-material
References
Bahmani, A. M., Thiringer, T., and Kharezy, M. (2016). “Optimization and experimental validation of medium-frequency high power transformers in solid-state transformer applications,” in 2016 IEEE applied power electronics conference and exposition (APEC), Long Beach, CA, USA, March 20–24, 2016 (IEEE), 3043–3050.
Boroyevich, D., Cvetkovic, I., Dong, D., Burgos, R., Wang, F., and Lee, F. (2010). “Future electronic power distribution systems a contemplative view,” in 12th international conference on optimization of electrical and electronic equipment (OPTIM), Brasov, Romania, May 20–22, 2010 (IEEE), 1369–1380.
Chen, Y. (2017). Design of DC/DC converter and research on stable operation technology of DC distribution network. Master’s degree. Beijing China: North China Electric Power University.
Heinemann, L. (2002). “An actively cooled high power, high frequency transformer with high insulation capability,” in 17th annual IEEE applied power electronics conference and exposition (APEC), Dallas, USA, March 10–14, 2002 (IEEE), 352–357.
Ortiz, G., Biela, J., and Kolar, J. W. (2010). “Optimized design of medium frequency transformers with high isolation requirements,” in IECON 2010-36th annual conference of the IEEE industrial electronics society, Glendale, USA, November 7–10, 2010 (IEEE), 631–638.
She, X., Huang, A. Q., and Burgos, R. (2013). Review of solid-state transformer technologies and their application in power distribution systems. IEEE J. Emerg. Sel. Top. Power Electron. 1 (3), 186–198. doi:10.1109/JESTPE.2013.2277917
Soltau, N., Eggers, D., Hameyer, K., and Doncker, R. (2014). Iron losses in a medium-frequency transformer operated in a high-power DC–DC converter. IEEE Trans. Magn. 50 (2), 953–956. doi:10.1109/TMAG.2013.2283733
Song, Q., Liu, W., Li, X., Rao, H., Xu, S., and Li, L. (2013). A steady-state analysis method for a modular multilevel converter. IEEE Trans. Power Electron. 28 (8), 3702–3713. doi:10.1109/tpel.2012.2227818
Tong, Y. B., Tong, W. U., Jin, X. M., and Chen, Y. (2007). Study of bi-directional dc/dc converter. Proc. CSEE 27 (13), 81–86. doi:10.3321/j.issn:0258-8013.2007.13.015
Villar, I., Rufer, A., Viscarret, U., Zurkinden, F., and Etxeberria-Otadui, I. (2008). “Analysis of empirical core loss evaluation methods for non-sinusoidally fed medium frequency power transformers,” in 2008 IEEE international symposium on industrial electronics (ISIE), Cambridge, United Kingdom, June 30–July 2, 2008 (IEEE), 208–213.
Villar, I., Viscarret, U., Etxeberria-Otadui, I., and Rufer, A. (2009). Global loss evaluation methods for nonsinusoidally fed medium-frequency power transformers. IEEE Trans. Ind. Electron. 56 (10), 4132–4140. doi:10.1109/TIE.2009.2021174
Wu, T. F., Chang, C. H., Lin, L. C., Yu, G. R., and Chang, Y. R. (2013). DC-bus voltage control with a three-phase bidirectional inverter for DC distribution systems. IEEE Trans. Power Electron. 28 (4), 1890–1899. doi:10.1109/TPEL.2012.2206057
Zhao, Y., Zheng, J., Zhang, Z., Shi, D., Qin, X., Shao, J., et al. (2021). “Influence of amorphous fragment on eddy current field of amorphous alloy transformer,” in 2021 IEEE international conference on power electronics computer applications (ICPECA), Shenyang, China, January 22–24, 2021 (IEEE), 497–501.
Keywords: DC distribution network, three-port DC–DC converter, capacitor–inductor–inductor–inductor–capacitor resonant converter, decoupling equivalence, resonator design
Citation: Hou L, Zhao M, Wang Y, Qu F, Shao D, Yang X, Liu Y and Yang Z (2024) Research on the energy transmission mode of a three-port DC–DC converter based on ultra-thin silicon steel. Front. Electron. 5:1369905. doi: 10.3389/felec.2024.1369905
Received: 13 January 2024; Accepted: 18 July 2024;
Published: 27 August 2024.
Edited by:
Wenjie Liu, Northwestern Polytechnical University, ChinaReviewed by:
Elena Helerea, Transilvania University of Brașov, RomaniaZhihao Min, Universitat Politecnica de Catalunya, Spain
Copyright © 2024 Hou, Zhao, Wang, Qu, Shao, Yang, Liu and Yang. This is an open-access article distributed under the terms of the Creative Commons Attribution License (CC BY). The use, distribution or reproduction in other forums is permitted, provided the original author(s) and the copyright owner(s) are credited and that the original publication in this journal is cited, in accordance with accepted academic practice. No use, distribution or reproduction is permitted which does not comply with these terms.
*Correspondence: Ming Zhao, bWluZ3poYW8xMjI2QDE2My5jb20=; Yang Liu, bGl1eWFuZzA1MjEyNkAxNjMuY29t
 Lei Hou1
 Yang Liu