 Zhichao Yang1*†
- 1China Electric Power Research Institute Co., Ltd., Beijing, China
- 2Beijing Zhixin Microelectronics Technology Co., Beijing, China
1 Introduction
With the development of Modular Multilevel Converter (MMC) technology, Voltage Source Converter-based High Voltage Direct Current (VSC-HVDC) is being used in power systems. Power systems are widely used. Between the two AC backbone networks, DC back-to-back converter stations can realize asynchronous networking, better connect AC grids of different voltages and isolate the two AC synchronous grids, effectively isolate the mutual influence between the interconnected AC synchronous networks, and limit the short-circuit current, and the contact line power control is simple and convenient for dispatch management. Compared with conventional DC transmission, the back-to-back project can also reduce equipment costs and save transmission investment because there is no DC line and the DC side loss is small.
The Yu-E DC back-to-back interconnection project adopts flexible DC transmission technology, which is the world’s largest in terms of voltage level and transmission capacity and is of great significance in promoting China’s DC technology innovation and optimizing the power grid structure in central China.
Yu-E DC back-to-back networking projects all use flexible DC transmission technology, the voltage level and transmission capacity are the world’s largest, with the world’s highest voltage level and transmission capacity. The converter station in the back-to-back project combines the rectifier station and inverter station of high-voltage DC transmission and completes the conversion process from AC to DC and then from DC to AC in the same converter station (Shi et al., 2004). Because of the complex operating conditions and the coexistence of DC and AC equipment in the same converter station, the electromagnetic field distribution around the back-to-back converter station is more complex than that of a single DC converter station or AC substation.
From 1970 to 1990, many scholars carried out theoretical calculations and measured analyses of electromagnetic disturbances in HVDC converter stations (Annestrand, 1972; Sarma and Gilsig, 1973; DeVore et al., 1988; Caldecott et al., 1990). The factors affecting radio interference levels were discussed and interference in the frequency range of 0.1–10 MHz was analyzed (Annestrand, 1972). Most of the domestic and international studies focused on the electromagnetic simulation of the main equipment in the converter station (Cai et al., 2018), while the electromagnetic distribution characteristics of back-to-back converter stations were less studied.
Measuring the power frequency electric field, power frequency magnetic field, and radio interference in the converter station, the distribution pattern and characteristics of the power frequency electric field, power frequency magnetic field, and radio interference were analyzed and summarized. This paper provided a reference for the environmental protection of the back-to-back converter station project.
2 The back-to-back converter station electromagnetic environment limits
For back-to-back converter stations, since the DC part is placed in the valve hall, and the EMF (Electromagnetic Environment Field) generated by the DC equipment in the valve hall can almost be controlled at a reasonable level, the EMF limit in the station is mainly for the power frequency EMF caused by the AC charged frame. A summary of the electromagnetic environment limits is shown in Tables 1, 2 (ICNIRP-2010, 2010; IEEE C95, 2002).
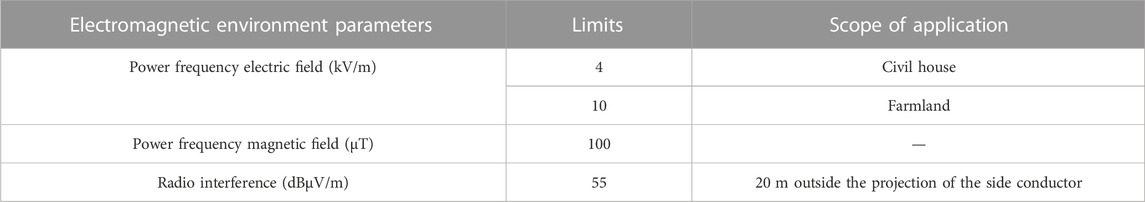
TABLE 1. Summary of the electromagnetic environment limits outside the back-to-back converter stations.
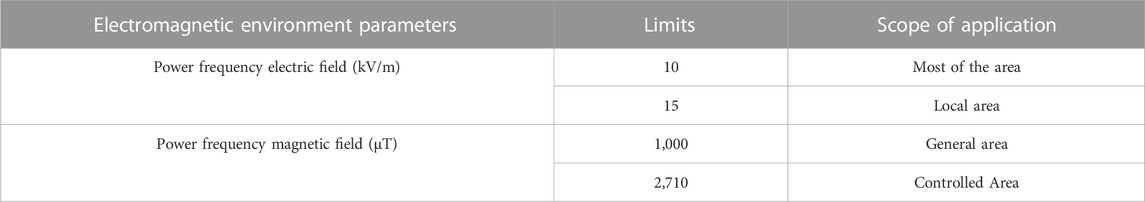
TABLE 2. Summary of the electromagnetic environment limits in the converter station.
3 Test equipment and methods
3.1 Power frequency electric and magnetic fields
3.1.1 Test equipment
Power frequency electromagnetic field measurement was done using PMM8053A type electromagnetic field measurement instrument or NARDA NBM550 electromagnetic field measurement instrument. Instrument range: electric field 0.01V/m ∼ 100 kV/m; magnetic field 1 nT–10 mT; frequency range: 5 Hz–100 kHz; measurement equipment should be in the calibration period.
3.1.2 Measurement method
The measuring instrument probe is installed in a well-insulated and adjustable height to the ground tripod, the fixed probe height from the ground is 1.5 m, and the probe is connected to the host with an optical fiber longer than 5 m. The probe is placed at the selected measurement point, and the measurement personnel holds the host for measurement and reads the electric field strength and magnetic induction strength value. Testers should be far enough away from the probe of the measuring instrument, at least 2.5 m in general, to avoid large electric field distortion at the instrument.
During the measurement process, when the instrument is turned on or switched to the measurement mode, we wait for the instrument to stabilize before taking readings; each measurement point readings are not less than three groups, and the measurement results are taken as the arithmetic mean of multiple measurements.
3.2 Radio interference
3.2.1 Measuring instrument
Using the German ROHDE & SCHWARZ company, radio interference measurement produced the R&S FSH3 electromagnetic interference test receiver, supporting the model HFH2-Z2 electrically shielded ring-type active antenna. The performance of the instrument conforms to the technical specifications of the CISPR radio interference measurement instrument. All measurements are made using the quasi-peak detection method. The measurement equipment should be in the calibration validity period.
3.2.2 Measurement method
Measurement was based on "GB 7349–1987 high-voltage overhead transmission lines and substations radio interference measurement methods.” The test should select 0.5 MHz as the measurement reference frequency, and the frequency value with the smallest amplitude within ±10% of the reference frequency as the measurement frequency point and the radio interference value of the frequency measurement after statistical evaluation of the radio interference level value.
To avoid errors due to possible standing waves in the line when measuring at a single frequency, multiple frequencies should be measured within the 0.15–30 MHz band, such as 0.15, 0.25, 0.50, 1.0, 1.5, 3.0, 6.0, 10.0, 15.0, and 30.0 MHz. The measurement position is the measurement reference distance. The measurement must be well selected for each frequency to avoid interference that is not generated from the transmission line or converter station.
The background interference field strength can be measured at selected measurement points during line or converter station outages. If the line or converter station equipment cannot be blacked out, it can be measured at 400 m from the line, 1 km from the converter station, or one to two environments similar to the measurement point location; the measured environmental interference field strength value is the measurement point of the background interference field strength value.
3.3 The back-to-back project electromagnetic environment
3.3.1 500 kV bridge arm reactor power frequency electric field measurement
In the direction of the 500 kV side of the bridge arm reactor, two sections are selected for measurement along the direction of the vertical bridge arm reactor to the inlet pipe busbar interval. The measurement point is the inspection walkway between the bridge arm reactor and the valve hall, as shown in the red part in Figure 1.
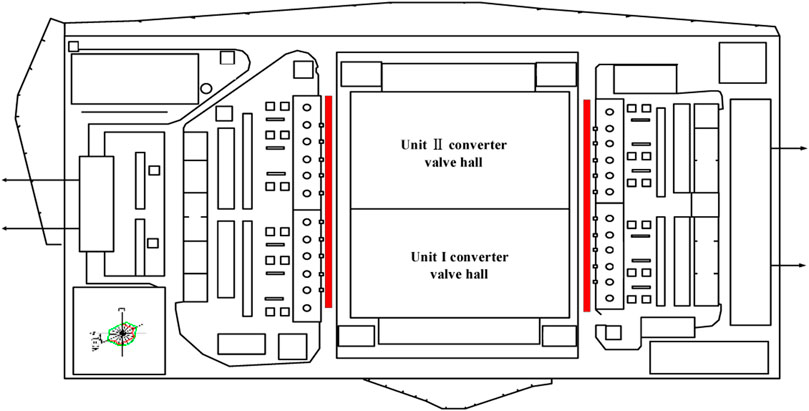
FIGURE 1. 500 kV bridge arm reactor before the inspection walkway frequency electric field transverse distribution measurement position.
During large loads, 500 kV bridge arm reactor frequency electric field measurement is carried out. From the distribution curve, it can be seen that the electric field intensity is maximum in the middle position of the inlet and outlet lines of the upper and lower bridge arms of the same phase of the bridge arm reactor (for example, the middle position of the upper and lower bridge arms of phase A). In the position of the middle of the junction of the two phases, the electric field strength is the smallest.
The maximum value is 12.14 kV/m at 14 m in unit and 11.56 kV/m at 54 m in unit. The maximum value is 12.21 kV/m at 56 m in unit Ⅱ and 12.23 kV/m at 56 m in unit Ⅱ.
(1) Bridge arm reactor inspection walkway electric field strength tested during unit Ⅰ operation
Starting position (0 m): 10 m outside of the upper bridge arm of phase A (10 m is the position of the upper bridge arm of phase A). The electric field intensity distribution curve is shown in Figure 2.
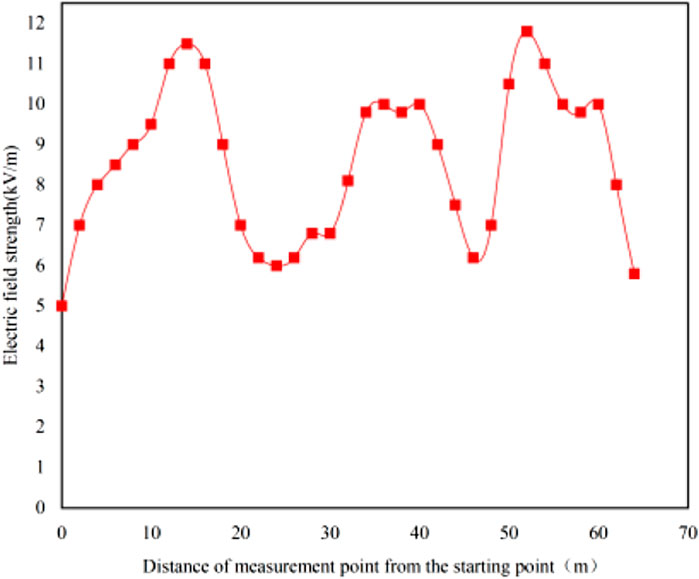
FIGURE 2. Unit I Operation inspection walkway industrial frequency electric field distribution.
(2) Measurement of the frequency electric field of the bridge arm reactor during the operation of unit Ⅱ
The starting point (0 m) for the upper bridge arm A phase outside the 10 m position and the electric field intensity distribution curve is shown in Figure 3.
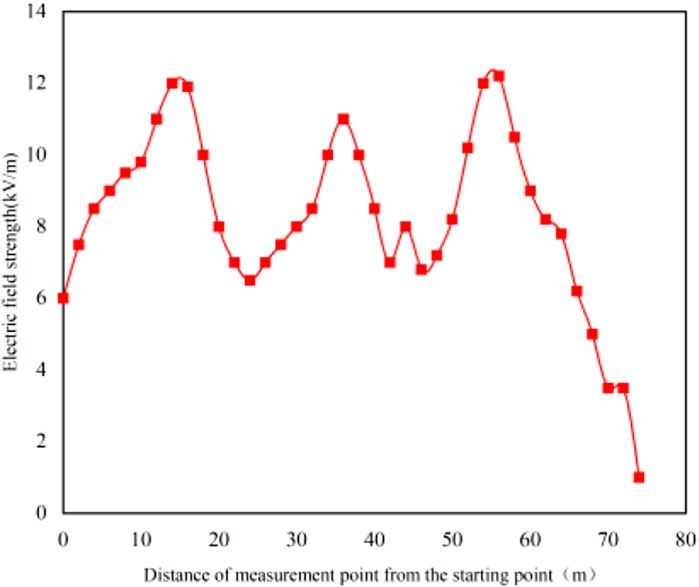
FIGURE 3. E side bridge arm reactor inspection walkway industrial frequency electric field distribution during unit II operation.
From the distribution curve, we can see that the electric field strength is greatest in the middle of the inlet and outlet lines of the upper and lower bridge arms of the same phase of the bridge arm reactor (for example, the middle of the upper and lower bridge arms of phase A). The electric field strength is the smallest in the middle of the junction of the two phases.
The maximum value is 11.56 kV/m at 54 m when unit Ⅰ is operating.
The maximum value is 12.23 kV/m at 56 m in unit Ⅱ.
3.3.2 500 kV bridge arm reactor power frequency magnetic field test
The 500 kV bridge arm reactor work frequency magnetic field measurement is carried out during the large load. The measurement content is: unit Ⅰ unit Ⅱ bridge main linkage change the north side of the inspection walkway work frequency magnetic field distribution. The maximum value of the magnetic field of unit Ⅰ is 0.424 mT at 52 m from the measurement point. The maximum value of the magnetic field of unit Ⅰ is 0.375 mT at 12 m from the measurement point. The maximum value of the magnetic field of unit I is 0.487 mT at 17 m from the measurement point. The maximum value of the magnetic field of the unit I E side is 0.411 mT at 52 m from the measurement point.
(1) Unit Ⅰ operation E side bridge arm reactor inspection walkway power frequency magnetic field test
The starting point of the test (0 m) is 10 m outside of phase A of the upper bridge arm, and the test results are shown in Figure 4.
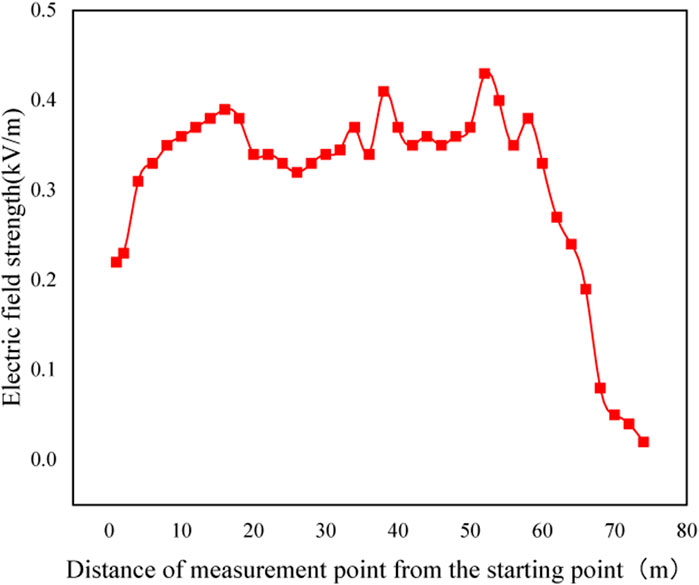
FIGURE 4. I-frequency magnetic field of the bridge arm reactor on the E side when unit I is running.
(2) Unit Ⅰ operation bridge arm reactor inspection walkway power frequency magnetic field test
The starting point (at 0 m) is 10 m outside the C-phase line, and the measurement results are shown in Figure 5.
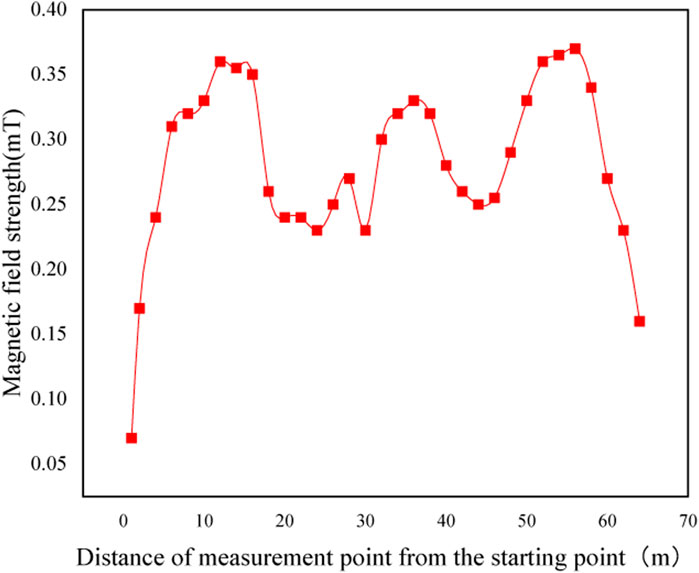
FIGURE 5. Unit I operating bridge arm reactor power frequency magnetic field.
3.3.3 Radio interference test
Since the converter station is mountainous and forested on the other three sides except for the doorway side, it cannot be tested. So, radio interference measurements were carried out at 20 m outside the doorway in the north direction of the back-to-back project. From the measurement results, it can be seen that the radio interference outside the doorway does not exceed 50 dB (μV/m), which meets the requirements of the relevant environmental protection limits [≤55 dB (μV/m)].
3.3.4 Comparison analysis of electromagnetic environment between back-to-back converter stations and traditional flexible and straight converter stations
A comparison of the EMD (electromagnetic disturbance) level between the back-to-back converter stations and the traditional flexible and straight converter station projects is shown in Table 2, 3. The measured values of the power frequency electric field of the conventional flex-station are 1.21 kV/m ∼ 5.86 kV/. The measured values of the back-to-back converter station’s electric field are 2.97 kV/m ∼ 12.23 kV/m. The analysis showed that the EMF characteristic parameter values of the conventional flex-straight converter station were smaller than those of the back-to-back converter station. This was due to the more complex operating conditions of back-to-back converter stations where DC and AC equipment coexist and the structure is more compact.
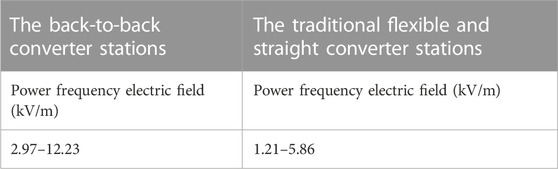
TABLE 3. Comparison of the EMD level between the back-to-back converter stations and the traditional flexible and straight converter station projects.
3.4 Conclusion
Considering the present electromagnetic distribution characteristics’ inability to accurately measure back-to-back converter stations, the electromagnetic environment in 500 kV back-to-back converter stations is analyzed. The conclusion is as follows:
1) Station frequency electric field 500 kV bridge arm reactor inspection walkway area frequency electric field is approximately 12.23 kV/m at the maximum value of 56 m when unit II is operating at full load.
2) The maximum value of the 500 kV bridge-arm reactor area of the magnetic field is approximately 0.7783 mT in the C-phase when unit Ⅰ is running.
3) The measurement results of radio interference outside the station do not exceed 50 dB μV/m, meeting the requirements of the relevant environmental protection limits.
Data availability statement
The raw data supporting the conclusion of this article will be made available by the authors, without undue reservation.
Author contributions
QL wrote the first draft of the manuscript and performed the statistical analysis. ZY contributed to the conception and design of the study. PZ, SL, MZ, YJ, YG, CW contributed to the resources. All authors contributed to manuscript revision, read, and approved the submitted version.
Funding
Funded Project: Research on Electromagnetic Wave Power Sensor Chip for Active Warning Function of Grid Secondary Equipment (5700-202341262A-1-1-ZN).
Conflict of interest
Authors ZY, QL, PZ, SL, MZ, YJ, and CW were employed by China Electric Power Research Institute Co., Ltd. Author YG was employed by Beijing Zhixin Microelectronics Technology Co.
Publisher’s note
All claims expressed in this article are solely those of the authors and do not necessarily represent those of their affiliated organizations, or those of the publisher, the editors and the reviewers. Any product that may be evaluated in this article, or claim that may be made by its manufacturer, is not guaranteed or endorsed by the publisher.
References
Annestrand, S. A. (1972). Radio interference from HVDC converter stations. IEEE Trans. Power App. Syst. 91 (3), 874–882. doi:10.1109/tpas.1972.293420
Cai, P., Xiang, X., Peng, H., Mu, Q., and Wen, J. (2018). ADPSS-based electromechanical-electromagnetic hybrid simulation study of AC-DC grid with back-to-back MMC-HVDC system. Power Grid Technol. 42 (12), 3888–3894.
Caldecott, R., Liu, Y., Sebo, S. A., Kasten, D. G., and Wright, S. E. (1990). Measurement of the frequency-dependent impedance of major station equipment. IEEE Trans. Power Del. 5 (1), 474–480. doi:10.1109/61.107315
DeVore, R. V., Kimball, D. F., Kasten, D. G., and Caldecott, R. (1988). RF analysis of a 12-pulse HVDC convertor. IEE Proc. C. Gener. Transm. Distrib. 135 (3), 210–218. doi:10.1049/ip-c.1988.0027
Icnirp-2010 (2010). 《ICNIRP GUIDELINES FOR LIMITING EXPOSURE TO TIME-VARYING ELECTRIC AND MAGNETIC FIELDS (1 HZ -100 kHZ)》.
IEEE C95 (2002). 6 《IEEE standard for safety levels with respect to human exposure to electromagnetic fields, 0-3kHz》.
Sarma, M. P., and Gilsig, T. (1973). A method of calculating the RI from HVDC converter stations. IEEE Trans. Power App. Syst. 92 (3), 1009–1018. doi:10.1109/tpas.1973.293667
Keywords: back-to-back, converter station, electromagnetic environment, power frequency electric field, power frequency magnetic field, audible noise, radio interference
Citation: Yang Z, Li Q, Zhao P, Lin S, Zhao M, Ju Y, Gong Y and Wang C (2023) Measurement and analysis of the electromagnetic environment in 500 kV back-to-back converter stations. Front. Electron. 4:1249007. doi: 10.3389/felec.2023.1249007
Received: 28 June 2023; Accepted: 27 September 2023;
Published: 18 October 2023.
Edited by:
Yonglu Liu, Central South University, ChinaReviewed by:
Octavian Baltag, Grigore T. Popa University of Medicine and Pharmacy, RomaniaXin Li, Central South University, China
Copyright © 2023 Yang, Li, Zhao, Lin, Zhao, Ju, Gong and Wang. This is an open-access article distributed under the terms of the Creative Commons Attribution License (CC BY). The use, distribution or reproduction in other forums is permitted, provided the original author(s) and the copyright owner(s) are credited and that the original publication in this journal is cited, in accordance with accepted academic practice. No use, distribution or reproduction is permitted which does not comply with these terms.
*Correspondence: Zhichao Yang, yangzhichao@epri.sgcc.com.cn
†These authors have contributed equally to this work and share first authorship