 Delwar Hossain
 Tonmoy Ghosh
 Masudul Haider Imtiaz2
 Edward Sazonov
- 1Computer Laboratory of Ambient and Wearable System, Department of Electrical and Computer Engineering, The University of Alabama, Tuscaloosa, AL, United States
- 2Department of Electrical and Computer Engineering, Clarkson University, Potsdam, NY, United States
Introduction: This paper presents a novel Ear Canal Pressure Sensor (ECPS) for objective detection of food intake, chew counting, and food image capture in both controlled and free-living conditions. The contribution of this study is threefold: 1) Development and validation of a novel wearable sensor that uses changes in ear canal pressure and the device’s acceleration as an indicator of food intake, 2) A method to identify chewing segments and count the number of chews in each eating episode, and 3) Facilitation of egocentric image capture only during eating by triggering camera from sensor detection thus reducing power consumption, privacy concerns, as well as storage and computational cost.
Methods: To validate the device, data were collected from 10 volunteers in a controlled environment and three volunteers in a free-living environment. During the controlled activities, each participant wore the device for approximately 1 h, and during the free living for approximately 12 h. The food intake of the participants was not restricted in any way in both part of the experiment. Subject-independent Support Vector Machine classifiers were trained to identify periods of food intake from the features of both the pressure sensor and accelerometer, and features only from the pressure sensor.
Results: Results from leave-one-out cross-validation showed an average 5 sec-epoch classification F-score of 87.6% using only pressure sensor features and 88.6% using features from both pressure sensor and accelerometer in the controlled environment. For the free-living environment, both classifiers accurately detected all eating episodes. The wearable sensor achieves 95.5% accuracy in counting the number of chews with respect to manual annotation from the videos of the eating episodes using a pressure sensor classifier in the controlled environment.
Discussion: The manual review of the images found that only 3.7% of captured images belonged to the detected eating episodes, suggesting that sensor-triggered camera capture may facilitate reducing the number of captured images and power consumption of the sensor.
1 Introduction
The primary source of energy and nutrients necessary to maintain human life is food intake. Monitoring of daily food intake and ingestive behavior is an emerging research area that has direct implications on human health, as inadequate or excessive food intake may lead to the development of medical conditions such as malnutrition and underweight, or overweight and obesity, respectively (Hales et al., 2020). Monitoring ingestive behavior and understanding an individual’s diet is also key in the diagnosis and treatment of eating disorders such as anorexia, bulimia, and binge eating (Wilfley et al., 2000). To monitor food intake and identify the dietary restrictions that should be followed for a healthy life, technology-driven wearable food intake monitoring tools are gaining popularity.
Food intake monitoring tools can be divided into two major categories: a) traditional and b) automatic monitoring tools (Day et al., 2001). Traditional food intake monitoring tools include methods such as frequency questionnaires of food items (Schoeller et al., 1990), food recall of 24 h (Jonnalagadda et al., 2020), and food records (Day et al., 2001), which largely depend on the self-report of the individual. Though these traditional methods are simple and low cost, they can be tedious, as lots of input is required to fill, compliance rates are poor, and produce inaccurate data due to misreporting by the individual. With the advancement in technology, over the past decade, researchers are developing automatic food intake monitoring systems mainly using different physical sensors to alleviate the inaccuracy of self-reporting methods. Thus providing easy-to-use, reduction in the burden of the individual, more accurate, and real-time assessment. But up to this day, there is no commercially available automatic food intake monitoring device, which is a research field that remains for exploration (Bi et al., 2018), (Heydarian et al., 2019). The modern automatic approach to food intake monitoring can be divided into several categories, such as food intake detection, food type classification, food mass estimation, and others. Food intake detection can be considered the first and one of the important stages of the development of the ingestive monitoring device. Several sensor modalities have been explored using different physiological characteristics of eating, such as hand movement during eating, chewing sound, temporalis muscle contraction, head movement, and swallowing sound (Hossain et al., 2020a). Using the pattern of hand movement during eating several hand/wrist-worn wearable devices have been introduced including accelerometers, gyroscopes, and smartwatches (Dong et al., 2012; Dong et al., 2014a; Kalantarian and Sarrafzadeh, 2015). Food intake can also be detected using the chewing sound of solid and semi-solid food (Rahman et al., 2012; Jia et al., 2014; Päßler and Fischer, 2014). The temporalis muscle movement using eyeglasses during chewing was also explored to detect food intake (Fontana et al., 2014a), (Farooq and Sazonov, 2015). To monitor food intake using swallowing, sound researchers implemented microphones in the ear or surface electromyography on the throat (Sazonov et al., 2008; Makeyev et al., 2012; Fontana and Sazonov, 2013). A three-axis accelerometer is also being extensively used by researchers in food intake studies (Dong et al., 2014b), (Farooq and Sazonov, 2018a).
The eating behavior of an individual is characterized using meal microstructure such as chew count, chewing rate, bite-size, eating episode duration, etc. Studies of meal microstructure may provide new insights and findings in the treatment of obesity. In (Scisco et al., 2011), the authors claimed that a reduction in chewing rate results in the individual’s lower energy intake. Other studies have shown that there is a clear relationship between chewing rate and energy intake (Zandian et al., 2009; Lepley et al., 2010; Raynor et al., 2015; Jie et al., 2020). In (Jie et al., 2020), the authors suggested that to fight against obesity, interventions to improve chewing activity could be a necessary tool. In (Zandian et al., 2009), the authors claimed that eating rate feedback can be helpful to aid in intervention in eating disorder treatment. Health researchers are applying the number of chews and the rate of chewing as variables in their models for the estimation of ingested mass and energy intake. Counts of chews and swallows were used to develop the energy intake estimation model (Farooq and Sazonov, 2017). In (Amft et al., 2009) authors concluded that for solid food, recordings of chewing sounds can be used to predict bite weight. Several modalities of wearable sensors and physiological phenomena are being explored by researchers to detect and count the number of chews. Temporalis muscle movement during chewing using a strain sensor is being explored in (Fontana et al., 2014a), (Sazonov and Fontana, 2012), (Bedri et al., 2015). Chewing was also detected using chewing sound (Amft, 2010; Shuzo et al., 2010; Thomaz et al., 2015; Natarajan et al., 2016), EMG and force sensors (Kohyama et al., 2004; Bousdras et al., 2006; Fueki et al., 2008).
Chewing of solid and semi-solid food causes the ear canal to contract by the opening of the jaw. If the ear canal is closed, for example, by an earbud, the contraction will cause the ear canal pressure to change which can be used as an indicator of food intake. In this study, we use an Ear Canal Pressure Sensor (ECPS) to detect food intake in both controlled and free-living environments. This sensor can be implemented as a part of other devices, which use earbuds such as headphones, hearing aid, etc. The capability of recording the scenes in front of the wearer continuously and automatically by an egocentric wearable camera has also been explored for its potential implementation in objective eating behavior monitoring (Gemming et al., 2015; Beltran et al., 2016; Bruno et al., 2017; Vu et al., 2017). Development in the field of computer vision and image processing allowed these egocentric wearable cameras to introduce in food intake monitoring applications. Generally, the image-based monitoring method requires images of food intake episodes. These images can be supplied in two ways: 1. Using a smartphone by the individual called active capture, 2. Using a wearable camera that captures images continuously or at a predetermined interval is called passive capture. Most of the modern image-based methods deploy passive capture to make the process less burdensome and fully automatic. Different wearable egocentric camera systems such as SenseCam (Jia et al., 2019), AIM (Automatic Ingestion Monitor) (Fontana et al., 2014b), and the eButton (Sun et al., 2014) have been developed using passive capture mode, which results in a bulk amount of images when worn in free-living and a longer period. These studies demonstrated that the egocentric wearable camera may be used to study the eating environment and behavior. However, these devices continuously capture images throughout the day, potentially capturing unwanted pictures of the wearer and the people in front of the wearer, which can raise privacy and ethical concerns (Kelly et al., 2013). As most of the image-based methods of eating behavior monitoring rely on manual review or annotation, privacy becomes a concern when the images of the wearer are observed by another person (Doherty et al., 2013), (Safavi and Shukur, 2014). As another consideration, continuous capture of images throughout the day requires a larger battery which may affect the weight and comfort of the device. The food intake detection by an ECPS system may be exploited to trigger the camera to start capturing images and to stop at the end of the eating episode. Thus capturing and storing images that are only needed, provides more privacy to the individual, reducing power consumption, storage, and computational cost.
In this study we propose a novel wearable ECPS system that can be implemented in earbuds as part of other devices such as headphones to monitor food intake in the free-living environment. It accurately detects chewing segments and counts the number of chews in the eating episodes. This device can potentially be explored to control the egocentric camera to capture images only during food intake thus reducing power consumption, privacy concern, storage, and computational cost.
2 Materials and methods
2.1 Proposed ECPS (ear canal pressure sensor)
Figure 1A represents the working principle of the proposed ECP sensor. The ear canal is positioned between the Mandible Condyle (the upper tip of the mandible) and the Mastoid (the back part of the temporal bone) which extends into the Mastoid. Chewing is associated with the opening and closing of the mouth by moving the lower jaw, which causes the ear canal to expand as the Mandible Condyle slides forward and backward. The movement of the lower jaw creates a void that will be filled by the tissue surrounding the ear. This deformation of the ear canal associated with chewing during solid food intake produces a change in pressure which can be used to monitor ingestive behavior. The ear canal pressure changes during chewing were recorded by a pressure sensor through an air tube connected to an earbud. As a different person has a different size of the ear, an off-the-self-earbud may not feel comfortable for a long time use and can cause poor signal strength. Custom molded earbud for each participant was made using commercially available Sharkfin Self-Molding Earbud silicon rubber. Figure 1B represents the assembly of the proposed wearable sensor systems. Figure 1C shows the designed prototype of ECPS worn by an individual. It is important to note that the system can be manufactured in smaller sizes and more convenient but as the aim of this study was limited to the validation of ECPS for food intake monitoring, the system was developed considering time, effort, and cost.
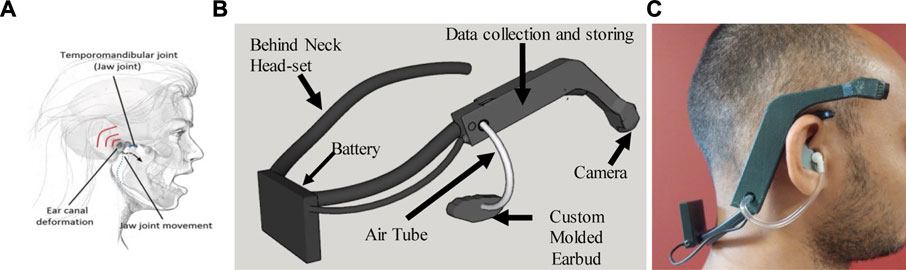
FIGURE 1. A portable wearable device for monitoring food intake. The module is affixed to the right side of a behind-neck headset. The data acquisition module also has an accelerometer and pressure sensor. (A) Represents the ear canal deformation during chewing (B) represents the wearable sensor system (C) the individual wearing the ECPS prototype.
The ECPS device used in this study consisted of a digital air pressure sensor (SM9541, from Silicon Microstructures), a low-power 3D accelerometer (ADXL332 from Analog Devices, Norwood, MA, USA), and a miniature wide-angle lens camera (OV5640, Omnivision Inc.). The sensors and the camera were interfaced with a Cortex-M4 ARM processor (STM32L476RG, ST Microelectronics, Geneva, Switzerland, 80 MHz CPU, 39 μA/MHz). The camera used its DVP interface to output a JPEG compressed image. An FPGA (Actel, Microsemi)-based framebuffer was employed to receive 8-bit image data from the camera, store in a 1 Mb external memory chip, and transfer to the MCU via a serial (SPI) interface. Data from the pressure sensor was sampled at 14-bit/128 Hz using the I2C interface. Accelerometer data were sampled at 16-bit/128 Hz via the SPI interface. The device was designed to capture food images in front of the wearer with a gaze-aligned wide-angle lens at a rate of one image per 10 s. The components along with communication and storage units of ECPS were installed on an 8.0 × 1.9 × 1.5 cm PCB covered by a plastic enclosure with a total weight of 15 g. The enclosed device was attached to the right side of a commercially available off-the-shelf behind-neck headset (Sony MDR-G45LP–Black). A commercially available acoustic air tube was used to convey the ear pressure onto the sensor. The enclosure of the ECPS has an opening to connect an air tube with the pressure sensor. The other side of the air tube goes into the custom-molded earbud to convey ear canal pressure.
For user comfort, the earbuds from the headset were removed. A Li-Ion cylindrical battery of 1000mAh capacity, 22 g weight, and 50 × 34 × 6 mm size were used in this system as the external power source. The device can record sensor data and images for around 20.5 h. The egocentric camera was used in this device to record images in front of the wearer. The manual review of the recorded images was used for validation of the developed food intake detection models. Also, the recorded images were analyzed to compute the percentage of images related to food intake in a daily setting. The captured images related to food intake can provide more information (food type, nutrition, portion size, etc.) which will be used in future work. Figure 2 represents the subsystems of the proposed ECPS.
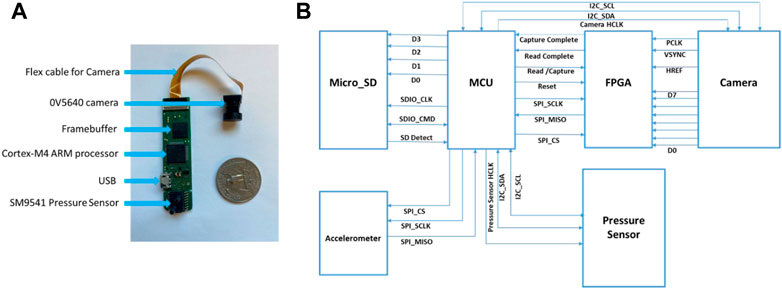
FIGURE 2. The electronics of ECPS. (A) ECPS subsystems: Pressure Sensor, USB, MCU, Framebuffer, Camera; (B) Overview of the system with subsystems interconnections.
2.2 Study protocol
The experiment was divided into two parts: 1. Laboratory controlled environment, and 2. Free-living environment. 1. Laboratory controlled environment: In this phase, the experiment was conducted in a controlled environment, such as a laboratory, where the conditions could be controlled and manipulated. During this phase, the data was collected and used to develop the classification models. 2. Free-living environment: In this phase, the experiment was conducted in a real-world setting, such as the participants’ natural habitat. This environment is typically more complex and less controlled than a laboratory environment. The data collected during this phase was used to test the classification models developed in the first phase to evaluate their performance in a more realistic scenario.
In the laboratory-controlled experiment, the participants were requested to come to the laboratory in the morning without having breakfast. Upon arrival, participants were given the wearable sensor system. The participants were then accompanied to get the meal from the school cafeteria. The food choice was not restricted in any way. After purchasing the meal participants were accompanied back to the laboratory to perform the activities listed in Table 1. The participant was encouraged to talk with research assistant while eating to simulate real life environment. The order of the activities was randomized among participants. There was no restriction on the time required to finish the meal. The duration of the controlled experiment for each participant was approximately 1 h. For the free-living experiment, participants were requested to come to the human participant laboratory in the morning without taking any meals. Upon arrival, the participants were provided the ECPS to wear and then instructed to continue day-to-day life throughout the day. The participants were instructed to perform daily activities with virtually no restriction except: during the activities that have a chance of contact of water with the device and during sleeping/taking naps. The duration of the free-living experiment for each participant was approximately 12 h.
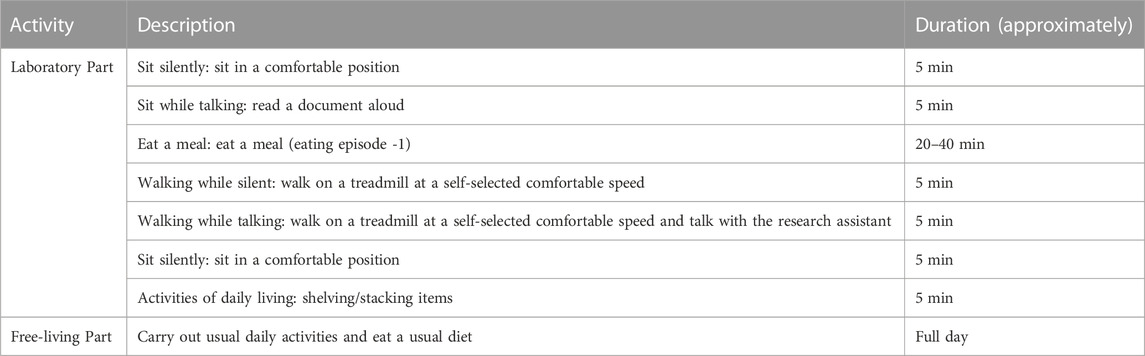
TABLE 1. Laboratory protocol.
2.3 Data collection and annotation
A total of 10 volunteers were recruited for the controlled environment experiment of this study (6 males and four females, average age 29.03 ± 12.20 years, range 19–41 years, average body mass index (BMI) 27.87 ± 5.51 kg/m2, range 20.5–41.7). For the free-living environment experiment of this study, data were collected from three volunteers (2 males and 1 female, average age 25.33 ± 3.05 years, range 22–28 years, average body mass index (BMI) 22.8 ± 1.4 kg/m2, range 20–24). The study was approved by The University of Alabama’s Institutional Review Board. Participants did not report any medical conditions which would impact their natural chewing or eating. During the controlled experiment, participants used a foot pedal to mark chewing sequences while consuming the food items to record the ground truth of chewing sequences (Doulah et al., 2021). To provide the chew count of the meal the eating episodes were video recorded using an SJCAM SJ4000 Action camera. The camera was positioned such that it records 1080p video at 30fps in profile view, to make the manual annotation of chew count from jaw movement accurate. More elaboration on the annotation of chew count can be found here (Hossain et al., 2020b). During free living, participants were asked to report major activities such as sleeping, sedentary, and physically active including eating episodes activity through aTimeLogger mobile application (Imtiaz et al., 2020).
2.4 Food intake detection
2.4.1 Sensor signal processing and feature extraction
The sensor data from both the accelerometer and pressure sensor were processed to develop a pattern recognition algorithm. To remove the DC component of the accelerometer signal, a high-pass filter with a cutoff frequency of 0.1 Hz was applied. The pressure sensor signal was filtered by applying a low-pass filter with a cut-off frequency of 3 Hz to remove unwanted signals as typical chewing is associated with a frequency in the range of 0.94–2.17 Hz (Po et al., 2011). Both sensor signals were z-normalized using the following equation to adjust inter-subject variability.
Where,
Next, the signals were divided into different non-overlapping fixed time segments called ‘epoch’ (1, 2 , 3 , 5 , 10 , 15 , and 30 s). Figure 3 shows the accelerometer signals, pressure sensor signals, and corresponding foot pedal signals (self-annotation) during eating episodes. The foot pedal signal is ‘pressed or 1’ during food intake and ‘released or 0’ during no food intake. To detect food intake, a set of 20 time and frequency domain features reported in our previous studies (Doulah et al., 2021), (Ghosh et al., 2020) was utilized in this work (Table 2). Because the spectrum of chewing frequencies is mostly contained in the range of 0.94–2.17 Hz, physical activity in the range of 2.5–10 Hz, and speech in the range of 10–300 Hz, band filters were applied to the signals to extract activity-specific features (Farooq and Sazonov, 2018b). For each of the three axes of the accelerometer, and pressure sensor signal, these 20 features were computed on different epoch lengths (1, 2, 3, 5, 10, 15, and 30 s). Aggregating all features from both the pressure sensor (20) and accelerometer (60), a total number of 80 features were obtained from each epoch of different lengths. The list of the feature set is given below.
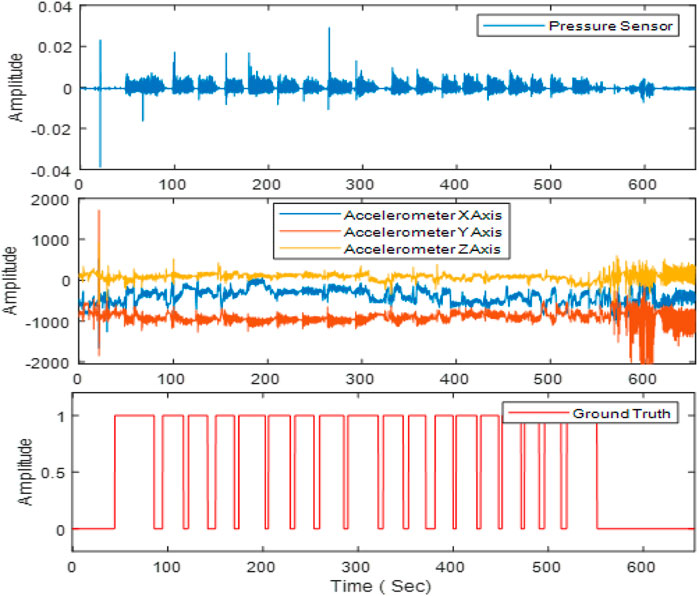
FIGURE 3. The first row demonstrates the pressure sensor signal. Signals from the 3-axes of the accelerometer are shown on the second row. The foot pedal signal marked by the participants is shown on the third row. Here “1” indicates food intake and ‘0’ indicates no food intake.
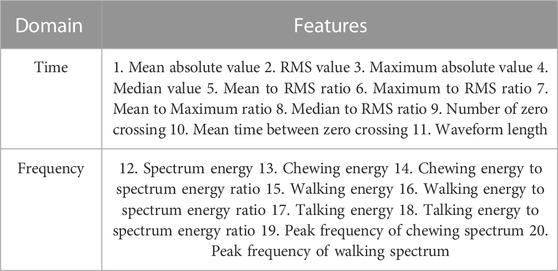
TABLE 2. Feature sets computed from both accelerometer sensor and pressure sensor epochs.
Time domain:
I) Mean absolute value: Absolute value of the signal in the epoch
II) RMS value: RMS (Root Mean Square) value of the signal in the epoch
III) Maximum absolute value: Maximum absolute value of the signal in the epoch
IV) Median value: Median of the absolute value of the signal in the epoch.
V) Mean to RMS ratio: The ratio between mean absolute value and RMS value of the signal in the epoch.
VI) Maximum to RMS ratio: The ratio between Maximum absolute value and RMS value of the signal in the epoch.
VII) Mean to Maximum ratio: The ratio between Mean absolute value and Maximum absolute value of the signal in the epoch.
VIII) Median to RMS ratio: The ratio between Median and RMS value of the signal in the epoch.
IX) Number of zero crossings: The number of zero-crossings in a signal is the number of times the signal crosses the horizontal axis (zero) during a given time period. We used circular shift to find the number of zero crossing. The circular shift operation shifts the elements of a vector cyclically by a specified number of positions. By multiplying the vector with a circularly shifted version of itself (i.e., the same vector shifted by one position), the zero-crossing points of the vector can be identified.
X) Mean time between zero crossings: Average time difference between the zero crossings in the epoch
XI) Waveform length: Waveform length is a feature used to describe the shape or morphology of a signal. It measures the total length of the waveform over a given time period, and is computed by summing the absolute differences between adjacent samples of the signal.
Frequency domain:
I) Spectrum energy: Spectrum energy is a feature used to describe the energy distribution of a signal across different frequency components. It measures the total amount of energy contained in the signal’s frequency spectrum and can be calculated using the formula
II) Chewing energy: Chewing energy is computed by first computing the frequency spectrum of the signal using Fast Fourier Transform (FFT) for the chewing frequency range (1.25–2.5 Hz). The chewing energy is then computed for this frequency range, which is the sum of the squared magnitudes of the frequency components within the range. This feature can be useful for detecting chewing activity in signals, as chewing typically produces a characteristic pattern of energy in the frequency domain.
III) Chewing energy to spectrum energy ratio: The ratio between the spectrum energy and chewing energy.
IV) Walking energy: Walking energy is computed by first computing the frequency spectrum of the signal using Fast Fourier Transform (FFT) for the walking frequency range (2.5–10 Hz). The walking energy is then computed for this frequency range, which is the sum of the squared magnitudes of the frequency components within the range.
V) Walking energy to spectrum energy ratio: The ratio between spectrum energy and walking energy
VI) Talking energy: Talking energy is computed by first computing the frequency spectrum of the signal using Fast Fourier Transform (FFT) for the talking frequency range (100–300 Hz). The talking energy is then computed for this frequency range, which is the sum of the squared magnitudes of the frequency components within the range.
VII) Talking energy to spectrum energy ratio: The ratio between spectrum energy and talking energy.
VIII) Peak frequency of chewing spectrum: Maximum frequency value of the chewing spectrum.
IX) Peak frequency of walking spectrum: Maximum frequency value of the walking spectrum.
2.4.2 Feature selection and classification
To classify each epoch as food intake and no food intake Linear Support Vector Machine (SVM) models were chosen due to their speed and generalization ability (Cortes and Vapnik, 1995). Two separate SVM models were trained using the controlled experiment data for comparison: 1.
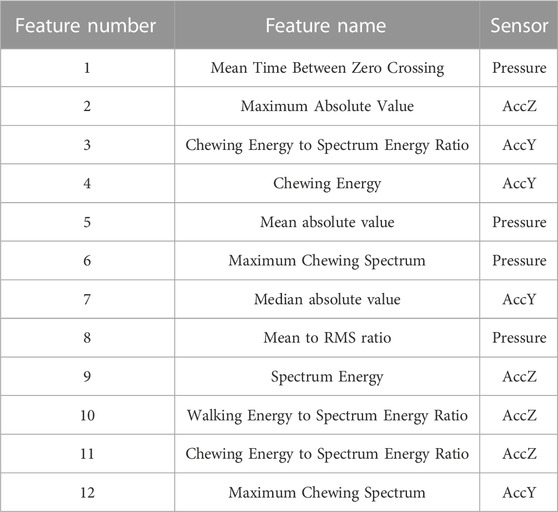
TABLE 3. Description of selected features for
The top-ranked eight features out of 20 were selected for the CLP. Training of the models was performed using the Classification Learner tool in MATLAB 2019b (from Mathworks Inc.). The foot pedal signals were used to assign labels to each epoch during training. If more than 50% of an epoch belonged to food intake, the epoch
where TP, FP, and FN denote true positives, false positives, and false negatives, respectively.
2.5 Chew Count estimation
The three stages in the proposed method are depicted in Figure 4. In the classification stage, if an epoch is classified as food intake it is labeled as 1, and 0 otherwise. Here the epoch has a fixed length such as 1, 3, 5 s, etc. But the chewing period of humans has a variable length. As chewing sequences are of various lengths of time, the use of fixed-length epochs may result in partial chewing or non-chewing at all. Therefore, to detect the boundaries of chewing segments of variable length, segmentation of the signal using short-time energy may be used. However, these high-energy segments can also be produced by physical activities such as talking, walking, etc.; therefore, the classification labels were used to differentiate chewing segments from other activities. The number of chews was calculated by detecting the pressure signal peaks in the chewing segments. In the segmentation stage, first, the pressure sensor signal was filtered by a low-pass filter with a cutoff of 3 Hz to remove unwanted noise. Second, the energy envelope of the signal was computed using a sliding window (Hanning) to identify the boundaries of the signal segments with high energy (potential chewing events). The Hanning window is a type of tapering function that smoothly transitions from zero at the beginning and end of the segment to one in the middle. This smooth transition reduces the amount of spectral leakage, which occurs when energy from the signal leaks into adjacent frequency bins in the frequency domain. The Hanning window also has relatively low side lobes, which helps to reduce the amount of energy that is spread out from the main spectral peak. As the chewing frequency is located in the frequency band of 0.94–2.17 Hz, to capture the energy of chewing a window size of 1 s with an overlap of 0.5 s was used to compute the short-time energy. The value of each window was then stored in a vector and a threshold value of short-time energy T) was dynamically calculated using the formula
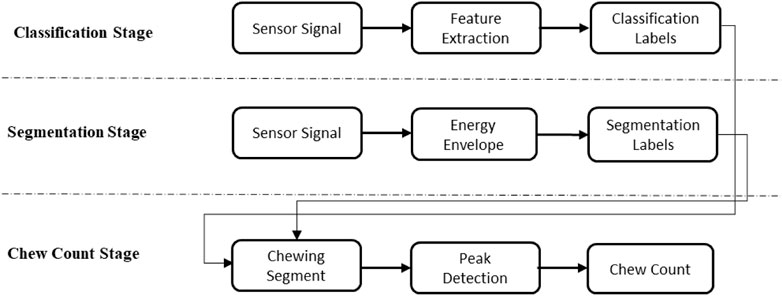
FIGURE 4. Three stages of the proposed algorithm to count the number of chews.
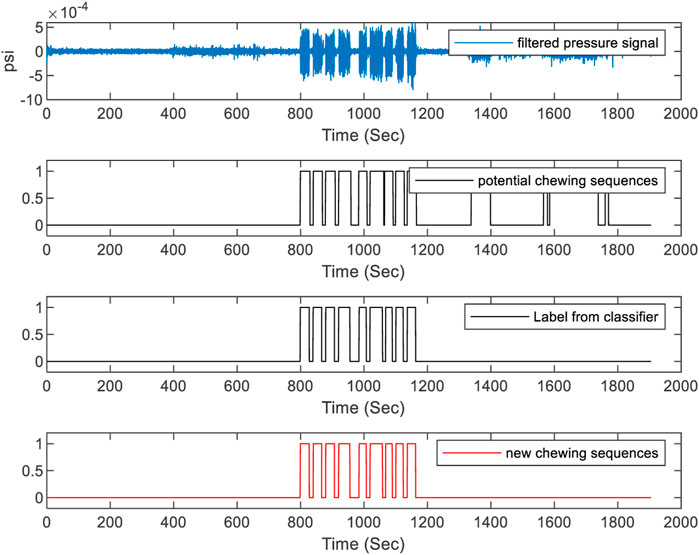
FIGURE 5. Chewing segment detection using classification labels and segmentation. The top figure represents the filtered pressure sensor signal. The second from the top figure represents the label from segmentation. The third from the top figure represents the label from food intake classification. The bottom figure represents the detected chewing sequence.
2.6 Meal detection
To detect meals from food intake detection in free-living, the predictions were kernel smoothed with a width of 50 s and applied a threshold value of 0.2. The value of the threshold was empirically selected from the controlled environment food intake detection results. The width and the threshold value of kernel smoothing were carefully selected as described above to detect meals and remove false positives but not to remove short eating episodes (approximately 1-min duration). Figure 6 represents the prediction of the classifier for a free-living dataset and finding the boundaries of the eating episodes using CLP+ACC.
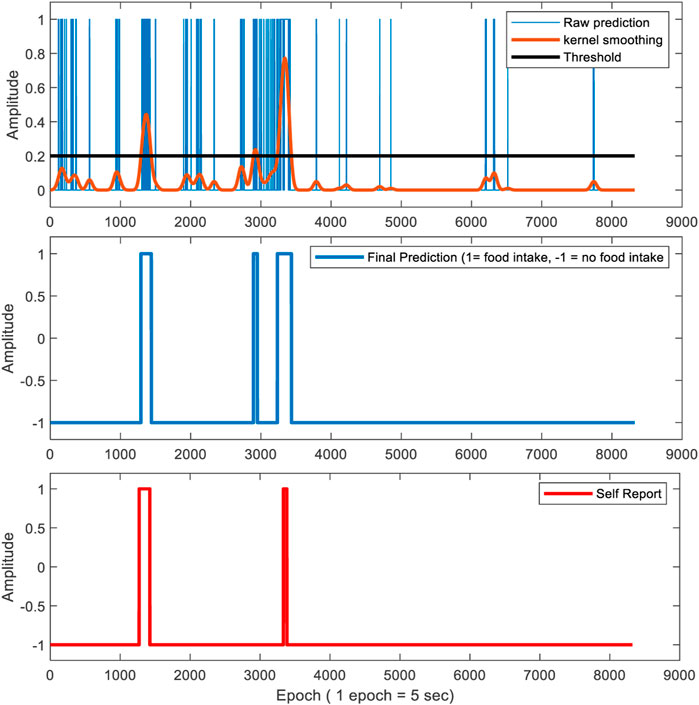
FIGURE 6. This figure represents food intake detection in free-living using both pressure sensor signal and accelerometer features for a 5-s epoch size. The top figure represents the raw prediction. The epoch is labeled as “1” if it is predicted as a food intake epoch. Otherwise, the epoch is labeled as “-1”. Kernel smoothing was performed to remove false positives by applying a fixed threshold. The middle and bottom figure represents the final prediction and self-reported start and ends-time of the eating episode respectively. The epoch value is set as 1 if the epoch is classified as food intake. Otherwise, the epoch value is set as -1.
2.7 Image capture
The long-term goal of the proposed ECPS system is to automatically, without any active intervention from the wearer, capture and store images only during eating. The sensor detection of food intake may facilitate the capacity of capturing and storing images only during food intake by triggering the camera. In this study for validation, the images were captured continuously every 10 throughout the day. The recorded images were reviewed manually to identify the true eating episodes including the start and end time of the meal in the free-living environment to match with the self-reported events. Subjects were allowed to review and delete any picture before being reviewed by a research assistant. When no images of food items were detected within a sensor-detected eating episode then it is counted as a false eating episode. The review of captured images also provides information about the number of images captured only during food intake and the number of images captured throughout the day. This information provides an idea of how much power, storage, and computational cost can be avoided by triggering the camera from the food intake detection.
3 Results
Results of the leave-one-out cross-validation procedure for the described two classifiers are shown in Tables 3–5. Table 4 represents the performance matrices of the trained CLP+ACC for the different epochs. For a 5-s epoch length, the CLP+ACC achieved a mean F1-score of 88.7%. Table 5 represents the performance matrices of the trained CLP for different epoch sizes. For an epoch size of 5 s, the classifier CLP achieved a mean F1-score of 87.6%. Table 6 represents the performance of the chew counting algorithm using CLP in controlled experiments. The chew counting algorithm achieved an accuracy of 95.5%. Table 7 indicates the food intake episodes detection by using both types of classifiers in the free-living environment. Table 8, represents the analysis of manual image review in the free-living experiment. Only 3.7% of the captured images are relevant to food intake episodes in the free-living environment.
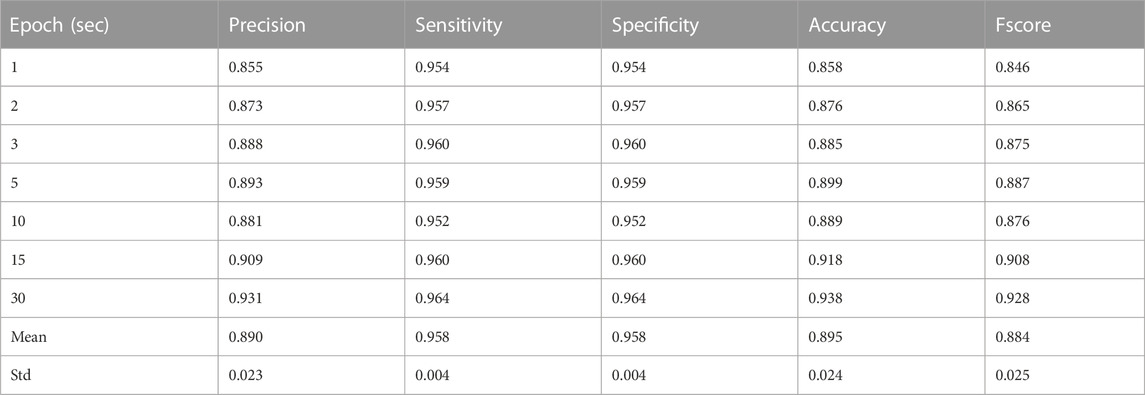
TABLE 4. Precision, Recall (Sensitivity), and F1-Score for different epochs of Laboratory Experiments by classifier CLP+ACC.
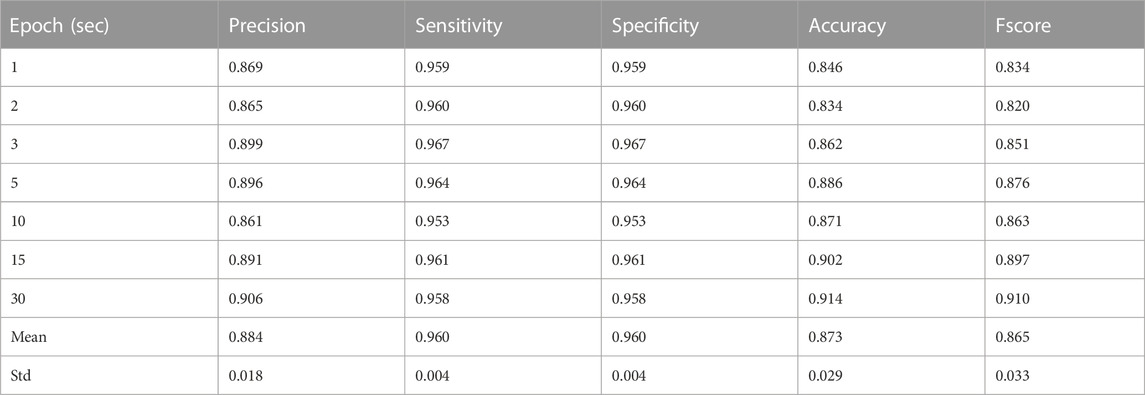
TABLE 5. Precision, Recall (Sensitivity), and F1-Score for different epochs of Laboratory Experiments by classifier CLP.
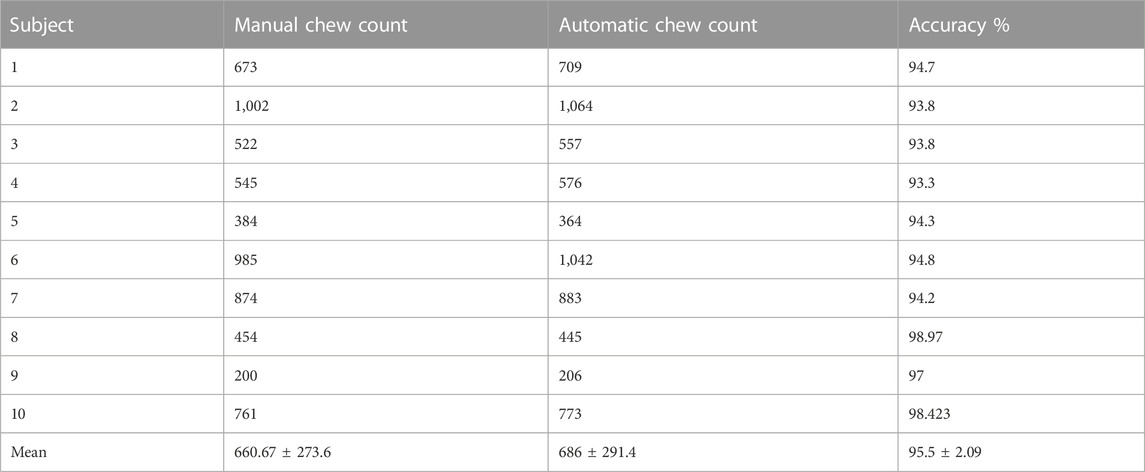
TABLE 6. Chew count of each subject using
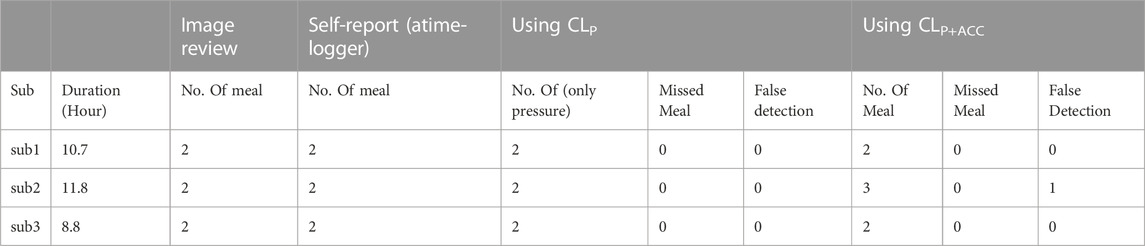
TABLE 7. Eating episode detection of free-living data by both classifiers.
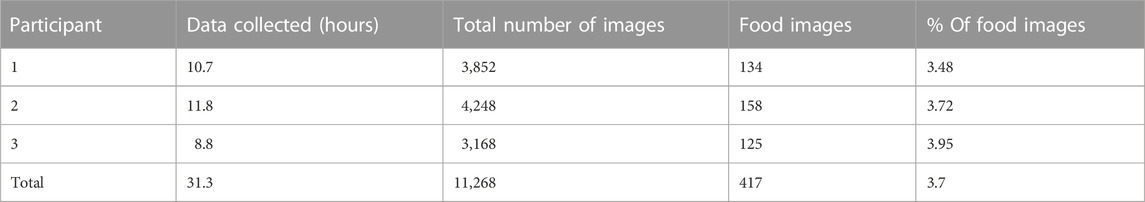
TABLE 8. Manual review of captured images (Free-Living).
4 Discussion
The necessity of the development of an accurate, easy-to-use, ingestive behavior monitoring device has remained an area of research to improve as the number of diseases caused by obesity, overweight, and eating disorders is increasing day by day. In this study, the developed ECPS food intake monitoring device was validated in both controlled and free-living environments. Features from both pressure sensor and accelerometer were collected and two separate classifier models were trained. Feature selection based on mutual information using mRMR was performed before training for both classifiers to reduce computation burden, redundancy, and overfitting. During training leave, one cross-validation approach was adopted which enables data from test participants to never be seen during training. The classifier CLP+ACC uses both pressure sensor and accelerometer features, achieving the largest F-score of 0.92 with a 30-s epoch size and the smallest F-score of 0.846 with a 1-s epoch size. As during free-living our primary goal is to record all eating episodes successfully, a 5-s epoch size was selected to use in free-living considering precision, sensitivity, and F-score. Table 7 represents the classifier CLP+ACC performance in free living. The classifier CLP trained with only pressure sensor achieve the highest F1-score of 0.91 with a 30-s epoch size and the lowest F1-score of 0.82 for a 2-s epoch size. A 5-s epoch size was selected to use in free-living considering precision, sensitivity, and F-score. The classifier CLP accurately detected all six eating episodes from three free-living days of data.
Using the food intake labels from the classifier and labels from the segmentation stage, chewing segments were detected and the number of chews was counted. Table 5 represents the performance of the chew counting algorithm using the classifier CLP with an epoch size of 5 s. The proposed chew counting algorithm achieved an accuracy of 95.5% using only the pressure sensor signal. Figure 7 represents the cumulative chew count for both the proposed automatic chew counting algorithm and manual annotation of one controlled environment meal.
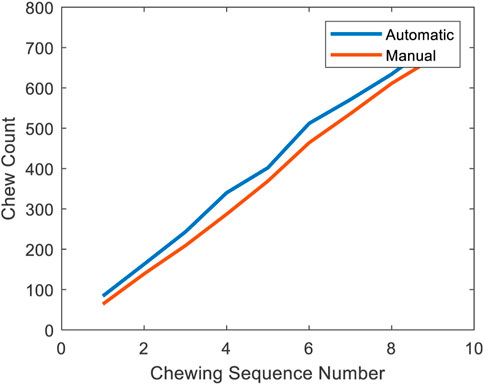
FIGURE 7. Cumulative chew count of a meal. The blue line indicates the result of the proposed chew counting algorithm and the red line represents the result of the manual annotation.
The manual image review of the captured images of free-living shows that a total of 11,268 images were captured during free-living: among them only 417 images were captured during food intake which is a mere 3.7%.
The designed ECPS system has some limitations such as both of the sensor signals depend on chewing which detects food intake only during solid and semi-solid food consumption. Also, if the camera captures images continuously, the wearer and the people surrounding the wearer become somewhat concerned about their privacy. There could be some sources of interferences such as speaking, facial movement, head movement, air tube movement, touching the earbud etc. To remove these interferences, the pressure sensor signal was filtered by applying a low-pass filter with a cut-off frequency of 3 Hz as typical chewing is associated with a frequency in the range of 0.94–2.17 Hz. Moreover, these interferences are random and have different characteristics than chewing. The design of the air tube minimizes motion artifacts by maintaining the circular cross-section of the tube under moderate tension, compression and bending of the tube due to head motion. The cross-section diameter of the acoustic tube (2 mm) nearly perfectly matched the cross-section of the pressure sensor (2 mm), that together with virtually zero flow in the tube allows to avoid pressure variations across the tube due to Bernoulli’s principle.
As the goal of this study was to develop a novel Ear Canal Pressure sensor and to validate the sensor system for objective detection of food intake, the study was limited to only 10 volunteers. Using the data, we were able to show that the noble Ear Canal Pressure Sensor can detect food intake events with high precision and count the number of chews in the meal with high accuracy. A relatively small number of participants is a limitation of this study; however, the sensor was validated in unrestricted free-living conditions, thus supporting the rigor of the proposed sensor. A study with larger sample size to further validate the device after further miniaturization of the sensor should be done in future.
LOSO-CV is a cross-validation technique that is particularly useful in human subjects research, where data is often correlated within individuals. It evaluates model performance on a test set that includes data from a single subject, while training on data from all other subjects. This allows for a more accurate estimate of model generalization performance and is more sensitive to individual differences in the data. However, LOSO-CV can be computationally expensive and performance estimates can have high variance. The choice of validation technique depends on the specific needs of the research question and the nature of the data.
In this study, all the processing was done offline in MATLAB 2019b (from Mathworks Inc.) installed on a Windows 10 computer equipped with an Intel Core i7 ninth Generation CPU with 16 GB DDR4 RAM, and an NVIDIA GeForce GTX 1070 GPU with 8 GB memory. The trained SVM classifier
As the goal of this study to validate the developed ECPS (Ear Canal Pressure Sensor) for food intake monitoring and chew counting, the food choice of was not restricted in any way. But in order to develop future models such as caloric energy estimation using regression, the food items including the consumed weight was recorded.
Future work should implement image-based detection and combine it with sensor-based food intake detection to provide more reliable and accurate ingestive behavior monitor including liquid consumption. Meal microstructure such as chewing rate, bite count, bite rate, etc. Should be calculated to perform an estimation of caloric consumption. The sensor detection may be useful in triggering the camera to capture images when food intake is detected by the sensor thus increasing the battery, storage, and computation capability.
The developed novel wearable sensor system can be implemented in other devices such as headphones and shows promising results in food intake detection in both controlled and wild environments. Further, the proposed wearable sensor system can be used to trigger the camera to start capturing images when food intake is detected and stop capturing after an eating episode. Thus providing a significantly less number of captured images which reduces: the sensor system power consumption, privacy concern of the wearer and surrounding people, storage cost, and computational cost.
5 Conclusion
In this paper, we propose a novel wearable sensor system that can be implemented in other devices with an earbud that detects all eating episodes using features from only the ear canal pressure sensor, and using both pressure sensor and accelerometer features. In Leave One Subject Out (LOSO) cross-validation experiments, an average of 88.4% F-score in food intake detection using both pressure sensor and accelerometer was achieved for 5 s epoch size in a controlled environment and detected all six eating episodes in free-living with only one false eating episode. The SVM classifier trained using features from only pressure sensors achieved an average of 86.5% F-score in a controlled environment and detected all six eating episodes in free-living. The proposed chew counting algorithm achieved an accuracy of 95.5% in a controlled environment using only a pressure sensor signal. A manual review of the continuously captured egocentric images showed that a mere 3.7% of the captured images were related to food intake. These results show that the proposed wearable sensor system can effectively detect food intake episodes and count the number of chews in both controlled and free-living conditions, which needs further exploration to be used as an ingestive monitoring tool and sensor-based triggered passive image capture tool.
Data availability statement
The raw data supporting the conclusion of this article will be made available by the authors, without undue reservation.
Ethics statement
The study was approved by The University of Alabama’s Institutional Review Board. The patients/participants provided their written informed consent to participate in this study.
Author contributions
Conceptualization, ES and DH; methodology, DH; software, MH; study administration, DH, TG; formal analysis, DH and TG; investigation, DH; resources, DH and TG; data curation, DH; writing—original draft preparation, DH; writing—review and editing, TG; visualization, DH; supervision, ES; project administration, ES. All authors contributed to the article and approved the submitted version.
Funding
This work was supported by the National Institute of Diabetes and Digestive and Kidney Diseases under Grant R01DK100796.
Conflict of interest
The authors declare that the research was conducted in the absence of any commercial or financial relationships that could be construed as a potential conflict of interest.
Publisher’s note
All claims expressed in this article are solely those of the authors and do not necessarily represent those of their affiliated organizations, or those of the publisher, the editors and the reviewers. Any product that may be evaluated in this article, or claim that may be made by its manufacturer, is not guaranteed or endorsed by the publisher.
References
Amft, O. “A wearable earpad sensor for chewing monitoring,” in Proceedings of the 2010 IEEE SENSORS, Waikoloa, HI, USA, November. 2010, 222–227. doi:10.1109/ICSENS.2010.5690449
Amft, O., Kusserow, M., and TrÖster, G. (2009). Bite weight prediction from acoustic recognition of chewing. IEEE Trans. Biomed. Eng. 56 (6), 1663–1672. doi:10.1109/TBME.2009.2015873
Bedri, A., Verlekar, A., Thomaz, E., Avva, V., and Starner, T. “Detecting mastication: A wearable approach,” in Proceedings of the 2015 ACM on International Conference on Multimodal Interaction, Seattle, Washington, USA, November. 2015, 247–250. doi:10.1145/2818346.2820767
Beltran, A., Dadabhoy, H., Chen, T. A., Lin, C., Jia, W., Baranowski, J., et al. (2016). Adapting the eButton to the abilities of children for diet assessment. Proc. Meas. Behav. 2016, 72–81.
Bi, S., Wang, T., Tobias, N., Nordrum, J., Wang, S., Halvorsen, G., et al. (2018). Auracle: Detecting eating episodes with an ear-mounted sensor. Assoc. Comput. Mach. 2, 1–27. doi:10.1145/3264902
Bousdras, V. A., Cunningham, J., Ferguson-Pell, M., Bamber, M., Sindet-Pedersen, S., Blunn, G., et al. (2006). A novel approach to bite force measurements in a porcine model in vivo. Int. J. Oral Maxillofac. Surg. 35 (7), 663–667. doi:10.1016/j.ijom.2006.01.023
Bruno, V., Resende, S., and Juan, C. (2017). A survey on automated food monitoring and dietary management systems. J. Health Med. Inf. 8 (3), 272. doi:10.4172/2157-7420.1000272
Cortes, C., and Vapnik, V. (1995). Support-vector networks. Mach. Learn 20 (3), 273–297. doi:10.1007/BF00994018
Day, N. E., McKeown, N., Wong, M. Y., Welch, A., and Bingham, S. (2001). Epidemiological assessment of diet: A comparison of a 7-day diary with a food frequency questionnaire using urinary markers of nitrogen, potassium and sodium. Int. J. Epidemiol. 30 (2), 309–317. doi:10.1093/ije/30.2.309
Doherty, A. R., Hodges, S. E., King, A. C., Smeaton, A. F., Berry, E., Moulin, C. J., et al. (2013). Wearable cameras in health: The state of the art and future possibilities. Am. J. Prev. Med. 44 (3), 320–323. doi:10.1016/j.amepre.2012.11.008
Dong, Y., Hoover, A., Scisco, J., and Muth, E. (2012). A new method for measuring meal intake in humans via automated wrist motion tracking. Appl. Psychophysiol. Biofeedback 37 (3), 205–215. doi:10.1007/s10484-012-9194-1
Dong, Y., Scisco, J., Wilson, M., Muth, E., and Hoover, A. (2014a). Detecting periods of eating during free-living by tracking wrist motion. IEEE J. Biomed. Health Inf. 18 (4), 1253–1260. doi:10.1109/JBHI.2013.2282471
Dong, Y., Scisco, J., Wilson, M., Muth, E., and Hoover, A. (2014b). Detecting periods of eating during free-living by tracking wrist motion. IEEE J. Biomed. Health Inf. 18 (4), 1253–1260. doi:10.1109/JBHI.2013.2282471
Doulah, A., Ghosh, T., Hossain, D., Imtiaz, M. H., and Sazonov, E. (2021). ‘Automatic ingestion monitor version 2’ – a novel wearable device for automatic food intake detection and passive capture of food images. IEEE J. Biomed. Health Inf. 25 (2), 568–576. doi:10.1109/JBHI.2020.2995473
Farooq, M., and Sazonov, E. (2017). Segmentation and characterization of chewing bouts by monitoring temporalis muscle using smart glasses with piezoelectric sensor. IEEE J. Biomed. Health Inf. 21 (6), 1495–1503. doi:10.1109/JBHI.2016.2640142
Farooq, M., and Sazonov, E. (2018a). Accelerometer-based detection of food intake in free-living individuals. IEEE Sensors J. 18 (9), 3752–3758. doi:10.1109/JSEN.2018.2813996
Farooq, M., and Sazonov, E. (2018b). Accelerometer-based detection of food intake in free-living individuals. IEEE Sensors J. 18 (9), 3752–3758. doi:10.1109/JSEN.2018.2813996
Farooq, M., and Sazonov, E. “Comparative testing of piezoelectric and printed strain sensors in characterization of chewing,” in Proceedings of the 2015 37th Annual International Conference of the IEEE Engineering in Medicine and Biology Society (EMBC), Milan, Italy, August. 2015, 7538–7541. doi:10.1109/EMBC.2015.7320136
Fontana, J. M., Farooq, M., and Sazonov, E. (2014a). Automatic ingestion monitor: A novel wearable device for monitoring of ingestive behavior. IEEE Trans. Biomed. Eng. 61 (6), 1772–1779. doi:10.1109/TBME.2014.2306773
Fontana, J. M., Farooq, M., and Sazonov, E. (2014b). Automatic ingestion monitor: A novel wearable device for monitoring of ingestive behavior. IEEE Trans. Biomed. Eng. 61 (6), 1772–1779. doi:10.1109/TBME.2014.2306773
Fontana, J. M., and Sazonov, E. S. (2013). Evaluation of chewing and swallowing sensors for monitoring ingestive behavior. https://www.ingentaconnect.com/content/asp/senlet/2013/00000011/00000003/art00019 (accessed Apr. 14, 2020).
Fueki, K., Sugiura, T., Yoshida, E., and Igarashi, Y. (2008). Association between food mixing ability and electromyographic activity of jaw-closing muscles during chewing of a wax cube. J. Oral Rehabilitation 35 (5), 345–352. doi:10.1111/j.1365-2842.2008.01849.x
Gemming, L., Rush, E., Maddison, R., Doherty, A., Gant, N., Utter, J., et al. (2015). Wearable cameras can reduce dietary under-reporting: Doubly labelled water validation of a camera-assisted 24 h recall. Br. J. Nutr. 113 (2), 284–291. doi:10.1017/S0007114514003602
Ghosh, T., Hossain, D., Imtiaz, M., McCrory, M. A., and Sazonov, E. “Implementing real-time food intake detection in a wearable system using accelerometer,” in Proceedings of the 2020 IEEE-EMBS Conference on Biomedical Engineering and Sciences (IECBES), Langkawi Island, Malaysia, March. 2021, 439–443. doi:10.1109/IECBES48179.2021.9398760
Hales, C. M., Carroll, M. D., Fryar, C. D., and Ogden, C. L. (2020). Prevalence of obesity and severe obesity among adults: United States, 2017–2018. NCHS Data Brief. 360, 1–8. doi:10.1001/jama.2020.14590
Heydarian, H., Adam, M., Burrows, T., Collins, C., and Rollo, M. E. (2019). Assessing eating behaviour using upper limb mounted motion sensors: A systematic review. Nutrients 11 (5), 1168. doi:10.3390/nu11051168
Hossain, D., Ghosh, T., and Sazonov, E. (2020b). Automatic count of bites and chews from videos of eating episodes. IEEE Access 8, 101934–101945. doi:10.1109/ACCESS.2020.2998716
Hossain, D., Imtiaz, M. H., and Sazonov, E. (2020a). Comparison of wearable sensors for estimation of chewing strength. IEEE Sensors J. 20 (10), 5379–5388. doi:10.1109/JSEN.2020.2968009
Imtiaz, M. H., Hossain, D., Senyurek, V. Y., Belsare, P., Tiffany, S., and Sazonov, E. (2020). Wearable egocentric camera as a monitoring tool of free-living cigarette smoking: A feasibility study. Nicotine Tob. Res. 22 (10), 1883–1890. doi:10.1093/ntr/ntz208
Jia, W., Chen, H. C., Yue, Y., Li, Z., Fernstrom, J., Bai, Y., et al. (2014). Accuracy of food portion size estimation from digital pictures acquired by a chest-worn camera. Public Health Nutr. 17 (8), 1671–1681. doi:10.1017/S1368980013003236
Jia, W., Li, Y., Qu, R., Baranowski, T., Burke, L. E., Zhang, H., et al. (2019). Automatic food detection in egocentric images using artificial intelligence technology. Public Health Nutr. 22 (7), 1–12. doi:10.1017/S1368980018000538
Jie, Li, Na, Zhang, Lizhen, Hu, Ze, Li, Rui, Li, Cong, Li, et al. (2020). Improvement in chewing activity reduces energy intake in one meal and modulates plasma gut hormone concentrations in obese and lean young Chinese men. Am. J. Clin. Nutr. 94, 709–716. doi:10.3945/ajcn.111.015164
Jonnalagadda, S. S., Mitchell, D. C., Smiciklas-Wright, H., Meaker, K. B., Heel, N. V., Karmally, W., et al. (2020). Accuracy of energy intake data estimated by a multiplepass, 24-hour dietary recall technique. J. Am. Diet. Assoc. 100, 303–311. doi:10.1016/s0002-8223(00)00095-x
Kalantarian, H., and Sarrafzadeh, M. (2015). Audio-based detection and evaluation of eating behavior using the smartwatch platform. Comput. Biol. Med. 65, 1–9. doi:10.1016/j.compbiomed.2015.07.013
Kelly, P., Marshall, S. J., Badland, H., Kerr, J., Oliver, M., Doherty, A. R., et al. (2013). An ethical framework for automated, wearable cameras in health behavior research. Am. J. Prev. Med. 44 (3), 314–319. doi:10.1016/j.amepre.2012.11.006
Kohyama, K., Hatakeyama, E., Sasaki, T., Azuma, T., and Karita, K. (2004). Effect of sample thickness on bite force studied with a multiple-point sheet sensor. J. Oral Rehabilitation 31 (4), 327–334. doi:10.1046/j.1365-2842.2003.01248.x
Lepley, C., Throckmorton, G., Parker, S., and Buschang, P. H. (2010). Masticatory performance and chewing cycle kinematics—are they related? Angle Orthod. 80 (2), 295–301. doi:10.2319/061109-333.1
Makeyev, O., Lopez-Meyer, P., Schuckers, S., Besio, W., and Sazonov, E. (2012). Automatic food intake detection based on swallowing sounds. Biomed. Signal Process. Control 7 (6), 649–656. doi:10.1016/j.bspc.2012.03.005
Natarajan, A., Angarita, G., Gaiser, E., Malison, R., Ganesan, D., and Marlin, B. M. “Domain adaptation methods for improving lab-to-field generalization of cocaine detection using wearable ECG,” in Proceedings of the 2016 ACM International Joint Conference on Pervasive and Ubiquitous Computing, Heidelberg, Germany, September. 2016, 875–885. doi:10.1145/2971648.2971666
Päßler, S., and Fischer, W.-J. (2014). Food intake monitoring: Automated chew event detection in chewing sounds. IEEE J. Biomed. Health Inf. 18 (1), 278–289. doi:10.1109/JBHI.2013.2268663
Peng, H., Long, F., and Ding, C. (2005). Feature selection based on mutual information criteria of max-dependency, max-relevance, and min-redundancy. IEEE Trans. Pattern Analysis Mach. Intell. 27 (8), 1226–1238. doi:10.1109/TPAMI.2005.159
Po, J. M. C., Kieser, J. A., Gallo, L. M., Tésenyi, A. J., Herbison, P., and Farella, M. (2011). Time-frequency analysis of chewing activity in the natural environment. J. Dent. Res. 90 (10), 1206–1210. doi:10.1177/0022034511416669
Rahman, M. H., “Food volume estimation in a mobile phone based dietary assessment system,” in Proceedings of the 2012 Eighth International Conference on Signal Image Technology and Internet Based Systems, Sorrento, Italy, November. 2012, 988–995. doi:10.1109/SITIS.2012.146
Raynor, H. A., Anderson, A. M., Miller, G. D., Reeves, R., Delahanty, L. M., Vitolins, M. Z., et al. (2015). Partial meal replacement plan and quality of the diet at 1 Year: Action for health in Diabetes (look AHEAD) trial. J. Acad. Nutr. Dietetics 115 (5), 731–742. doi:10.1016/j.jand.2014.11.003
Safavi, S., and Shukur, Z. (2014). Conceptual privacy framework for health information on wearable device. PLoS ONE 9 (12), e114306. doi:10.1371/journal.pone.0114306
Sazonov, E., Schuckers, S., Lopez-Meyer, P., Makeyev, O., Sazonova, N., Melanson, E. L., et al. (2008). Non-invasive monitoring of chewing and swallowing for objective quantification of ingestive behavior. Physiol. Meas. 29 (5), 525–541. doi:10.1088/0967-3334/29/5/001
Sazonov, E. S., and Fontana, J. M. (2012). A sensor system for automatic detection of food intake through non-invasive monitoring of chewing. IEEE Sensors J. 12 (5), 1340–1348. doi:10.1109/JSEN.2011.2172411
Schoeller, D. A., Bandini, L. G., and Dietz, W. H. (1990). Inaccuracies in self-reported intake identified by comparison with the doubly labelled water method. J. Physiol. Pharmacol. 68 (7), 941–949. doi:10.1139/y90-143
Scisco, J. L., Muth, E. R., Dong, Y., and Hoover, A. W. (2011). Slowing bite-rate reduces energy intake: An application of the bite counter device. J. Am. Dietetic Assoc. 111 (8), 1231–1235. doi:10.1016/j.jada.2011.05.005
Shuzo, M., Komori, S., Takashima, T., Lopez, G., Tatsuta, S., Yanagimoto, S., et al. (2010). Wearable eating habit sensing system using internal body sound. J. Adv. Mech. Des. Syst. Manuf. 4 (1), 158–166. doi:10.1299/jamdsm.4.158
Sun, M., “eButton: A wearable computer for health monitoring and personal assistance,” in Proceedings of the 51st Annual Design Automation Conference, San Francisco, CA, USA, June. 2014, 1–6. doi:10.1145/2593069.2596678
Thomaz, E., Zhang, C., Essa, I., and Abowd, G. D. “Inferring meal eating activities in real world settings from ambient sounds: A feasibility study,” in Proceedings of the 20th International Conference on Intelligent User Interfaces, Atlanta, Georgia, USA, March 2015, 427–431. doi:10.1145/2678025.2701405
Vu, T., Lin, F., Alshurafa, N., and Xu, W. (2017). Wearable food intake monitoring technologies: A comprehensive review. Computers 6 (1), 4. doi:10.3390/computers6010004
Wilfley, D. E., Schwartz, M. B., Spurrell, E. B., and Fairburn, C. G. (2000). Using the eating disorder examination to identify the specific psychopathology of binge eating disorder. Int. J. Eat. Disord. 27 (3), 259–269. doi:10.1002/(SICI)1098-108X(200004)27:3<259::AID-EAT2>3.0.CO;2-G
Keywords: wearable sensor, food intake detection, pressure sensor, chew count, free-living
Citation: Hossain D, Ghosh T, Haider Imtiaz M and Sazonov E (2023) Ear canal pressure sensor for food intake detection. Front. Electron. 4:1173607. doi: 10.3389/felec.2023.1173607
Received: 24 February 2023; Accepted: 03 July 2023;
Published: 18 July 2023.
Edited by:
Shideh Kabiri Ameri, Queen’s University, CanadaReviewed by:
Saqib Subhan, MRGT Training and Services, PakistanFangqi Liu, University College London, United Kingdom
Copyright © 2023 Hossain, Ghosh, Haider Imtiaz and Sazonov. This is an open-access article distributed under the terms of the Creative Commons Attribution License (CC BY). The use, distribution or reproduction in other forums is permitted, provided the original author(s) and the copyright owner(s) are credited and that the original publication in this journal is cited, in accordance with accepted academic practice. No use, distribution or reproduction is permitted which does not comply with these terms.
*Correspondence: Edward Sazonov, ZXNhem9ub3ZAZW5nLnVhLmVkdQ==