 Muhammad Abdul Kadir
 Adrian J. Wilson2,3
 K. Siddique-e Rabbani
94% of researchers rate our articles as excellent or good
Learn more about the work of our research integrity team to safeguard the quality of each article we publish.
Find out more
ORIGINAL RESEARCH article
Front. Electron. , 10 December 2021
Sec. Bioelectronics
Volume 2 - 2021 | https://doi.org/10.3389/felec.2021.791016
This article is part of the Research Topic Bioinstrumentation for Electrical Impedance Spectroscopy Measuring Systems View all 4 articles
Monitoring of anatomical structures and physiological processes by electrical impedance has attracted scientists as it is noninvasive, nonionizing and the instrumentation is relatively simple. Focused Impedance Method (FIM) is attractive in this context, as it has enhanced sensitivity at the central region directly beneath the electrode configuration minimizing contribution from neighboring regions. FIM essentially adds or averages two concentric and orthogonal combinations of conventional Tetrapolar Impedance Measurements (TPIM) and has three versions with 4, 6, and 8 electrodes. This paper describes the design and testing of a multi-frequency FIM (MFFIM) system capable of measuring all three versions of FIM at 8 frequencies in the range 10 kHz—1 MHz. A microcontroller based multi-frequency signal generator and a balanced Howland current source with high output impedance (476 kΩ at 10 kHz and 58.3 kΩ at 1 MHz) were implemented for driving currents into biological tissues with an error <1%. The measurements were carried out at each frequency sequentially. The peak values of the amplified voltage signals were measured using a novel analogue synchronous peak detection technique from which the transfer impedances were obtained. The developed system was tested using TPIM measurements on a passive RC Cole network placed between two RC networks, the latter representing skin-electrode contact impedances. Overall accuracy of the measurement was very good (error <4% at all frequencies except 1 MHz, with error 6%) and the resolution was 0.1 Ω. The designed MFFIM system had a sampling rate of >45 frames per second which was deemed adequate for noninvasive real-time impedance measurements on biological tissues.
Bioimpedance is an emerging technique for monitoring anatomical structures and physiological processes. Recent studies demonstrated the use of bioimpedance techniques in different applications including cancer detection (Cheng et al., 2020; Mansouri et al., 2020; Tidy and Brown, 2021), tissue hydration (Lukaski et al., 2019), body composition (Vermeiren et al., 2021), vascular fluid flow (Anand et al., 2021) and bedside monitoring (Mulasi et al., 2015; Morais et al., 2021).
Conventional electrical impedance measurements use a bipolar configuration in which potential developed across two terminals in a network are measured for a specified driven current. This scheme is not suitable for bioimpedance measurements since tissue-electrode contact impedances are included in the measurement. Most bioimpedance measurement schemes use a Tetrapolar Impedance measurement (TPIM) technique where separate pairs of electrodes are used for current drive and potential measurement. The ratio of the measured voltage to the current is known as the transfer impedance and is a property of the bulk without any significant contribution from tissue-electrode contact impedances (Brown et al., 2000a; Martinsen and Grimnes, 2009). Typically, a voltage controlled current source having a very high output impedance is used so that tissue-electrode contact impedances in the current drive loop do not alter the current significantly. On the other hand, tissue-electrode contacts that are on the path of the potential measurement circuit loop do not drop any significant voltage since the input impedance of the voltage measurement circuit is very high, resulting in negligible current through this loop. Thus, TPIM essentially eliminates the tissue-electrode impedances and is also the basis of more sophisticated measurement techniques including the Focused Impedance Method (FIM), instrumentation for which is the subject of this paper, and electrical impedance tomography (EIT). The coinage of the term “transfer impedance” makes it distinct from “impedance” that is obtained in a bipolar measurement. However, use of ‘impedance’ in the bioimpedance literature essentially should be taken to mean “Transfer Impedance.” The above also implies that contact resistances of any switching circuitry at the electrodes will not affect the transfer impedance measurement.
The extent to which a change in resistivity of a point within a homogeneous volume conductor contributes to the change in measured transfer impedance is defined as the sensitivity (Geselowitz, 1971; Grimnes and Martinsen, 2008). The sensitivity distribution of the tetra-polar configuration extends to a large distance within the volume conductor and may not be suitable for identifying localized changes in impedivity (Brown et al., 2000a). Electrical Impedance Tomography (EIT, initially termed Applied Potential Tomography–APT) generates cross sectional images of the impedance distribution within the body using a number of electrodes, typically 8, 16, or 32, fixed circumferentially around the body and can localize changes in impedivity (Barber et al., 1984; Brown, 2003; Adler and Boyle, 2017) on the electrode plane. Reconstructing 2D EIT images is challenging although solutions have been developed (Holder, 2004) and EIT systems utilising these developments are now commercially available, primarily for respiratory imaging. However, since current flows in 3D, there is significant contribution to the image from points in the 3rd dimension (Rabbani and Kabir, 1991; Rabbani et al., 1996). Thus, the individual pixel values of the reconstructed image do not give an accurate value of the impedivity at that point in the medium. Several groups have undertaken efforts to obtain 3D EIT images having more of the above set of electrodes in several planes along the length of the cylinder (Ye et al., 2008; Hao et al., 2017; Zhang et al., 2019). However, reconstructing 3D EIT images is far more challenging than that for 2D images, and it will be quite some time before practically usable 3D EIT systems are developed for routine use. The limitations of EIT together with the complexity of the technology clearly identifies the need for a simpler method that can identify and localize impedivity changes. For localized impedance information in a volume conductor, a new measurement technique termed Focused Impedance Method (FIM) has been developed (Rabbani et al., 1999; Rabbani and Karal, 2008). FIM essentially consists of two concentric and orthogonal TPIM arrangements with the two transfer impedance measurements added or averaged. FIM has enhanced sensitivity in the central region of the electrode configuration with minimum contribution from neighboring regions in comparison to TPIM (Islam et al., 2010; Pettersen et al., 2014, Rabbani, 2018). Due to 3D sensitivity in a volume conductor, FIM may probe body organs at shallow depths using surface electrodes. There are three electrode configurations for FIM: 1) 8-electrode FIM (FIM-8), 2) 6-electrode FIM (FIM-6), and 3) 4-electrode FIM (FIM-4) (Rabbani et al., 1999; Rabbani and Karal, 2008). Figure 1 represents the placement of electrodes on the surface of a volume conductor with the corresponding drive receive electrode pairs for the three different FIM configurations. FIM has been useful in the study of gastric emptying (Rabbani et al., 1999), lung ventilation (Kadir et al., 2015) and abdominal fat thickness (Surovy et al., 2012). Finite element simulation and some phantom studies demonstrated the utility of FIM in the investigation of both epithelial (Kadir and Rabbani, 2018) and deep tissues (Roy et al., 2019). However, it should be noted that unlike impedance imaging, the electrode array needs to be manually repositioned to localize impedivity changes.
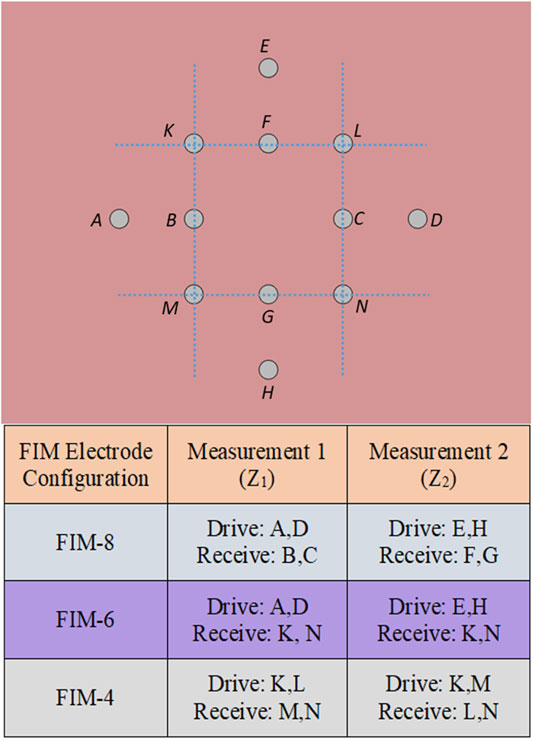
FIGURE 1. Placement of electrodes for three different FIM configuration. The letters A–K represents the positions of electrodes.
Childhood lung diseases like pneumonia and tuberculosis are common in developing countries (Izadnegahdar et al., 2013; Jenkins, 2016). Being a non-invasive and low cost technique, there is a potential of using multi-frequency FIM (MFFIM) in the study of these diseases. There is also a potential for using multi-frequency FIM for biological tissue characterization. However, a multi-frequency FIM system for bioimpedance measurements on human body has not been implemented and in this study, it is considered for the first time. Commercial devices are available for both TPIM and EIT but none for FIM measurements at present. Devices meant for TPIM (Bioscan-II; Sciospec) can be used for FIM measurements by manually changing the drive and receive electrode pairs, but this does not form a practical measurement technique; the whole measurement needs to be automated, giving the possibility of real-time measurement of dynamic processes. Considering the socio-economic status of low resource countries low cost, portable and reliable systems are required that can be maintained and repaired by local technicians. However, the limited availability of even quite basic electronic components in such environments is a challenge. The aim of this work was to develop a multi-frequency FIM system using widely available electronic components. This paper describes the design and development of a multi-frequency FIM system capable of measuring bioimpedance using all the three electrode configurations shown in Figure 1 over a range of frequencies using microcontrollers and a PC, under software control, which also allows instant data recording and storage.
FIM measurements are essentially based on Tetrapolar Impedance Measurements (TPIM), with the electrode configurations selected electronically. There are three major parts in an FIM device: current drive circuitry, voltage measurement circuitry and appropriate electrode switching as shown in Figure 1. A microcontroller based balanced current source was constructed for driving alternating current into biological tissues. The measured voltage gives the impedance and a change in impedance appears as a change of the voltage amplitude, which needs to be measured in real time. This was performed using analogue synchronous peak detection and its implementation for a multi-frequency device is explained. Design aspects of the switching circuitry together with necessary algorithms for measurement of all three versions of FIM (FIM-8, FIM-6, and FIM-4) are described. The performance of the implemented MFFIM device is measured using passive component phantoms. Much of the basic instrumentation required for current injection and voltage measurement is standard and well described previously (e.g. Holder, 2004). We include our designs for these for completeness and to describe the impact restricted component selection criteria had on implementing an FIM measurement system.
The frequencies and current used for impedance measurements must not cause changes to the tissue. For this reason, dc currents which can cause burns and electrolysis (Leeming et al., 1970; Dechent et al., 2020) are not used. Similarly, the current threshold for nerve stimulation is lowest for low frequency currents (0.1–500 Hz), rising rapidly as the frequency increases above 1 kHz. At frequencies above 1 MHz, stray capacitance becomes a significant problem, becoming very significant for instrumentation at GHz frequencies (Bolton et al., 1998; McEwan et al., 2007). Fortunately, the impedance of body tissues has significant dependence on the intermediate (kHz–MHz) range of frequencies that provide the opportunity to devise reasonably simple instrumentation. For example, the impedivity of inflated lung increases by 46 and 38% compared to that for a deflated lung for frequencies of 10 kHz and 1 MHz, respectively, (Gabriel et al., 1996). The variation of impedance over the frequency range 10 kHz—1 MHz is different for normal and diseased body tissues giving the possibility of tissue characterization using bioimpedance, which may be useful in diagnosis (Brown et al., 2000b). Therefore, the frequency range 10 kHz—1 MHz was chosen for the excitation signal of the implemented multi-frequency FIM system. To measure the impedance response over the entire frequency range 10 kHz—1 MHz, the system was designed for 8 octave related frequencies which are 10, 20, 40, 80, 160, 320, 640 and 1,024 kHz; a complete measurement “frame” would consist of measurements at all these frequencies. However, the highest measurement frequency implemented (1,024 kHz) was not an octave multiple of its previous frequency; it was a practical maximum that could be achieved using the available electronic components. The octave progression of measurement frequency gave equi-distant points in the frequency range on a logarithmic scale.
In-vivo, FIM injects a current into the human body. In terms of maximizing the signal-to-noise ratio of the final system this needs to be as high as possible, but its effect on the body cannot be ignored. The International Electrotechnical Commission (IEC) defined the safe auxiliary current limit for medical equipment to be 100 µA (rms)/kHz (IEC, 2004). According to the American National Standard, safe auxiliary current limits for electromedical apparatus is 5 mA at 10 kHz; with higher currents (maximum limit 10 mA) being deemed safe at higher frequencies (AAMI, 1993). At higher frequencies, tissue heating (Joule heating) is the limiting factor. Tissue heating depends on a number of factors including: current density, time of exposure and blood flow in the tissue. For surface electrodes, current densities less than 1 mA/mm2 are unlikely to cause damage (Brown et al., 2017). Therefore, the maximum current of the MFFIM was specified to be 0.5 mA.
The measured voltage depends not only on electrical properties of the tissue sample under investigation, but also on the excitation current amplitude and the electrode configuration. Based on measurements from 12 normal human subjects, (Brown et al., 1994) reported that for a typical electrode configuration that they used, transfer impedance values of the human thorax were (24.56 ± 4.09) Ω and (15.70 ± 2.80) Ω at frequencies of 9.6 and 614.4 kHz, respectively. Again, the transfer impedance in the breast tissue, measured using four 7 mm diameter electrodes configured at the corners of a 4 cm square arrangement, varied between 5 and 50Ω in the frequency range 5–200 kHz (Al Amin et al., 2014). Therefore, the transfer impedance range was specified as 5–100 Ω in the present work.
Electrical properties of some tissues/organs, including the lung and the heart change with time with different periodicities. In the case of the thorax, lung impedance changes slowly with breathing while cardio-vascular changes are faster. Therefore, a complete “frame” of multi-frequency measurements containing measurements at all 8 frequencies with FIM electrode switching, should be performed fast enough to allow dynamic measurement of the fastest change. Typically, the respiratory rate in a normal adult is 12–18 breaths-per-minute and the cardiac rate is 60–72 bpm, the latter increasing on exercise and with disease to a maximum of a little above 200 bpm. Therefore, the frame rate should be more than double this latter value if one wants to study cardiac related changes. That means the sampling frame rate should be greater than 400 fpm (frame per minute) or about 7 fps (frame per second). This frame rate will naturally cover changes with respiration which are much slower. Keeping some margin, the frame rate was specified to be greater than 10 fps in the present work.
For the design for the constant amplitude current source, its output impedance has to be made very high compared to that of the driven load so that the current remains essentially constant irrespective of typical variations in the load impedance. Here the driven load impedance is that between two electrodes fixed to a human body which is essentially the sum of two electrode-tissue contact impedances and the bulk impedance of the body between these electrodes. Typical value of an electrode tissue contact impedance at 10 kHz is around 1-2 kΩ (McEwan et al., 2007) and that at 1 MHz is less than 500 Ω (Nguyen et al., 2013; Yang et al., 2017). The bulk impedance is expected to be of the order of the measured transfer impedance in a TPIM system, differing slightly depending on the position of the current and potential electrodes. The transfer impedance, considered for this design as mentioned before, was between 5 and 100 Ω, the lower values being typical for around 1 MHz while the higher value for around 10 kHz. Both of these are very small compared to the corresponding electrode tissue contact impedances, and this is expected to hold at all in-between frequencies. From both the background and this section, it can be seen that the output impedance of the current source is a key parameter in determining measurement accuracy and that the tissue impedance is much less than the electrode contact impedance. Using these, the output impedance of the current source for the FIM system was specified to be >200 kΩ at 10 kHz and >50 kΩ at 1MHz; 100 times higher than the total driven impedance to give a measurement accuracy of 1%. The design requirements for the multi-frequency FIM system are summarized in Table 1.
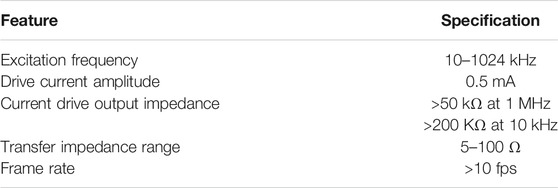
TABLE 1. Design requirements for the multi-frequency FIM system.
An integral part of the system design was component selection. Since our aim was to have device that could be constructed, maintained and customized by researchers or their technical collaborators, we made a policy decision at the outset to only use through hole components, not surface mount devices (SMD). Hand construction and prototyping with the latter was deemed problematical unless specialist facilities were available. SMDs were designed to reduce the costs and size of mass-produced electronics, not for low-budget research developing novel instrumentation. We also wanted the design to be implementable in low resource settings and therefore we also required components to be widely available, including in these countries. Our criterion for determining whether or not to use a component was whether it was available through a major component supplier in Bangladesh where 2 of the authors (MAK and KSR) are based. Where the system specification could not be met with components that met the selection criteria, we chose components that were likely to meet it in the near future.
Our criteria for component selection impacted on the system design since it eliminated high speed micro-controllers, field programmable gate arrays (FPGA) and digital signal processing devices. In particular it eliminated the use of digital demodulation techniques where multiple frequencies are applied to the tissue simultaneously (Wilson et al., 2001; Sanchez et al., 2012). Thus, the design was based on sequential measurements of the different frequencies. Options for analogue demodulation include full-wave rectification, techniques using analogue multiplication (e.g., multiplying the signal to be measured with a square wave), peak following and synchronous peak detection. With the exception of the synchronous peak detection technique, the other techniques all require time averaging of the detected peak values to give a dc voltage proportional to the amplitude. For an analogue implementation, the averaging is implemented as a low pass filter, typically a first order low pass filter, that gives an average with an exponentially mapped past. Thus, averaging occurs over long time periods limiting the ability of the instrument to measure small or rapid changes in impedance with time. Synchronous peak detection gives a cycle-by-cycle measurement of the amplitude and thus provide real-time information on impedance changes and this was the approach used in the FIM system described.
Figure 2 shows the block diagram of the multi-frequency FIM system where two microcontrollers were used. An analogue signal at the drive frequencies was generated using Microcontroller-1 with a digital to analogue converter (DAC), and a current to voltage converter. This voltage signal was then converted to a bipolar drive current using a balanced Howland current source circuit. The current drive was then applied to the target biological tissue through electrodes selected by multiplexers to give the appropriate FIM electrode configuration (see Figure 1).
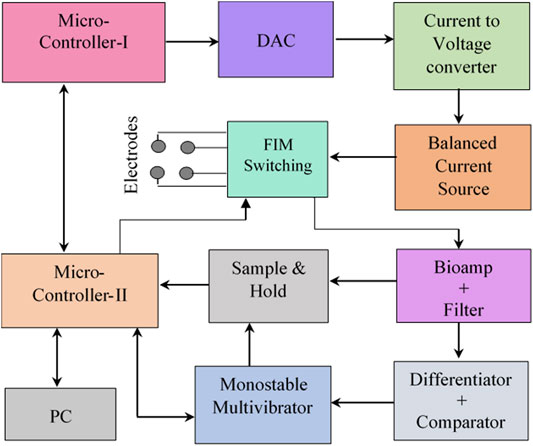
FIGURE 2. Block diagram of the multi-frequency FIM system based on analogue synchronous peak detection.
The received voltage signal from the potential electrodes, selected using the FIM switching circuit, was amplified using a differential (instrumentation) amplifier (bioamp) and then passed through filters to reduce noise and unwanted signal components. The next requirement was to determine the peak voltage of the output sinusoidal signal for which the rest of the circuit blocks in Figure 2 were used. The scheme of this analogue peak detection method is explained in Analog synchronous peak detection.
For multi-frequency bioimpedance applications, the current drive circuit needs to set the excitation signal to different frequencies. A schematic of the current drive circuitry is shown in Figure 3. In the current drive circuitry of the designed MFFIM system, a microcontroller (Atmega8, Microcontroller-I in Figure 2) was used to generate sinusoidal waves as described in the following paragraph.
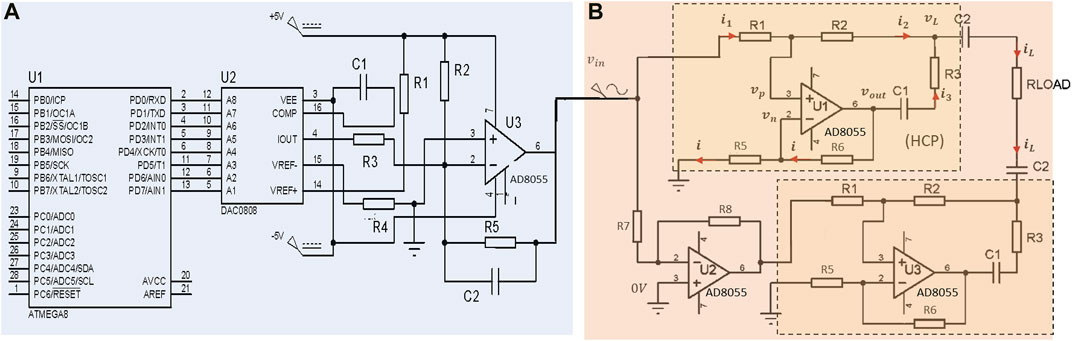
FIGURE 3. Schematic of the implemented current drive circuit. (A) Microcontroller based sinusoidal signal generator with current to voltage converter, passive components: R1 = R4 = 10 kΩ, R2 = 20 kΩ, R3 = 1 kΩ, R5 = 2 kΩ, C1 = 10 nF, C2 = 20 pF. (B) Circuit diagram of the implemented balanced Howland current source with DC coupling capacitors, passive components: R1 = R5 = R6 = 101 kΩ, R2 = 100 kΩ, R3 = 1 kΩ, C1 = C2 = 470 nF. Operational amplifier power supply: ±5 V.
Digital (8bit) amplitude values of samples from a full cycle of a sine wave were calculated and corresponding binary values were stored in the program memory of the microcontroller (U1 in Figure 3A). For digital-to-analogue conversion (DAC) the microcontroller (an Atmega8) used pulse-width-modulation requiring an external RC filter to produce the analogue voltage. Since different RC time constants would be needed for the different excitation frequencies, a separate digital to analogue converter (DAC0808) was used to generate the analogue drive signal. The 8 bit amplitude values (binary) were cyclically clocked through 8 I/O ports of the microcontroller to the DAC where the clocking rate determines the frequency of the output signal. The number of sample points is limited by the maximum clock rate (16 MHz), which equals the instruction rate of the microcontroller. Using 25 sample values per cycle with intervals of 14.40 and clocking these samples at 16 MHz resulted in a sinusoidal signal of 640 kHz. Signals of other lower frequencies were generated by reducing the clock frequency appropriately. Because of the limitation imposed by the maximum clocking speed of 16 MHz, a lower number of sample points per cycle, 15, was necessary for the generation of a signal at 1 MHz. The DAC (0808) gives a current output which was fed to a current to voltage converter in which passive electronic components were chosen to obtain an output voltage of ±0.5 V.
A balanced current source was chosen for injection of the sinusoidal signal of constant amplitude into the biological tissues. A bipolar modified Howland current source described by (Bertemes Filho, 2002) was used in the implemented MFFIM system as shown in Figure 3B. It is a combination of two identical modified Howland current pumps (HCP). The input of the 2nd modified HCP was inverted so that the current sourced from the 1st modified HCP is totally sinked at the 2nd HCP. A unity gain inverting amplifier was used to feed the 2nd HCP (R7 = R8 = 10 kΩ).
The output current (considering peak amplitudes) through the load resistor RLoad is given by Eq. 1,
where Vin is the peak input voltage to the current source and
Ideally, the current through the load is independent of the value of load resistance and depends only on
The voltage signal between the sensing electrode pair needs to be amplified minimizing the common mode potential on the body. A standard three-op-amp instrumentation amplifier circuit (Pallas-Areny and Webster, 1993) was used in the MFFIM system (Figure 4A). Once again, the AD8055 (unity gain bandwidth: 300 MHz, slew rate: 1400 V/μS) was used. AC coupling at the inputs removes the dc contact potenital and eliminates the possiblity of the dc bias currents from the amplifiers reaching the body. The voltage sensing electrodes may also pick signals originating from myoelectric activities within the body, including those from the heart, but these are at a much lower frequency (0.01–100 Hz and 2 Hz-1 kHz, respectively) than the frequencies being measured (>10 kHz). Therefore, high pass filters with a cutoff frequency of 1,592 Hz were used, 5 times lower than the lowest frequency (10 kHz) being measured. The main source of the common mode voltage is capacitive coupling of the body to the 50 Hz mains power supply and can be up to 1,000 times larger than the common mode voltage produced by the injected current (Brown et al., 2017). To achieve high CMRR by matching resistor ratios, resistors of tolerance 1% were used in the implemented bioelectric amplifier. The resistors were chosen so that
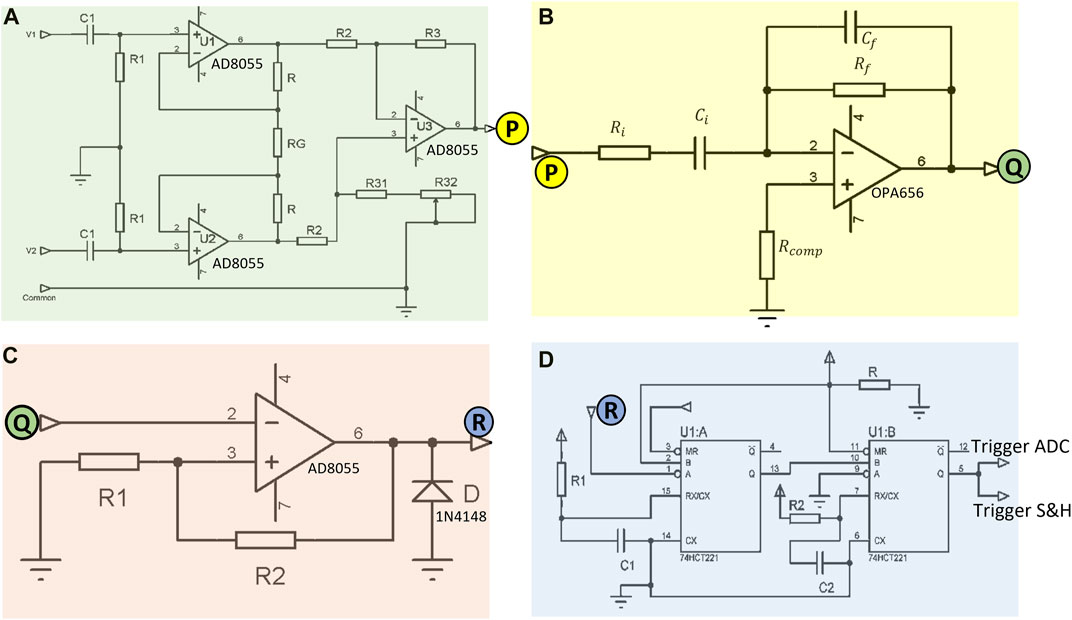
FIGURE 4. Circuitry implemented in the MFFIM system for analogue synchronous peak detection of the voltage signal: (A) Bioelectric amplifier with high pass filter for amplification of the voltage signal across recording electrodes minimizing noise, passive components: R1 = 1 MΩ, C1 = 0.1 nF, R = 47 kΩ, RG = 2 kΩ, R2 = R3 = 10 kΩ, R31 = 8.2 kΩ, R32 = 4.7 kΩ. (B) Circuit used to differentiate the bioamp signal to give a 90° phase shift, passive component values are given in Table 2. (C) Voltage comparator circuit designed for zero crossing detection, passive components: R1 = 5 Ω, R2 = 10 kΩ. (D) Schematic of the sampling pulse generator circuit, passive components: R1 = 1 kΩ, C1 = 1 nF, R2 = 1 kΩ, C2 = 100 pF. The labeled letters (P, Q, R) represent electrical connections between input and output of subsequent circuits. Operational amplifier power supply: ±5 V, 74HCT221 power supply: (0, +5) V.
The overall gain of the bioelectric amplifier was set to 48 so that the amplified signal voltage does not exceed the maximum op-amp output swing of ±3.2 V with a power supply voltage of ±5 V. If the transfer impedance to be measured is 100 Ω (maximum as specified) with an applied current amplitude of ±0.5 mA, the voltage developed across the receive electrode pair equals ±50 mV. With a gain of 48, amplified signal voltage amplitude is ±2.4 V. So the maximum voltage amplitude to be acquired by the ADC is +2.4 V. The internal reference voltage (+2.56 V) of the Atmega8 ADC was used as reference.
Implementing synchronous peak detection was challenging for all the different circuit elements because of the wide dynamic range of frequencies it had to work over. The approach adopted was to have multiple phase detectors each of which covered a narrow frequency range. The principle, for each frequency, is illustrated in Figure 5. The signal from the bioelectric amplifier is first differentiated by passing it through an analogue differentiator, so there is a phase difference of 90° between the bioelectric amplifier output (Figure 5A) and the differentiator output (Figure 5B). The zero crossings of the differentiated signal (trailing edge of Figure 5C), correspond to the peak in the original signal which can be sampled by an appropriate pulse (Figure 5E) and held (Figure 5F). The blanking pulse (Figure 5D) prevents retriggering of the sample and hold process on noise.
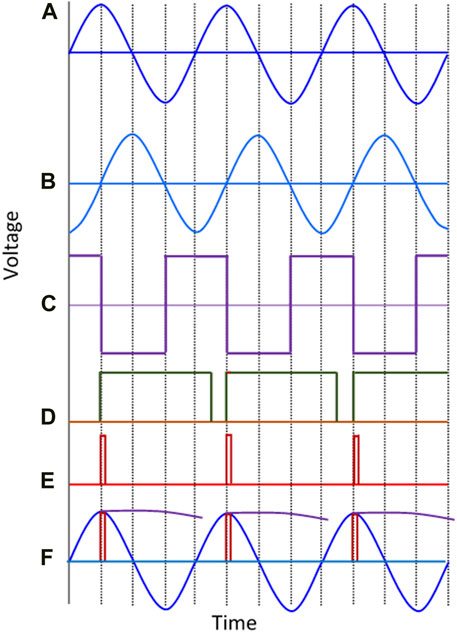
FIGURE 5. Graphical representation of the analogue synchronous peak detection method. (A) Output signal of the bioelectric amplifier, (B) Differentiated signal, (C) Square wave from the zero crossing detector, (D) Pulses of duration 700nS generated by the first monostable multivibrator, (E) Pulses of duration 70 nS generated by the second multivibrator (red) are sampling pulses used to activate the sampling switch, (F) the bioamp output signal with the peak detection pulses superimposed on it as are the held “peak” values after the sample and hold. Note that the held values are only shown for part of the period between adjacent peaks to make the processing performed clear.
A standard differentiator circuit (Figure 4B) was used for differentiating the bioamp output signal. An op-amp with high input impedance that was stable at low gains was required for this stage which has to operate over a wide frequency range. Therefore, an op-amp with JFET input (OPA656) was used. The output of the differentiator must be within the maximum output swing (±3.2 V) of the op-amp as mentioned before. Since the maximum specified output of the bioamp was ±2.5 V, the maximum gain of the differentiator circuit was chosen as 1.28. However, the output from the differentiator is proportional to the signal frequency. The designed signal frequency range is 10 kHz–1 MHz (a range of 1:100), therefore we should have a 100:1 dynamic range. Again, the transfer impedance range specified is 5–100 Ω, a 20:1 dynamic range. So the differentiator needs to work over a 2000:1 dynamic range (i.e., >60 dB). A single differentiator circuit to cover the required frequency range was not achievable, therefore, four different differentiator circuits with frequency dependent gain characteristics as shown in Table 2 were used. The differentiator circuits were switched according to the measurement frequency using a multiplexer. An analogue multiplexer (74HC4052), controlled by microcontroller-II, was used to select appropriate differentiators for specific choices of signal frequencies (not shown in the schematics).
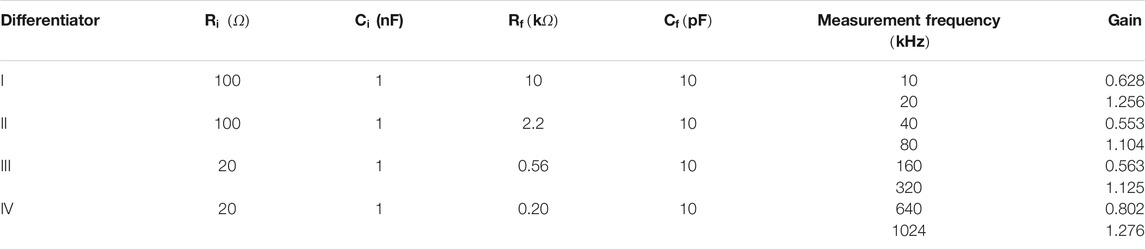
TABLE 2. Circuit parameters of four different differentiator circuits designed for various measurement frequencies.
The voltage comparator (Figure 4C) designed to detect zero crossing of the differentiator output which corresponds to the peaks of the target bioamp signal (Figure 5A). In order to stop output transitions because of the presence of noise a hysteresis was applied by feeding back a small fraction of the output voltage to the positive input. The reference voltage of the comparator designed was 0 V and hence its hysteresis can be expressed by Eq. 2:
where,
Sampling pulses (70 ns) were generated from a dual non-retriggerable monostable multivibrator (CD74HCT221) circuit (Figure 4D) that triggered a Sample and Hold (S&H) circuit, which in turn sampled the bioamp output signal at its peak. This value was then held stable for the conversion period (Figure 5F) of the analogue to digital converter (ADC) of Microcontroller-II.
Figure 6 shows the schematic of the S&H circuit implemented in the MFFIM system. A fast CMOS multiplexer CD4051 was used as the sampling switch. The time constant for charging the capacitor depends on the ON resistance
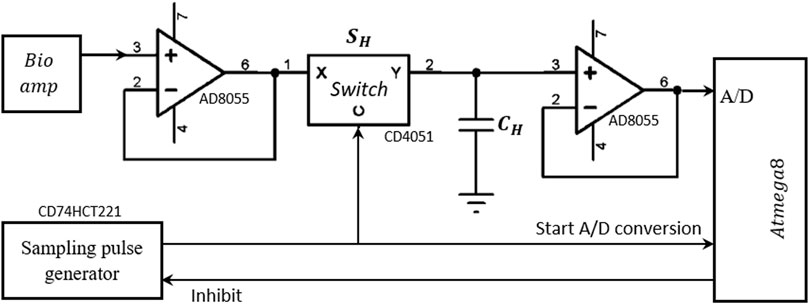
FIGURE 6. Schematic of the Sample and Hold circuit designed for measurement of the peak value of the voltage signal. Operational amplifier power supply: ±5 V.
In the hold state, the switch is open; the capacitor CH needs to hold the voltage value until the A/D conversion is complete. But in practice, the capacitor is discharged through both the input resistance
The rising edge of the sampling pulse of the S&H circuit was also used as an interrupt pulse which initiates the A/D conversion of the microcontroller-II. There is an internal 2 clock pulse delay between triggering the interrupt and initiation of the conversion process during which the ADC was initialized. Therefore, no extra delay was necessary between the sampling pulse of the S&H circuit and that to trigger the ADC circuit enabling the same pulse to trigger both. The ADC of the Atmega8 microcontroller requires 13.5 μS for each conversion. For measurement frequencies greater than 80 kHz, the time period between two successive peaks is <13.5 μS, therefore, subsequent trigger pulses could be generated from the sampling pulse generator before the ADC conversion of the previous sample is complete. To prevent this, the monostable multivibrator output was gated (inhibited) by programming microcontroller-II so that it cannot initiate further sampling pulses before completion of the current ADC conversion. The overall gain of the voltage measurement circuit based on analogue synchronous peak detection was set to 48. Therefore for a drive current of 0.5 mA peak and transfer impedance of 100 Ω, the peak voltage across the receive electrode pair is 50mV before amplification. After 48 times amplification, the voltage peak should be 2.4 V. The resolution of the ADC of the voltage measurement microcontroller is 10 bit with reference voltage 2.56 V. Therefore, the measurement resolution for the synchronous peak detection method is 0.1 Ω.
From Figure 1 it can be seen that there are 3 versions of the FIM electrode configurations, i.e., FIM-8, FIM-6 and FIM-4. The Focused Impedance Method requires two tetrapolar (TP) measurements at each frequency where the direction of current drive and voltage measuring electrode pairs are altered orthogonally as summarized in Figure 1. This section describes the FIM switching mechanism implemented (Figure 7). There are four signal terminals; two for current drive (i+ and i−) and two for voltage measurement (v+ and v−) for each TP measurement. FIM measurements were achieved by switching the current and voltage signals to appropriate electrodes for a particular FIM configuration. For this purpose, up to eight connectors to these electrode ports (denoted:1–8) could be fitted to the device; the exact number being dependent on the FIM configuration and application area being investigated. These ports were used for the electrical connections to the electrodes. Analog multiplexers (CD4052) were used to establish electrical conduction path among signal terminals and electrode ports (Figure 7) appropriate for a particular FIM configuration as described in Figure 1. The multiplexers were controlled from the microcontroller using I/O terminals.
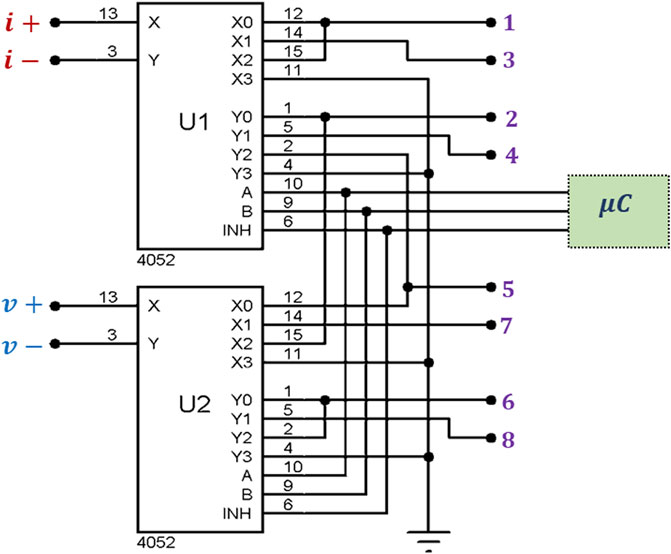
FIGURE 7. Circuit implemented for multiplexing signal terminals among body electrodes to achieve FIM measurements. Here, i+ and i−are the output terminals from the current source and v+ and v−are the input terminals to the bioamp. The numbered connections at the outputs of U1 and U2 are ports for the FIM electrode connections.
For the FIM-8 configuration, all the eight ports (1–8) need to be used and the two TP orthogonal measurements were performed by switching signal terminals among body electrodes sequentially according to Table 3. In this scheme, measurement-I is performed by connecting signals terminals to the electrode ports 1,2,5,6 and then Measurement-II is performed by connecting signal terminals to the ports 3,4,7,8; which in turn connect signal terminals to the electrodes A,B,C,D and E,F,G,H, respectively. The microcontroller is programmed so that it records voltage signal from horizontal electrodes; and then changes the multiplexer control inputs to record the signal for vertical electrodes of Figure 1 at each measurement frequency.
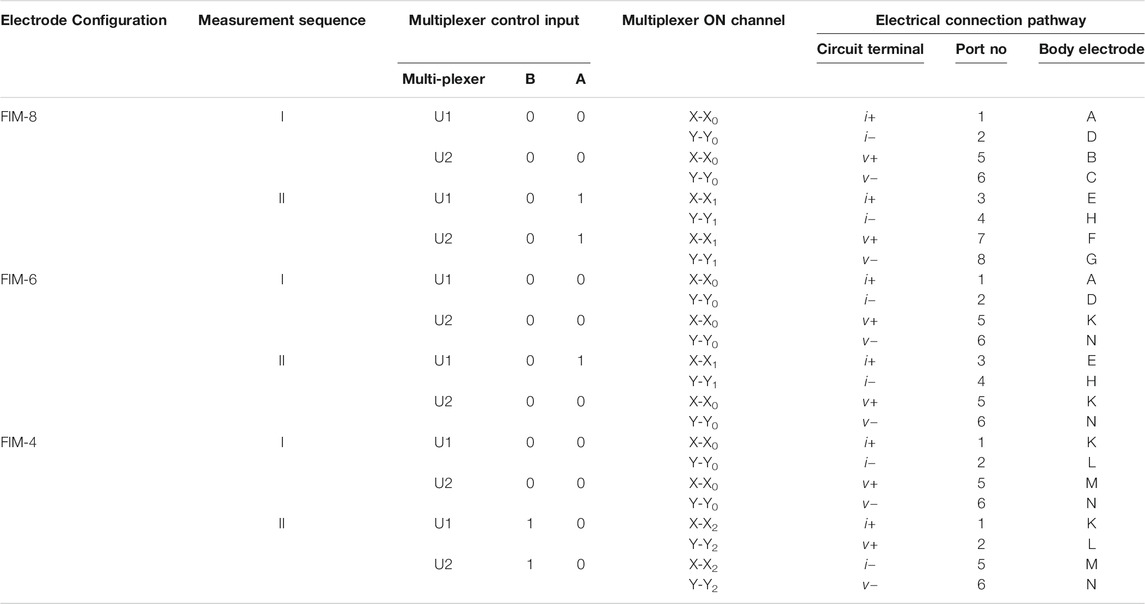
TABLE 3. Switching sequences for different FIM measurements. Multiplexers are controlled by a microcontroller to established electrical conducting path between signal terminals and body electrodes for FIM measurements.
In the FIM-6 configuration, the electrode ports 7 and 8 are not used; only the current terminals are switched while voltage signal is recorded from the same electrode pair (K,N). In the FIM-4 configuration, only four ports (1,2,5, and 6) need to be used. In this case, only the signal terminals i− and v + are switched between the electrodes
The Universal Synchronous and Asynchronous Serial Receiver and Transmitter (USART) peripheral of the ATmega8 microcontroller was used to communicate with a personal computer that was employed to process and store the measured data. A serial to USB adaptor (TTL232-5 V) was used to connect the FIM system to the commonly available USB port of a PC. An open source terminal program “RealTerm” was used to acquire and store data on PC.
Microcontroller-II acquired 10 consecutive peak values of the bioamp output through ADC conversion for a TPIM measurement at a particular frequency which were then averaged them before sending the resultant value to the PC via the serial link. Another TPIM measurement is then performed at the same frequency by changing the drive and receive electrode pairs through FIM switching algorithm and then sent to the PC. The sequence was then repeated for the other measurement frequencies. Focused impedance values were obtained by averaging the two TPIM values from each measurement frequency in the PC.
To ensure patient safety all patient connections on electro-medical equipment should be electrically isolated from the mains supply. The multi-frequency FIM system described in this paper required a total current of approximately ±100 mA from a ±5 V supply. The need for electrode switching under microprocessor control means that the voltage measurement and current source sections cannot be easily isolated from the other parts of the system. Therefore the whole measurement system is powered from a medical grade isolated power supply (THB 3–1,222 manufactured by TRACO® POWER) that satisfies the IEC/EN 60601–1 safety standards (IEC, 2004) for patient connected electro-medical equipment. The output of the power supply is ±7 V which was converted to ±5 V using regulators. The power supply can isolate up to 5 kV.
For storage and analysis of data, the device is connected to a PC which may be connected to mains supply. Isolation between the data acquisition system and the PC was achieved using high speed opto-couplers (HCPL 2531) on the serial data lines (Rx, Tx) connecting the two. The isolation measures taken for patient safety are illustrated in Figure 8. In addition, all electrode connections to the patient were ac coupled using capacitors to prevent any dc currents passing to the patient, which are associated with hazards.
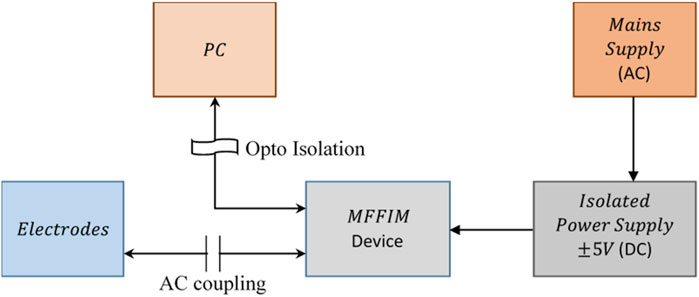
FIGURE 8. Isolation of the measurement device from mains supply to ensure patient safety. The power is taken from a medical grade isolated dc power supply while the communication with PC is optically coupled for the device based on analogue synchronous peak detection.
The microcontroller based signal generator of the MFFIM was designed to generate sinusoidal signals of frequencies: 10, 20, 40, 80, 160, 320, 640, and 1,024 kHz. However, the actual frequencies of the signals generated by the implemented circuit were measured using a calibrated oscilloscope and found to be 10, 20, 40, 80, 160, 296, 633, and 1,033 kHz, respectively, (rounded to the nearest kHz). The generated signal frequencies are close to the frequencies specified except signals at high frequencies, particularly at 296 kHz which is 24 kHz lower than that specified. The frequency at which the binary sample values are clocked out for these high frequencies were obtained by dividing the processor clock frequency. For the Atmega8, the processor clock frequency is the same as the instruction execution rate, so there may be some delays within the microcontroller for the program counter and interrupt service checks. The time lag, which is negligible at low frequencies, may be the reason for the differences in the top two frequencies where 25 point sampling was used. However, the differences are small and the resultant values are acceptable since it is the variation of transfer impedance with frequency that is intended to be analysed in the studies. Total harmonic distortions (THD) of the generated sinewaves were found to be 0.167% at 10–633 kHz and 0.33% at 1,033 kHz.
The current source can be modelled as a constant current generator in parallel with a resistance (output impedance). To measure the output impedance (ZO) of the current drive circuit, two different load resistances (RL) were driven by the current at each frequency (Figure 9A). If V1 and V2 were the voltage developed across RL = R1 and RL = R2, respectively, then:
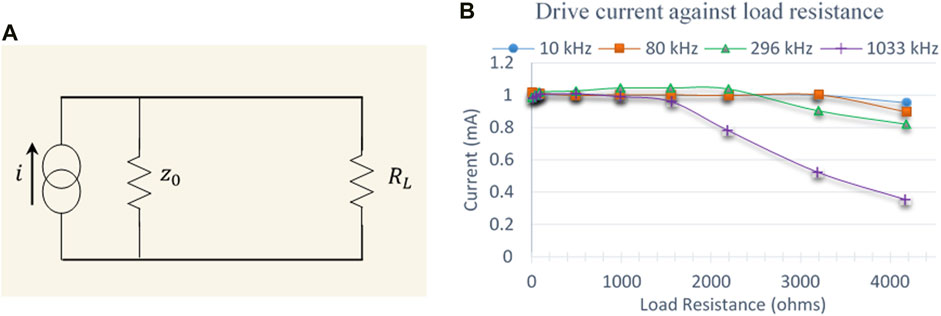
FIGURE 9. (A) Equivalent circuit used to model the output impedance of the current source (B) Drive current plotted against load resistances at four representative frequencies.
The output impedance (ZO) was calculated using Eq. 3 by measuring the voltages across two different load resistors 97.8 and 991 Ω (these were the measured resistance values using a calibration checked multi-meter for standard resistors 100 and 1,000 Ω, respectively). Thus the output impedance of the current source was found out to be 476 kΩ at 10 kHz and 58.3 kΩ at 1,033 kHz, respectively. The current source was designed to deliver peak currents of ±0.5 mA to load resistances up to 4 kΩ. Figure 9B shows the drive current against load resistances at different frequencies. The drive current is almost constant up to a load of 3 kΩ for signals up to 80 kHz but starts to drop above this. For 296 kHz signal, the current drops above a load of 2 kΩ while for 1,033 kHz signal, the drive current drops above 1.5 kΩ. It should be noted that these measurements are for the current source without connection to the multiplexers that select the drive and receive electrodes.
For an ideal op-amp the Common Mode Rejection Ratio (CMRR) of the differential amplifiers used in the MFFIM system is determined by the matching of the resistors in the differential element. However, the presence of series impedances and stray capacitances degrade the CMRR of the overall circuit. The CMRR of the voltage measurement circuit of the designed MFFIM was obtained experimentally at all the eight measurement frequencies. The differential mode gain (
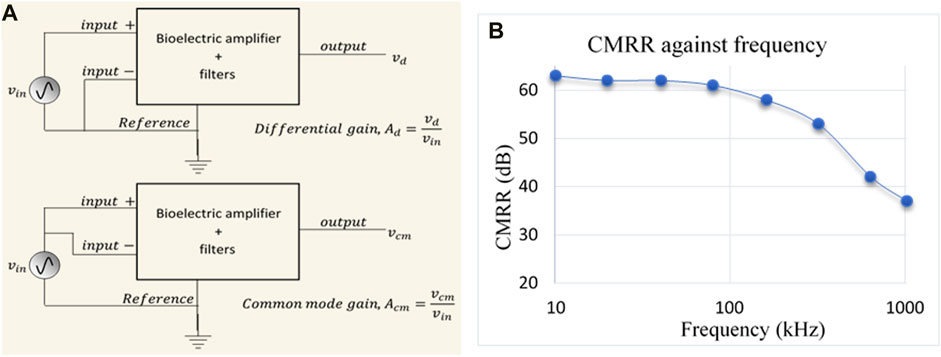
FIGURE 10. (A) Schematic diagram used for measuring the Common Mode Rejection Ratio (CMRR); here Ad and Acm are differential and common mode gain, respectively, (B) Frequency response of CMRR of the voltage measurement circuit of the designed MFFIM system.
Experimental values of CMRR were plotted against frequency in Figure 10B. It can be observed that the value of CMRR was 63 dB at 10 kHz and remains above 60 dB up to 100 kHz beyond which it decreases and reduced to 37 dB at 1,024 kHz.
To study the accuracy and linearity of the developed instrument, transfer impedance values were measured on a passive circuit phantom as shown in Figure 11A, where
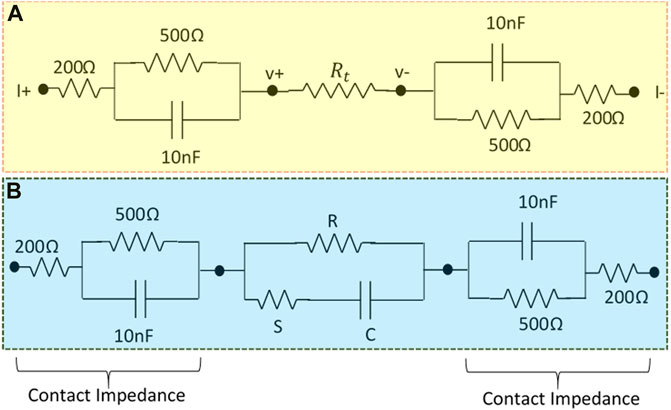
FIGURE 11. (A) Resistive phantom modeled contact impedance used to study the linearity of the designed MFFIM system, (B) Cole phantom with modeled contact impedance used to study the accuracy of the designed multi-frequency FIM system.
Figure 12Ashows the measured impedance values of
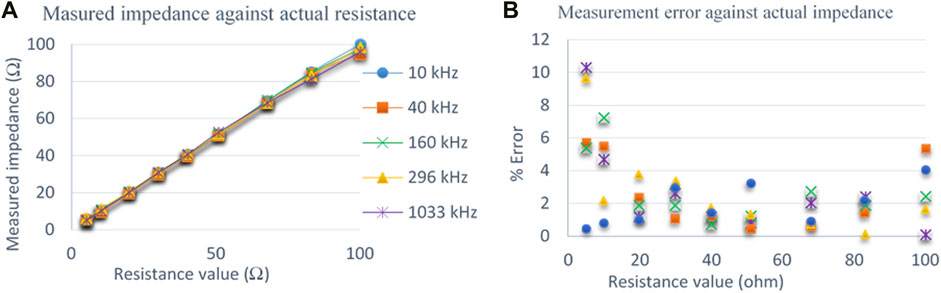
FIGURE 12. (A) Comparison of measured impedance with actual impedance values measured on the resistive phantom at 5 representative frequencies. (B) Percentage of error at different frequencies for impedance measurements on a resistive phantom.
For the above measurements on resistive phantoms, the accuracy of measurements were determined. If the applied known resistance was Rknown and the resistance measured by the multi-frequency FIM system was Rmeasured, then the percentage of error (absolute value) was calculated using Eq. 5.
Figure 12B shows the percentage of measurement error against actual resistance values of
The complete multi-frequency FIM system was also tested for complex loads as encountered in biological systems by replacing the load resistor
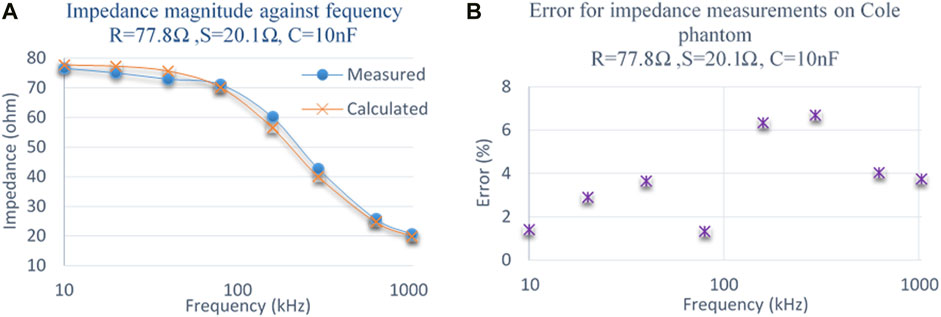
FIGURE 13. (A) Comparison of measured impedance magnitude with calculated impedance on a Cole phantom. (B) Percentage of error at different frequencies for impedance measurements on a Cole phantom.
One of the major purposes of the multi-frequency FIM system was to perform two orthogonal TPIM measurements at each frequency by switching the drive and receive electrode pairs automatically. To test this switching performance, measurements were taken by the developed multi-frequency FIM on a resistive phantom shown in Figure 14A. For one set of FIM measurement (FIM-1) the current drive terminals of MFFIM instrument i+ and i− (Figure 7) were connected to phantom terminals K and L, respectively, and the potential measuring (receive) terminals of the MFFIM instrument
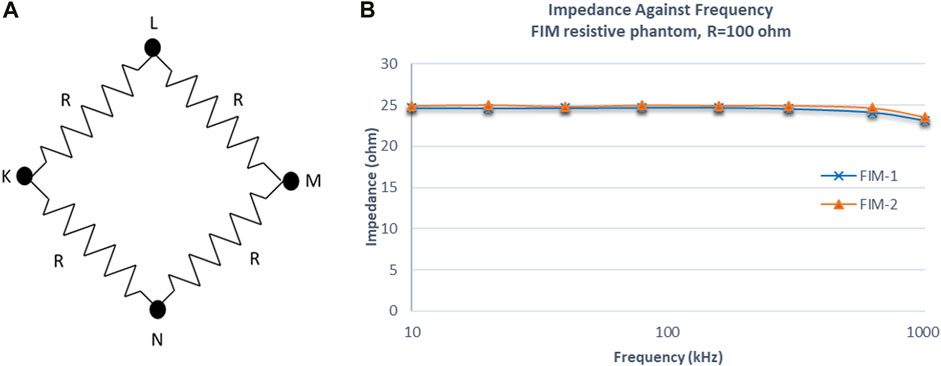
FIGURE 14. (A) Resistive phantom used for the impedance measurement in FIM scenario. (B) Impedance values of two TPIM measurements by changing drive and receive electrode pairs using the implemented switching algorithm at different frequencies.
The current I applied (0.5 mA) between terminal K and L will flow through two paths: K-L and K-N-M-L. Since the values of all the resistors are same (R = 100 Ω), the current through path K-N-M-L will be one fourth of the applied current. Therefore, the voltage V across M-L would be 25*I (=100*I/4) and theoretically the expected transfer impedance, V/I would give a value of 25 Ω. It can be seen that the measured values follows the theoretical value closely at all frequencies.
The prototype FIM system developed allows bioimpedance measurements selecting a particular FIM configuration at multiple frequencies under software control from a PC. Figure 15 shows the PCB with fabricated electronic components and the front panel as well as the back panel of a prototype MFFIM system. Characteristics of the implemented multi-frequency FIM system are summarized in Table 4. The multi-frequency FIM system developed has potential application in a number of areas where bioimpedance measurements are used including the diagnosis of lung disorders and breast malignancy. The output impedance of the current generator was 476 kΩ at 10 kHz, decreasing to 58.3 kΩ at 1 MHz. These values exceed the design specification for 1% measurement accuracy discussed in Design Considerations, i.e., >200 kΩ at 10 kHz and >50 kΩ at 1 MHz. Whilst these meet the design specification, we acknowledge that the higher frequency value is low and the measurement was made without the multiplexers. However, the value of 500 Ω used for the electrode contact impedance was conservative and values below 200 Ω have been reported at 1 MHz (Nguyen et al., 2013; Yang et al., 2017). We note that the value obtained is consistent with values reported for modelled current sources without multiplexers (e.g. Bertemes-Filho et al., 2012). An improvement in the output impedance of the current generator at the higher frequencies can be achieved by using resistors of tolerance better than 1% and higher frequency op-amps (Bertemes-Filho et at., 2012; Bertemes-Filho et al., 2016). Additionally, measurement of injected current amplitude can increase the impedance measurement accuracy and that may be implemented in future designs. The total harmonic distortions of 0.167% at 10–633 kHz and 0.33% at 1,033 kHz are comparable to that of the systems developed for similar application (Castro et al., 2016).
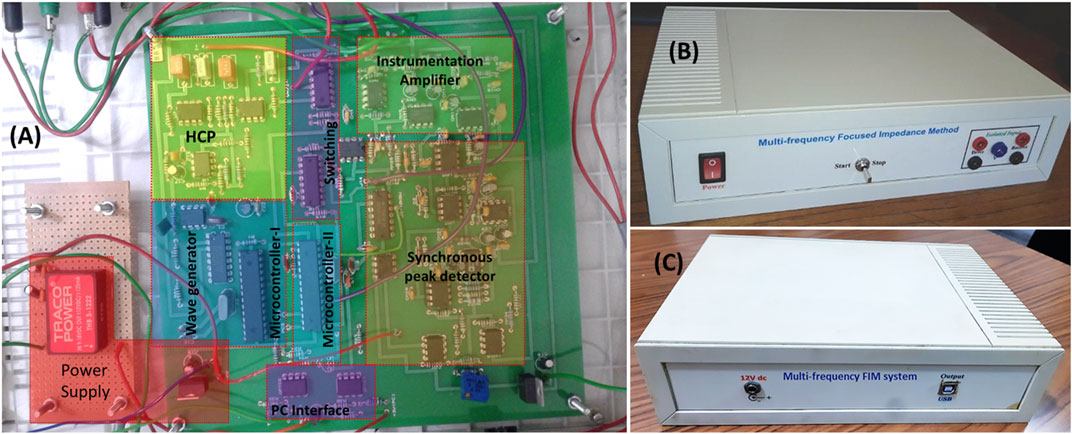
FIGURE 15. (A) PCB populated with the electronic components together with a mask indicating different parts of the MFFIM circuitry. (B) A prototype of the MFFIM system for making FIM-4 measurements that has 4 × 4 mm (banana) connectors for the electrodes on the front panel. (C) Back panel of the MFFIM system. In FIM, two orthogonal tetrapolar measurements are performed by altering the drive and receive electrodes as explained in Figure 1. The labels “drive” and “receive” on the electrode terminals seen in the figure refer to the first tetrapolar measurement. In the second tetrapolar measurement the drive and receive electrodes were altered by the automatic switching (FIM Switching). The two tetrapolar measurements were combined in the PC to give the FIM-4 measurement.
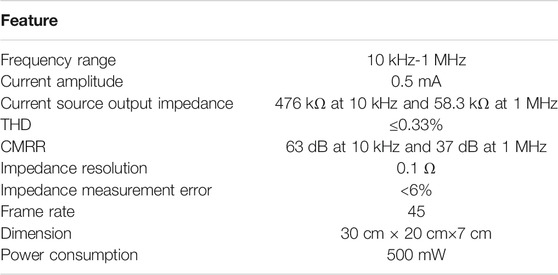
TABLE 4. Characteristics of the implemented multi-frequency FIM system.
For epithelial tissue measurements inside body orifices and cavities the electrodes will be smaller and closer together (e.g. Abdul et al., 2006) and the drive current will need to be reduced to microampere range to prevent local tissue heating due to the high current density. For such applications the analogue circuitry has to be redesigned and evaluated but the same switching circuitry can be used.
It should be noted that FIM measures the impedance amplitude, but no phase measurement is possible. There are well recognised problems in measuring and interpreting the phase from transfer impedance measurements. The position is even more complex for FIM which is the sum of two spatially separated transfer impedance measurements where the contributions from different parts of the volume under interrogation will be different for the two measurements. As a result, we view FIM as a magnitude measurement technique with the phase having no physical meaning.
The Common Mode Rejection Ratio (CMRR) of the bioelectric amplifier used to amplify the voltage signal was 63 dB and 37 dB at 10 and 1,024 kHz, respectively, (Figure 10B). Since any amplification of the common mode signal resulting from injected current gives rise to a measurement error, amplifiers used in impedance measurement systems require a high CMRR at the measurement frequency. In the context of EIT systems, it has been suggested 66 dB is required for 0.1% accuracy (Rossell and Riu, 1992) and that up to 72 dB is required depending on the position of the reference electrode. Achieving a high CMRR at high frequencies is challenging due to stray capacitances. Increasing the current value of 37 dB, which includes connecting cables, is an area for consideration when seeking to improve the overall accuracy of the system. A CMRR of 90 dB at 2 MHz has been reported in custom designed components for on-chip fabrication where connecting cables can be minimised (Worapishet et al., 2010). However, such an approach is not appropriate for a discrete component based system constructed from widely available components.
For the voltage measurement circuit based on analogue synchronous peak detection, the overall gain of the bioelectric amplifier was set to 48. The output voltage of the bioamp could not be greater than 5 V (peak-to-peak) in order to avoid exceeding the input voltage range of the ADC in the microcontroller. On the other hand, if the bioamp output was less than 250 mV, the output of the differentiator at 10 kHz would be too small to be detected by the voltage comparator. Taking the gain to be approximately 50, the measurable input voltage range for the measurement section was 5mV–100 mV (peak to peak). Therefore, with the excitation current of 1 mA (peak to peak) the measurable range for transfer impedance range is 5–100 Ω, a dynamic range of 1:20. Brown et al. (1994) reported that transfer impedance in the thorax region for signal frequencies 9.6–614.4 kHz lies between 14 and 25 Ω. In another study the impedance associated with alveolar edema was found to be 35% below an initial impedance value of 21 Ω (Fein et al., 1979). According to Al Amin et al. the transfer impedance in the breast tissue varies from 10 to 60 Ω in the frequency range 5–200 kHz (Al Amin et al., 2014). Therefor the transfer impedance range of the designed multi-frequency FIM system is adequate for impedance measurements in thorax or breast tissues. However, the gain of the voltage measurement circuit could be adjusted to investigate tissues having other impedance ranges. Although not currently implemented, a switched gain with the gain controlled from microcontroller could be implemented. As the switching would be under microprocessor control and the amplifier output was digitized/acquired by the same microprocessor, it would be possible to implement an automatic gain control.
The output impedance of the current source was measured without connection to the multiplexers used to select the drive and receive electrodes. Using multiplexers to select electrodes is a problem in all multi-measurement impedance instrumentation including EIT systems (Holder, 2004). From the data sheet, the input capacitance of the multiplexers used was typically 5pF and this limits the output impedance of the current source at the highest two frequencies, and ultimately limits it at frequencies much higher than those used by the system described in this paper. To put this into context: 5 pf at 1 MHz has reactance of 32 kΩ; this in parallel with the 58 kΩ output impedance of the current source without the switching gives an effective current source output impedance driving the tissue of 21 kΩ at 1MHz, limiting the impedance the current source can drive to 200 Ω for 1% measurement accuracy. In practice, the impact on the measurement accuracy is small as the electrode contact impedance and the tissue impedance all decrease with increasing frequency. The only solutions are to measure the current driven into the tissue or to use a multi-channel approach with pairs of electrodes having their own current source and bioamp (e.g. Wilson et al., 2001). A recent development of the former approach has shown that using the measured current to control the output current from the current source gives a current source with a high output impedance when multiplexers are used (Sirtoli et al., 2019). All these approaches have substantial cost and complexity implications but should be considered as part of future developments.
We breached our component selection criteria on a number of occasions; in particular, the lack of availability of high-speed op-amps in low resource settings presented a substantial problem as the design specification could not be achieved without them. The AD8055 and OPA656 did not meet our component selection criteria. However, at the time the work was done, they were widely used in general electronic instrumentation and lower specification op-amps from the same manufacturer did meet the criteria. There was therefore a reasonable probability that they would become available in the near future. The microcontroller (Atmega8) used in this design can execute one instruction in one clock cycle and was the most powerful available that met our component selection criteria. The amount of processing and control that needed to be delivered meant a single Atmega8 could not be used for both for signal generation and data acquisition/switching control. Moreover, the number of pins available on a single microcontroller was not sufficient for all the interfacing. Therefore, two separate microcontrollers were used in the implemented system. The medical grade isolated power supply was used for convenience, but an equivalent could be made out of discrete components that met our component selection criteria. The inclusion of surface mount devices (SMDs) in our component selection criteria would not have greatly extended the components available to us at the time the work was done. The decreasing availability of through hole devices and the increasing range of microcontrollers available means that in the future this restriction may not be appropriate. Since this work was finished, cheap, high performance single board microcontroller systems have come on the market, primarily intended for use by recreational programmers (hobbyists) (e.g., Teensy; www.pjrc.com). In our opinion it is only a matter of time before these become available in low resource settings and they provide an easily programmable building block with the potential to move the signal processing from hardware to software without the need for hardware construction. However, high speed op-amps will still be needed to implement the current generators and differential amplifiers. Other approaches are possible if SMD devices are used. Custom designed input circuits were used to make tetrapolar impedance measurements using a 3-terminal single chip impedance measurement device, the AD5933 (Seoane et al., 2008; Margo et al., 2013). A similar approach was used to create a wireless device for lung capacity screening (Pino et al., 2019). Restricting the upper frequency limit to 100 kHz would allow the device to be made from off-the-shelf components that met our component selection criteria, but would exclude measurements where higher frequency transfer impedance changes are reported (Huerta-Nuñez et al., 2019).
The percentage of measurement error of the prototype multi-frequency FIM was below 5% in the frequency range 10–633 kHz for resistive phantoms greater than 10 Ω. For Cole-Cole phantom the error was below 4% except 160 and 296 kHz. But for measurements at 1,033 kHz and impedance below 10 Ω in resistive phantom, the error is around 10% which is a limitation. The measurement accuracy problem at 1 MHz was the result of the limited range of electronic devices, particularly the non-availability of high speed and low noise op-amps. The problem of stray capacitance cannot be ignored at this frequency and optimizing circuit layout may provide some improvement in performance The lack of suitable op-amps and passive electronic components with higher tolerance in a low resource setting was a considerable challenge in achieving the final design. As already stated, many multi-frequency impedance measurement systems have used some form of digital demodulation (e.g., Wilson et al., 2001) and the considerable challenge in using analogue demodulation must be emphasised.
The measurement resolution of the designed multi-frequency FIM system is 0.1 Ω. According to Brown et al., respiratory and cardiac related impedance change in the thorax region is around 1.5 and 0.08 Ω, respectively, (Brown et al., 1994). The resolution of the designed multi-frequency FIM system is therefore adequate for monitoring respiratory related changes, but may not be suitable for monitoring cardiac related impedance changes without signal averaging.
The frame rate of the impedance measurement system based on analogue synchronous peak detector was determined from the clock speed of the microcontroller and was found to be greater than
A multi-frequency FIM system capable of selecting all three version of FIM electrode configuration in the frequency range 10 kHz-1 MHz is described. The multi-frequency FIM system has been developed with the aim of assessing the utility of FIM in diagnosing lung diseases, breast tumour and measuring abdominal fat thickness. Pneumonia, Tuberculosis, edema are common lungs diseases in developing countries, especially amongst children (Izadnegahdar et al., 2013; Jenkins, 2016). So a small, low cost, non-invasive system that can be maintained locally has the potential to benefit a large number of people, particularly those living in the rural areas where modern healthcare facilities and transport are limited. The device meets the EU and UK safety standards for electro-medical equipment. The performance and safety standards of the measurement device described in this paper are adequate to undertake field trials of FIM in the areas of lung disorders, abdominal fat thickness and breast cancer studies.
The original contributions presented in the study are included in the article/Supplementary Material, further inquiries can be directed to the corresponding author.
MK: Methodology, Investigation, Formal Analysis, Writing–Original Draft; AW: Visualization, Validation, Review and Editing, Supervision; KR: Visualization, Validation, Review and Editing, Supervision.
One of the authors MK gratefully acknowledges the support from the Commonwealth Scholarship Commission (CSC) in the United Kingdom (CSC1163262). The authors also acknowledge the International Science Program (ISP) (IPPS BAN04), Uppsala University, Sweden for partial financial support.
The authors declare that the research was conducted in the absence of any commercial or financial relationships that could be construed as a potential conflict of interest.
All claims expressed in this article are solely those of the authors and do not necessarily represent those of their affiliated organizations, or those of the publisher, the editors and the reviewers. Any product that may be evaluated in this article, or claim that may be made by its manufacturer, is not guaranteed or endorsed by the publisher.
AAMI (1993). American National Standard, Safe Current Limits for Electromedical ApparatusANSI/AAMI ES1-1993). Arlington, Va: Association for the Advancement of Medical Instrumentation.
Abdul, S., Brown, B. H., Milnes, P., and Tidy, J. A. (2006). The Use of Electrical Impedance Spectroscopy in the Detection of Cervical Intraepithelial Neoplasia. Int. J. Gynecol. Cancer 16 (5), 1823–1832. doi:10.1136/ijgc-00009577-200609000-0001610.1111/j.1525-1438.2006.00651.x
Adler, A., and Boyle, A. (2017). Electrical Impedance Tomography: Tissue Properties to Image Measures. IEEE Trans. Biomed. Eng. 64 (11), 2494–2504. doi:10.1109/TBME.2017.2728323
Amin, A. A., Parvin, S., Kadir, M. A., Tahmid, T., Alam, S. K., and Siddique-e Rabbani, K. (2014). Classification of Breast Tumour Using Electrical Impedance and Machine Learning Techniques. Physiol. Meas. 35 (6), 965–974. doi:10.1088/0967-3334/35/6/965
Anand, G., Yu, Y., Lowe, A., and Kalra, A. (2021). Bioimpedance Analysis as a Tool for Hemodynamic Monitoring: Overview, Methods and Challenges. Physiol. Meas. 42 (3), 03TR01. doi:10.1088/1361-6579/abe80e
Barber, D. C., Brown, B. H., and Freeston, I. L. (1984). “Imaging Spatial Distributions of Resistivity Using Applied Potential Tomography - APT,” in Information Processing in Medical Imaging. Editor F. Deconinck (Dordrecht: Springer), 446–462. doi:10.1007/978-94-009-6045-9_26
Bertemes Filho, P. (2002). Tissue Characterisation Using an Impedance Spectrosopy Probe. Sheffield,U K: Doctoral Dissertation, University of Sheffield.
Bertemes-Filho, P., Negri, L. H., Felipe, A., and Vincence, V. C. (2012). Mirrored Modified Howland Circuit for Bioimpedance Applications: Analytical Analysis. J. Phys. Conf. Ser. 407, 012030. doi:10.1088/1742-6596/407/1/012030
Bertemes-Filho, P., Negri, L. H., and Vincence, V. C. (2016). Designing a Mirrored Howland Circuit with a Particle Swarm Optimisation Algorithm. Int. J. Electronics 103 (6), 1029–1037. doi:10.1080/00207217.2015.1082639
Bioscan-, M. (2021). Maltron Bioscan 920-2-S. Available at: https://maltronint.com/bioscan-920-2-s/(Accessed August 1, 2021).
Bolton, M. P., Ward, L. C., Khan, A., Campbell, I., Nightingale, P., Dewit, O., et al. (1998). Sources of Error in Bioimpedance Spectroscopy. Physiol. Meas. 19 (2), 235–245. doi:10.1088/0967-3334/19/2/011
Brown, B. (2003). Electrical Impedance Tomography (EIT): a Review. J. Med. Eng. Technology 27 (3), 97–108. doi:10.1080/0309190021000059687
Brown, B. H., Smallwood, R. H., Barber, D. C., Lawford, P., and Hose, D. (2017). Medical Physics and Biomedical Engineering: Medical Science Series. Boca Raton, Florida, United States: CRC Press.
Brown, B. H., Barber, D. C., Morice, A. H., and Leathard, A. D. (1994). Cardiac and Respiratory Related Electrical Impedance Changes in the Human Thorax. IEEE Trans. Biomed. Eng. 41 (8), 729–734. doi:10.1109/10.310088
Brown, B. H., Tidy, J. A., Boston, K., Blackett, A. D., Smallwood, R. H., and Sharp, F. (2000b). Relation between Tissue Structure and Imposed Electrical Current Flow in Cervical Neoplasia. The Lancet 355 (9207), 892–895. doi:10.1016/s0140-6736(99)09095-9
Brown, B. H., Wilson, A. J., and Bertemes-Filho, P. (2000a). Bipolar and Tetrapolar Transfer Impedance Measurements from Volume Conductor. Electron. Lett. 36 (25), 2060–2062. doi:10.1049/el:20001439
Castro, J. A., Olmo, A., Pérez, P., and Yúfera, A. (2016). Microcontroller-Based Sinusoidal Voltage Generation for Electrical Bio-Impedance Spectroscopy Applications. Jcc 04 (17), 51–58. doi:10.4236/jcc.2016.417003
Cheng, Z., Carobbio, A. L. C., Soggiu, L., Migliorini, M., Guastini, L., Mora, F., et al. (2020). SmartProbe: a Bioimpedance Sensing System for Head and Neck Cancer Tissue Detection. Physiol. Meas. 41 (5), 054003. doi:10.1088/1361-6579/ab8cb4
Dechent, D., Emonds, T., Stunder, D., Schmiedchen, K., Kraus, T., and Driessen, S. (2020). Direct Current Electrical Injuries: A Systematic Review of Case Reports and Case Series. Burns 46 (2), 267–278. doi:10.1016/j.burns.2018.11.020
Fein, A., Grossman, R. F., Jones, J. G., Goodman, P. C., and Murray, J. F. (1979). Evaluation of Transthoracic Electrical Impedance in the Diagnosis of Pulmonary Edema. Circulation 60 (5), 1156–1160. doi:10.1161/01.CIR.60.5.1156
Gabriel, S., Lau, R. W., and Gabriel, C. (1996). The Dielectric Properties of Biological Tissues: II. Measurements in the Frequency Range 10 Hz to 20 GHz. Phys. Med. Biol. 41 (11), 2251–2269. doi:10.1088/0031-9155/41/11/002
Geselowitz, D. B. (1971). An Application of Electrocardiographic lead Theory to Impedance Plethysmography. IEEE Trans. Biomed. Eng. BME-18 (1), 38–41. doi:10.1109/tbme.1971.4502787
Grando Sirtoli, V., Coelho Vincence, V., and Bertemes-Filho, P. (2019). Mirrored Enhanced Howland Current Source with Feedback Control. Rev. Scientific Instr. 90 (2), 024702. doi:10.1063/1.5079872
Grimnes, S., and Martinsen, O. (2008). Bioelectricity and Bioimpedance Basics. Cambridge, Massachusetts: Academic Press.
Hao, Z., Yue, S., Sun, B., and Wang, H. (2017). Optimal Distance of Multi-Plane Sensor in Three-Dimensional Electrical Impedance Tomography. Computer Assist. Surg. 22 (Suppl. 1), 326–338. doi:10.1080/24699322.2017.1389412
Holder, D. S. (2004). Electrical Impedance Tomography: Methods, History and Applications. Boca Raton, Florida, United States: CRC Press.
Huerta-Nuñez, L. F. E., Gutierrez-Iglesias, G., Martinez-Cuazitl, A., Mata-Miranda, M. M., Alvarez-Jiménez, V. D., Sánchez-Monroy, V., et al. (2019). A Biosensor Capable of Identifying Low Quantities of Breast Cancer Cells by Electrical Impedance Spectroscopy. Sci. Rep. 9 (1), 6419. doi:10.1038/s41598-019-42776-9
IEC (2004). The general standard IEC 60601-1 - Medical electrical equipment - Part 1: General requirements. European Committee for Electrotechnical Standardization, Pub. By. The Central Secretariat, rue de Stassart 35, B-1050, Brussels, Belgium, The relevant section on patient auxiliary current is 8.7, 1.
Islam, N., Rabbani, K. S.-e., and Wilson, A. (2010). The Sensitivity of Focused Electrical Impedance Measurements. Physiol. Meas. 31 (8), S97–S109. doi:10.1088/0967-3334/31/8/S08
Izadnegahdar, R., Cohen, A. L., Klugman, K. P., and Qazi, S. A. (2013). Childhood Pneumonia in Developing Countries. Lancet Respir. Med. 1 (7), 574–584. doi:10.1016/S2213-2600(13)70075-4
Jenkins, H. E. (2016). Global burden of Childhood Tuberculosis. Pneumonia 8 (1), 1–7. doi:10.1186/s41479-016-0018-6
Kadir, M. A., Baig, T. N., and Rabbani, K. S.-e. (2015). Focused Impedance Method to Detect Localized Lung Ventilation Disorders in Combination with Conventional Spirometry. Biomed. Eng. Appl. Basis Commun. 27 (03), 1550029. doi:10.4015/S1016237215500295
Kadir, M. A., and Rabbani, K. S.-e. (2018). Use of a Conical Conducting Layer with an Electrical Impedance Probe to Enhance Sensitivity in Epithelial Tissues. J. Electr. Bioimpedance 9 (1), 176–183. doi:10.2478/joeb-2018-0022
Leeming, M. N., Ray, C., and Howland, W. S. (1970). Low-voltage, Direct-Current burns. JAMA 214 (9), 1681–1684. doi:10.1001/jama.214.9.1681
Lukaski, H. C., Vega Diaz, N., Talluri, A., and Nescolarde, L. (2019). Classification of Hydration in Clinical Conditions: Indirect and Direct Approaches Using Bioimpedance. Nutrients 11 (4), 809. doi:10.3390/nu11040809
Mansouri, S., Alhadidi, T., and Ben Azouz, M. (2020). Breast Cancer Detection Using Low-Frequency Bioimpedance Device. Bctt Vol. 12, 109–116. doi:10.2147/bctt.s274421
Margo, C., Katrib, J., Nadi, M., and Rouane, A. (2013). A Four-Electrode Low Frequency Impedance Spectroscopy Measurement System Using the AD5933 Measurement Chip. Physiol. Meas. 34 (4), 391–405. doi:10.1088/0967-3334/34/4/391
Martinsen, Ø. G., and Grimnes, S. (2009). “The Concept of Transfer Impedance in Bioimpedance Measurements,” in 4th European Conference of the International Federation for Medical and Biological Engineering (Berlin/Heidelberg, Germany: Springer), 1078–1079. doi:10.1007/978-3-540-89208-3_257
McEwan, A., Cusick, G., and Holder, D. S. (2007). A Review of Errors in Multi-Frequency EIT Instrumentation. Physiol. Meas. 28 (7), S197–S215. doi:10.1088/0967-3334/28/7/s15
Morais, C. C. A., Safaee Fakhr, B., De Santis Santiago, R. R., Di Fenza, R., Marutani, E., Gianni, S., et al. (2021). Bedside Electrical Impedance Tomography Unveils Respiratory "Chimera" in COVID-19. Am. J. Respir. Crit. Care Med. 203 (1), 120–121. doi:10.1164/rccm.202005-1801im
Mulasi, U., Kuchnia, A. J., Cole, A. J., and Earthman, C. P. (2015). Bioimpedance at the Bedside. Nutr. Clin. Pract. 30 (2), 180–193. doi:10.1177/0884533614568155
Nguyen, D. T., Kosobrodov, R., Barry, M. A., Chik, W., Jin, C., Oh, T. I., et al. (2013). Electrode-Skin Contact Impedance: In Vivo Measurements on an Ovine Model. J. Phys. Conf. Ser. 434, 012023. doi:10.1088/1742-6596/434/1/012023
Pallas-Areny, R., and Webster, J. G. (1993). AC Instrumentation Amplifier for Bioimpedance Measurementsfier for Bioimpedance Measurements. IEEE Trans. Biomed. Eng. 40 (8), 830–833. doi:10.1109/10.238470
Pettersen, F. J., Ferdous, H., Kalvøy, H., Martinsen, Ø. G., and Høgetveit, J. O. (2014). Comparison of Four Different FIM Configurations-A Simulation Study. Physiol. Meas. 35 (6), 1067–1082. doi:10.1088/0967-3334/35/6/1067
Pino, E. J., Gomez, B., Monsalve, E., and Aqueveque, P. (2019). “Wireless Low-Cost Bioimpedance Measurement Device for Lung Capacity Screening,” in 2019 41st Annual International Conference of the IEEE Engineering in Medicine and Biology Society (EMBC) (Piscataway, New Jersey, United States: IEEE), 1187–1190. doi:10.1109/EMBC.2019.8857387
Rabbani, K. S.-e. (2018). “Focused Impedance Method: Basics and Applications,” in Bioimpedance in Biomedical Applications and Research. Editors F. Simini, and P. Bertemes-Filho (Cham: Springer), 137–185. doi:10.1007/978-3-319-74388-2_9
Rabbani, K. S., Hassan, M., and Kiber, A. (1996). 3D Object Localization Using EIT Measurements at Two Levels. Physiol. Meas. 17 (3), 189–199. doi:10.1088/0967-3334/17/3/005
Rabbani, K. S., and Kabir, A. M. B. H. (1991). Studies on the Effect of the Third Dimension on a Two-Dimensional Electrical Impedance Tomography System. Clin. Phys. Physiol. Meas. 12 (4), 393–402. doi:10.1088/0143-0815/12/4/009
Rabbani, K. S., and Karal, M. A. S. (2008). A New Four-Electrode Focused Impedance Measurement (FIM) System for Physiological Study. Ann. Biomed. Eng. 36 (6), 1072–1077. doi:10.1007/s10439-008-9470-7
Rabbani, K. S., Sarker, M., Akond, M. H. R., and Akter, T. (1999). Focused Impedance Measurement (FIM): a New Technique with Improved Zone Localization. Ann. NY Acad Sci 873 (1), 408–420. doi:10.1111/j.1749-6632.1999.tb09490.x
Rosell, J., and Riu, P. (1992). Common-mode Feedback in Electrical Impedance Tomography. Clin. Phys. Physiol. Meas. 13 (A), 11–14. doi:10.1088/0143-0815/13/a/002
Roy, S. K., Karal, M. A. S., Kadir, M. A., and Rabbani, K. S.-e. (2019). A New Six-Electrode Electrical Impedance Technique for Probing Deep Organs in the Human Body. Eur. Biophys. J. 48 (8), 711–719. doi:10.1007/s00249-019-01396-x
Sanchez, B., Vandersteen, G., Bragos, R., and Schoukens, J. (2012). Basics of Broadband Impedance Spectroscopy Measurements Using Periodic Excitations. Meas. Sci. Technol. 23 (10), 105501. doi:10.1088/0957-0233/23/10/105501
Scientific Instruments (2019). Sciospec Sciospec ISX-5, Scientific Instruments GmbH. Available at: https://www.sciospec.com/product/isx-5/(Accessed August 1, 2021).
Seoane, F., Ferreira, J., Sanchéz, J. J., and Bragós, R. (2008). An Analog Front-End Enables Electrical Impedance Spectroscopy System On-Chip for Biomedical Applications. Physiol. Meas. 29 (6), S267–S278. doi:10.1088/0967-3334/29/6/S23
Surovy, N. J., Billah, M. M., Haowlader, S., Al-Quaderi, G. D., and Rabbani, K. S.-e. (2012). Determination of Abdominal Fat Thickness Using Dual Electrode Separation in the Focused Impedance Method (FIM). Physiol. Meas. 33 (5), 707–718. doi:10.1088/0967-3334/33/5/707
Tidy, J. A., and Brown, B. H. (2021). Clinical Utility of ZedScan when Used as an Adjunct to Colposcopy. Indian J. Gynecol. Oncolog 19 (3), 55. doi:10.1007/s40944-021-00540-w
Vermeiren, E., Ysebaert, M., Van Hoorenbeeck, K., Bruyndonckx, L., Van Dessel, K., Van Helvoirt, M., et al. (2021). Comparison of Bioimpedance Spectroscopy and Dual Energy X-ray Absorptiometry for Assessing Body Composition Changes in Obese Children during Weight Loss. Eur. J. Clin. Nutr. 75 (1), 73–84. doi:10.1038/s41430-020-00738-9
Wilson, A. J., Milnes, P., Waterworth, A. R., Smallwood, R. H., and Brown, B. H. (2001). Mk3.5: a Modular, Multi-Frequency Successor to the Mk3a EIS/EIT System. Physiol. Meas. 22 (1), 49–54. doi:10.1088/0967-3334/22/1/307
Worapishet, A., Demosthenous, A., and Liu, X. (2011). A CMOS Instrumentation Amplifier with 90-dB CMRR at 2-MHz Using Capacitive Neutralization: Analysis, Design Considerations, and Implementation. IEEE Trans. Circuits Syst. 58 (4), 699–710. doi:10.1109/TCSI.2010.2078850
Yang, L., Dai, M., Xu, C., Zhang, G., Li, W., Fu, F., et al. (2017). The Frequency Spectral Properties of Electrode-Skin Contact Impedance on Human Head and its Frequency-dependent Effects on Frequency-Difference EIT in Stroke Detection from 10Hz to 1MHz. PloS one 12 (1), e0170563. doi:10.1371/journal.pone.0170563
Ye, G., Lim, K. H., George, R. T., Ybarra, G. A., Joines, W. T., and Liu, Q. H. (2008). 3D EIT for Breast Cancer Imaging: System, Measurements, and Reconstruction. Microw. Opt. Technol. Lett. 50 (12), 3261–3271. doi:10.1002/mop.23932
Keywords: electrical bioimpedance, multi-frequency bioimpedance, FIM, bioinstrumentation, impedance spectroscopy, focused impedance method
Citation: Kadir MA, Wilson AJ and Siddique-e Rabbani K (2021) A Multi-Frequency Focused Impedance Measurement System Based on Analogue Synchronous Peak Detection. Front. Electron. 2:791016. doi: 10.3389/felec.2021.791016
Received: 07 October 2021; Accepted: 23 November 2021;
Published: 10 December 2021.
Edited by:
Pedro Bertemes-Filho, Santa Catarina State University, BrazilReviewed by:
Hassan Yazdanian, K.N.Toosi University of Technology, IranCopyright © 2021 Kadir, Wilson and Rabbani. This is an open-access article distributed under the terms of the Creative Commons Attribution License (CC BY). The use, distribution or reproduction in other forums is permitted, provided the original author(s) and the copyright owner(s) are credited and that the original publication in this journal is cited, in accordance with accepted academic practice. No use, distribution or reproduction is permitted which does not comply with these terms.
*Correspondence: K. Siddique-e Rabbani, cmFiYmFuaUBkdS5hYy5iZA==
Disclaimer: All claims expressed in this article are solely those of the authors and do not necessarily represent those of their affiliated organizations, or those of the publisher, the editors and the reviewers. Any product that may be evaluated in this article or claim that may be made by its manufacturer is not guaranteed or endorsed by the publisher.
Research integrity at Frontiers
Learn more about the work of our research integrity team to safeguard the quality of each article we publish.