 Wanchun Zhao1,2
 Zhipeng Yang
- 1National Key Laboratory of Green Multi-Resource Collaborative Onshore Shale Oil Exploitation, Daqing, China
- 2Innovation Team of Geological and Engineering Integration Fracturing and Prevention and Control Technology for Shale Oil, Daqing, China
- 3School of Petroleum Engineering, Northeast Petroleum University, Daqing, China
- 4School of Electrical and Information Engineering, Northeast Petroleum University, Daqing, China
- 5Oil Production Technology Research Institute of Jidong Oilfield Company, PetroChina, Tangshan, China
Wellbore stability is a key factor in ensuring safe and efficient drilling operations. The variation in Equivalent Circulating Density (ECD) has a significant impact on safety, economics, and drilling progress. As unconventional resources like shale gas and tight oil are explored, geological conditions and reservoir characteristics have become more complex. These complexities lead to narrower density windows, making precise ECD control essential. Proper control can prevent incidents such as lost circulation, blowouts, and wellbore collapse. This study establishes a new ECD calculation model. The model accounts for total fluid pressure loss, formation temperature, and formation pressure. An ECD prediction model based on drilling parameters and segmented reservoir layers is also proposed. The model uses nonlinear regression algorithms to predict ECD values for different members. It integrates real-time drilling data such as depth, drilling pressure, displacement, and rotational speed, along with formation temperature and pressure. The model also optimizes drilling parameters to keep the ECD within the safe density window. Case studies from a high-temperature, high-pressure volcaniclastic reservoir well in the Nanpu region validate the models. The correlation coefficients (R2) of the calculation and prediction models exceed 0.99. After optimization, the ECD for Ed2, Ed3, Es1, and Es31 remains within the safe window. This significantly improves wellbore stability and ensures operational safety. The results reveal notable differences in regression coefficients across different members. This confirms the necessity of using member-specific ECD prediction models. Additionally, the safe parameter ranges provided by this study offer practical guidance for drilling design. These models have broad application prospects, especially in complex geological environments.
1 Introduction
Maintaining wellbore stability is crucial for safe and efficient drilling operations. ECD, a key parameter reflecting downhole pressure and fluid behavior, directly impacts drilling safety and economics. As petroleum exploration advances into unconventional resources, geological conditions and reservoir characteristics become more complex. Many oil and gas reservoirs exhibit high heterogeneity. Variations in rock properties, porosity, permeability, and stress distribution lead to significant changes in reservoir conditions. These factors increase the complexity of formation pressure, temperature, and fluid behavior. Adefemi et al. (2024) explored the complex conditions of high-temperature high-pressure (HPHT) drilling, summarizing a series of challenges present in HPHT reservoirs. In high-temperature conditions, drilling fluids, equipment, and materials can undergo thermal degradation, increasing the risk of formation fluid influx and well control issues. The corrosion and wear rates of downhole tools and equipment are accelerated, and thermal expansion and contraction occur, reducing the efficiency and reliability of drilling operations. In high-pressure conditions, the risk of well leaks and well control accidents is increased due to overburden pressure and formation stress, compromising the stability and integrity of the wellbore, and making it difficult to control the downhole pressure differential and manage formation fluids. Rocha et al. (2003) presented insights into Petrobras’s experiences with deepwater and ultra-deepwater drilling, highlighting that geological hazards in deepwater environments pose significant challenges. These hazards encompass active fault lines, seabed erosion, overpressured sands at shallow depths, landslides, steep and unstable slopes, gas hydrates, and ground conditions that vary from weak, underconsolidated soils to solid rock. Additionally, there are potentially corrosive soils that may necessitate specially designed conductors. All these factors can impact the stability and cost-effectiveness of drilling operations. Therefore, in extreme environments such as HTHP, deepwater, and deep wells, the challenges faced by drilling operations are even more severe. Due to the uncertainty and variability of formation conditions, ECD within the wellbore becomes more difficult to control, and the safe density window becomes narrow, forming a narrow density window. In actual drilling operations, variations in ECD can pose significant challenges, especially under extreme conditions such as HPHT wells. Instability in ECD may lead to severe issues, such as kicks, wellbore collapse, or even blowouts. Under narrow density window conditions, precise ECD control is crucial for maintaining wellbore stability and ensuring the safety of the drilling operation.
Traditionally, downhole tools have been used to monitor ECD fluctuations and prevent well control problems such as formation fractures, blowouts, and gas kicks. These tools rely on sensors and data acquisition systems but often require high maintenance costs and are affected by extreme downhole conditions. In some HPHT wells, downhole tools may fail. With advancements in sensing technology, data monitoring, and numerical simulation, real-time ECD prediction has become a practical alternative. Using collected drilling parameters and advanced mathematical models, ECD values can be predicted to keep them within the safe density window. Existing ECD prediction models integrate multi-dimensional data, including drilling, geological, and engineering parameters. These models calculate ECD values to ensure they remain within safe limits. Al-Rubaii et al. (2023) proposed novel models for predicting ECD and mud weight (MW) by utilizing Support Vector Machines (SVM), Artificial Neural Networks (ANN), and Decision Trees (DT), with surface drilling parameters serving as input data. The correlation coefficients (R2) were all above 0.9, and these models are used for real-time prediction of ECD and MW without the need for downhole tools, thereby saving costs and time. Elzenary et al. (2018) introduced an innovative approach to predict ECD values during drilling without relying on downhole tools. This method employs ANN and Adaptive Neuro-Fuzzy Inference Systems (ANFIS) to evaluate ECD throughout the drilling process, thereby minimizing the dependency on costly and intricate downhole equipment. Chen et al. (2024) carried out a case study on the Pengzhou X well in the Leikou slope formation of Western Sichuan, investigating how varying mud densities affect displacement rates and bottomhole pressures through numerical simulation. They developed an optimal mud density model for fractured formations with narrow density windows, concluding that an increase in mud density results in a decrease in the annular upward flow velocity. This change could capture fracture gases in the upper annulus, with the ideal mud density lying within this narrow range. Li et al. (2022) proposed an integrated geomechanics approach that combines theoretical analysis with numerical simulation. By collecting extensive geological, seismic, drilling, and logging data, they selected appropriate theoretical models to predict and calculate the in-situ stress, pore pressure, fracture pressure, collapse pressure, and rock mechanics parameters for Well A. They created a four-tier pressure profile for the formation, which led to the determination of the safe drilling fluid density window for the well. Furthermore, they conducted numerical simulation of wellbore stability using the ABAQUS software. Li et al. (2021) carried out a survey study, combining the actual situation of a deep oil and gas reservoir in Northwest China, identifying formation pressure segments in different regions and adjusting formation fracture pressure based on actual leakage occurrences. They used this to set the drilling fluid density as a standard for assessing the risk of lost circulation, offering a method to define regional narrow density windows through big data. Zhang et al. (2024b) developed a mathematical model to simulate the temperature and pressure calculations in the annulus during gas drilling in narrow density window formations, considering the conservation of liquid mass, gas mass, additional energy conservation of other components in the wellbore annular formation system, and the gas-liquid slip velocity equation, predicting the temperature and pressure in the annulus of Well XX1. Wei et al. (2024) predicted the safe MW range and the lower limit of mud density for the horizontal section of the Luzhou block, using conventional logging data. They employed the Discrete Element Method (DEM) to validate collapse pressure predictions and explored the influence of in-situ stress, wellbore pressure, natural fracture density and rock cohesion, on wellbore collapse. Zhang et al. (2019) investigated the role of the mud seal barrier on shale formations, incorporating a flow-diffusion coupling model to develop a calculation method for determining the safe drilling mud density. This model accounts for the combined effects of sealing, inhibition, and back-osmosis actions of the drilling mud on shale. Their analysis demonstrated that improving the sealing ability of the mud can significantly reduce the transmission of pore pressure and the diffusion of solutes within the shale formation. Moreover, they identified that the inhibition capability of the mud plays a crucial role in determining the collapse pressure of shale sections with notable hydration tendencies. Li et al. (2024) investigated the impact of methane behavior in organic pores on fluid flow and pressure distribution within the wellbore through molecular simulations, providing scientific evidence for ECD control and optimization of drilling parameters. Ekechukwu and Adejumo (2024) utilized the Extreme Gradient Boosting (XGBoost) method to forecast ECD values, employing performance metrics such as the Root Mean Square Error (RMSE) and the R2 to assess the accuracy and reliability of their prediction model. The use of RMSE provided insight into the model’s error magnitude, while R2 helped determine the proportion of variance in the data explained by the model, offering a comprehensive evaluation of its predictive capabilities. Their results showed that for the training data, R2 was 1.00 and RMSE was 0.0005, while for the test/blind dataset, R2 was 0.989 and RMSE was 0.023. These findings demonstrated that the proposed model outperformed those developed with other common machine learning methods. They also concluded that hook weight, standpipe pressureand and MW were the most significant factors in predicting ECD values. Ma et al. (2019) developed a model for horizontal well drilling and ECD management, incorporating seabed conditions, temperature, drill pipe rotation, drill pipe eccentricity, and the cutting bed. By analyzing how ECD responds to drilling parameters, they identified sensitive factors such as mud density and viscosity. A real-time correction method for ECD under varying conditions was suggested through non-dimensional factor comparisons. Kandil et al. (2023) utilized three machine learning algorithms—ANN, Passive-Aggressive Regressor (PAR) and K-Nearest Neighbors (KNN), —to predict ECD. These models, based on 14 key operational parameters from downhole sensors during drilling operations, including annular temperature, annular pressure, and rate of penetration (ROP), demonstrated that the ANN model achieved very high accuracy, with R2 values close to 0.999 for training, validation, and testing. The RMSE values for overall, training, validation, and testing datasets were 0.000211, 0.000253, 0.00293, and 0.00315, respectively. Alsaihati and Elkatatny (2021) used real field data from Well 1 to estimate ECD in horizontal wells, applying SVM, Functional Networks (FN),and Random Forest (RF) methods. They also demonstrated how Principal Component Analysis (PCA) could be used to reduce the dimensionality of the dataset without sacrificing essential information. Gao and Fan (2024) established an ECD prediction model using the RF, considering 11 parameters (e.g., well depth, ROP, mud density, pump rate, mud pit gain, etc.), which has the ability to ensure that the bottomhole pressure is within a safe range, avoid dangerous accidents, and minimize non-productive time. However, these prediction models often fail to fully consider the property changes of different members, especially in complex reservoirs with multiple members, where a single prediction model may have certain limitations.
Therefore, this study aims to propose an ECD prediction model based on drilling parameters and members, optimizing various parameters in the drilling process segment by members to ensure that ECD values are controlled within a safe range. By accurately simulating ECD changes in different members, further improve the safety and precision of drilling operations.
2 Methods and principles
2.1 Parameter selection for the ECD model
Currently, ECD prediction models typically incorporate a variety of drilling, geological, and engineering parameters as input parameters to accurately predict changes in ECD within the formation. Among these parameters, ECD prediction models that take drilling parameters as inputs exhibit significant advantages. Badrouchi et al. (2022) explored the use of Mechanical Specific Energy (MSE) for optimizing hole cleaning and managing ECD, proposing a novel model to predict ECD in vertical and inclined wells. This model incorporates factors such as fluid and formation properties, drill string geometry and wellbore, and drilling operation parameters, ensuring that ECD stays within the safe density range. Gamal et al. (2021) applied machine learning methods, including ANN and Adaptive Network-based Fuzzy Inference Systems (ANFIS), to drilling data from horizontal well sections. They used parameters like drilling speed, rotation speed, torque, bit weight, suction speed, and standpipe pressure to predict ECD from drilling data with high precision. Abdelgawad et al. (2019) developed a novel method for evaluating ECD using artificial intelligence techniques, with MW, drill pipe pressure, and ROP as parameters. In the oil well design process, empirical correlations developed for the ANN model can be used to select the appropriate MW based on expected drilling parameters to safely drill. This approach also minimizes drilling issues related to ECD. Yang et al. (2024) employed a Generalized Regression Neural Network (GRNN) to build a model based on time series data of drilling parameters. They used intelligent optimization algorithms to fine-tune the model’s parameters and tested its generalization capability and accuracy by comparing it with actual and simulated data, enabling real-time prediction of bottomhole ECD in deepwater drilling. Drilling parameters can provide multifaceted information about the reservoir (such as depth, pressure changes, drill bit performance, etc.), and taking these factors into account comprehensively can more accurately predict fluid behavior and density changes in various reservoirs. For unconventional reservoirs, data collected during drilling helps capture the heterogeneity and complexity of the reservoir, thereby improving the prediction accuracy of the equivalent circulating density. ECD prediction models that take drilling parameters as input parameters, combined with a large amount of real-time data obtained during the drilling process, can more accurately predict ECD values.
2.2 ECD prediction for different member
In petroleum engineering, due to the differences in formation lithology, reservoir burial depth, and formation pressure, direct simulation calculations for the entire area are often challenging to perform accurately. The division of strata provides us with lithological and lithofacial characteristics; utilizing geological stratification for simulation not only considers the distribution of various parameters in different strata but also facilitates an in-depth exploration of the mechanisms related to these parameters in different strata. This type of stratified simulation has been extensively used in multiple areas of the petroleum industry. Wang (2016) took Well Dong 11 as an example, considering many potential complexities during the drilling process, such as the loosely cemented upper formations and high risk of hole collapse, leakage in the Cretaceous formations, mudstone slumping in the Jurassic, and the possible existence of high-pressure saline zones and hydrocarbon zones in the Sanguhe Formation. In the upper section of the well, PDC bits were used, and in the lower section, PDC bits combined with spiral drilling technology were applied. The feasibility of the plan was verified through good hole size maintenance. Li (2015) took the key risk exploration well, Anshun No.1, as an example, determined engineering difficulties based on the analysis of geological information, optimized well structure, selected appropriate drilling methods and mud systems, and supported drilling technical measures to form a drilling technical plan suitable for the marine formations in that block. Yavari et al. (2023) proposed an innovative method for optimizing controllable drilling parameters using electric downhole tools in specific geological formations. This approach combines data mining techniques with mathematical modeling to create a multi-objective optimization framework, designed to pinpoint the most effective drilling parameters. The methodology was applied to the drilling data collected from the Dariyan Formation, where the data mining technique successfully identified a well-distributed dataset, encompassing both the ideal and less-optimal drilling conditions. This comprehensive dataset allowed for a more accurate identification of the key drilling variables that influence performance, providing valuable insights into the factors that govern the drilling process in these specific formations. Wang et al. (2023) focused on eliminating or reducing stick-slip vibrations in drill string torsional vibrations to enhance the ROP. They developed a multi-dimensional torsional vibration model for the drill string, incorporating a stick-slip vibration model that considers drilling speed. Through simulation analysis, the model was validated, and the characteristics of stick-slip vibrations were studied in steady, slip, and stick phases. Based on this analysis, they established a relationship between drilling parameters and ROP, optimizing parameters for soft, medium-hard, and hard formations. Zhang et al. (2015) took into account a variety of reservoir characteristics and employed a combination of finite element analysis (FEA) and discrete element methods (DEM) to develop a comprehensive model for simulating hydraulic fracture propagation in tight oil reservoirs. The model incorporated several key factors, including variations in horizontal stress, the number and spacing of perforation clusters, injection rates, and the density of natural fractures within the reservoir. By integrating these variables, the model was able to more accurately represent the complex behavior of hydraulic fractures in tight formations. Rao et al. (2024) developed a new numerical formula for modeling two-phase flow in fractured reservoirs, based on reservoir characteristics. The formula was created using a mixed finite difference and streamline (MFD-SL) method, where the pressure equation was discretized with the simulated finite difference (MFD), and the saturation equation was solved using the streamline (SL) method. This hybrid formula was implemented in a discrete fracture model (DFM) and operated similarly to IMPES. Yin et al. (2023) improved the coupled fluid-solid model in PFC2D for shale reservoirs by incorporating mechanical parameters obtained from laboratory experiments. They developed a Discrete Element Method (DEM) model specifically for hydraulic fracturing in shale reservoirs, aiming to explore the factors that influence the propagation of hydraulic fractures. Zhan et al. (2024) utilized numerical simulation methods to combine a multi-stage fracturing horizontal well non-steady seepage model with a dilation-recompaction model to develop the DG model. This model used segmented logging and production data to construct a geological model of shale reservoirs, enabling history matching on a multi-stage basis, and provided a detailed analysis of the entire reservoir, replicating the distribution relationship between reconstructed areas and overall productivity. Zhang et al. (2024a) conducted true triaxial fracturing experiments on three horizontal wells with large specimens (400 mm × 400 mm × 400 mm), studying hydraulic fracture propagation in multi-well fracturing processes in conglomerate reservoirs. They examined the effects of in-situ stress, fracturing sequence, vertical well spacing, and fracture initiation position on fracture evolution. Tang et al. (2024) developed a comprehensive numerical model to simulate the entire fracturing-production process in shale gas wells. This model was based on the displacement discontinuity method combined with the discrete fracture unified network model. By employing a sequential iterative numerical approach, they incorporated the influence of natural fractures and matrix characteristics on the fracturing process. Additionally, the model utilized post-fracturing formation pressure and water saturation distribution as inputs for subsequent simulations. The result was a more precise representation of fracturing and production dynamics, highlighting the crucial role of reservoir properties in fracture propagation.
In recent years, although there has been relatively little research on ECD prediction models by drilling parameters for different members, the research outcomes of the aforementioned scholars demonstrate that it is indeed feasible to optimize drilling parameters and maintain wellbore stability by establishing ECD prediction models by drilling parameters for different members.
2.3 Drilling process and tripping process
The drilling process and the tripping process are two distinct operational phases in drilling operations, each involving different tasks and steps. The drilling process involves the rotation of the drill bit to cut through underground rock formations, gradually forming a wellbore. The purpose is to provide a passage for the extraction of oil or natural gas, ensure the stability of the wellbore, prevent wellbore collapse, and prepare for subsequent operations such as completion or fracturing. The tripping process, on the other hand, involves operations such as changing or inserting drill strings and maintenance during the drilling process, specifically referring to the process of extracting or inserting drill pipes or tools into the wellbore. In short, the tripping process mainly refers to the entry and exit of drilling tools in the wellbore. In this process, trip-out speed and vibration pressure are key influencing factors. The trip-out speed determines the rate at which the drilling tools are lowered into the wellbore, while vibration pressure is caused by the vibration or impact of the drilling tools, often stemming from the interaction between the tools and the wellbore walls. Proper control of trip-out speed and vibration pressure is crucial for wellbore stability. Shan et al. (2023) carried out an extensive study to understand how drill string vibrations influence wellbore stability. They created a flexible simulation model for drill string dynamics using finite element analysis and collected real drilling vibration data through a downhole vibration measurement device. This data was then used to validate the accuracy of the simulation model. By establishing critical conditions for potential wellbore damage, they developed a method to evaluate wellbore stability, examining how different drilling parameters and drill string configurations impact stability. Their findings revealed that vibrations in the drill string during the drilling process play a significant and sometimes decisive role in maintaining wellbore stability, highlighting the need to carefully manage these vibrations to prevent wellbore damage. Wang et al. (2021) employed the finite element analysis software ADINA to build a model simulating drill string stress changes after collisions with the wellbore under various conditions. The study demonstrated that certain factors, such as drilling fluid with higher viscosity, reduced rotation and self-rotation speeds of the drill string, and a larger annular space, contribute to lowering the stress caused by drill string-wellbore collisions. These conditions were found to enhance both the safety and overall stability of the drill string, suggesting practical measures to mitigate stress and reduce the risk of damage during drilling operations. Yan et al. (2014) performed a thorough analysis of geological and engineering data from the Fergana Basin, revealing that wellbore instability is a key factor hindering drilling efficiency in the region. The study pointed out that in formations with complex bedding structures and multiple high-pressure systems, wellbore instability often leads to frequent and severe issues such as sticking, wellbore collapse, lost circulation, and well kicks. These problems pose significant challenges to maintaining drilling progress and safety, particularly in such geologically complex environments, making it essential to develop strategies that address wellbore stability in these areas.
Therefore, when establishing different members ECD prediction model based on drilling parameters, it is essential to fully consider the different states of the drilling process and the tripping process to ultimately achieve accurate ECD prediction.
2.4 ECD calculation model
In the current state, there is no direct calculation formula between ECD and drilling parameters. Therefore, it is necessary to first establish an ECD calculation model to predict based on the calculated values of ECD. It is assumed that the density of the drilling fluid is uniformly distributed throughout the wellbore, and the effects of temperature and pressure variations on the density are not considered. The pore pressure difference is assumed to have a linear relationship with depth. The height of the liquid column is considered constant, and the flow of the drilling fluid is assumed to be in a steady-state condition. Typically, the ECD value is calculated using the following formula (Bybee, 2009; Wu et al., 2022):
In the formula, Ca represents the solid concentration in the annular space, %; ρs is the density of the cuttings, g/cm3; Δp is the pressure loss of the fluid passing through the wellbore, MPa; a is the unit conversion coefficient, which is equal to 8.345; Δz is the height of the wellbore, m; v is the fluid velocity, m/s; ρ is the fluid density, g/cm3; g is the acceleration due to gravity, s/m2; f is the friction factor, which is calculated and related to the fluid Reynolds number; L is the length of the wellbore, m; Ki is a loss coefficient related to the direction in the wellbore; Dh is the hydraulic diameter, m; Re is the fluid Reynolds number; Ks is the roughness of the wellbore, mm.
The calculation model derived from Equations 1–6 approximates the pressure loss of drilling fluid flow as the pressure consumption in the annulus, which facilitates the computation of the model, but reduces its accuracy. The total pressure loss of the drilling fluid flow should also take into account the pressure loss during the process of the drilling fluid flowing through the surface lines and the riser (drill pipe) after it emerges from the drilling pump. Ashena et al. (2021) modified the Bingham Plastic model and applied a correction factor of 1.08–1.12 to the turbulent pressure loss equation, establishing a model for the total pressure loss of the drilling fluid. It is assumed that the fluid has a fixed yield stress and plastic viscosity, and that the fluid exhibits linear rheological properties once the shear stress exceeds the yield stress. The effects of temperature and pressure variations on the yield stress and viscosity are neglected. It is also assumed that the shear rate remains constant throughout the flow process, and the time-dependent effects in the flow are ignored. The formula is as follows.
In the formula: ΔPtotal is the total pressure loss, MPa; ΔPsurf is the pressure drop in the surface lines, in MPa; ΔPbit is the pressure drop at the bit, MPa; ∑ΔPlam.Bing is the sum of the laminar pressure drops based on the Bingham Plastic model, MPa; Ct is the correction factor, with a value ranging from 1.08 to 1.12 (depending on the size of the borehole and the type of mud); ∑ΔPturb is the sum of the turbulent pressure drops in the drill string, MPa.
On this basis, taking into account the effects of formation pressure and temperature, the final ECD calculation model is derived as shown below.
In the formula: ΔρT,P represents the change in density due to temperature and pressure.
This formula can more accurately simulate the flow of drilling fluid in complex environments, especially suitable for the HTHP environment of volcaniclastic reservoirs in the Nanpu area.
2.5 ECD computational model validation
Compare the calculation results of the ECD calculation model with the measured ECD data to verify the accuracy of the ECD calculation model. The ECD field data used in this study were obtained from on-site measurements in the Nanpu region. Outliers were removed through pre-processing to ensure consistency in the analysis. Verification is carried out with relevant data from a HTHP well in the Nanpu area. Some data of this well are shown in Table 1.
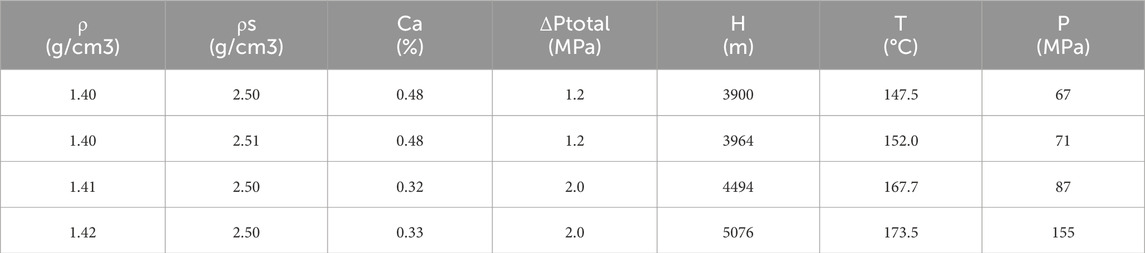
Table 1. Part of the relevant data of a HTHP well in the NanPu area.
Figure 1 presents the fitting results between the calculated ECD values and the actual values for a total of 13,000 data points from the Ed2, Ed3, Es1, and Es31. The four sets of data points in the figure represent the data from the Ed2, Ed3, Es1, and Es31 members, respectively. Each set of data points has a corresponding fitted curve, which is used to show the relationship between the calculated and observed values. The equations of the fitted curves and their R2 values are also labeled in the figure. It can be observed that the R2 value for the Ed2 is 0.9959, for the Ed3 it is 0.9980, for the Es1 section it is 0.9959, and for the Es31 it is 0.9873. These results confirm the accuracy of the ECD calculation model and underscore the necessity of incorporating formation pressure, temperature, and solid concentration in the annular space into the ECD calculations.
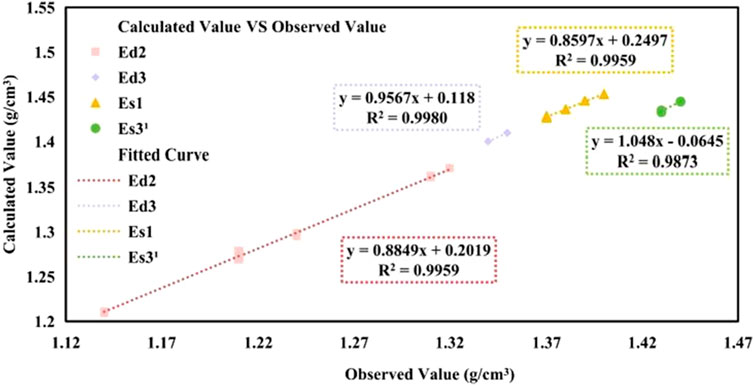
Figure 1. Fitted Curve for each member.
2.6 ECD prediction model
Establishing an ECD prediction model is an effective means of controlling the ECD range within a safe density window. In addition to the various factors considered in the calculation model, when establishing the prediction model, other drilling parameters such as weight on bit and pump pressure must also be included as input parameters to enhance the accuracy of the prediction model. Through multivariate nonlinear regression, an ECD prediction model for drilling is established:
In the formula: Q is the displacement, l/s; n is the rotation speed, r/min; ROP is the rate of penetration, m/h; w is the weight on bit, KN; P is the pump pressure, MPa; T is the formation temperature, °C; Pf is the formation pressure, MPa; an and bn (where n = 1,2,3, … , 8) are regression coefficients, dimensionless.
Based on Equation 9, the predicted value of ECD during drilling can be derived. Using this predicted value to optimize the combination of drilling speed, rotation speed, and displacement during drilling can effectively enhance the stability of the wellbore and the safety of drilling operations.
In the formula: Psw represents the vibration pressure, KPa; Vp is the trip-out speed, m/s; cn and dn (n = 1,2) are regression coefficients, which are dimensionless.
2.7 ECD prediction model validation
The results obtained from the ECD prediction model, which was developed using multivariate nonlinear regression, are compared against those produced by a traditional ECD calculation model to assess the accuracy and reliability of the prediction model. To validate the model, drilling parameters from a HTHP well located in the volcaniclastic reservoir of the Nanpu region are utilized, as detailed in Table 2. The step-by-step process for the model calculation is illustrated in Figure 2, providing a clear depiction of how the model processes the data to predict ECD under these specific conditions.
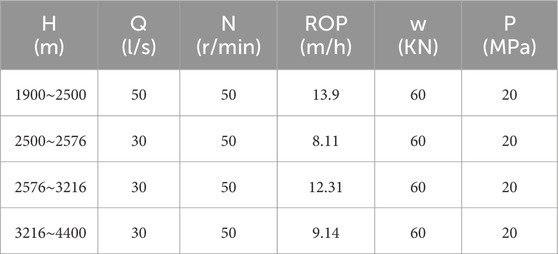
Table 2. Drilling parameters of a HTHP well in a volcaniclastic reservoir in Nanpu area.

Figure 2. Predictive model calculation process.
To further improve the accuracy of the model, during the prediction process when running in hole, the prediction result of the ECD during drilling can be used as an output parameter. In this way, multiple factors considered in the prediction model of the ECD during drilling are incorporated into the calculation, achieving the correlation between the two ECD prediction models. The specific calculation process of the model is shown in Figure 2.
According to Figure 2, the model is implemented using the following computational steps: First, relevant parameters during drilling and tripping are input, and the drilling and tripping ECD prediction equations are established using a multivariate nonlinear regression algorithm. Based on the regression equations and the input parameters, the predicted ECD values for both drilling and tripping are calculated. Then, these predicted ECD values are used to optimize the related parameters, ensuring that the ECD values remain within the safe range, thereby preventing potential risks such as wellbore instability. Finally, the model provides safe drilling and tripping parameters to ensure the safety and stability of the operation.
Following the calculation procedure, ECD predictions were made for different sections of the well. Table 3 presents the an values and R2 for the ECD prediction models during drilling in the Ed2, Ed3, Es1, and Es31. It can be observed that the R2 for the Ed2, Ed3, Es1, and Es31 are 0.9964, 0.9916, 0.9942, and 0.9973, respectively, which indicates that the established prediction models are accurate and reliable.

Table 3. ECD prediction model parameters for each member during drilling.
In Table 3, the R2 of the input parameters vary across different members, which underscores the necessity of conducting simulation predictions for each members separately. By comparing the an of different members, it can be concluded that among these four members, a1>a5>a3>a2>a6>a4.
Table 4 presents the cn values and R2 for the ECD prediction models during tripping in for the Ed2, Ed3, Es1, Es31. It can be observed that the R2 for the Ed2, Ed3, Es1, and Es31 are 0.9951, 0.9927, 0.9985, and 0.9923.
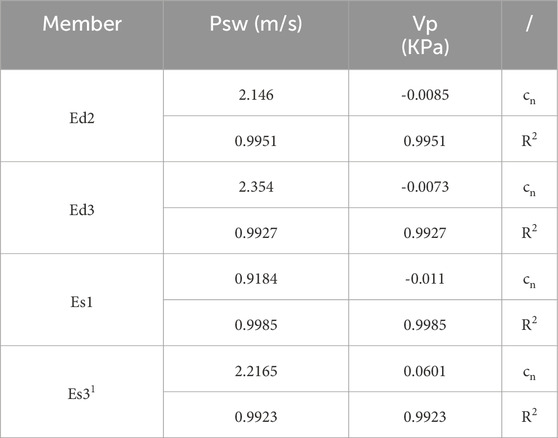
Table 4. ECD prediction model parameters for each member during tripping.
Based on the derived ECD prediction values, a comparison was made with the calculation results obtained from the ECD calculation model, as shown in Figure 3.

Figure 3. Comparison of the calculated and predicted values of ECD.
From Figure 3, it can be observed that the ECD prediction model results derived from the relevant parameters of this well have a high degree of conformity with the results of the ECD calculation model, with an R2 value of 0.9947, which verifies the accuracy of the ECD prediction model.
3 Instance calculations and results
Taking the HTHP well in the volcaniclastic reservoir of the Nanpu area, which was used in the model validation process, as an example, relevant calculation parameters were applied to optimize the drilling parameters during drilling and tripping in for the Ed2, Ed3, Es1, and Es31 to ensure that the final ECD prediction values fall within the safe density window range, in response to wellbore collapse and leakage situations.
To achieve parameter optimization under a narrow density window, it is first necessary to establish a safe density window. Figure 4 shows the collapse pressure equivalent circulating density (Pwh) and loss pressure equivalent circulating density (Plh) curves for Well X. Based on the changes in Pwh and Plh values, the depth region is divided into the loss zone, safe zone, and caving zone. In the loss zone, the ECD value increases significantly, indicating that the pressure caused by fluid entering the formation may lead to leakage. In the safe zone, the ECD value remains stable, with no risk of leakage or wellbore collapse. In the caving zone, the ECD value is lower than in the safe zone, which could potentially cause wellbore damage or collapse due to excessively low pressure. Using this information, the risks of wellbore instability or fluid loss during drilling can be assessed, thus providing necessary safety parameter references for drilling operations. The parameter optimization for this well targets the safe zone, and by selecting the situation where the safe density window is negative, the ECD prediction model is used to optimize drilling parameters and tripping speed for the Ed2, Ed3, Es1, and Es31 members.
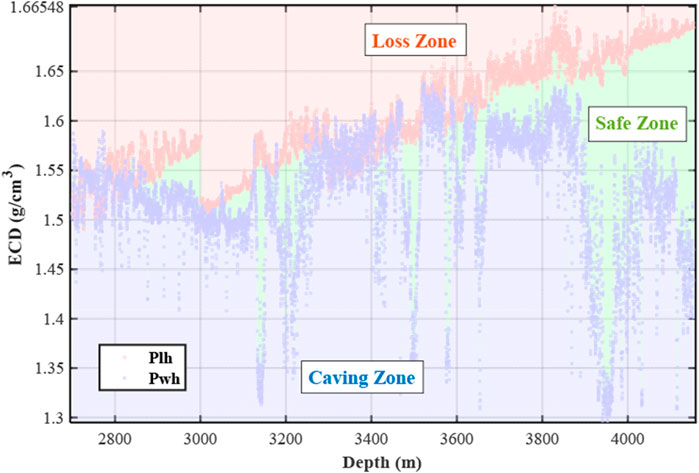
Figure 4. The safety density window of X well in the Nanpu area.
To ensure the safety of field operations, the ECD prediction values are aimed to be at the midpoint between Pwh and Plh during the forecasting process. This approach can effectively prevent issues arising from potential errors or fluctuations when adjusting parameters in practice, which could lead to exceeding the safe density window. Table 5 displays the results of parameter optimization for the Ed2, Ed3, Es1, and Es31.
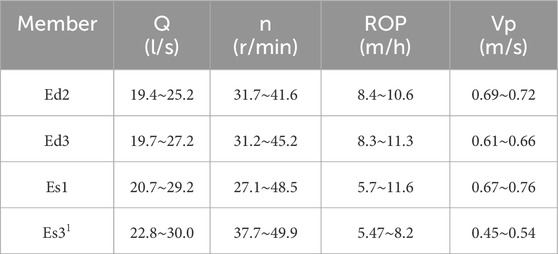
Table 5. The optimal parameter range of each member of a HTHP well in Nanpu area.
The results indicate that for the Ed2, the safe displacement range is 19.4 L/s to 25.2 L/s, the safe rotation speed is 31.7 r/min to 41.6 r/min, the safe ROP is 8.4 m/h to 10.6 m/h, and the safe tripping speed is 0.69 m/s to 0.72 m/s. For Ed3, the safe displacement range is 19.7 L/s to 27.2 L/s, the safe displacement is 31.2 r/min to 45.2 r/min, the safe ROP is 8.3 m/h to 11.3 m/h, and the safe tripping speed is 0.61 m/s to 0.66 m/s. For the Es1, the safe displacement range is 16.7 L/s to 29.2 L/s, the safe rotation speed is 27.1 r/min to 48.5 r/min, the safe ROP is 5.7 m/h to 11.6 m/h, and the safe tripping speed is 0.67 m/s to 0.76 m/s. For the Es31, the safe displacement is 22.8 L/s to 30.0 L/s, the safe rotation speed is 37.7 r/min to 49.9 r/min, the safe ROP is 5.47 m/h to 8.2 m/h, and the safe tripping speed is 0.45 m/s to 0.54 m/s. This demonstrates that the safe parameter ranges vary for different members, highlighting the necessity of different member simulation.
After obtaining the safe parameter ranges, the ECD prediction model is used to plot the ECD prediction curves, which allows for a direct observation of whether the predicted values exceed the safe density window boundaries. Figure 5 illustrates the ECD prediction values for each member after parameter optimization for the X well.
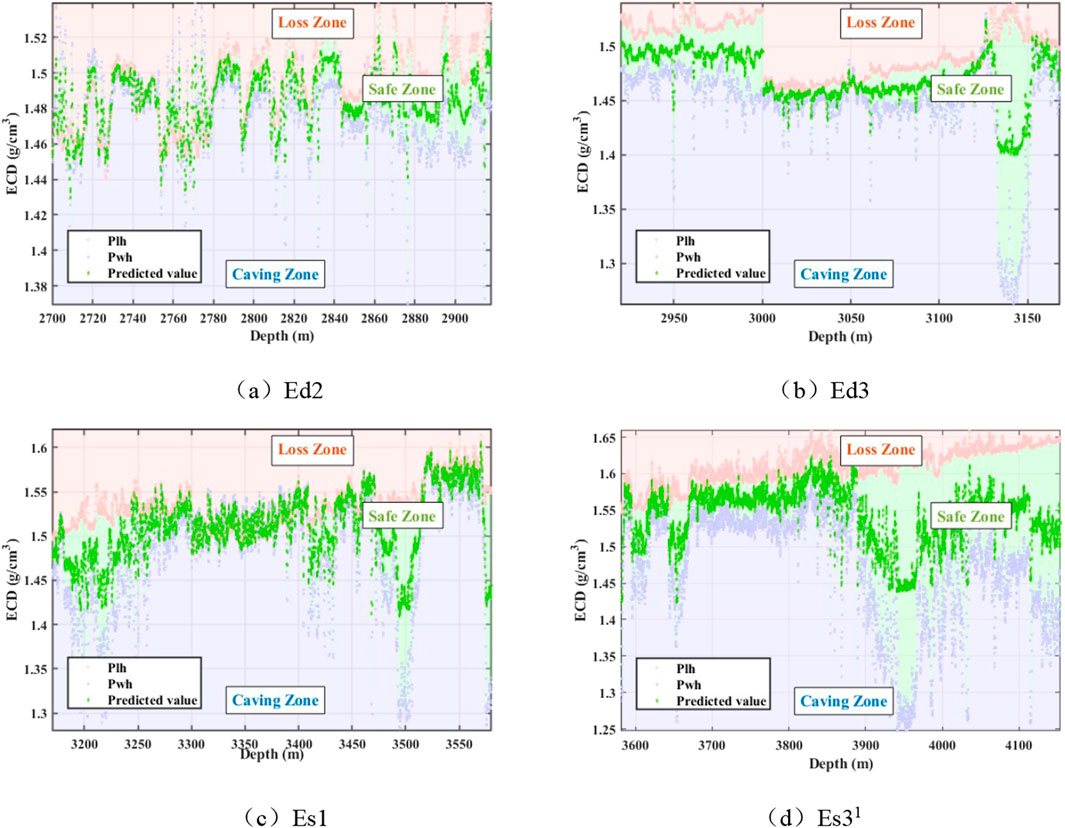
Figure 5. The predicted ECD values of each member of X well in Nanpu area after parameter optimization. (a) Ed2. (b) Ed3. (c) Es1. (d) Es31.
Figure 5 indicates that after parameter optimization, the ECD prediction values for the X well are generally maintained within the safe density window limits, demonstrating the reliability of the ECD prediction model and effectively controlling the ECD values between the safe density window. For cases where the previously screened safe density window values are too small or even negative, it is necessary to first expand the safe density window using means such as plugging agents before proceeding with the prediction.
4 Discussion
This study proposes a new ECD calculation model and a drilling parameter-based ECD prediction model, which takes into account the stratigraphic member of the reservoir. The effectiveness of these models in HTHP drilling environments has been verified. By optimizing drilling parameters for Ed2, Ed3, Es1, and Es31 members, the issue of wellbore instability in the narrow density window of the volcanic clastic reservoir in the Nanpu area has been addressed.
Compared with some of the currently improved Bingham Plastic models (Liu et al., 2014; Adams et al., 2023), temperature- and pressure-dependent Herschel-Bulkley models (Magnon and Cayeux, 2021), and Modified Cross models (Mahmood et al., 2022; Hauswirth, 2020), which require extensive laboratory data to fit and adjust parameters, the calculation model presented in this study relies on field-measured data, enabling it to reflect actual conditions in real-time and avoiding the time and cost associated with laboratory testing. The model is more adaptable to practical conditions, accurately reflecting the complex downhole environment, and offers greater flexibility and operability in field applications, allowing for dynamic adjustments and optimization of model outputs based on site conditions. The model demonstrates higher accuracy under HTHP conditions (R2 reached 0.99) and is relatively more streamlined, making it particularly suitable for rapid on-site calculations.
Traditional ECD prediction models (Al-Rubaii et al., 2023; Elzenary et al., 2018; Ekechukwu and Adejumo, 2024) often rely on uniform well parameters for prediction, which cannot account for geological variations. In contrast, the prediction model in this study further considers the variations across different members within the wellbore, especially in complex geological environments such as volcanic clastic reservoirs, achieving high-precision predictions for different members (R2 reached 0.99). Additionally, the prediction model optimizes drilling parameters, dynamically adjusting key parameters during the drilling process to maintain ECD values within the safe density window, effectively avoiding potential risks such as wellbore collapse or fluid influx, ensuring the safety and stability of the drilling operation.
5 Conclusion and future work
This study proposed and validated an ECD prediction model based on drilling parameters and members. By analyzing a high-temperature and high-pressure well in the volcaniclastic rock reservoir of the Nanpu area, the following results were obtained:
(1) Models were established for drilling and tripping, with correlation coefficients exceeding 0.99 for all members. This confirmed the accuracy of the models. Differences in regression coefficients across members highlighted the necessity of separate simulations. While the model performed well in the Nanpu region, additional calibration may be required for heterogeneous formations, fractured zones, or extreme conditions like deepwater wells. The model’s reliability also depends on the quality of input data, which could affect predictions in data-scarce regions.
(2) The model was applied to HTHP wells in the Nanpu area. It provided safe parameter ranges for different members, including optimized displacement, rotation speed, ROP, and tripping speed. By optimizing these parameters, ECD stayed within the safe density window during drilling and tripping. This improved drilling safety and wellbore stability. The study offers a theoretical basis for complex reservoir drilling and guidance for similar operations in the Nanpu area.
(3) Although focused on the Nanpu region, the model could apply to other areas with similar geological conditions. Its logic, based on universal parameters like ECD and formation pressure, makes it useful for pressure window predictions in sandstone or shale formations. Future research could integrate real-time drilling data for dynamic adjustments. This would improve predictive accuracy and assess its feasibility in extreme environments, such as deepwater and ultra-deep wells.
Data availability statement
The original contributions presented in the study are included in the article/Supplementary Material, further inquiries can be directed to the corresponding author.
Author contributions
WZ: Writing – review and editing, Conceptualization. ZY: Writing – review and editing, Investigation, Software, Writing – original draft. TW: Conceptualization, Data curation, Writing – review and editing. YZ: Resources, Writing – original draft. WS: Resources, Writing – original draft. JL: Investigation, Writing – original draft. PZ: Investigation, Writing – original draft.
Funding
The author(s) declare that financial support was received for the research and/or publication of this article. This paper was supported by the National Natural Science Foundation of China (Project No: 52074088, 52474036, and 52174022), the Key Project of the Joint Fund of the Natural Science Foundation of Heilongjiang Province (Project No: ZL2024E008), the 2023 Open Project of the National Engineering Laboratory for Exploration and Development of Low Permeability Oil and Gas Fields (Drilling Acceleration Technology Research KFKT2023-10 in the Western Margin of the Ordos Basin), and the Longjiang Science and Technology Talent Spring Goose Support Program (2022CYCX0157).
Conflict of interest
Authors YZ and WS were employed by Oil Production Technology Research Institute of Jidong Oilfield Company, PetroChina.
The remaining authors declare that the research was conducted in the absence of any commercial or financial relationships that could be construed as a potential conflict of interest.
Generative AI statement
The authors declare that no Generative AI was used in the creation of this manuscript.
Publisher’s note
All claims expressed in this article are solely those of the authors and do not necessarily represent those of their affiliated organizations, or those of the publisher, the editors and the reviewers. Any product that may be evaluated in this article, or claim that may be made by its manufacturer, is not guaranteed or endorsed by the publisher.
Supplementary material
The Supplementary Material for this article can be found online at: https://www.frontiersin.org/articles/10.3389/feart.2025.1558550/full#supplementary-material
References
Abdelgawad, K. Z., Elzenary, M., Elkatatny, S., Mahmoud, M., Abdulraheem, A., and Patil, S. (2019). New approach to evaluate the equivalent circulating density (ECD) using artificial intelligence techniques. J. Petroleum Explor. Prod. Technol. 9, 1569–1578. doi:10.1007/s13202-018-0572-y
Adams, I., Simeonov, J., Bateman, S., and Keane, N. (2023). A Bingham plastic fluid solver for turbulent flow of Dense Muddy Sediment Mixtures. Fluids 8 (6), 171. doi:10.3390/fluids8060171
Adefemi, A., Sofoluwe, O. O., Ekemezie, I. O., and Babayeju, O. A. (2024). Exploring technological and operational challenges in high-pressure: high-temperature drilling techniques. Glob. J. Eng. Technol. Adv. 19 (3), 37–49. doi:10.30574/gjeta.2024.19.3.0088
Al-Rubaii, M., Al-Shargabi, M., Aldahlawi, B., Al-Shehri, D., and Minaev, K. M. (2023). A developed Robust model and artificial intelligence techniques to predict drilling fluid density and equivalent circulation density in real time. Sensors 23 (14), 6594. doi:10.3390/s23146594
Alsaihati, A., Elkatatny, S., and Abdulraheem, A. (2021). Real-time prediction of equivalent circulation density for horizontal wells using intelligent machines. ACS Omega 6, 934–942. doi:10.1021/acsomega.0c05570
Ashena, R., Hekmatinia, A.-A., Ghalambor, A., Aadnoy, B., Enget, C., and Rasouli, V. (2021). Improving drilling hydraulics estimations-a case study. J. Petroleum Explor. Prod. Technol. 11 (6), 2763–2776. doi:10.1007/s13202-021-01203-4
Badrouchi, F., Rasouli, V., and Badrouchi, N. (2022). Impact of hole cleaning and drilling performance on the equivalent circulating density. J. Petroleum Sci. Eng. 211, 110150. doi:10.1016/j.petrol.2022.110150
Bybee, K. (2009). Equivalent-circulating-density fluctuation in Extended-Reach drilling. JPet Technol. 61 (02), 64–67. doi:10.2118/0209-0064-JPT
Chen, Q., Huang, Z., Kong, X., Guo, L., Xu, Z., and An, G. (2024). Drilling fluid density optimization for narrow density window fractured formation. J. Phys. Conf. Ser. 2860, 012010. doi:10.1088/1742-6596/2860/1/012010
Ekechukwu, G., and Adejumo, A. (2024). Explainable machine-learning-based prediction of equivalent circulating density using surface-based drilling data. Sci. Rep. 14, 17780. doi:10.1038/s41598-024-66702-w
Elzenary, M., Elkatatny, S., Abdelgawad, K. Z., Abdulraheem, A., Mahmoud, M., and Al-Shehri, D. (2018). “New technology to evaluate equivalent circulating density while drilling using artificial intelligence,” in SPE Kingdom of Saudi Arabia annual technical Symposium and exhibition. Dammam, Saudi Arabia, April, SPE-192282-MS. doi:10.2118/192282-MS
Gamal, H., Abdelaal, A., and Elkatatny, S. (2021). Machine learning models for equivalent circulating density prediction from drilling data. ACS Omega 6 (41), 27430–27442. doi:10.1021/acsomega.1c04363
Gao, X., and Fan, H. (2024). Equivalent circulation density prediction using random forest model. Trends Petroleum Eng. 4 (2), 1–8. doi:10.53902/TPE.2024.04.000541
Hauswirth, S. C., Bowers, C. A., Fowler, C. P., Schultz, P. B., Hauswirth, A. D., Weigand, T., et al. (2020). Modeling cross model non-Newtonian fluid flow in porous media. J. Contam. Hydrology 235, 103708. doi:10.1016/j.jconhyd.2020.103708
Kandil, A., Khaled, S., and Elfakharany, T. (2023). Prediction of the equivalent circulation density using machine learning algorithms based on real-time data. AIMS Energy 11 (3), 425–453. doi:10.3934/energy.2023023
Li, H., Deng, J., Zhu, S., Cao, Z., Wen, Y., Zhang, C., et al. (2022). “Prediction of safe drilling fluid density window in X oilfield through an integrated geomechanics approach: a case study of well a,” in 56th U.S. Rock mechanics/geomechanics Symposium. Santa Fe, New Mexico, USA, June. doi:10.56952/ARMA-2022-2093
Li, P. (2015). Optimization of drilling engineering design and construction for Anshun 1 Well. Adv. Petroleum Explor. Dev. 9 (1), 115–118.
Li, P., Guan, Z., Han, C., Hu, S., Xiao, F., and Guan, Y. (2021). Narrow density window and risk Assessment based on big data. J. Phys. Conf. Ser. 1757, 012105. doi:10.1088/1742-6596/1757/1/012105
Li, Y., Chen, G., Cai, Z., Lu, S., Wang, F., Zhang, Y., et al. (2024). Occurrence of methane in organic pores with surrounding free water: a molecular simulation study. Chem. Eng. J. 497, 155597. doi:10.1016/j.cej.2024.155597
Liu, Cr., Wu, B., and Huhe, Ad. (2014). A Bingham-plastic model for fluid mud transport under waves and currents. China Ocean. Eng. 28, 227–238. doi:10.1007/s13344-014-0018-3
Ma, X., Guan, Z., Luo, M., Li, W., and Pan, R. (2019). Study on the dynamic prediction method of ECD in horizontal well drilling. Sci. Discov. 7 (1), 32–38. doi:10.11648/j.sd.20190701.18
Magnon, E., and Cayeux, E. (2021). Precise method to estimate the Herschel-Bulkley parameters from pipe Rheometer measurements. Fluids 6 (4), 157. doi:10.3390/fluids6040157
Mahmood, R., Siddique, I., Khan, I., Badran, M., Mehrez, S., Majeed, A. H., et al. (2022). Numerical computation for modified cross model fluid flow Around the circular Cylinder with Symmetric Trapezoidal Cavities. Front. Phys. 10, 912213. doi:10.3389/fphy.2022.912213
Rao, X., Guo, S., He, X., Kwak, H., Yousef, A., and Hoteit, H. (2024). Hybrid Mimetic finite difference and streamline methods for numerical simulation of two-phase flow in fractured reservoirs. Comput. Geotechnics 166, 106048. doi:10.1016/j.compgeo.2023.106048
Rocha, L. A. S., Junqueira, P., and Roque, J. L. (2003). Overcoming deep and ultra deepwater drilling challenges. Offshore Technol. Conf. Houston, Texas, May, OTC-15233-MS. doi:10.4043/15233-MS
Shan, Y., Xue, Q., Wang, J., Li, Y., and Wang, C. (2023). Analysis of the influence of downhole drill string vibration on wellbore stability. Machines 11 (7), 762. doi:10.3390/machines11070762
Tang, H., Luo, S. H., Liang, H., Zeng, B., Zhang, L., Zhao, Y., et al. (2024). Integrated numerical simulation of hydraulic fracturing and production in shale gas well considering gas-water two-phase flow. Petroleum Explor. Dev. 51 (3), 684–696. doi:10.1016/S1876-3804(24)60497-0
Wang, C., Chen, W., Wu, Z., Li, J., and Liu, G. (2023). Stick–slip characteristics of drill strings and the related drilling parameters optimization. Processes 11 (9), 2783. doi:10.3390/pr11092783
Wang, H., Lv, X., Liu, Y., and Huang, Z. (2021). Characteristic analysis of collision between drill string and well Wall. J. Phys. Conf. Ser. 1757 (1), 012016. doi:10.1088/1742-6596/1757/1/012016
Wang, Z. (2016). Drilling engineering design and construction of well Dong 11. Adv. Petroleum Explor. Dev. 12 (2), 57–61. doi:10.3968/9160
Wei, Y., Feng, Y., Tan, Z., Yang, T., Yan, S., Li, X., et al. (2024). Simultaneously improving ROP and maintaining wellbore stability in shale gas well: a case study of Luzhou shale gas reservoirs. Rock Mech. Bull. 3(3), 100124. doi:10.1016/j.rockmb.2024.100124
Wu, B., Ma, X., Li, J., Tian, G., Xiong, D., Zou, Y., et al. (2022). Numerical simulation of fracture propagation of multi-Cluster perforation and fracturing in horizontal wells: a case study of Mahu oilfield. Energies 15 (15), 5579. doi:10.3390/en15155579
Yan, C., Deng, J., Yu, B., Liu, H., Deng, F., Chen, Z., et al. (2014). Wellbore stability analysis and its application in the Fergana basin, central Asia. J. Geophys. Eng. 11 (1), 015001. doi:10.1088/1742-2132/11/1/015001
Yang, Z., Yin, F., Li, S., Zhao, X., and Gao, Y. (2024). “Real-time prediction of bottomhole equivalent circulating density (ECD) based on machine learning algorithms in offshore deepwater drilling,” in Computational and experimental Simulations in engineering. ICCES 2024. Mechanisms and machine science, 168. Cham: Springer, 792–803. doi:10.1007/978-3-031-68775-4_60
Yavari, H., Fazaelizadeh, M., Aadnoy, B. S., Khosravanian, R., Qajar, J., Sedaghatzadeh, M., et al. (2023). An approach for optimization of controllable drilling parameters for motorized bottom hole assembly in a specific formation. Results Eng. 20, 101548. doi:10.1016/j.rineng.2023.101548
Yin, P.-F., Yang, S.-Q., Gao, F., Tian, W.-L., and Zeng, W. (2023). Numerical investigation on hydraulic fracture propagation and multi-perforation fracturing for horizontal well in Longmaxi shale reservoir. Theor. Appl. Fract. Mech. 128, 103921. doi:10.1016/j.tafmec.2023.103921
Zhan, J., Ding, X., Liu, H., Wang, K., Wang, Z., Guo, W., et al. (2024). Research on efficient numerical simulation method for integration fracking with production in shale oil reservoir with multi-source data. Sci. Rep. 14, 30620. doi:10.1038/s41598-024-81896-9
Zhang, B., Guo, T., Chen, M., Xue, L., Zhang, Y., Hu, Z., et al. (2024a). Experimental research on hydraulic fracture evolution characteristics of multi-well pad fracturing in a tight conglomerate reservoir. Eng. Fract. Mech. 312, 110609. doi:10.1016/j.engfracmech.2024.110609
Zhang, S., Wang, H., Qiu, Z., Cao, W., Huang, H., and Chen, Z. (2019). Calculation of safe drilling mud density window for shale formation by considering chemo-poro-mechanical coupling effect. Petroleum Explor. Dev. 46 (6), 1271–1280. doi:10.1016/S1876-3804(19)60280-6
Zhang, S.-C., Lei, X., Zhou, Y.-S., and Xu, G.-Q. (2015). Numerical simulation of hydraulic fracture propagation in tight oil reservoirs by volumetric fracturing. Petroleum Sci. 12 (4), 674–682. doi:10.1007/s12182-015-0055-4
Keywords: different member prediction, narrow density window, ECD optimization, drilling parameters, wellbore stability
Citation: Zhao W, Yang Z, Wang T, Zhou Y, Song W, Li J and Zhai P (2025) The different member equivalent circulating density prediction model and drilling parameter optimization under narrow density window. Front. Earth Sci. 13:1558550. doi: 10.3389/feart.2025.1558550
Received: 10 January 2025; Accepted: 31 March 2025;
Published: 23 April 2025.
Edited by:
Jianmeng Sun, China University of Petroleum (Huadong), ChinaCopyright © 2025 Zhao, Yang, Wang, Zhou, Song, Li and Zhai. This is an open-access article distributed under the terms of the Creative Commons Attribution License (CC BY). The use, distribution or reproduction in other forums is permitted, provided the original author(s) and the copyright owner(s) are credited and that the original publication in this journal is cited, in accordance with accepted academic practice. No use, distribution or reproduction is permitted which does not comply with these terms.
*Correspondence: Tingting Wang, d2FuZ3Rpbmd0aW5nQG5lcHUuZWR1LmNu