 Min Xiang
 Xuhui Zhang1,2
94% of researchers rate our articles as excellent or good
Learn more about the work of our research integrity team to safeguard the quality of each article we publish.
Find out more
METHODS article
Front. Earth Sci. , 10 March 2025
Sec. Solid Earth Geophysics
Volume 13 - 2025 | https://doi.org/10.3389/feart.2025.1555332
This article is part of the Research Topic Advanced Methods for Interpreting Geological and Geophysical Data Volume II View all 3 articles
Rayleigh wave exploration is widely used in the field of engineering investigation, which can analyze the near surface velocity structure. However, the traditional Rayleigh wave exploration data processing method can only provide the average change of Rayleigh wave phase velocity with depth under the seismic line, but cannot obtain the horizontal change of Rayleigh wave phase velocity along the line direction, which brings great challenges to the detection of underground wave velocity anomalies. To solve these problems, the Choi‒Williams distribution is introduced to process Rayleigh waves, and the relationships among the Rayleigh wave time, frequency and amplitude are obtained. The frequency dispersion curve is subsequently calculated via similarity analysis. In this method, first, the Rayleigh wave is intercepted in the time domain. Second, the Choi‒Williams distribution of Rayleigh waves is calculated, and the time domain waveform of each frequency component of each Rayleigh wave is obtained. The time difference is subsequently calculated via similarity analysis, and the dispersion curve between two adjacent channels is obtained. Finally, the phase velocity image below the seismic arrangement is obtained via combination with the multichannel Rayleigh wave dispersion curve. When this method is applied to the detection of geological anomalies in engineering investigations, it can accurately reflect the spatial distribution position of the detection target and has a relatively high lateral resolution.
Since the mid-19th century, seismic surface wave exploration technology has gradually become an important means to study information in near-surface underground media. Rayleigh first discovered Rayleigh waves and discussed their mathematical mechanism in detail (Rayleigh, 1885). Subsequently, Thomson and Haskel investigated the relationship between the propagation speed and frequency of Rayleigh waves in multilayered media (Thomson, 1950). However, owing to the limitations of computing power, the dispersion characteristics of Rayleigh waves could not be fully verified at that time. With the development of technology, researchers have begun to use seismic noise sources and cross-correlation methods to obtain surface wave information and have proven that the random wave field has a dispersive property. In recent years, researchers in the field of seismology have used different methods and techniques to extract surface wave information from seismic data and carry out surface wave exploration research (Park et al., 1999). Surface wave exploration is characterized by high resolution, high frequency dispersion and noninvasiveness and is widely used in urban underground space exploration and geotechnical engineering exploration (Liu et al., 2019; Mulumulu et al., 2024; Wang et al., 2022; Zhang et al., 2019).
The Rayleigh wave is characterized by dispersion, and the penetration depth of the Rayleigh wave is different at different frequencies. On the basis of this characteristic, the Rayleigh wave phase velocity can be calculated by obtaining the Rayleigh wave dispersion curve and realizing the purpose of formation division. However, only the variation in the Rayleigh wave amplitude with time can be observed in time-domain seismic records, so it is necessary to process the time-domain seismic signal to obtain the Rayleigh wave dispersion curve (Xia et al., 1999). In order to improve the inversion accuracy of dispersion curves, Li et al. (2021) proposed a multi-channel surface wave analysis method based on short permutation stacked correlation gathers, which greatly improves the lateral resolution of surface wave exploration. Le et al. (2024) used particle swarm optimization (PSO) algorithm to perform Rayleigh wave frequency velocity spectrum (FVS) inversion without extracting dispersion curves. At the same time, a global optimal inversion strategy was adopted to reduce dependence on the initial model, and GPU parallel computing was introduced to improve inversion efficiency. Ai et al. (2025) used the Hunger Games search algorithm to achieve multi-mode surface wave full-parametric inversion, which was successfully applied to identify glacier thickness and freezing degree in subglacial sediments.
In summary, geological modeling research based on Rayleigh wave dispersion curves is constantly advancing. However, there is a significant problem in the current Rayleigh wave data processing methods, namely, insufficient lateral resolution; that is, traditional methods can provide only the average variation in the Rayleigh wave phase velocity under a seismic arrangement. Owing to the complex and heterogeneous structure of near-surface strata and the influence of human engineering activities, such as underground pipe corridors and tunnels, these factors pose challenges to the accuracy of Rayleigh wave exploration. Both high- and low-speed geological bodies exist under a seismic arrangement, and the dispersion curves cannot accurately reflect the underground geological conditions because of the averaging action. In addition, complex geological conditions can lead to significant differences between the initial formation model and the real formation structure, making it difficult to reproduce an accurate geological model, regardless of how the inversion algorithm is optimized. As shown in Figure 1, the Rayleigh wave exploration result is a curve reflecting the relationship between phase velocity and depth. Using this curve can only show the depth of the abnormal body, but can not tell us the horizontal position of the abnormal body. At the same time, there are a large number of pebbles in the underground of the exploration area, with strong heterogeneity, resulting in large inversion fitting error (the minimum error is only 57.31%), which is difficult to reflect the real geological structure.
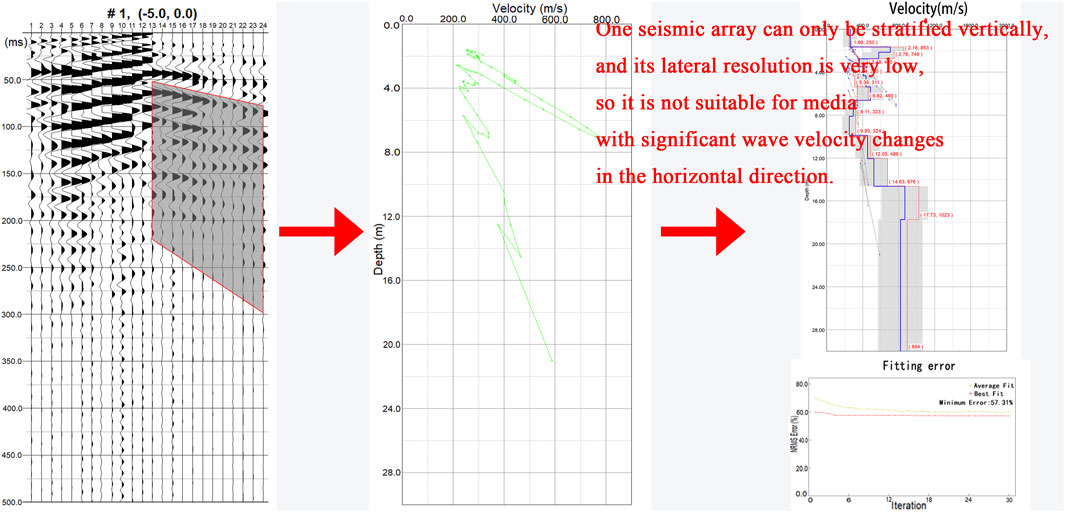
Figure 1. Traditional Rayleigh wave data processing which can only obtained the average change of phase velocity with depth.
To solve the above problems, this paper introduces the Choi‒Williams distribution method to process each Rayleigh wave signal. With this method, we can extract the time waveforms of each Rayleigh wave under different frequency components. Through similarity analysis, the time difference between channels of the same frequency component is obtained, and the frequency dispersion curve between the two channels is obtained. Then, using a seismic arrangement, the Rayleigh wave phase velocity image can be obtained. The method introduced in this paper can use the time domain and frequency domain information of Rayleigh wave at the same time, and greatly improve the utilization rate of Rayleigh wave information. At the same time, using a seismic array, the phase velocity profile of the formation below the seismic array can be obtained, which greatly improves the horizontal resolution of Rayleigh wave detection.
For a signal that varies with time, the relationships among the signal time, frequency and amplitude can be obtained via time‒frequency analysis, and then the phase velocities of Rayleigh waves with different frequency components can be obtained. There are many kinds of time‒frequency analysis methods, and the Cohen time‒frequency distribution is a type of bilinear time‒frequency analysis method.
For a multicomponent signal g(t), the expression of its Cohen time‒frequency distribution can be written as Equation 1 (Cohen, 1966):
where
The Choi–Williams distribution is a method of Cohen time‒frequency distribution. When the kernel function
where
The transient Rayleigh wave operating frequency band plays an important role in physical filtering in field data acquisition and digital filtering in data processing. The Rayleigh wave wavelength at a certain frequency is proportional to the detection depth; thus, the relationships among the Rayleigh wave phase velocity, frequency and detection depth can be expressed as:
β is the depth coefficient, which is a constant related to the Poisson’s ratio of the rock and soil mass (see Table 1).

Table 1. Relation between Poisson’s ratio and the depth coefficient.
The selection of the working frequency band mainly depends on the detection depth and shallow resolution required by the project. The maximum detection depth hmax determines the lower limit of the working frequency band (the lowest frequency), and the minimum detection depth (or detection resolution) hmin determines the upper limit of the working frequency band (the highest frequency). Formula 3 can be changed to:
The highest operating frequency is
After filtering is complete, the Rayleigh wave needs to be separated from the seismic wave waveform. This step can be performed directly on time-domain seismic waveforms (as shown in Figure 2). Compared with P- and S-waves, Rayleigh waves have slower velocities and larger amplitudes. On this basis, each Rayleigh wave can be intercepted. After the truncation is complete, the first point of the first Rayleigh wave waveform is taken as the initial moment, and the last point of the last waveform is taken as the end moment. The missing part of each waveform is added to 0 to ensure that the length of each waveform is the same, which is convenient for subsequent calculations.
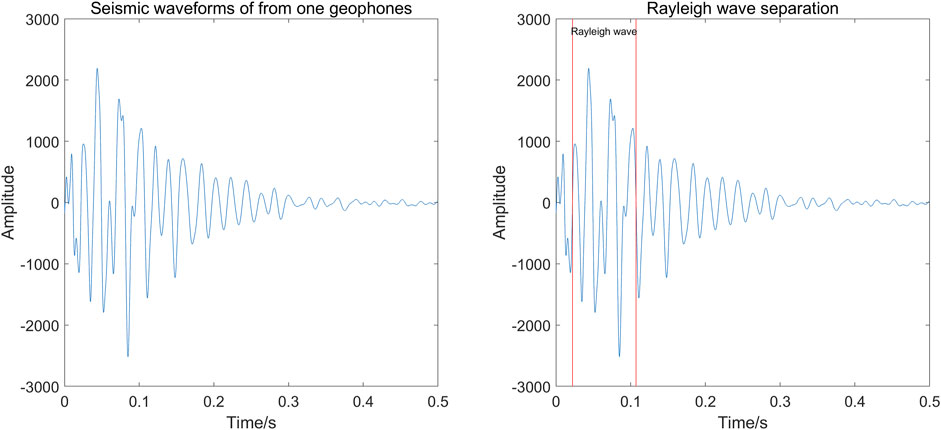
Figure 2. Illustration of Rayleigh wave interception.
For Rayleigh waves
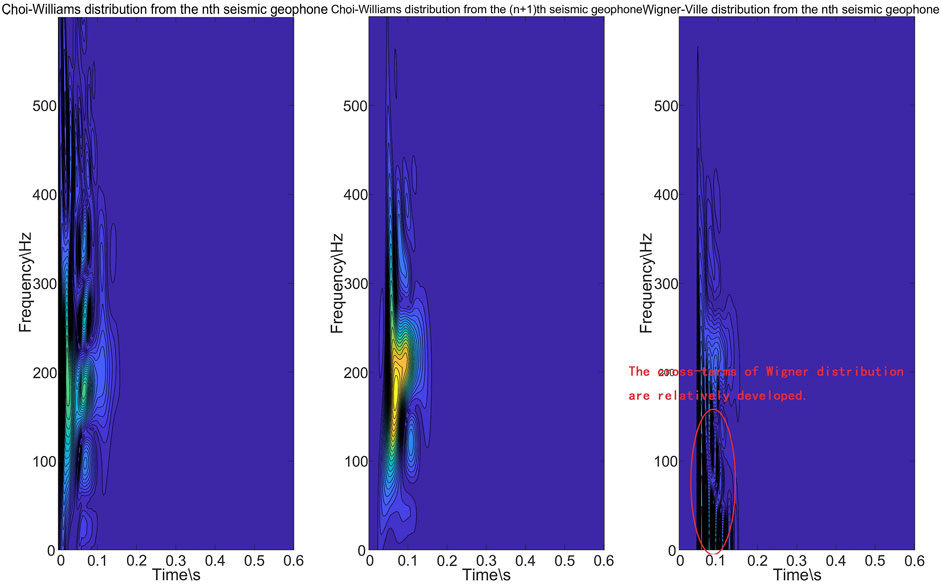
Figure 3. Choi–Williams and Wigner-Ville distributions of Rayleigh waves in the n and n + 1 channels.
There are many types of Cohen time-frequency distributions, and Figure 3 compares the calculation results of Choi-Williams distribution and Wigner-Ville distribution. In the Wigner-Ville distribution, especially below 100 kz, there appears a band like regular distribution of components. This component is the cross-term of the Wigner-Ville distribution, which is an invalid signal and will affect the subsequent Rayleigh wave phase velocity analysis. Compared to the Wigner-Ville distribution, the cross-terms in the Choi-Williams distribution have minimal impact and are more suitable for Rayleigh wave analysis.
The relationships among the Rayleigh wave time, frequency and amplitude can be obtained via the Choi‒Williams distribution. The energy of the Rayleigh wave is mainly concentrated between 0 and 600 Hz, and the energy of the former Rayleigh wave is earlier than that of the latter. Using this feature, the time difference of different frequency components can be calculated, and then the Rayleigh wave dispersion curve between two channels can be obtained.
At present, the instantaneous frequency of each Rayleigh wave signalling component is usually determined via peak detection; that is, the maximum amplitude of each frequency component is detected, and the corresponding time corresponds to the time of the frequency component. The dispersion curve is subsequently obtained from the time difference between the two frequency components (the time difference between channels). However, there are many errors in spectral peak detection in practice. Strata (especially those with geological structures) are inhomogeneous media. The attenuation of Rayleigh wave energy in the process of formation propagation is uneven, so the spectral peaks detected in the front and back channels may not have the same composition.
Taking the time‒frequency distribution of two adjacent Rayleigh waves in Figure 3 as an example, spectral peak detection of both can yield the maximum amplitude of each frequency component (as shown in Figure 4). In theory, the different frequency components of Rayleigh waves should have a certain continuity in time, but owing to the uneven attenuation of the measured Rayleigh wave energy, the detected spectral peaks are relatively scattered. After calculating the time difference, the time difference of the spectral peak points of the 16 frequency components is too small, and the time difference of the spectral peak points of the 3 frequency components is too large. Errors will occur in the subsequent calculation of the Rayleigh phase velocity. The above example highlights a major shortcoming of the peak detection method, namely, the low utilization of time and frequency information. The spectral peak detection method uses only the time and frequency information of the energy peak point, and the time‒frequency information of the other signalling components is ignored.
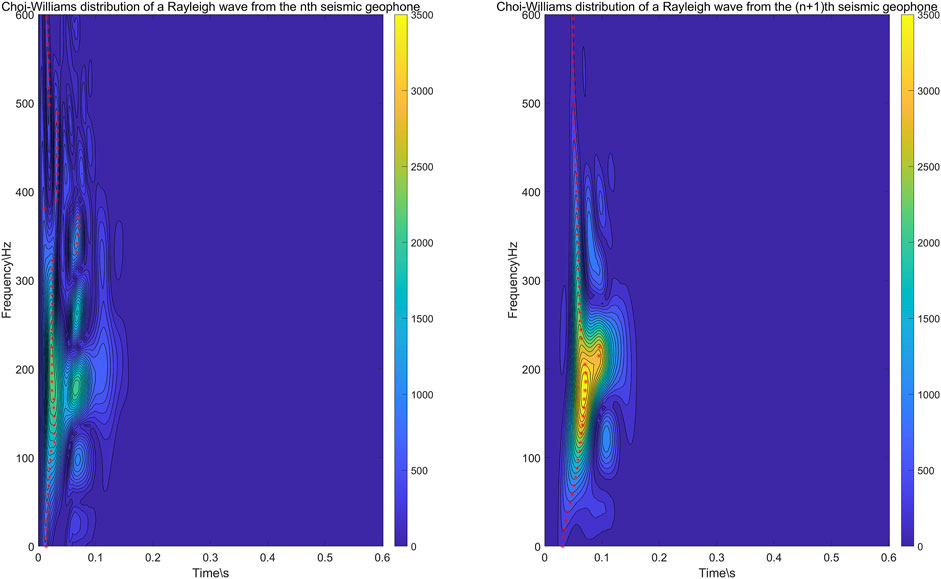
Figure 4. Results of spectral peak detection (The red dot is the peak of each frequency component).
Although the Rayleigh wave propagation process is very complicated in formations, the signalling components of the same frequency still have certain similarities in each channel. On this basis, this paper proposes obtaining the trace time difference of each channel Rayleigh wave by analysing the similarity of each frequency component.
As shown in Figure 5, the component whose frequency component is f is extracted from the Choi–Williams distribution, and the time-domain waveform of the frequency component is obtained, denoted as time series y1(N) and y2(N), respectively. Assuming that the signal sampling number is N0, for y1(x) along the direction of time increase, m translations, the flat shift length is t0, then the error between y1(x) and y2(x) will be evaluated. The commonly used error formulas include mean square error (MSE), mean absolute error (MAE), root mean square error (RMSE), and mean absolute percentage error (MAPE). MAE is not sensitive to outliers, and MAPE may encounter problems when processing data containing zero or near zero values, as the percentage error in these cases can become very large or incalculable. MSE and RMSE are more sensitive to large errors and can better identify larger deviations. As shown in Figure 5, when conducting similarity analysis on Rayleigh waves with different frequency components, it is necessary to identify large errors. At the same time, compared with MSE, RMSE calculation results have the same unit as the data, both in seconds, which has better interpretability. Therefore, RMSE is selected for error measurement as shown in Equation 5.
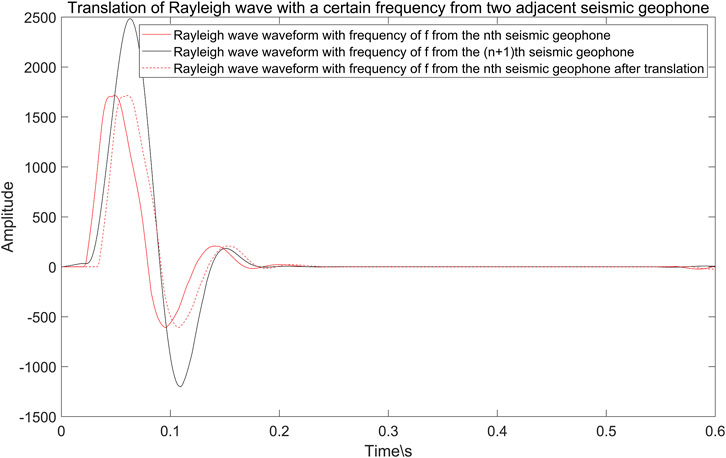
Figure 5. Translation of Rayleigh wave with a certain frequency component.
When the RMSE takes the minimum value, y1(N) and y2(N) have the highest degree of similarity. If the corresponding translation number at this time is m0, the component with frequency f in the Rayleigh wave signal has a time difference between the NTH channel and the n+1 channel td = m0t0. With the above method, the intertrace time difference of each frequency component can be calculated in turn.
As shown in Figure 6, the spectral peak detection method and similarity analysis compare the intertrace time differences in the Rayleigh wave frequency components between two channels. The intertrace time difference curve calculated via the spectral peak detection method greatly fluctuates. The randomness is strong, and the calculated variance is 1.0502 × 10⁻⁵, whereas the time difference curve calculated via similarity analysis is more stable, and the variance is 1.4621 × 10⁻⁶, which accords with the actual situation of Rayleigh wave propagation at different frequencies in the formation.
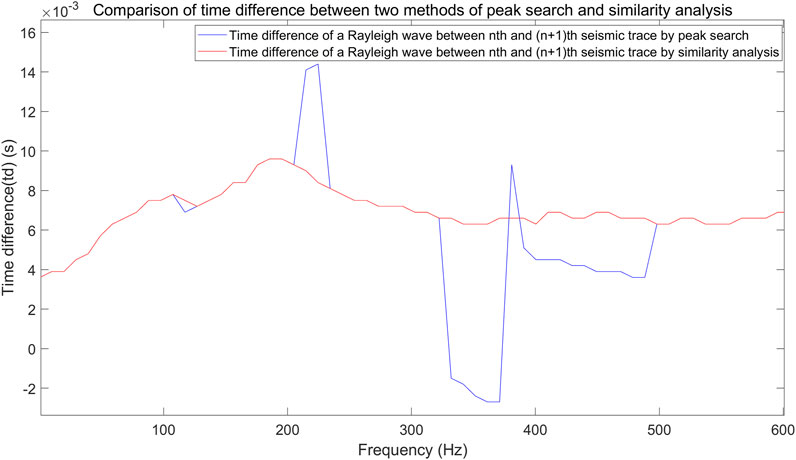
Figure 6. The frequency‒time difference curve was obtained via the spectral peak detection method and similarity analysis method which shows that the computational stability of similarity analysis method is better.
After the trace time difference of each frequency component is obtained, the Rayleigh phase velocity V_R of each frequency component can be expressed as:
where ΔX is the.
Using Formula 6, the Rayleigh phase velocity‒depth curve between two adjacent geophones can be obtained. The phase velocity‒depth profile of a Rayleigh wave under a seismic arrangement can be obtained by combining the phase velocity‒depth curves calculated via a combination of multichannel detector pairs.
A transverse isotropic model is established, and the model parameters are shown in Table 2. A staggered grid is used to discretize the field variables and media parameters, and a nonsplit perfectly matched layer (NPML) is used to absorb the boundary to eliminate the reflected waves generated by the model boundary to simulate the seismic wave field numerically.
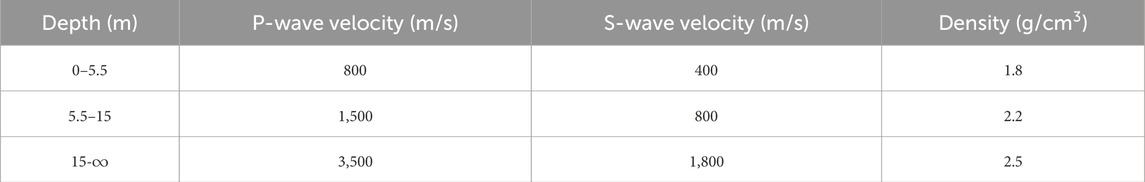
Table 2. Model parameters.
Assuming that the offset is 5 m and the interval is 0.5 m, there are 24 detectors in total, and the forward seismic wave train is shown in Figure 7.
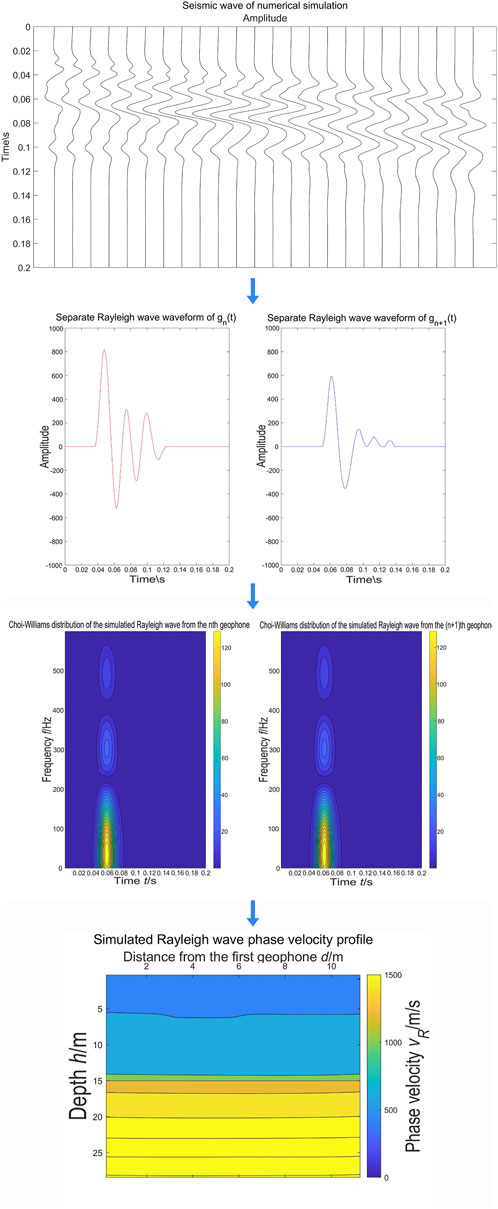
Figure 7. Rayleigh wave analysis process by the similarity analysis of Choi–Williams distribution.
Rayleigh wave separation, time‒frequency analysis, time difference calculation, phase velocity calculation and phase velocity‒depth profile calculation are carried out to obtain the phase velocity‒depth profile of the seismic wave train obtained via forward modelling. The final calculated phase velocity‒depth profile presents a layered distribution, and there is a stratigraphic interface at approximately 5.5 m and 15 m, which corresponds well with the established model.
As shown in Figure 8, in the cavitation survey under a city road, an 18-pound sledgehammer is used as the excitation source, 24 channels of the 4.5 Hz detector are received, quick drying equipment is used to ground the detector, the offset distance is 5 m, the channel spacing is 0.4 m, and the sampling frequency is 10 kHz. The planned depth is 25 m. The strata are from the surface to a depth of 25 m and are paved with asphalt pavement, tabia and sandstone. Considering the conditions of the rock and soil masses at the site comprehensively, Poisson’s ratio is approximately 0.35, and the depth coefficient β is 0.75.
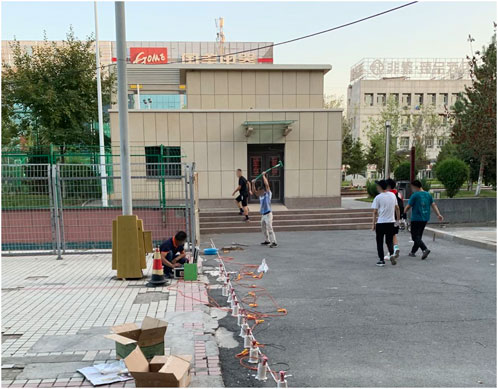
Figure 8. Photos of Rayleigh wave exploration and construction in underground caverns.
According to field tests, the Rayleigh wave velocity of the shallow overlying layer is approximately 400 m/s, and the average Rayleigh wave velocity of sandstones with different degrees of weathering in the detection depth range is approximately 1,000 m/s. The maximum detection depth is hmax = 25 m, which corresponds to a Rayleigh wave velocity VR = 1,000 m/s. The minimum resolution thickness of the formation hmin = 1 m corresponds to VR = 400 m/s and β = 0.75, and the working frequency band of the detection is 30 Hz–300 Hz.
A multichannel transient Rayleigh wave analysis method based on the Choi‒Williams time‒frequency distribution is adopted. Figure 9 shows the Rayleigh wave phase velocity‒depth profile. It is generally believed that the Rayleigh phase velocity of rock is greater than 800 m/s and that of soil is less than 800 m/s. The fluctuation of the bedrock interface can be clearly observed via the method introduced in this paper. Moreover, the Rayleigh wave phase velocity reaches 800 m/s approximately 8–10 m underground. It can be inferred that the bedrock interface is located in this depth range. Low-speed anomalies appear in the horizontal 4–6 m and underground 4–6 m high-speed areas. The abnormal forms are closed, and the phase velocity is lower than 200 m/s, which suggests that this area is an underground cavity.
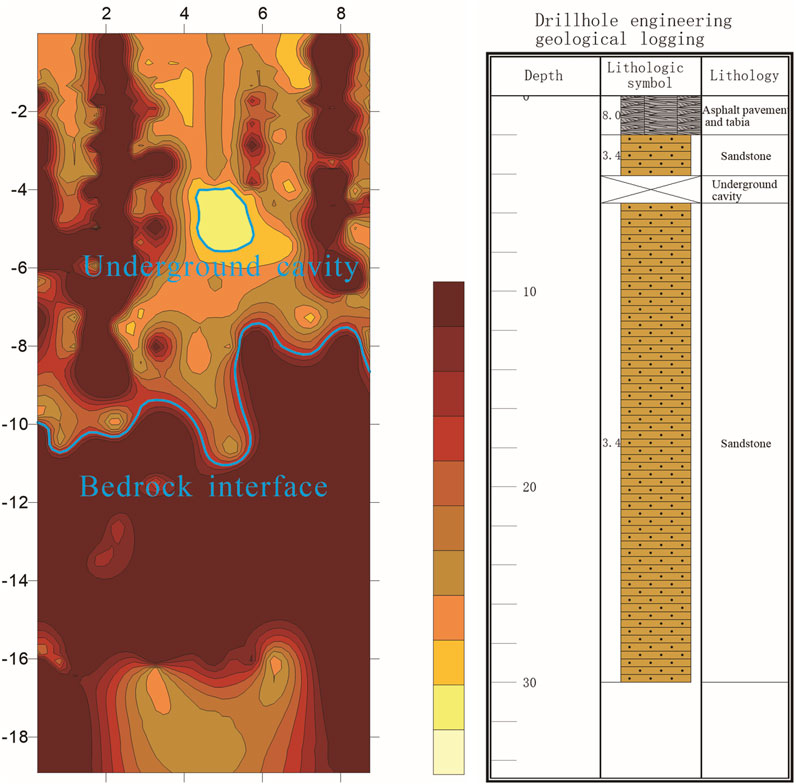
Figure 9. Rayleigh phase velocity‒depth profile of underground cavity detection and borehole histogram.
As shown in Figure 10, Rayleigh waves were used to detect the landslide sliding surface before the slope protection engineering of the regional expressway was constructed. The 18 pound sledgehammer is used as the excitation source, the 4.5 Hz detector receives, the offset is 5 m, the track spacing is 1 m, and the sampling frequency is 10 kHz. The line consists of four geophone arrangements, the first three arranged 24 channels, the fourth arranged 12 channels, and each geophone arrangement ends. The planned detection depth is 20 m. The surface is covered by the fourth system, and below it is sandstone. Considering the conditions of the rock and soil masses at the site, Poisson’s ratio is approximately 0.35, and β is 0.75.
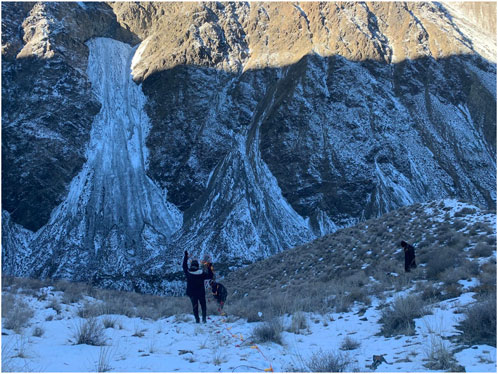
Figure 10. Photos of Rayleigh wave exploration and construction in underground caverns.
According to field tests, the Rayleigh wave velocity of the shallow overlying layer is approximately 300 m/s, and the average Rayleigh wave velocity of strongly weathered sandstone is approximately 1,200 m/s in the detection depth range. The maximum detection depth hmax = 20 m (corresponding to VR = 1,200 m/s), the minimum resolution thickness hmin = 1 m (corresponding to VR = 300 m/s) and β = 0.75 are substituted into Formula 4, and the working frequency band of this detection is 45 Hz–225 Hz.
The Rayleigh wave data processing method introduced in this paper is used to obtain the phase velocity-depth profile (as shown in Figure 11). The softer the formation is, the lower the Rayleigh wave phase velocity is, so the slope body has a lower Rayleigh wave phase velocity than the landslide bed does. In the phase velocity depth profile, the morphology of the sliding surface can be described, and the thickness of the slope can be determined. The thickness of the landslide front deposit body is approximately 5 m, whereas the thickness of the landslide body gradually decreases from the landslide front to the landslide back edge.

Figure 11. Phase velocity‒depth profile of sliding surface detection and borehole histogram.
As shown in Figure 12, the working area is located in the Kunlun Mountains, with an elevation of approximately 4,300 m. The ground surface is frozen soil, and the frozen soil can be divided into two parts: the lower part is permafrost, and the active layer covers the permafrost. The active layer melts in summer and freezes in winter, which greatly influences engineering construction. It is necessary to determine the thickness range of the active layer. An 18-pound sledgehammer was used as the excitation source, and 8 parallel measuring lines were arranged with a spacing of 1 m. Each measuring line is received by 12 channels of a 4.5 Hz detector with an offset of 5 m, a channel spacing of 0.5 m and a sampling frequency of 10 kHz. The planned detection depth is 20 m.
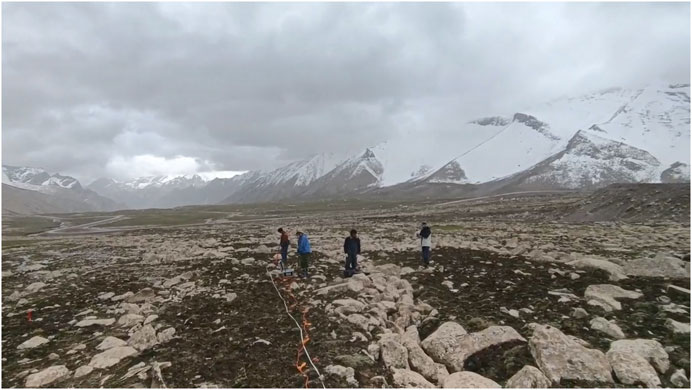
Figure 12. Photos of permafrost active layer detection construction.
Considering the conditions of the rock and soil masses at the site, Poisson’s ratio is approximately 0.25, and β is 0.65. In the field test, the Rayleigh wave velocity in shallow formations is approximately 800 m/s, and the average Rayleigh wave velocity in coarse sand and fine sand is approximately 1,500 m/s in the detection depth range. Considering that the maximum detection depth hmax = 20 m (corresponding to VR = 1,500 m/s), the minimum resolution thickness hmin = 1 m (corresponding to VR = 800 m/s) and β = 0.75 are substituted into Formula 4, the working frequency band of this detection is 48.75 Hz–520 Hz.
The survey was carried out in the spring, and the active layer had not completely melted. The material composition of the active layer is very complex, so the Rayleigh wave phase velocity continuity is often poor. On the other hand, the active layer freezes in winter and melts in summer, and the freeze‒thaw cycle destroys the active layer itself and the permafrost below the active layer. There is a weak or broken part between the active layer and the permafrost, causing the Rayleigh wave phase velocity to decrease. As shown in Figure 13, there is a relatively obvious low-velocity layer at 9.8 m underground, which is presumed to be a broken zone formed by the destruction of the active layer and permafrost by freeze‒thaw cycles. The phase velocity of some Rayleigh waves above 9.8 m changes sharply, and the continuity is poor, which accords with the characteristics of complex material composition in the active layer. The partial phase velocity below 9.8 m is relatively high, which accords with the characteristics of permafrost.
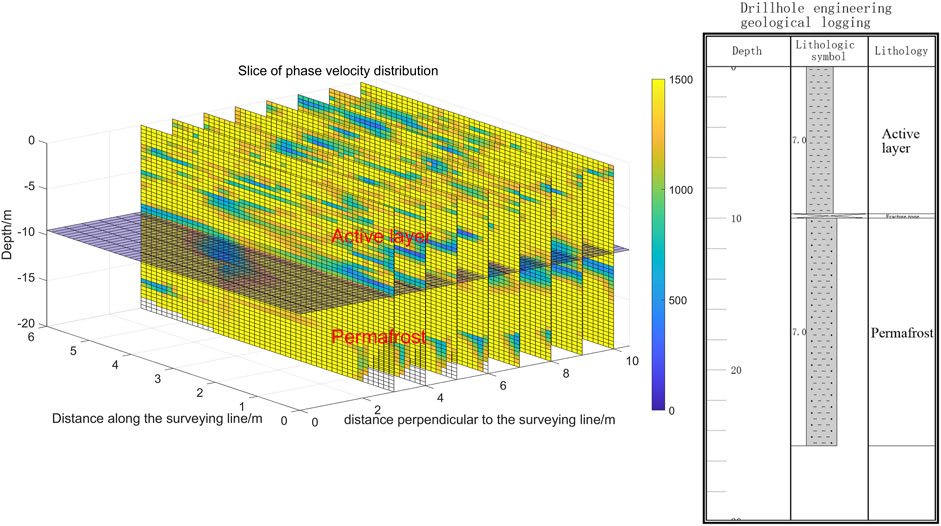
Figure 13. Rayleigh wave frequency distribution slice for permafrost active layer detection and borehole histogram.
Comparing Figures 1, 9, 11, 13, the traditional Rayleigh wave data processing method usually only uses the frequency domain information, and can only analyze the change of Rayleigh wave phase velocity with depth under the survey line (Figure 1), lacking the change of Rayleigh wave in the horizontal direction, so it can only establish the layered geological model. The method proposed in this paper based on the Choi-Williams distribution similarity analysis, while both using the time domain and frequency domain information of Rayleigh wave, can obtain the Rayleigh wave phase velocity distribution along the line direction and depth direction (Figures 9, 11, 13), more clearly showing the velocity structure of the formation below the survey line.
However, there are also some problems to be solved in this method. First, there is no clear standard for the separation of Rayleigh waves at present, which is greatly influenced by the interpretation personnel. Secondly, because this method can directly obtain the phase velocity profile, compared with the traditional interpretation of dispersion curves, it is more difficult to identify the geologic anomalies, and it often needs some interpretation experience to distinguish the true and false anomalies. In view of the above problems, in the follow-up research, the author considered introducing artificial intelligence into Rayleigh wave separation and anomaly delineation, and through accumulating cases, trained the Rayleigh wave separation depth neural network model and anomaly recognition depth neural network, so as to reduce the subjective influence and improve the interpretation efficiency of this method.
In this paper, a Rayleigh wave data processing method based on the Choi‒Williams distribution is proposed, and the method is applied to engineering practice. The following conclusions are obtained:
(1) On the basis of the Choi‒Williams distribution, the time‒frequency characteristics of Rayleigh waves can be obtained. In the subsequent analysis process, on the one hand, the time domain and frequency domain information of the Rayleigh wave can be used at the same time, and on the other hand, the information of different modes of the Rayleigh wave can be used at the same time, thus greatly improving the utilization rate of the Rayleigh wave information.
(2) When the time difference of different frequency components between two adjacent channels is obtained via the Choi‒Williams distribution, the similarity analysis method is proposed in this paper. The time difference between channels is calculated by using the similarity of the time waveforms of each frequency component of each channel, and the calculation results are more accurate and stable.
(3) Compared with the traditional Rayleigh wave data processing method, this paper uses a seismic array to obtain the phase velocity profile of the strata below the seismic array, which greatly improves the transverse resolution of Rayleigh wave detection.
At present, the study on Rayleigh wave exploration mainly focuses on the inversion of dispersion curves, and the key of inversion is the determination of initial formation model. The near surface geological conditions are often complex, and it is difficult to determine the accurate initial model, resulting in poor inversion results. The Rayleigh wave analysis method based on Choi-Williams distribution similarity analysis introduced in this paper does not need inversion, which can greatly reduce the amount of calculation, so as to improve the calculation speed. At the same time, the phase velocity profile of the formation below the line can be obtained by using one seismic arrangement, so as to realize the characterization of underground high-speed or low-speed anomaly bodies and improve the horizontal resolution. Therefore, the analysis method introduced in this paper can be applied to various geological exploration work near the surface, such as underground cavity detection, fracture zone detection, bedrock interface detection, potential disaster causing geological body detection, etc., which is of great significance for the prevention and control of geological disasters in civil engineering, power engineering, water conservancy engineering, mining engineering and other fields.
The original contributions presented in the study are included in the article/supplementary material, further inquiries can be directed to the corresponding author.
MX: Funding acquisition, Software, Writing–original draft, Writing–review and editing. XZ: Data curation, Investigation, Validation, Writing–review and editing. YW: Data curation, Investigation, Writing–review and editing. XY: Investigation, Validation, Writing–review and editing.
The author(s) declare financial support was received for the research, authorship, and/or publication of this article. This study was funded by the Natural Science Foundation of Xinjiang Uygur Autonomous Region (2022D01B131), “Tianshan Yingcai - Youth Top notch Talent” Project of Xinjiang Uygur Autonomous Region and the Open Research Fund of The State Key Laboratory of Coal Resources and Safe Mining, CUMT (SKLCRSM-XJIEKF003).
The authors declare that the research was conducted in the absence of any commercial or financial relationships that could be construed as a potential conflict of interest.
The author(s) declare that no Generative AI was used in the creation of this manuscript.
All claims expressed in this article are solely those of the authors and do not necessarily represent those of their affiliated organizations, or those of the publisher, the editors and the reviewers. Any product that may be evaluated in this article, or claim that may be made by its manufacturer, is not guaranteed or endorsed by the publisher.
Ai, H., Song, X., Zhang, X., Ekinci, Y. L., Balkaya, Ç., Shekar, B., et al. (2025). Full-parametric and joint inversion of multimode surface wave data for identifying glacial ice thickness and freezing extent in subglacial sediments via the hunger games search algorithm. Geophysics 90 (1), KS1–KS14. doi:10.1190/geo2023-0756.1
Choi, H.-I., and Williams, and W. J. (1989). Improved time-frequency representation of multicomponent signals using exponential kernels. Acoust. Speech Signal Process. IEEE Trans.37 (No.6), 862–871. doi:10.1109/assp.1989.28057
Cohen, L. (1966). Generalized phase-space distribution functions. J. Math. Phys. 7 (No.5), 781–786. doi:10.1063/1.1931206
Le, Z., Song, X., Zhang, X., Shen, C., Ai, H., Yuan, S., et al. (2024). Particle swarm optimization for Rayleigh wave frequency-velocity spectrum inversion. J. Appl. Geophys. 222, 105311. doi:10.1016/j.jappgeo.2024.105311
Li, H., Tao, C., Liu, C., Huang, G., Yao, Z., Zhang, H., et al. (2021). Multichannel analysis of surface waves based on short array stacked correlation gather. Soil Dyn. Earthq. Eng. 146, 106747. doi:10.1016/j.soildyn.2021.106747
Liu, L., Zhou, F., Sun, J., Li, G., Qi, S., He, H., et al. (2019). Multichannel method of transient Rayleigh wave detecting in consideration of arrival time difference phase between channels. Prog. Geophys. 34 (No.1), 331–341. doi:10.6038/pg2019BB0176
Mulumulu, E., Polat, O., and Chavez-Garcia, F. J. (2024). Ambient noise tomography of the Aegean region of Turkiye from Rayleigh wave group velocity. Front. Earth Sci. 11, 1265986. doi:10.3389/feart.2024.1375889
Park, C. B., Miller, R. D., and Xia, J. (1999). Multichannel analysis of surface waves. Geophysics 64 (3), 800–808. doi:10.1190/1.1444590
Rayleigh, L. (1885). On waves propagated along the plane surface of an elastic solid. Proc. Lond. Math. Soc. 1 (No.1), 4–11. doi:10.1112/plms/s1-17.1.4
Thomson, T. (1950). Transmission of elastic waves through a stratified solid medium. J. Appl. Phys. 21 (No.2), 89–93. doi:10.1063/1.1699629
Wang, L., Xia, J., Luo, Y., and Bian, A. (2022). Progress and prospect of surface-wave imaging techniques in near-surface applications. Rev. Geophys. Planet. Phys. 53 (No.6), 613–655. doi:10.19975/j.dqyxx.2022-008
Xia, J., Miller, R. D., and Park, C. B. (1999). Estimation of near-surface shear-wave velocity by inversion of Rayleigh waves. Geophysics 64 (3), 691–700. doi:10.1190/1.1444578
Keywords: Rayleigh wave, Choi-Williams distribution, high resolution, similarity analysis, phase velocity imaging
Citation: Xiang M, Zhang X, Wei Y and Yao X (2025) Study of high-resolution analysis of Rayleigh waves on the basis of the Choi–Williams distribution. Front. Earth Sci. 13:1555332. doi: 10.3389/feart.2025.1555332
Received: 04 January 2025; Accepted: 12 February 2025;
Published: 10 March 2025.
Edited by:
Ahmed M. Eldosouky, Suez University, EgyptReviewed by:
Ahmed Reda, Curtin University, AustraliaCopyright © 2025 Xiang, Zhang, Wei and Yao. This is an open-access article distributed under the terms of the Creative Commons Attribution License (CC BY). The use, distribution or reproduction in other forums is permitted, provided the original author(s) and the copyright owner(s) are credited and that the original publication in this journal is cited, in accordance with accepted academic practice. No use, distribution or reproduction is permitted which does not comply with these terms.
*Correspondence: Min Xiang, eGppZXhpYW5nbWluQDE2My5jb20=
Disclaimer: All claims expressed in this article are solely those of the authors and do not necessarily represent those of their affiliated organizations, or those of the publisher, the editors and the reviewers. Any product that may be evaluated in this article or claim that may be made by its manufacturer is not guaranteed or endorsed by the publisher.
Research integrity at Frontiers
Learn more about the work of our research integrity team to safeguard the quality of each article we publish.