 Xiangsheng Zheng
 Yan Zhang
 Yitao Hu
94% of researchers rate our articles as excellent or good
Learn more about the work of our research integrity team to safeguard the quality of each article we publish.
Find out more
ORIGINAL RESEARCH article
Front. Earth Sci. , 17 March 2025
Sec. Geohazards and Georisks
Volume 13 - 2025 | https://doi.org/10.3389/feart.2025.1549734
This article is part of the Research Topic High-Altitude and Long-Runout Landslide Dynamics: Theory, Methods, and Applications View all 4 articles
The frequency and magnitude of landslide disasters triggered by heavy rainfall are on the rise. Investigating the mechanisms behind landslide formation and assessing their stability is essential for enhancing our capabilities in the prevention and control of such disasters. This paper analyzes and summarizes the fundamental characteristics and formation mechanisms of the Shatianpo landslide. Using Geostudio software, we assessed the stability of the landslide under varying rainfall intensities, different support methods, and the combined effects of earthquakes and rainfall. The results indicate that the slope range is unstable under high rainfall intensities, whereas it is lack of stable or basically stable under low rainfall intensities. The stability coefficient of the slope can be improved by 0.3–0.5 with the implementation of anti-slide piles, and its condition can shift from unstable to stable during heavy rainfall events. Furthermore, the research on various anchor bolt support parameters reveals that optimal slope stabilization is achieved when the anchor bolt length is 15 m, with a spacing of 2.5 m between bolts, an anchorage angle of 25°, and anchor placement situated at the middle and front sections of the landslide. Notably, under identical earthquake intensities, the stability coefficient is greater during short-duration heavy rainfall compared to long-duration weak rainfall. This study provides valuable insights for the stability analysis and selection of support measures for similar slopes in the region.
As global climate change intensifies and human engineering activities expand, the frequency and severity of landslides are on the rise, posing a significant threat to human life and socio-economic development. A comprehensive investigation into the causes, development stages, and mitigation strategies of landslides is essential for enhancing our capacity to prevent and manage such disasters.
Given the variations in natural geographical conditions, human activity characteristics, and the demands of social and economic development, the focal points of landslide research differ across regions. For instance, in seismically active areas like Japan and the western coast of the United States, the emphasis is on understanding how earthquakes trigger landslides (Brain et al., 2017; Cheaib et al., 2022). In polar and high-altitude regions, primarily investigates the impact of climate change—such as glacier melting and permafrost thawing—on landslides (Pei et al., 2023). Meanwhile, in mountainous and hilly terrains, the focus shifts to unraveling the formation mechanisms of landslides in complex geological and topographical contexts (Yang and Zhang, 2024).
In southern China, landslides triggered by heavy rainfall are a common occurrence. Research has shown that these landslides typically exhibit characteristics such as seasonality, lag (Ren et al., 2023), and mass occurrence. Current studies on the relationship between rainfall and landslides can be summarized in three key areas:
First, investigations focus on how varying intensities, durations, and frequencies of rainfall impact landslide stability, while also analyzing the temporal and spatial distribution of rainfall in relation to landslide occurrences (Yu et al., 2023; Cui et al., 2024; Li et al., 2024). Second, researchers explore how rainfall affects the stress conditions of rock and soil masses, the mechanical processes that lead to landslides, and the role of groundwater in triggering these events (Huang et al., 2022; Wang et al., 2022; Zhuang et al., 2024). Third, analyze and summarize rainfall-induced landslide events and use relevant simulation software to model stability after landslide mitigation efforts (Amin et al., 2022; Gao et al., 2023).
The prevention and control of rainfall-induced landslides can be approached from two perspectives. On the one hand, the risk of landslides can be reduced through ecological measures such as vegetation restoration and soil improvement (Kumar et al., 2024). On the other hand, engineering solutions include excavation and uninstallation (Wang et al., 2023), the installation of drainage ditches (Zhang et al., 2023), the implementation of protective networks (Tao et al., 2022), the use of anchor bolt support (Xue and Zhu, 2023), the installation of buried anti-slide piles (Han et al., 2023), and the construction of retaining walls (Purwitaningsih and Asano, 2024), among other methods of landslide prevention and control.
Despite extensive research by numerous scholars on landslides triggered by rainfall, which has generated a wealth of findings, several challenges and shortcomings remain in the current literature. For instance, our understanding of rainfall infiltration processes and the mechanisms of landslide occurrence under complex geological conditions is still incomplete. Additionally, the applicability and accuracy of various support schemes across different regions and working conditions require further validation.
To investigating the stability characteristics of slopes under various rainfall intensities and support methods, this paper uses the Shatianpo landslide in Yunyang County, Chongqing City, Southwest China as a case study. Through field investigations and a series of simulation analyses, this paper examine the changes in pore water pressure and total water head within the slope under different rainfall intensities, assessing the slope’s overall stability. Then, we calculate the stability coefficient for the slope under various support methods, comparing and analyzing the effectiveness of two specific support schemes in enhancing slope stability. Finally, we analyze the stability of the landslide under the combined effects of earthquakes and rainfall. The findings not only provide valuable insights for stability analysis of similar slopes under varying rainfall and earthquake conditions, but also assist in selecting appropriate support measures for other slopes in the region.
The research site is located in Shuangjiang Street, Yueyang County, Chongqing City, with geographical coordinates of 30°56′21″N latitude and 108°41′42″E longitude. The region experiences an average annual temperature of 18.7 °C and receives an average annual rainfall of 1,145.1 mm. Characterized by a tectonic denudation slope landform, the terrain higher in the south and lower in the north, resulting in an elevation difference of approximately 70 m. Generally, the slopes in the area are gentle, ranging from 15° to 30°, but the front slope exceeds 60°, and certain local areas are nearly vertical. On the left front of the landslide, there is a steep slope composed of a rock-soil mix that has been supported (Figure 1A), while the right side features an exposed rock steep slope.

Figure 1. Overview and deformation characteristics of the Shatianpo landslide. (A) is the overall view of the landslide; (B, C) show cracks at the rear edge of the landslide near the house; (D, E) illustrate localized cracks and collapses in the house wall at the rear edge; (F, G) present cracks in the toilet wall at the rear edge; (H–J) capture various deformation and failure phenomena observed on different sidewalks in the middle and front edges of the landslide.
The stratigraphy of the research area, arranged from youngest to oldest, is described as follows: (1) Quaternary Holocene Artificial Fill (Q4ml): This layer consists of gravelly soil and silty clay intermixed with crushed stone, exhibiting a loose to slightly dense structure. The backfilling occurred between 5 and 20 years ago, with a thickness ranging from 3 to 7 m. (2) Quaternary Holocene Residual Slope Deposit (Q4el+dl): Composed primarily of silty clay, this layer has a thickness ranging from 0.3 to 1 m. (3) Quaternary Holocene Collapse-Slope Deposit (Q4col+dl): This yellowish-brown layer mainly consists of silty clay and sandstone fragments, characterized by a loose to medium-dense structure. The silty clay is partially plastic to soft plastic, while the sandstone fragments are subangular. The debris content is approximately 55%–80%, with block diameters generally between 6 and 15 cm. The thickness of this layer ranges from 4 to 8.2 m, serving as the material source for the landslide accumulation layer (Q4del). (4) Jurassic Middle Shaximiao Formation (J2S): This formation comprises thick to very thick layers of sandstone mixed with mudstone. The sandstone is light gray to dark gray, primarily composed of feldspar and quartz, and exhibits a medium to coarse-grained structure. The rock mass is relatively intact and hard, although it shows significant surface weathering. The mudstone is dark red, predominantly consisting of clay minerals with an argillaceous structure. This rock mass is fragmented, relatively soft, and also exhibits severe surface weathering.
The research area and its surroundings show no signs of faults or tectonic fracture zones. Instead, two main groups of structural fractures are present in the strata: (1) The first group has a occurrence of 206°∠85°. These fractures are closed, displaying no significant filling or cementation, and their connectivity is poor. The spacing between the fractures ranges from 1.5 to 4.5 m, with an extension length of approximately 10–15 m. (2) The second group has a occurrence of 135°∠78°. Similar to the first group, these fractures are closed and show no filling or cementation. However, their connectivity is slightly better than that of the first group. The spacing between these fractures also ranges from 1.5 to 4.5 m.
The seismic fortification intensity in the study area is classified as VI degrees, with a peak ground motion acceleration value of 0.05 g.
Groundwater in the research area is primarily divided into two types: pore water from Quaternary loose rocks and bedrock fracture water. Pore water from Quaternary loose rocks is predominantly found within Quaternary landslide deposits and is mainly replenished by atmospheric precipitation. In contrast, bedrock fracture water primarily exists in the fissures of sandstone and mudstone. Its quantity is significantly influenced by topography, geomorphology, and geological structure. The recharge sources for bedrock fracture water include atmospheric precipitation and pore water from the overlying Quaternary loose rocks. This water typically drains from low-lying areas in multiple directions or emerges at spring points along the interface between sand and mudstone.
The Shatianpo landslide exhibits a distinctive “meniscus” shape in its planar view (Figure 1A). It measures approximately 70 m in length, around 200 m in width, and has an average thickness of about 6 m. The total area of the landslide is roughly 1.2 × 10⁴ m2, with an estimated volume of 7.2 × 10⁴ m3. The primary direction of movement is approximately 350°. Classified as a shallow soil landslide, its rear edge is marked by a penetrating crack, while the left side is bordered by a rock ridge. The right side is characterized by a landslide deformation boundary, and the front shear outlet features a rock scarp or a supported slope. The profile along Section 1-1' is situated within a zone of weak deformation and remains basically stable under both natural and rainstorm conditions. Therefore, it will not be discussed further in this paper. Engineering geological profiles for sections 2-2' and 3–3′ are presented in Figure 2.
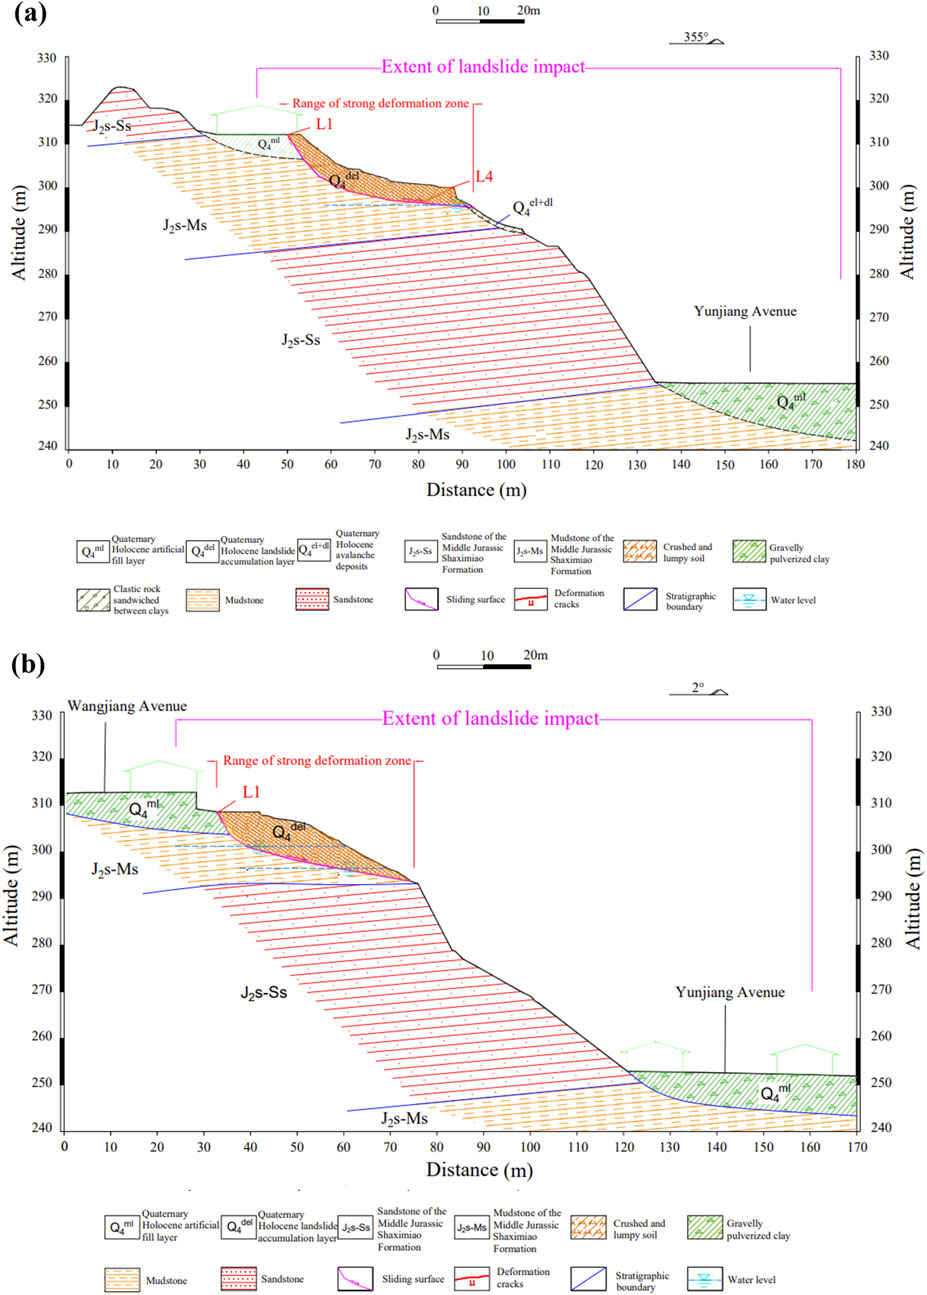
Figure 2. Engineering geological profiles of the Shatianpo landslide. (A) 2–2′ profile. (B) 3–3′ profile.
The thickness of the sliding body ranges from 4.0 to 8.2 m, with an average thickness of approximately 6 m. It is primarily composed of Quaternary Holocene collapse-slope deposits (Q4col+dl), where the debris stone content varies from 55% to 80%, increasing with depth. The particle sizes range from 8 to 40 cm, and in certain localized sections, stone particle sizes can exceed 10 m. The stones are predominantly subangular, strongly weathered, and primarily consist of sandstone.
The investigation reveals that soil and strongly weathered mudstone segments in the soil-rock contact zone, observed in some boreholes, exhibit significant mudding and kneading phenomena. The debris at the soil-rock interface, as well as within the soil, is subangular and shows no signs of grinding, indicating that the potential slip surface is at the soil-rock interface. The gravel soil at this interface is slightly moist and exhibits a loose structure, with crushed and block stone content ranging from 20% to 35%. Particle sizes typically range from 2 to 5 cm, with the stones being subangular and heavily weathered. The silty clay present has medium dry strength, moderate toughness, no shaking reaction, high water content, and a soft plastic consistency. The profile 2–2′ indicates that the potential slip plane is nearly curved, with a steeper rear section inclined at 20–30°, while the middle and front sections are more gradual, with an inclination generally between 5 and 15°. The overall inclination of the slip plane is approximately 20°.
Drilling and field investigations have identified the sliding bed as an interlayer of sandstone and mudstone within the Middle Jurassic Shaximiao Formation (J2S), with the dominant rock strata occurrence is 205°∠6°. The sliding bed follows a broken line pattern along the main direction of the slide, with an average dip angle of about 20°. In terms of lithology, mudstone exhibits low strength, while sandstone demonstrates high strength. The depth of the sliding bed, as exposed in the drilling holes, ranges from 4 to 18 m, and the thickness of the strongly weathered layer varies from 0.8 to 6.4 m.
Currently, the deformation of the Shatianpo landslide is primarily concentrated at the rear edge, middle area, and right side, which is identified as the strong deformation zone. In contrast, the left side of the landslide, designated as the weak deformation area, shows minimal slope deformation due to the steep front slope being supported by hanging net shotcrete (Figure 1A). The deformation and failure characteristics of different sections of the Shatianpo landslide are detailed below.
At the rear edge: In June 2022, a downward crack appeared at the door of a house (Figure 1B). This crack extends approximately 30 m, arching from east to west, with a width ranging from 3 to 20 cm and a drop height of about 10 cm. These cracks have also impacted the walls of the house (Figure 1D) and the public toilet (Figure 1F). In March 2023, the deformation of the initial crack intensified, resulting in a penetrating crack (Figure 1C). The length of the crack increased to 60 m, the opening width expanded to 40 cm, and the drop height rose to 50 cm. Concurrently, localized collapses occurred in the cracked wall (Figure 1E), and the wall of the public toilet developed new cracks after previously closing (Figure 1G).
In the middle area: In March 2023, additional cracks were observed at L2 of the sidewalk, with previously closed cracks re-opening (Figure 1H). Compared to June 2022, the visible length of these cracks increased from 0.5 to 2 m to 2–3 m, while the width grew from 0.5 to 2 cm to 2–5 cm. At L6 of the sidewalk, signs of fracture and bulging were evident (Figure 1J), with significant water permeation and pronounced deformation occurring.
At the front edge: In March 2023, new cracks emerged at L5 of the sidewalk, and previously closed cracks re-opened (Figure 1I). Compared to June 2022, the visible length of these cracks increased from 0.5 to 2 m to 2–3 m, and the width expanded from 0.3 to 1.5 cm to 2–8 cm. There is considerable water seepage at the soil-rock interface of the steep rocky slope in this area.
Additionally, five fixed monitoring points were established along the front edge, middle, and rear edge of the landslide to facilitate timely tracking of its deformation. One of these points, QL01, is located at the wall of the public toilet (Figure 1A). Monitoring results at QL01 indicated a significant increase in the width of the penetration cracks (Figure 1C) at the rear edge of the landslide, rising from 3.4 cm to 6.7 cm between April 27 and June 6. Continuous rainfall from May 29 to June 6 contributed an additional 1.8 cm of widening. These monitoring data confirm that the landslide is experiencing ongoing deformation, with the most pronounced changes occurring at the rear edge.
The formation and development of the Shatianpo landslide are influenced by several factors, primarily in the following aspects:
(1) Topography. The slope generally ranges from 25° to 35°, with steep slope areas exceeding 60°. The local terrain is nearly vertical, creating favorable spatial conditions for landslide formation.
(2) Geological structure and stratigraphic lithology. Differential weathering of mudstone masses can lead to the formation of cavities, resulting in hazardous rock masses. When these rock masses collapse, they create numerous accumulations at the foot of the slope, which serve as material sources for the landslide’s development.
(3) Hydrological conditions. The research area functions as a surface water collection zone during the rainy season. Rainwater infiltration saturates the soil, while pore water pressure and osmotic pressure from groundwater diminish the physical and mechanical properties of the soil at the soil-rock interface, ultimately reducing slope stability.
(4) Human activities. Highway slope cutting creates a free surface at the front of the slope, leading to the removal of “blocking” material that decreases the slope’s resistance to sliding. Additionally, human activities, such as house construction at the rear edge, result in the accumulation of significant building materials, which further increases the sliding force on the slope.
The formation mechanism of the Shatianpo landslide is illustrated in Figure 3. Initially, highway slope cutting and house construction alter the slope’s profile and lead to the accumulation of substantial building materials on the slope (Figure 3A). Over time, the joint cracks in the rock mass of the steep cliff zone adjacent to the landslide continue to increase, widen, and deepen (Figure 3B), ultimately resulting in a collapse. This collapse generates numerous accumulation bodies in the slightly gentler terrain below the steep cliff (Figure 3C). The lithology of these accumulation bodies primarily consists of fragmented stones, which exhibit good water permeability. In contrast, the silty clay content near the soil-rock contact zone is high, leading to relatively poor water permeability. During periods of heavy rainfall, the infiltration of surface water into the bedrock is hindered, causing the majority of the water to migrate along the soil-rock interface. This process softens the soil in the slip zone and reduces its strength due to groundwater influence, resulting in deformation of the slope body. Additionally, the steep angle of the contact interface between the soil and rock concentrates stress further under prolonged deformation, ultimately leading to sliding (Figure 3D). Based on the classification of landslide failure mechanisms by Zhang et al. (2016), the failure mode of the Shatianpo landslide is characterized as sliding-cracking.
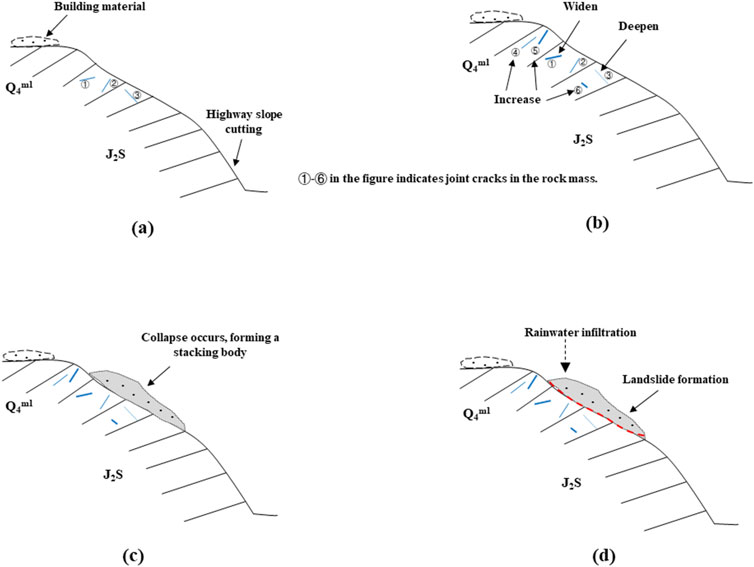
Figure 3. Schematic diagram of the formation mechanism of the Shatianpo landslide.
To further investigate the impact of rainfall intensity on the stability of the Shatianpo landslide, this study primarily employs the SLOPE/W, SIGMA/W, and SEEP/W modules within the GeoStudio software for analysis.
To facilitate modeling and calculations, we establish the following foundational assumptions based on relevant literature (Liu et al., 2020; Ortiz-Giraldo et al., 2023): (1) The model material is considered a homogeneous and isotropic continuum. (2) The rock and soil body is treated as an ideal elastic-plastic entity, with forces and deformation regarded as plane strain problems. (3) Structural stress is excluded, and the initial stress field accounts solely for the gravitational stress of the rock and soil mass. (4) Rainwater evaporation and vegetation absorption are disregarded.
To clarify the applicability of the above hypotheses to the Shatianpo landslide, it is essential to consider the geological characteristics and environmental conditions specific to this site. First, treating the model material as a uniform and isotropic continuum is justified, as the Shatianpo exhibits a relatively consistent geotechnical composition, which simplifies the analysis. Second, the ideal elastic-plastic model effectively captures the deformation and failure behavior of the Shatianpo under external forces, particularly under plane strain conditions, allowing for a more accurate reflection of actual conditions. Furthermore, focusing solely on the gravitational stress in the initial stress field is appropriate, given that the gravitational effect is typically the primary factor influencing the slope’s stability. Lastly, it is reasonable to ignore rainwater evaporation and vegetation absorption in the short term, especially during periods of extreme rainfall, as these factors generally have a minimal impact on slope stability. In summary, these assumptions are valid for analyzing the Shatianpo landslide and provide a solid foundation for subsequent stability assessments.
A finite element model has been established using the 3–3′ profile of the Shatianpo landslide as a case study (Figure 4). The model’s base measures approximately 170 m in length and 73 m in height, employing quadrilateral computing units with a grid area of about 1 m2. The entire slope model is divided into 7,028 units, with different regions representing various strata: regions 1 and 5 correspond to Q4ml silty clay crushed stone soil, regions 2 and 4 to J2Ms mudstone, region 3 to J2Ss sandstone, and region 6 to Q4del sandstone crushed stone soil. The material’s constitutive model is defined as elastoplastic, utilizing the Mohr-Coulomb yield criterion for the strength criterion. Boundary conditions are set such that the bottom of the model is fixed in both the X and Y directions, while the left and right sides are fixed in the X direction.
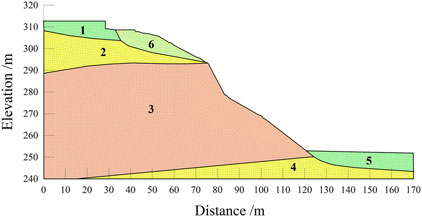
Figure 4. Schematic diagram of the calculation model for the 3–3′ profile of the Shatianpo landslide.
Two working conditions are analyzed to assess landslide stability, resulting in a safety factor of 1.18, calculated using the interpolation method:
(1) Natural working condition: This condition considers only the weight of the slope body, surface loads, and groundwater pressure.
(2) Rainstorm working condition: In this scenario, the model incorporates the effects of a rainstorm occurring over 20 years, with a rainfall rate of approximately 250 mm/day, in addition to the factors considered in the natural working condition (slope body weight, surface load, and groundwater pressure).
Due to the gravel soil of the sliding body and its excellent water permeability, it is considered to be completely saturated under rainstorm conditions. Based on the results of laboratory tests and a review of existing literature (Oliveira et al., 2022; Zuo et al., 2022; Yang et al., 2023), the mechanical and hydrological parameters are presented in Table 1.
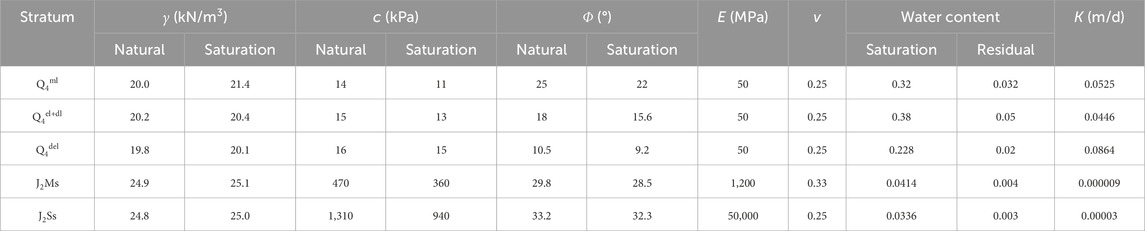
Table 1. Statistics of stratum parameters.
This paper employs three limit equilibrium analysis methods—Bishop, Janbu, and Morgenstern-Price—to calculate the stability coefficients for the 2–2′ and 3–3′ profiles of the Shatianpo landslide under both natural and rainstorm working conditions. The results are presented in Figure 5. Among, The relationship between the slope stability coefficient (Fs) and the slope stability state is defined as follows: If Fs < 1.00, the slope is unstable; If 1.00 ≤ Fs < 1.05, the slope is lack of stable; If 1.05 ≤ Fs < 1.18, the slope is basically stable; If Fs ≥ 1.18, the slope is stable.
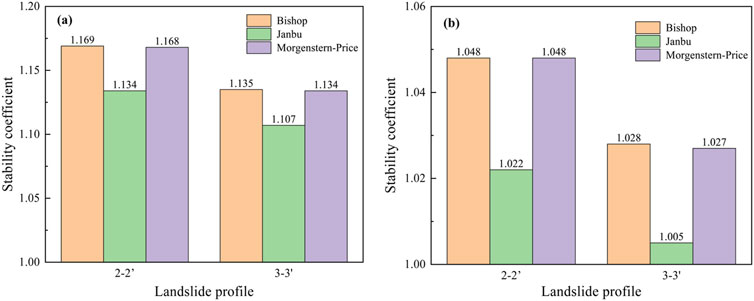
Figure 5. Stability calculation results for the 2–2′ and 3–3′ profiles of the Shatianpo landslide before treatment. (A) Natural working condition. (B) Rainstorm working condition.
As illustrated in Figure 5, the stability coefficients for the 2–2′ and 3–3′ profiles fall between 1.05 and 1.18 under natural working conditions, indicating that the slope is basically stable. However, under rainstorm working conditions, the stability coefficients for both profiles decrease and remain between 1.0 and 1.05, suggesting a lack of stable. While the values for the 2–2′ and 3–3′ profiles are comparable under both natural and rainstorm working conditions, the stability coefficient for the 3–3′ profile is consistently lower than that of the 2–2′ profile, regardless of the analysis method used. This indicates that the stability of the 3–3′ profile is inferior to that of the 2–2′ profile. Additionally, the results obtained using the Bishop and Morgenstern-Price methods are quite similar, whereas the Janbu method yields lower stability coefficients than the other two.
Given that both the 2–2′ and 3–3′ profiles exhibit a lack of stable under rainstorm working conditions, and considering that the 3–3′ profile shows lower stability than the 2–2′ profile, this paper further investigates the distribution characteristics of stress, strain, and displacement in the 3–3′ profile under rainstorm working conditions (Figure 6).
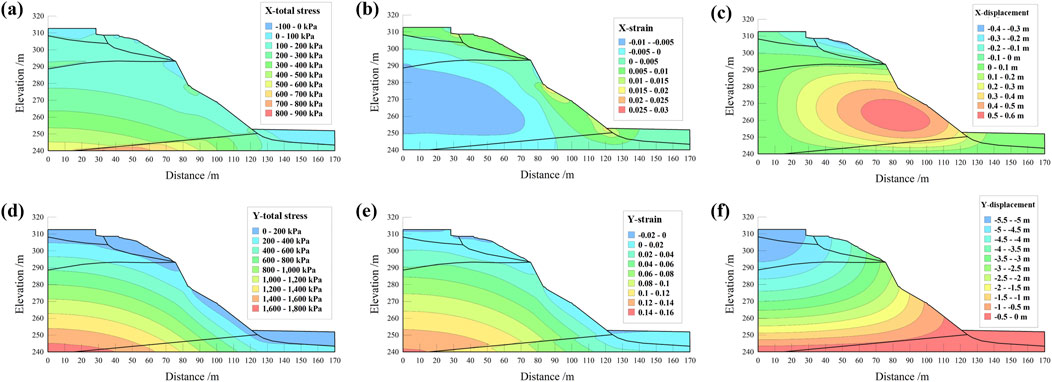
Figure 6. The distribution of stress, strain and displacement in the 3–3′ profile of the Shatianpo landslide. [(A, D) represents total stress in the X and Y-directions, respectively; (B, E) represents strain in the X and Y-directions, respectively; (C, F) represents displacement in the X and Y-directions, respectively].
As illustrated in Figure 6, the total stress in the Y-direction exceeds that in the X-direction, with stress levels decreasing as altitude increases (Figures 6A, D). This phenomenon occurs because rainfall infiltration saturates the soil, thereby increasing gravitational forces in the Y-direction. Regarding strain, the strain values in the X-direction are higher closer to the slope surface, with the maximum strain occurring at the intersection or watershed of the formation boundary (Figure 6B). In contrast, strain in the Y-direction decreases with increasing altitude, and some regions near the surface even exhibit negative strain values (Figure 6E). In terms of displacement, the steep slope of the 3–3′ profile results in greater displacement in the Y-direction compared to the X-direction during landslide failure (Figures 6C, F). The maximum displacement in the X-direction is observed in the middle of the slope (positive) and at the top of the slope (negative) (Figure 6C), while the displacement in the Y-direction increases progressively with elevation, peaking at the top of the slope (Figure 6F).
Rainfall infiltration into soil and rock exhibits a notable lag, making it challenging to pinpoint the precise timing of landslides and other rainfall-induced disasters. These incidents may not occur during rainfall but rather days afterward. Consequently, investigating the distribution of seepage fields on slopes under extended rainfall conditions is crucial for a comprehensive analysis of slope stability.
This study focuses on the 3–3′ profile, considering the actual rainfall patterns in the research area. We established four distinct rainfall working conditions: (1) Average rainfall during non-rainy season (November-April), I = 2 mm/d, t = 30 days; (2) Average rainfall during the rainy season (May-October), I = 5 mm/d, t = 30 days; (3) Half of the maximum daily rainfall in history, I = 200 mm/d, t = 15 days; (4) The maximum daily rainfall in history, I = 400 mm/d, t = 4 days. Where I represents rainfall intensity and t represents rainfall duration.
Based on the varying durations of rainfall across these working conditions, distinct time intervals were established. For working conditions 1 and 2, the intervals were set at 1, 5, 10, 15, 20, and 30 days. For working condition 3, the intervals were 1, 5, 10, and 15 days, and for working condition 4, the intervals were 2 h, 12 h, 36 h, 60 h, 84 h, and 96 h. After considering multiple factors, working condition 1 and 4 were selected for in-depth analysis. Adverse boundary conditions for continuous multi-day rainfall were established to calculate changes in pore water pressure and total water head within the slope’s seepage field over time (Figure 7).
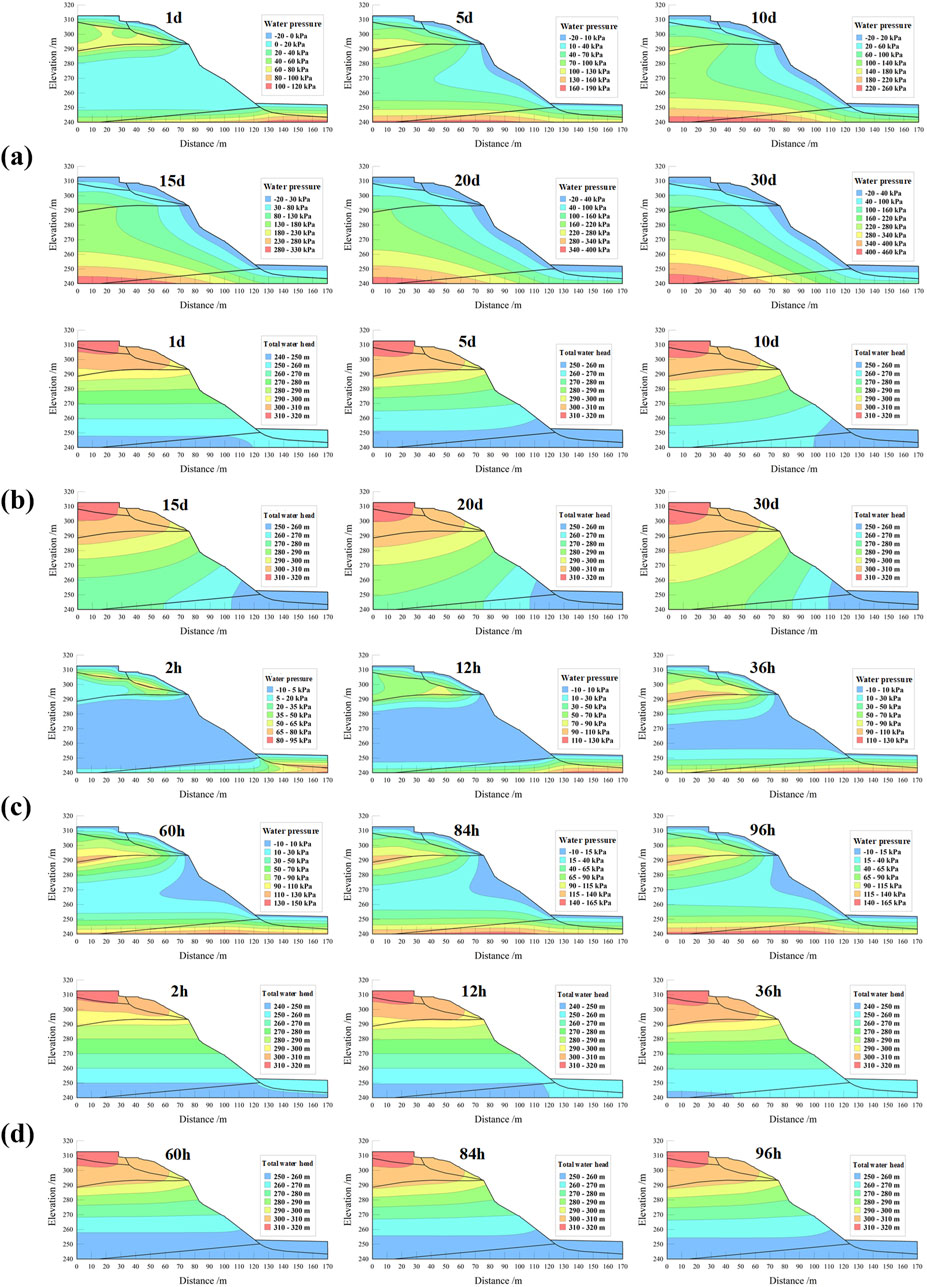
Figure 7. The distribution of pore water pressure and total water head in the 3–3′ profile. [(A, B) represent working condition 1, and (C, D) represent working condition 2; (A, C) represent pore water pressure, and b and d total water head].
Figure 7A illustrates that as rainfall duration increased from the 1st to the 30th day, pore water pressure rose from 120 kPa to 460 kPa. The observed distribution indicated that pore water pressure was lower near the slope surface and top. On the first day of rainfall, the central region of the slope exhibited low pore water pressure due to the short duration of rainfall, which had not allowed for complete infiltration. Additionally, the mudstone at the slope’s apex provided strong water insulation, further complicating rainwater infiltration. With prolonged rainfall, surface water at the top of the slope gradually infiltrated down to the groundwater level, replenishing it and subsequently increasing pore water pressure within the slope, thereby enhancing the sliding force.
As shown in Figure 7B, the total water head steadily increased with longer rainfall durations but remained largely within the range of 240–320 m. Notably, significant changes in total water head occurred between the 5th and 10th days, during which the range of low water head decreased rapidly. After the 10th day, changes in total water head became minimal.
As illustrated in Figure 7C, with the increase in rainfall duration, the range of lower pore water pressure in the middle of the slope gradually diminishes, while the range of higher pore water pressure at the top and base of the slope progressively expands. This phenomenon occurs because the rainwater at the slope’s summit is impeded by a mudstone water barrier, preventing timely drainage and causing substantial rainwater accumulation, which elevates pore water pressure at the top of the slope. Additionally, the foot of the slope serves as a groundwater drainage area, while the sandstone in the middle section exhibits higher permeability. Rainwater flows downward, accumulating at the base and resulting in an increase in pore water pressure there.
Figure 7D illustrates how the total water head within the slope fluctuates with increasing rainfall duration. As the duration of rainfall extends from 2 h to 36 h, the total water head range at heights of 240–250 m gradually decreases, while the ranges at other heights progressively increase. Notably, the total water head range at heights of 250–260 m exhibits the most significant change. Once the rainfall duration reaches 36 h, the total water head range at 250–260 m begins to gradually decline, whereas ranges at other heights continue to increase, though these changes are less pronounced. The findings indicate that after 60 h of rainfall, slope infiltration reaches its maximum saturation level. Beyond this point, further increases in rainfall duration result in minimal changes to the total water head.
To evaluate the slope’s stability under varying rainfall intensities, we analyzed the stability coefficients of the 2–2′ and 3–3′ profiles under different rainfall working conditions, as depicted in Figure 8. The data reveals that, regardless of the specific conditions, the stability coefficient consistently decreases with increasing rainfall duration, although the rates of decline differ.
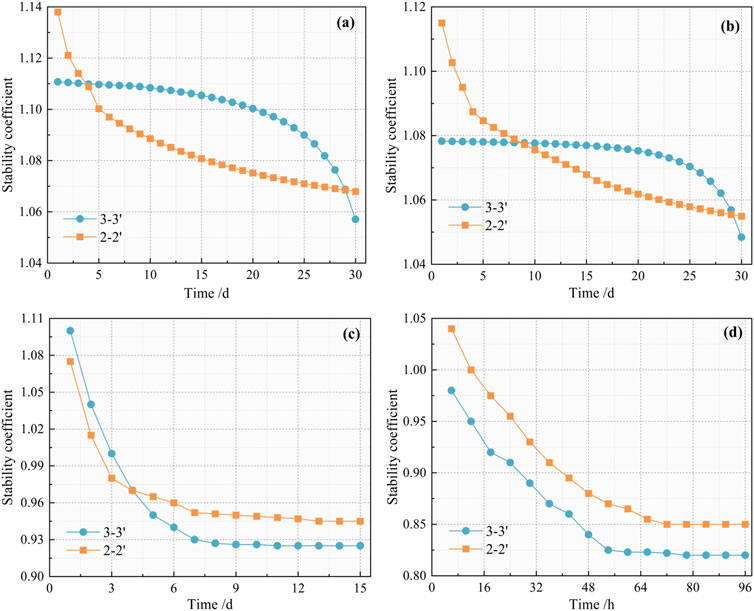
Figure 8. Variation of the slope stability coefficient under different rainfall working conditions. [(A–D) represent working conditions 1, 2, 3 and 4, respectively].
Figures 8A, B illustrate that for the 2–2′ profile, the stability coefficient experiences a rapid decrease from 0 to the 5th day. From 5th to 30th days, the rate of decline gradually slows. On the 30th day, the stability coefficients are all greater than 1.05 and less than 1.18, indicating that the slope remains basically stable under working conditions 1 and 2. In contrast, for the 3–3′ profile, the stability coefficient declines slowly until day 15. After day 15, the rate of decline accelerates, reaching its minimum value on the 30th day. At this point, the stability coefficient for Figure 8A exceeds 1.05, while that for Figure 8B falls below 1.05, suggesting that the slope is basically stable under working condition 1 but lack of stable under working condition 2. The observed differences between the stability coefficients of the 2–2′ and 3–3′ profiles may be attributed to the higher mudstone content in the upper section of the 3–3′ profile. This composition limits rainwater infiltration, causing the changes in its stability coefficient to lag behind those of the 2–2′ profile.
As illustrated in Figure 8C, the stability coefficients of the 2–2′ and 3–3′ profiles exhibit similar trends: they decrease rapidly from 0 to 3rd days. From 3rd to 7th days, the rate of decline gradually slows. After 7th day, the stability coefficients remain relatively constant. On the 15th day, all stability coefficients fall below 1.0, indicating that the slope is in an unstable state at this time. Figure 8D shows that the stability coefficient of the 2–2′ profile gradually decreases until 72 h, after which it stabilizes. During the period from 0 to 54 h, the stability coefficient of the 3–3′ profile also gradually declines and stabilizes after 54 h, consistent with the trend observed in the total water head changes depicted in Figure 7D. At 96 h, the stability coefficients for both the 2–2′ and 3–3′ profiles drop below 1.0, indicating that the slope is unstable at this point.
In summary, the slope is lack of stable or basically stable under working conditions 1 and 2, while it is unstable under working conditions 3 and 4.
The analysis reveals that under conditions of heavy and continuous rainfall, the area of strong deformation within the landslide is in an unstable state. Therefore, it is essential to implement measures to enhance the stability of the Shatianpo slope. This section provides a comprehensive analysis of the slope’s stability under various support methods.
Anti-slide piles provide robust resistance to sliding while minimally disturbing the slope structure. The principle behind their effectiveness is to prevent the sliding mass from moving by embedding the piles within the slope and utilizing the piles' shear strength and bending capacity. This section focuses on profiles 2–2′ and 3–3′ to calculate their stability coefficients after the implementation of anti-slide pile support under both natural and rainstorm conditions, comparing these results with those obtained prior to treatment.
The specific specifications for the anti-slide piles in this scheme are as follows: the cross-sectional dimensions are 2 m × 2.5 m, the horizontal spacing between piles is 4 m, with a total of 30 piles arranged in a multi-row configuration (Figure 9).
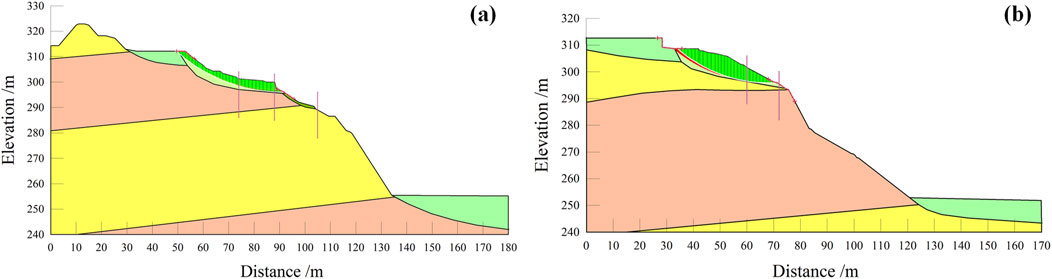
Figure 9. Schematic diagram of the anti-slide pile layout for the 2–2′ and 3–3′ profiles of the Shatianpo landslide. (A) 2–2′ profile. (B) 3–3′ profile.
The stability coefficients were organized before and after the landslide treatment, and the results are presented in Figure 10. The figure demonstrates that, regardless of the working conditions, the stability coefficients for each profile have improved following the treatment, with enhancements ranging from 0.3 to 0.5. Under natural conditions, the stability of the landslide shifts from a state of being basically stable to stable, while under rainstorm conditions, it transitions from unstable to stable. This indicates that the implemented control scheme effectively enhances the slope’s stability.
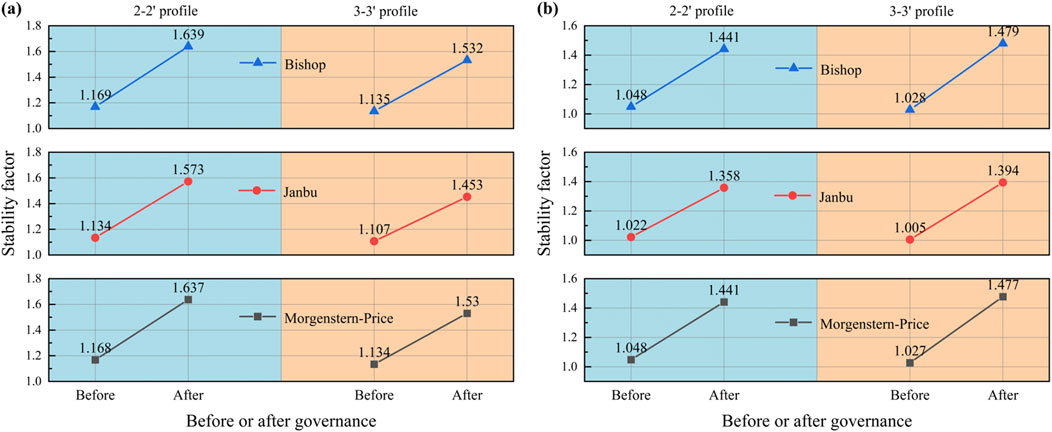
Figure 10. Comparison of stability coefficients for the 2–2′ and 3–3′ profiles of the Shatianpo landslide before and after treatment. (A) Natural working condition. (B) Rainstorm working condition.
The principle of using anchor bolts to control landslides involves anchoring one end into a stable formation while connecting the other end to the sliding mass. The tensile strength of the anchor bolt is then employed to exert an anti-sliding force on the sliding body, thereby preventing movement. Compared to other treatment methods, anchor bolt treatment is characterized by its ease of construction, strong adaptability, and cost-effectiveness. In this section, the 3–3′ profile is selected as the focus of the study, and an optimal anchor bolt support scheme is designed by analyzing the slope stability results under various support parameters (spacing, angle, and position) during rainstorm conditions.
To determine the appropriate anchor bolt spacing, the spacings are set at 2.0 m, 2.5 m, 3.0, 3.5, 4.0, and 5.0 m, based on reference data and existing engineering cases. Specifically, the anchor bolts are 15 m long, positioned at an anchorage angle of 20°, and located in the middle and front sections of the slope. The stability coefficients of the slope under different anchor bolt spacings were calculated using the Morgenstern-Price method, with the results presented in Figure 11A.
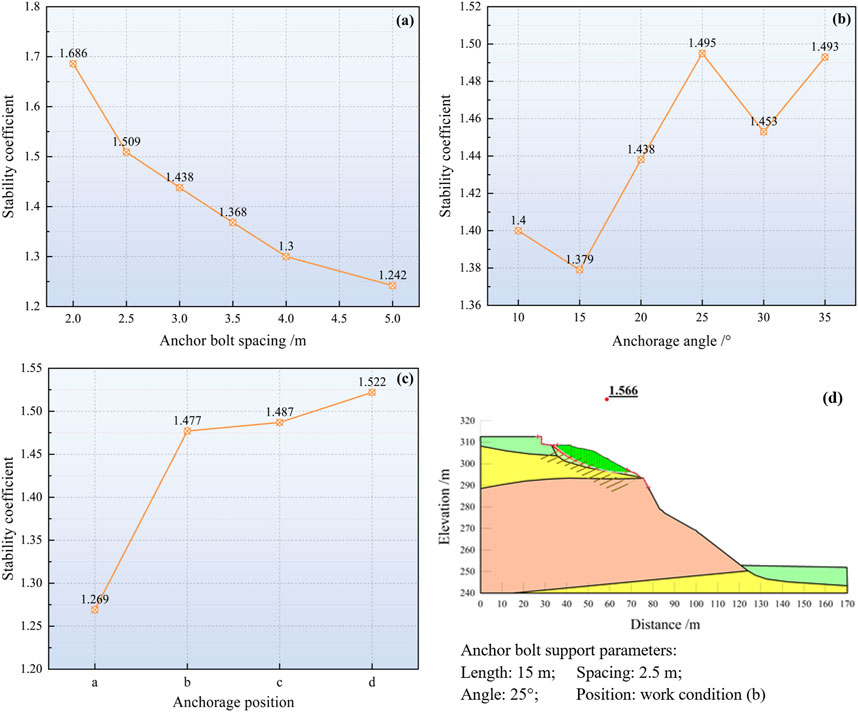
Figure 11. Changes in the stability coefficient of Shatianpo landslide under different anchor bolt support parameters and the stability coefficient under the optimal anchor bolt support scheme. (A) Anchor bolt spacing. (B) Anchorage angle. (C) Anchorage position. (D) The optimal anchor bolt support scheme.
Figure 11A illustrates that anchor bolt spacing significantly impacts slope stability. As the spacing increases, the stability coefficient decreases. When the spacing is increased from 2.0 m to 5.0 m, the stability coefficients drop from 1.686 to 1.242. Nevertheless, both values remain above 1.18, indicating that the slope remains stable. Therefore, to balance safety and cost-effectiveness, it is recommended to set the anchor bolt spacing between 2.0 m and 3.0 m.
To determine the optimal anchorage angle for the anchor bolts, while keeping the anchor bolt length at 15 m and the anchor position in the middle and front of the slope, the spacing was set to 3.0 m. The anchorage angles were varied at 10°, 15°, 20°, 25°, 30°, and 35°. The stability coefficients of the slope under these different angles were calculated, and the results are depicted in Figure 11B.
Figure 11B shows that while the stability coefficients change with varying anchorage angles, they consistently remain above 1.18, indicating stable conditions. A comparison of Figures 11A, B reveals that the anchorage angle has a less significant impact on the slope stability coefficient than the anchor bolt spacing. The stability coefficients fluctuate with changes in the anchorage angle, decreasing gradually between 10° to 15° and 25°–30°, while increasing between 15° to 25° and 30°–35°. The highest stability coefficient, 1.495, occurs at an anchorage angle of 25°, suggesting this is the optimal angle. However, during actual construction, considerations regarding ease of installation and the safety of the anchor bolts are also important. Therefore, an anchorage angle within the range of 20°–35° can adequately meet the safety requirements for the slope.
The effectiveness of anchor bolts in supporting slopes varies significantly with the position of the support. To explore the impact of anchorage position on slope stability, four support conditions were established: (a) support only at the front edge of the slope; (b) support at both the front edge and the middle of the slope; (c) support at the front edge, the middle, and a portion of the bedrock steep slope at the front edge; and (d) support at the front edge, middle, and rear edge of the slope. In this analysis, the anchor bolt length remains constant at 15 m, with an anchor bolt spacing of 3 m and an anchorage angle of 25°. The stability coefficients of the slope under various anchorage positions were calculated using the Morgenstern-Price method, with the results shown in Figure 11C.
Figure 11C demonstrates that the effectiveness of anchor bolt support in enhancing slope stability varies significantly with different support configurations. The stability coefficients for the four conditions, in descending order, are (d) > (c) > (b) > (a). Although the slope remains stable under condition (a), its stability coefficient is only 1.269 due to the limited support range, making it potentially unstable under heavy rainfall or other influences such as blasting. For conditions (b) and (c), despite differing support ranges, the stability coefficient difference is minimal, at just 0.01. Investigations indicate that the landslide’s sliding surface lies on stable sandstone bedrock, thus anchoring it has little effect on overall stability. Considering construction time and costs, condition (b) is preferred over condition (c). While condition (d) yields the highest stability coefficient, it increases the workload at the slope’s rear edge. The improvement in stability coefficient compared to condition (b) is minimal (only 0.045), making condition (d) less optimal.
In conclusion, balancing support effectiveness and construction costs, condition (b)—which provides support at the front edge and middle of the slope—is identified as the optimal support condition.
Based on the analysis of anchor bolt spacing, anchorage angle, and anchorage position, the comprehensive slope anchor bolt support scheme is determined as follows: the anchor bolt length is 15 m, the spacing is 2.5 m, the anchorage angle is 25°, and the anchorage position is at the front edge and middle of the slope. The stability coefficient of the slope after implementing this optimal anchor bolt support scheme is illustrated in Figure 11D.
Figure 11D illustrates that the implementation of the optimal anchor bolt support scheme results in a stability coefficient of 1.566 for the slope, significantly exceeding the threshold of 1.18, which indicates stability. In comparison, the anti-slide pile scheme yields a stability coefficient of 1.450, based on an average of results from three limit equilibrium methods. This demonstrates that the anchor bolt scheme is more effective in enhancing the slope’s stability.
In addition to rainfall, earthquakes are a significant factor in triggering landslide disasters. Research indicates that the largest earthquake recorded in the study area had a magnitude of 6.3. The impact of such seismic events on slope stability is substantial and cannot be overlooked. Therefore, this paper focuses on the 3–3′ profile of the Shatianpo landslide to further examine its stability under various earthquake conditions.
According to the “China Ground Motion Parameter Zoning Map”, the seismic defense intensity in the study area is classified as VI, with a peak ground acceleration (αmax) of 0.05 g. Taking all factors into consideration, this paper establishes three earthquake working conditions: (1) Seismic intensity of V with an αmax of 0.03 g; (2) Seismic intensity of VI with an αmax of 0.05 g; (3) Seismic intensity of VII with an αmax of 0.10 g. Since the seismic intensity in the study area does not exceed VII, only horizontal earthquake actions are considered. The corrected first 10 s of the El- Centro earthquake wave are used as the input seismic wave, with acceleration data recorded every 0.02 s, resulting in 500 sets of acceleration time history data. Earthquake waves corresponding to different intensities can be generated by adjusting the peak acceleration of the El-Centro earthquake waves.
The QUAKE/W module within GeoStudio software was utilized to perform slope stability analysis under these earthquake conditions. The analysis employed an equivalent linear dynamic approach, with the following boundary conditions configured: the left and right boundaries were fixed in the vertical direction, the lower boundary was fixed in both horizontal and vertical directions, and the upper boundary was free in both horizontal and vertical directions.
Using time as the horizontal coordinate and the stability coefficient as the vertical coordinate, a time-history diagram of the slope stability coefficient under different earthquake conditions is presented (Figure 12A). The diagram illustrates that the slope’s stability coefficient oscillates over time, as the horizontal earthquake induces repeated vibrations of the slope’s rock and soil in a back-and-forth motion. As the earthquake intensity increases, the range of fluctuation in the stability coefficient also broadens. The minimum stability coefficients for working conditions 1, 2, and 3 are 1.090, 1.059, and 1.005, respectively, occurring 5 s after the earthquake begins.
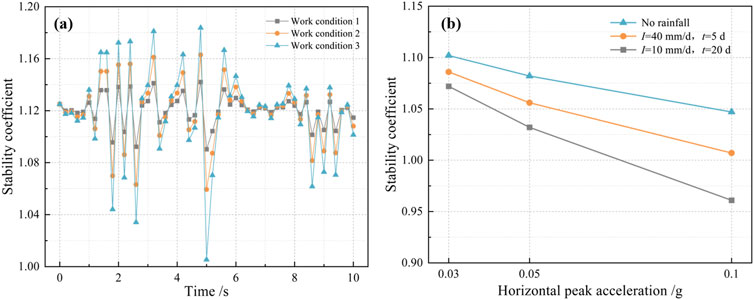
Figure 12. (A) Time-history curves of the slope stability coefficient under different earthquake working conditions. (B) The relationship between the slope stability coefficient and horizontal peak acceleration under coupled working conditions.
The instantaneous instability of a slope under seismic action does not necessarily result in complete failure; therefore, evaluating slope stability using the minimum stability coefficient is considered a conservative approach. This paper adopts the minimum average safety coefficient proposed by Liu et al. (2003) as the stability evaluation index, with the corresponding calculation formula as follows:
Where:
Based on Equation 1, the minimum average safety coefficient under earthquake working condition 1 is 1.102, which is 2.04% lower than the initial stability coefficient, indicating that the slope is generally stable. Under earthquake working condition 2, the minimum average safety coefficient is 1.082, reflecting a decrease of 3.82% from the initial stability coefficient, which also suggests that the slope remains generally stable. For earthquake working condition 3, the minimum average safety coefficient is 1.047, representing a 6.93% decrease from the initial stability coefficient, indicating that the slope lacks stability.
To analyze the impact of the combined effects of earthquakes and rainfall on slope stability, this paper selected three earthquake conditions and two rainfall conditions, resulting in a total of six coupled working conditions. Detailed information is provided in Table 2. Among them, the selection of earthquake conditions takes into account the seismic fortification intensity of the study area, the selection of rainfall conditions mainly considers the rainfall intensity that may occur during the rainy season, and ensures the same total rainfall.
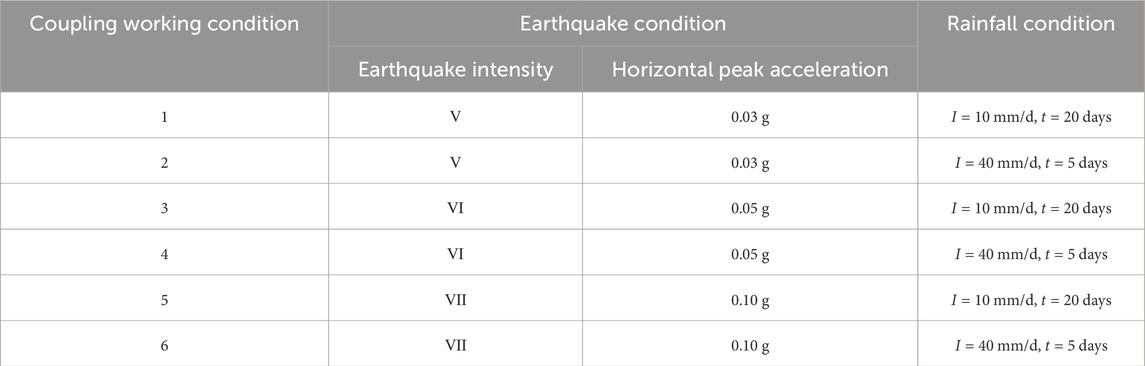
Table 2. Detailed information on coupling working conditions of earthquake and rainfall.
Figure 12B illustrates the relationship between the slope stability coefficient and the horizontal peak acceleration of the earthquake. As depicted, the slope’s stability coefficient decreases as the horizontal peak acceleration increases, with stability being significantly lower in the presence of rainfall compared to without rainfall. Notably, for the same total rainfall, the stability coefficient under short-duration heavy rainfall (I = 40 mm/d, t = 5 days) is higher than that under long-duration light rainfall (I = 10 mm/d, t = 20 days) when subjected to the same horizontal peak acceleration. This phenomenon occurs because short-duration heavy rainfall has a minimal impact on pore moisture content in the deep soil layers. In contrast, long-duration light rainfall primarily influences the pore water content in these deeper layers. As the volume of infiltration increases, the saturated zone expands, leading to a wider distribution of excess pore water pressure within the slope during an earthquake. Consequently, the stability coefficient experiences a more pronounced decrease under conditions of long-duration light rainfall.
The stability calculation results under various working conditions are summarized in Table 3. Under natural conditions, the slope has a stability coefficient of 1.125, indicating that it is basically stable. However, under low rainfall conditions (I = 2 mm/d, t = 30 days and I = 5 mm/d, t = 30 days), the slope is lack of stable or basically stable. In contrast, under high rainfall conditions (I = 200 mm/d, t = 15 days and I = 400 mm/d, t = 4 days), the slope becomes unstable.
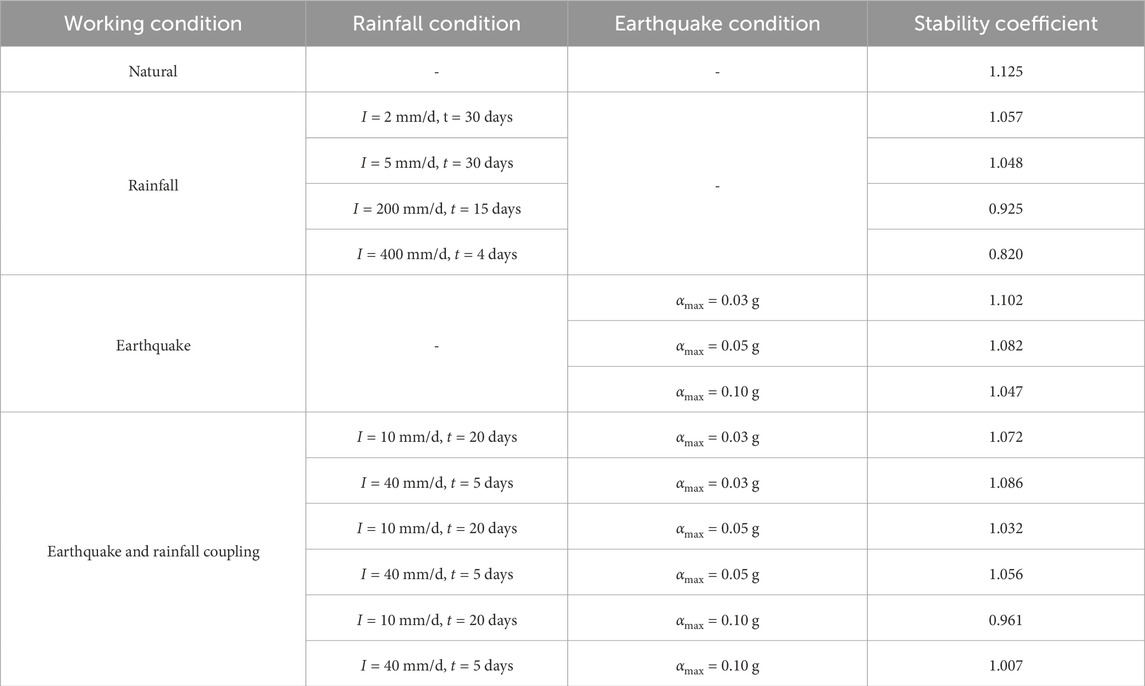
Table 3. Comparison of calculation results of slope stability coefficient under different working conditions.
When subjected to earthquake conditions, the stability coefficients corresponding to peak earthquake accelerations of 0.03 g, 0.05 g, and 0.10 g are 1.102, 1.082, and 1.047, respectively, indicating that the slope is lack of stable or basically stable.
Under the combined effects of earthquake and rainfall, with a maximum acceleration (αmax) of 0.03 g, the stability coefficients for the combinations of “I = 10 mm/d, t = 20 days” and “I = 40 mm/d, t = 5 days” are 1.072 and 1.086, respectively. This suggests that the slope remains basically stable, although these coefficients represent decreases of 4.71% and 3.47%, respectively, compared to the natural condition. At αmax = 0.05 g, the stability coefficients for the same combinations drop to 1.032 and 1.056, indicating that the slope is lack of stable or basically stable, with reductions of 8.27% and 6.13%, respectively, compared to the natural condition. Finally, at αmax = 0.10 g, the stability coefficients for the combinations fall to 0.961 and 1.007, demonstrating that the slope is unstable or lack of stable, with decreases of 14.58% and 10.49%, respectively, compared to the natural condition.
The results of this paper show that the stability coefficient of slope changes significantly under different environmental conditions, which is consistent with the conclusions of some existing studies. For example, studies have shown that slopes generally exhibit stability under undisturbed conditions (Cheng et al., 2023). Excessive rainfall can lead to a significant increase in pore water pressure, which can seriously affect slope stability (Ram et al., 2019). Huang et al. (2023) investigated the progressive effect of seismic forces on slope stability, and the results are consistent with the conclusion of this paper, that with the increase of seismic acceleration, slope stability decreases. The coupling effect of earthquake and rainfall further exacerbates slope instability, with the stability coefficient dropping below 1.0 at peak ground acceleration of 0.1 g, which is consistent with catastrophic slope failure caused by similar interactions reported by Ji et al. (2023) and Chen et al. (2020).
The findings indicate that the combined effects of earthquakes and rainfall significantly impact slope stability, surpassing the influence of either factor alone. Intense seismic activity following prolonged rainfall can potentially lead to slope instability. Therefore, in mountainous regions characterized by high earthquake intensity and abundant precipitation, it is crucial to consider the effects of both earthquakes and rainfall on slope stability.
This study focuses on the Shatianpo landslide in Yueyang County, Chongqing, southwest China. It begins by summarizing the landslide’s basic characteristics and analyzing its formation mechanism. Next, the relationship between changes in slope stability and factors such as rainfall intensity and duration is examined, along with the effectiveness of two support methods in enhancing slope stability. Finally, the study investigates the slope’s stability under both the isolated influence of an earthquake and the combined effects of an earthquake and rainfall. The following conclusions are drawn:
(1) The Shatianpo landslide is primarily the result of highway slope cutting, construction activities, and continuous rainfall. It is classified as a shallow soil landslide, with a failure mode characterized by sliding-cracking. Deformation is predominantly observed at the rear edge, middle, and right side of the landslide.
(2) Under low rainfall intensity, the slope is lack of stable or basically stable, while it becomes unstable under high rainfall intensity. The slope’s stability coefficient decreases as rainfall duration increases. For a given duration, higher rainfall intensity leads to increased pore water pressure and more significant changes in the total water head.
(3) The stability coefficient of the slope can be improved by 0.3–0.5 following the installation of anti-slide piles, allowing the landslide to transition from an unstable to a stable state during rainstorm conditions. Research on various anchor bolt support parameters indicates that optimal slope support is achieved with an anchor bolt length of 15 m, a spacing of 2.5 m, an anchorage angle of 25°, and anchorage positioned at the middle and front of the slope.
(4) Under earthquake conditions, the slope stability coefficients are recorded as 1.102, 1.082, and 1.047 for horizontal peak accelerations of 0.03 g, 0.05 g, and 0.10 g, respectively. In this scenario, the slope transitions from lack of stable to basically stable, with stability coefficients decreasing by 2.04%, 3.82%, and 6.93% compared to natural conditions. Additionally, under the combined effects of earthquake and rainfall, the slope’s stability coefficient is higher during short-duration heavy rainfall than during long-duration, low-intensity rainfall at a constant horizontal peak acceleration.
The original contributions presented in the study are included in the article/supplementary material, further inquiries can be directed to the corresponding author.
XZ: Data curation, Formal Analysis, Investigation, Writing–original draft. YZ: Methodology, Validation, Writing–original draft. KM: Conceptualization, Formal Analysis, Investigation, Writing–review and editing. YH: Formal Analysis, Methodology, Writing–review and editing. MZ: Formal Analysis, Validation, Writing–review and editing. HX: Investigation, Methodology, Writing–review and editing. YL: Investigation, Methodology, Writing–review and editing.
The author(s) declare that financial support was received for the research, authorship, and/or publication of this article. This work was supported by the National Natural Science Foundation of China (No. 42107211), the State Key Laboratory of Geohazard Prevention and Geoenvironment Protection Independent Research Project (No. SKLGP2022Z008), and the Opening Foundation of Key Laboratory of Landslide Risk Early-warning and Control, Ministry of Emergency Management (No. KLLREC2022K003).
We would like to thank the fundings and all data providers mentioned above. We sincerely thank the reviewers and editors of the journal for providing helpful comments to improve the manuscript.
The authors declare that the research was conducted in the absence of any commercial or financial relationships that could be construed as a potential conflict of interest.
The author(s) declare that no Generative AI was used in the creation of this manuscript.
All claims expressed in this article are solely those of the authors and do not necessarily represent those of their affiliated organizations, or those of the publisher, the editors and the reviewers. Any product that may be evaluated in this article, or claim that may be made by its manufacturer, is not guaranteed or endorsed by the publisher.
Amin, M. N., Ashfaq, M. U., Mujtaba, H., Ehsan, S., Khan, K., and Faraz, M. I. (2022). Computer-aided slope stability analysis of a landslide—a case study of jhika gali landslide in Pakistan. Sustainability 14 (20), 12954. doi:10.3390/su142012954
Brain, M. J., Rosser, N. J., and Tunstall, N. (2017). The control of earthquake sequences on hillslope stability. Geophys. Res. Lett. 44 (2), 865–872. doi:10.1002/2016gl071879
Cheaib, A., Lacroix, P., Zerathe, S., Jongmans, D., Ajorlou, N., Doin, M. P., et al. (2022). Landslides induced by the 2017 Mw 7. 3 Sarpol Zahab earthquake (Iran). Landslides 19 (3), 603–619. doi:10.1007/s10346-021-01832-0
Chen, Y. L., Liu, G. Y., Li, N., Du, X., Wang, S. R., and Azzam, R. (2020). Stability evaluation of slope subjected to seismic effect combined with consequent rainfall. Eng. Geol. 266, 105461. doi:10.1016/j.enggeo.2019.105461
Cheng, G., Wang, Z. X., Li, G. Q., Zhu, H. H., and Shi, B. (2023). Progress and prospect of integrated full-dimensional monitoring and early warning technology for landslides. China Saf. Sci. J. 33 (1), 105. doi:10.13203/j.whugis20190088
Cui, K., Ci, W., and Yang, S. C. (2024). Discrete-element method simulations of shallow landslides triggered by rainfall. Eur. J. Environ. Civ. Eng. 29, 489–506. doi:10.1080/19648189.2024.2405837
Gao, Y. H., Zhang, Y., Ma, C. C., Zheng, X. S., Li, T. B., Zeng, P., et al. (2023). Failure process and stability analysis of landslides in southwest China while considering rainfall and supporting conditions. Front. Environ. Sci. 10, 1084151. doi:10.3389/fenvs.2022.1084151
Han, C. X., Hou, T. S., and Chen, Y. (2023). Three-dimensional slope stability and anti-slide pile treatment of Zhangjiayao landslide under rainfall. Eng. Comput. 40 (9/10), 2667–2692. doi:10.1108/ec-03-2023-0128
Huang, F. M., Tang, C. H., Jiang, S. H., Liu, W. P., Chen, N., and Huang, J. S. (2022). Influence of heavy rainfall and different slope cutting conditions on stability changes in red clay slopes: a case study in south China. Environ. Earth Sci. 81 (15), 384. doi:10.1007/s12665-022-10466-x
Huang, S., Tao, R., and Wang, R. (2023). One simplified method for seismic stability analysis of an unsaturated slope considering seismic amplification effect. Geol. J. 58 (6), 2388–2402. doi:10.1002/gj.4769
Ji, J., Zhang, T., Cui, H. Z., Yin, X., and Zhang, W. J. (2023). Numerical investigation of post-earthquake rainfall-induced slope instability considering strain-softening effect of soils. Soil Dyn. Earthq. Eng. 171, 107938. doi:10.1016/j.soildyn.2023.107938
Kumar, S., Panda, S. D., Pradhan, S. P., and Chattopadhyay, P. (2024). Identification of potential failure zones in large progressive landslides: a method to optimize the cost of landslide early warning. Nat. Hazards 120, 12279–12311. doi:10.1007/s11069-024-06685-z
Li, L. Q., Li, Y. L., and Xu, Y. G. (2024). Instability evolution of expansive soil slope due to short duration-varying intensities of rainfall. Eng. Fail. Anal. 161, 108313. doi:10.1016/j.engfailanal.2024.108313
Liu, H. L., Fei, K., and Gao, Y. F. (2003). Time history analysis method of slope seismic stability. Rock Soil Mech. 24 (4), 553–556.
Liu, Z. Y., Su, L. J., Zhang, C., Iqbal, J., Hu, B. L., and Dong, Z. B. (2020). Investigation of the dynamic process of the Xinmo landslide using the discrete element method. Comput. Geotech. 123, 103561. doi:10.1016/j.compgeo.2020.103561
Oliveira, E. D., Acevedo, A. M. G., Moreira, V. S., Faro, V. P., and Kormann, A. C. M. (2022). The key parameters involved in a rainfall-triggered landslide. Water 14 (21), 3561. doi:10.3390/w14213561
Ortiz-Giraldo, L., Botero, B. A., and Vega, J. (2023). An integral assessment of landslide dams generated by the occurrence of rainfall-induced landslide and debris flow hazard chain. Front. Earth Sci. 11. doi:10.3389/feart.2023.1157881
Pei, Y. Q., Qiu, H. J., Yang, D. D., Liu, Z. J., Ma, S. Y., Li, J. Y., et al. (2023). Increasing landslide activity in the Taxkorgan river basin (eastern Pamirs plateau, China) driven by climate change. Catena 223, 106911. doi:10.1016/j.catena.2023.106911
Purwitaningsih, S., and Asano, J. (2024). Pre-disaster adaptation strategies for houses in landslide-prone residential area, case study of Giripurno Village, Borobudur Sub-District, central Java, Indonesia. IJDRR 101, 104211. doi:10.1016/j.ijdrr.2023.104211
Ram, A. R., Brook, M. S., and Cronin, S. J. (2019). Engineering characteristics of soils prone to rainfall-induced slope failure in Viti Levu, Fiji. Q. J. Eng. Geol. Hydrogeol. 52 (3), 336–345. doi:10.1144/qjegh2018-140
Ren, G. M., Xia, M., and Lv, S. M. (2023). Stability analysis of a landslide influenced by rainfall. Soil Mech. Found. Eng. 60 (1), 55–62. doi:10.1007/s11204-023-09863-6
Tao, H. C., Zhang, Y., Dong, J. X., Zhou, Z. Q., Gong, X. Y., and Zhang, S. W. (2022). Study on deformation mechanism and control measures of Tanziyan landslide. Geofluids 2022 (1), 1–16. doi:10.1155/2022/8237954
Wang, H. L., Jiang, Z. H., Xu, W. Y., Wang, R. B., and Xie, W. C. (2022). Physical model test on deformation and failure mechanism of deposit landslide under Gradient rainfall. Bull. Eng. Geol. Environ. 81 (1), 66. doi:10.1007/s10064-021-02566-y
Wang, L., Huang, J. J., Chen, Y., Wang, S. M., Fan, Z. H., Guo, F., et al. (2023). Evaluation of the treatment effect of rear slope cutting on hydrodynamic pressure landslides: a case study. J. Mt. Sci. 20 (7), 1968–1983. doi:10.1007/s11629-023-8077-7
Xue, Y., and Zhu, S. Y. (2023). Stability analysis before and after support of a multi-stage structural surfaces landslide mass. Q. J. Eng. Geol. Hydrogeol. 56 (1), qjegh2022. doi:10.1144/qjegh2022-040
Yang, H. Q., and Zhang, L. L. (2024). Bayesian back analysis of unsaturated hydraulic parameters for rainfall-induced slope failure: a review. Earth Sci. Rev. 251, 104714. doi:10.1016/j.earscirev.2024.104714
Yang, X. H., Diao, X. F., Zhou, T. Y., Hu, F., and Wang, S. H. (2023). Study on the stability of accumulated layer landslide under the coupling action of earthquake and rainfall. KSCE J. Civ. Eng. 27 (1), 98–108. doi:10.1007/s12205-022-0110-9
Yu, P., Liu, H. H., Yu, H. B., Xie, Y. J., Yu, Y., Zhu, C. H., et al. (2023). Study on fluid–solid coupling numerical simulation and early warning of weathered granite landslides induced by extreme rainfall. Sustainability 15 (15), 11738. doi:10.3390/su151511738
Zhang, J., Zhang, S. H., Ding, Y., and Zhu, D. Z. (2023). Evolution process and failure mechanism of a large expressway roadside landslide. Sci. Rep. 13 (1), 4843. doi:10.1038/s41598-023-32055-z
Zhang, Z. Y., Wang, S. T., Wang, L. S., Huang, R. Q., Xu, Q., and Tao, L. J. (2016). Principles of engineering geological analysis. 4th Edn. Beijing: Geological Publishing House.
Zhuang, Y. Z., Hu, X. Y., He, W. B., Shen, D. Y., and Zhu, Y. J. (2024). Stability analysis of a rocky slope with a weak interbedded layer under rainfall infiltration conditions. Water 16 (4), 604. doi:10.3390/w16040604
Keywords: landslide, rainfall intensity, support method, earthquake, coupling effect, Geostudio, stability analysis
Citation: Zheng X, Zhang Y, Meng K, Hu Y, Zou M, Xiang H and Luo Y (2025) Effects of rainfall intensity and mitigation measures on slope stability: a case study of Shatianpo landslide in Yunyang county, Chongqing City, Southwest China. Front. Earth Sci. 13:1549734. doi: 10.3389/feart.2025.1549734
Received: 21 December 2024; Accepted: 28 February 2025;
Published: 17 March 2025.
Edited by:
Yu Zhuang, WSL Institute for Snow and Avalanche Research SLF, SwitzerlandCopyright © 2025 Zheng, Zhang, Meng, Hu, Zou, Xiang and Luo. This is an open-access article distributed under the terms of the Creative Commons Attribution License (CC BY). The use, distribution or reproduction in other forums is permitted, provided the original author(s) and the copyright owner(s) are credited and that the original publication in this journal is cited, in accordance with accepted academic practice. No use, distribution or reproduction is permitted which does not comply with these terms.
*Correspondence: Yan Zhang, emhhbmd5YW4yMDIwQGNkdXQuZWR1LmNu
Disclaimer: All claims expressed in this article are solely those of the authors and do not necessarily represent those of their affiliated organizations, or those of the publisher, the editors and the reviewers. Any product that may be evaluated in this article or claim that may be made by its manufacturer is not guaranteed or endorsed by the publisher.
Research integrity at Frontiers
Learn more about the work of our research integrity team to safeguard the quality of each article we publish.