
94% of researchers rate our articles as excellent or good
Learn more about the work of our research integrity team to safeguard the quality of each article we publish.
Find out more
ORIGINAL RESEARCH article
Front. Earth Sci. , 07 March 2025
Sec. Hydrosphere
Volume 13 - 2025 | https://doi.org/10.3389/feart.2025.1543335
 Xiaojuan Li1,2,3,4
 Chaofan Zhou1,2,3,4*
 Huili Gong1,2,3,4Beibei Chen1,2,3,4Xiaodan Gao1,2,3,4Yabin Yang5Xiaoxiao Sun5
Precipitation and groundwater are critical components of the hydrological cycle. Understanding their variations and response relationship is vital for water resource management, ecological protection, and flood risk assessment. To explore the spatiotemporal patterns and response relationships of precipitation and groundwater levels in the North Shandong Plain, this study analyzed data from 2012 to 2023, including precipitation records and groundwater level data from various aquifers. Using trend analysis, Independent Component Analysis (ICA), and Cross Wavelet Transform (XWT), the research aimed to identify the spatiotemporal patterns of groundwater and its lagged responses to precipitation. The findings reveal that precipitation in the North Shandong Plain exhibited a non-significant increasing trend from 2012 to 2023. Trend analysis indicates that groundwater levels at 70% of monitoring points were declining, primarily in the central and western regions, forming significant groundwater depression cones. ICA identified three primary spatiotemporal evolution patterns of groundwater levels in the area. The first independent component (IC1) represents the main trend, characterized by a groundwater level decline from 2012 to 2018, followed by a recovery trend after 2018. Spatially, areas with high IC1 scores were concentrated in groundwater depression cone centers, particularly in Dezhou City. By integrating XWT analysis, the study explored the lagged response relationships between groundwater levels and precipitation for different aquifer layers. Results indicate distinct differences in lag times: shallow groundwater levels responded more quickly to precipitation, with an average lag of 3.6 months, whereas deep groundwater levels exhibited longer lag times, averaging 8 months, with somdee points reaching up to 12 months. This study combines time series trend analysis and blind source separation techniques to investigate the spatiotemporal evolution patterns and response relationships of groundwater and precipitation. The findings provide new perspectives for regional water cycle research.
Groundwater is an essential component of the water resource system and interacts closely with surface water. It is widely distributed in underground aquifers and sustains the perennial flow of rivers through baseflow, playing a critical role in regulating lake water levels. At the same time, the recharge process of groundwater is closely related to precipitation (Ghanbari and Bravo, 2011; Zhang et al., 2021). As one of the primary pathways for the transfer of water from the atmosphere to the surface, the spatial and temporal distribution characteristics of precipitation significantly influence groundwater recharge. The amount, intensity, and distribution of precipitation directly affect surface runoff and infiltration rates, thereby impacting the spatial and temporal variations in groundwater recharge (Huang et al., 2020; Zheng and Wang, 2021). Over the past three decades, groundwater levels in aquifers across approximately 30% of the global land area have declined at an accelerating rate, particularly in arid regions with extensive agricultural land, where depletion exceeds 0.5 m per year (Jasechko et al., 2024). Falling groundwater levels lead to issues such as seawater intrusion (Gao and Luo, 2016), land subsidence (Wang et al., 2024; Hu et al., 2024), and surface water depletion (de Graaf et al., 2019). In Shandong Province, water scarcity is a fundamental regional constraint, significantly impacting economic and social development. The accelerating groundwater depletion necessitates more effective regulatory and management strategies.
Many researchers have analyzed precipitation-groundwater time series and their responses (Sun et al., 2020; Li et al., 2024). For example, Niu (2004) examined the spatial and temporal evolution of precipitation in North China and tested the accuracy of different spatial interpolation methods in typical watersheds. Xiang et al. (2006) established a statistical model of precipitation and groundwater depth using transfer functions and regression analysis, revealing their relationship and temporal characteristics. Dang et al. (2011) explored the response relationships among surface water, groundwater, and precipitation, noting response time lags among water bodies. Tatas et al. (2022) predicted future groundwater levels by incorporating precipitation, pumping rates, and current groundwater levels. Wang et al. (2023) applied the Mann-Kendall (M-K) test and wavelet transform to examine groundwater response to precipitation in the northern Qinling Mountains. Xu et al. (2021) used GRACE satellite data and GLDAS products combined with EEMD to analyze seasonal and long-term groundwater storage trends in the North China Plain from June 2003 to June 2017. Zhong et al. (2024) employed Pettitt’s test and moving T-test with correlation coefficient methods to classify trend changes in groundwater level subsequences, revealing the precipitation-groundwater response characteristics within each sequence. Studies in Shandong Province show a non-significant increasing trend in precipitation with periodic features persistent future variability, and differing aquifer responses to precipitation (Liu et al., 2021; Ren et al., 2024; Yang et al., 2024). The spatiotemporal response relationship between groundwater levels and precipitation is complex. Although existing statistical methods can, to some extent, identify the spatiotemporal response relationship between the two, there are still certain limitations in understanding the patterns of spatiotemporal variations in groundwater levels across different aquifers and their response relationship to precipitation.
To further identify the spatiotemporal patterns and characteristics of groundwater level changes, we introduce ICA to decompose complex groundwater fluctuation patterns. ICA has demonstrated unique advantages in separating overlapping surface deformation patterns, enabling the identification of distinct modes and their spatiotemporal features (Peng et al., 2022; Song et al., 2023; Lai et al., 2024). Li (2020) proposed a combined denoising method using Empirical Mode Decomposition (EMD) and ICA, validating its effectiveness with simulated and observed data. Yin et al. (2023) developed a time-frequency correlation analysis system combining ICA and Wavelet Coherence (WTC) to analyze precipitation-related independent components, highlighting the potential of ICA-WTC in studying climate-precipitation-groundwater interaction mechanisms.
Building upon these methods, we propose a combined approach using ensemble time-series testing and signal separation techniques, integrating remote sensing and ground observations. Compared to traditional methods, this approach systematically identifies long-term trends, variation patterns, and response relationships, enabling more precise quantification of water cycle dynamics under varying conditions and geographic environments, providing a scientific basis for groundwater management. The combination of these methods enhances analytical accuracy and offers new perspectives for studying complex hydrological processes.
This study focuses on the North Shandong Plain, particularly Dezhou, Binzhou, and Dongying. Using precipitation data (2012–2023) and groundwater level data (2012–2020), we employ M-K trend testing, ICA, and cross-wavelet transform to analyze trends, spatial-temporal distributions, and response characteristics of groundwater to precipitation. ICA is introduced as a blind source signal separation method to extract different modes in groundwater fluctuations, while WTC further investigates groundwater and precipitation response relationships.
The North Shandong Plain is situated in the northwest of Shandong Province, encompassing areas of Liaocheng City, Dezhou City, Binzhou City, Dongying City, and parts of Jinan City (Figure 1). The geographical coordinates are 35°47′to 38°17′N and 115°17′to 119°18′E, covering an area of 42,000 km2. It shares borders with Henan and Hebei provinces, and the Yellow River flows through the region, eventually emptying into the Bohai Sea. The topography slopes from southwest to northeast, with elevations ranging from 40 m to 0 m. The predominant landforms in the area include plains, hills, and gullies, with relatively gentle terrain.
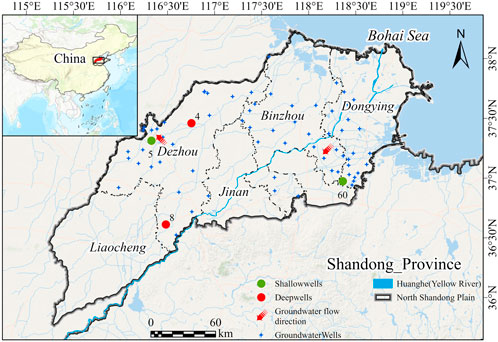
Figure 1. Location of monitoring wells and study area. The positions of the typical points and the groundwater flow direction are indicated.
The study area lies in a transitional zone between arid and humid climates, with precipitation mainly influenced by warm and humid air currents from the southeast coastal areas. The climate is classified as a warm temperate monsoon climate with characteristics of a semi-arid climate. The region has abundant geothermal resources but faces a scarcity of water resources. Precipitation exhibits significant inter-annual and intra-annual variations, alternating between wet and dry periods. Most of the region experiences low annual precipitation, typically less than 650 mm. The rainy season (June to September) contributes to 70%–80% of the total annual precipitation, and the average annual temperature ranges from 11.9°C to 12.9°C.
The North Shandong Plain primarily consists of thick accumulations of Quaternary loose sediments. Throughout history, the Yellow River has shifted its course multiple times, leading to the formation of ancient riverbeds with concentrated deposits of nearly parallel sand layers, providing favorable conditions for shallow groundwater storage. The geological strata in the North Shandong Plain can be categorized into three regions: the Piedmont alluvial and floodplain area, the Yellow River floodplain area, and the delta alluvial and marine plain area (Ji et al., 2019). Geotectonically, the North Shandong Plain belongs to the North China Plate, North China Depression, and, since the Cenozoic, has undergone the influence of the Himalayan and Yanshan movements, resulting in the development of fault structures and the formation of alternating third-order structural units.
Based on burial conditions, groundwater is generally classified into two main types: unconfined water and confined water. In this study, shallow groundwater primarily refers to unconfined water, with a burial depth of less than 60 m. It is closely connected to the atmosphere and surface water systems. Medium to deep groundwater primarily refers to confined water, with a burial depth exceeding 60 m (Di et al., 2020; Wang and Wan, 2020). Due to the presence of an overlying aquitard, its connection to the atmosphere and surface water is relatively weak, making it less influenced by climatic, hydrological, and other environmental factors. Deep groundwater has a minimal hydraulic connection with shallow groundwater because of the aquitard and saline water layers separating them (Liu, 2001). The lithological distribution and burial conditions of aquifers are shown in Table 1, and hydrogeological cross-sections are presented in Figures 2, 3. The North Shandong Plain region primarily relies on groundwater resources for agricultural irrigation, municipal water supply, and industrial use. In recent years, rapid economic development and population growth have led to increased demand for water resources. Consequently, issues related to groundwater over-extraction, including groundwater level decline and water quality deterioration, have become increasingly prominent.
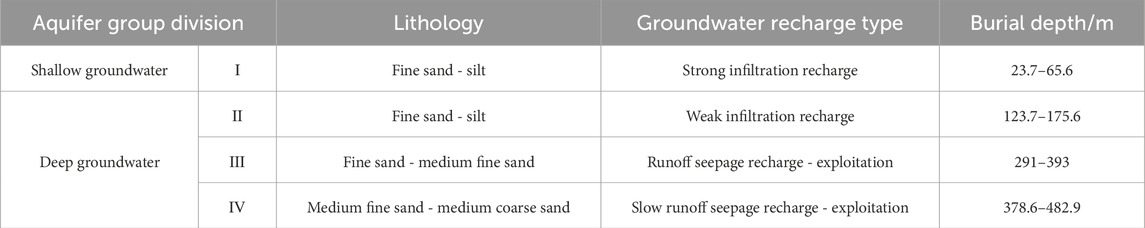
Table 1. Lithological distribution.
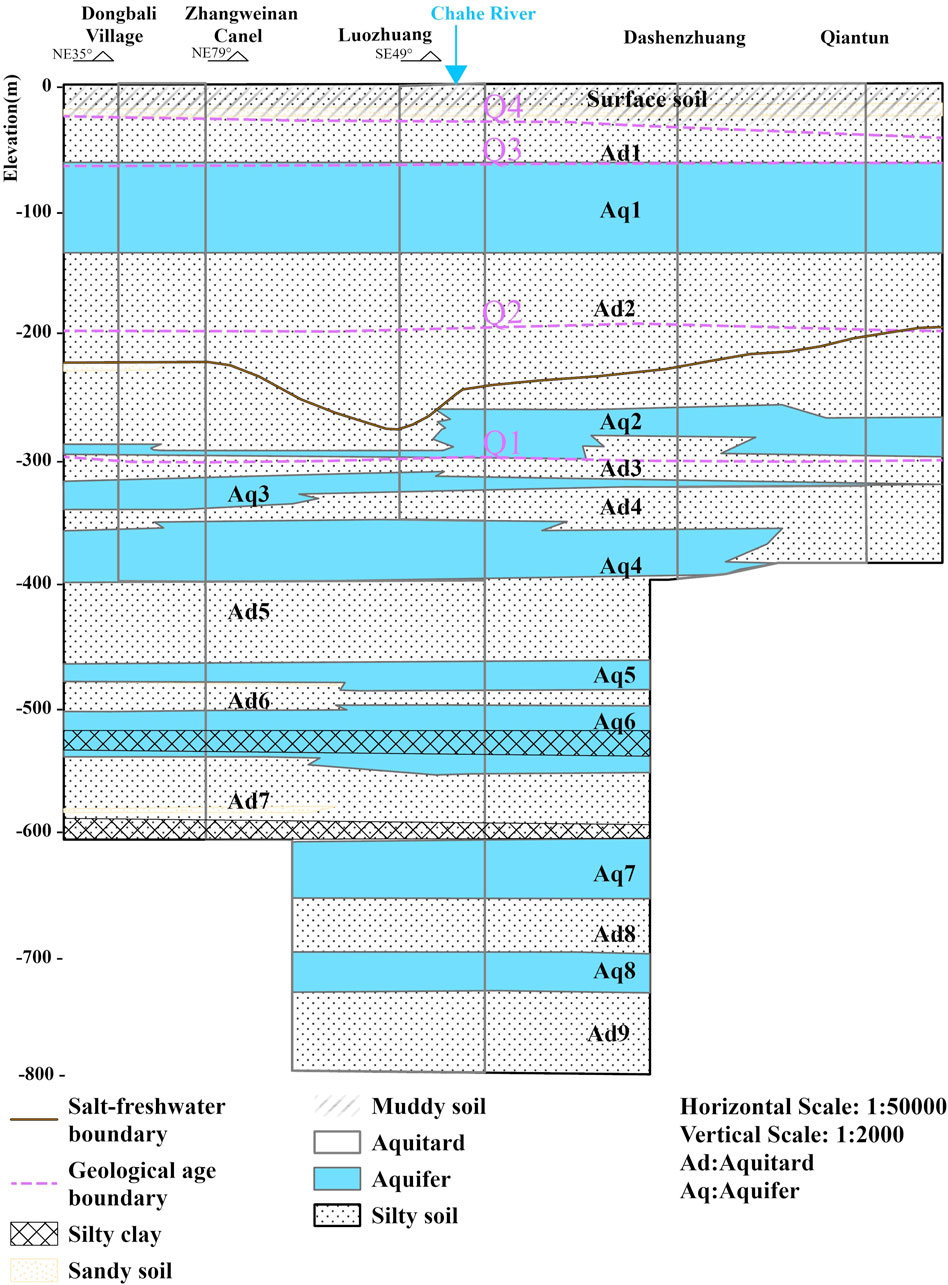
Figure 2. Hydrogeological profile of Dezhou (Modified from Hu et al., 2024).
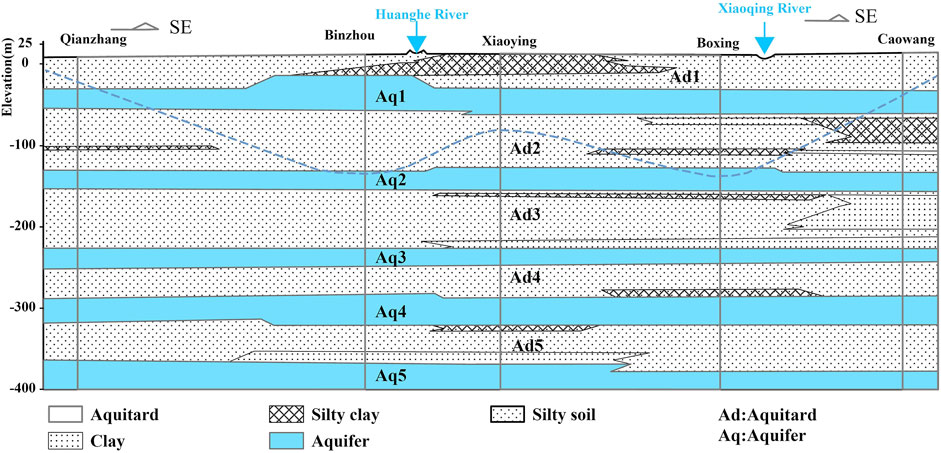
Figure 3. Hydrogeological profile of Binzhou-Boxing (Modified from Di et al., 2020).
The data used in this study mainly include China’s gridded precipitation data for the years 2009–2023 from the National Earth System Science Data Center (Peng et al., 2019). The dataset is projected in the WGS1984 geographic coordinate system with a spatial resolution of 1km, a temporal resolution of monthly, and a time series from January 1901 to December 2023, with precipitation measured in units of 0.1 mm. This dataset is generated by downsizing China’s monthly precipitation data using the Delta spatial downscaling scheme based on the global 0.5° climate dataset published by CRU and the high-resolution climate dataset published by WorldClim. It has been verified using 496 independent meteorological observation points, ensuring its reliability. The groundwater level data for the North Shandong Plain from 2012 to 2020 were recorded monthly, primarily sourced from the China Groundwater Yearbook and other relevant literature. In this study, monitoring wells with complete records from 2012 to 2020 were selected, ensuring no missing values. Based on aquifer group classifications, monitoring wells with depths of 0–60 m are categorized as shallow wells, while those deeper than 60 m are classified as medium-to-deep wells. According to statistics, the study area contains 78 monitoring wells, including 61 shallow wells and 17 medium to deep wells (Table 2). The groundwater extraction and supply data referenced in the text are sourced from the Shandong Provincial Water Resources Bulletin, as shown in Tables 3, 4. The technical roadmap for the study is illustrated in Figure 4.
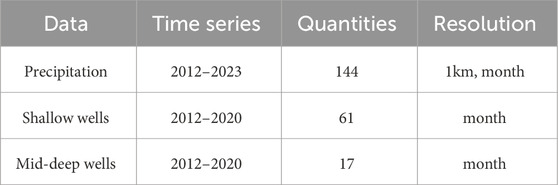
Table 2. Data sources.
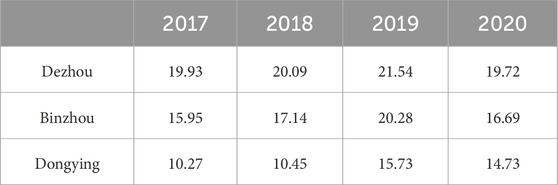
Table 3. The water recharge volume from 2017 to 2020 (in 100 million m3), sourced from the Shandong Province Water Resources Bulletin.
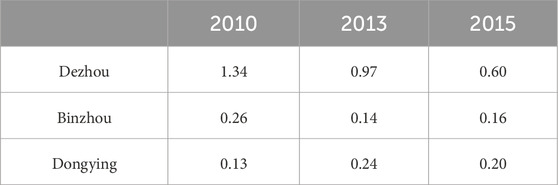
Table 4. The groundwater extraction volume for selected years (in 100 million m3), sourced from the Shandong Province Water Resources Bulletin.
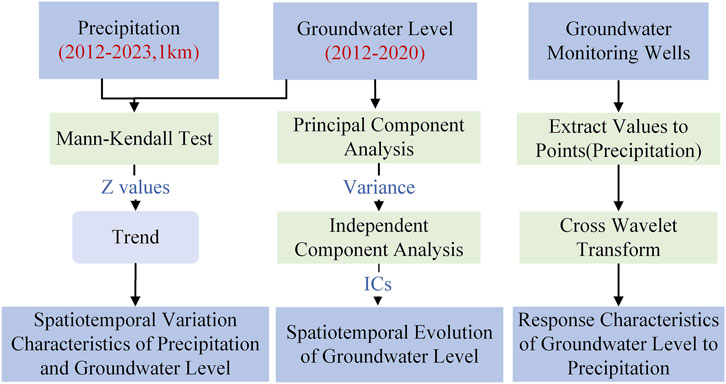
Figure 4. Research framework.
The M-K test, proposed by Mann and Kendall, is a non-parametric method used for trend analysis in time series data. This method does not assume a specific distribution for the samples and it is robust against a few outliers, making it widely applicable to the trend analysis of non-normally distributed data. For a time series X with n samples, the rank sequence is constructed as Equation 1:
The rank sequence
The standardized test statistic Z is calculated using the following Equation 3:
In a two-sided trend test, for a given confidence level (significance level) α, if
In this study, precipitation data and groundwater level data from different monitoring wells were used as time series inputs X. The final output consisted of the test statistic Z-values, which were used to evaluate the trend of each time series based on the magnitude of the Z-values. A confidence level of 1-α = 0.99 is chosen. Upon consulting the standard normal distribution table, if the absolute value of Z is greater than or equal to 2.58, it passes the significance test at a 99% confidence level. If Z is positive, it is considered that the time series exhibits a significant upward trend. Conversely, if Z is negative, it is considered that the time series shows a significant downward trend. If the absolute value of Z is less than 2.58, the changing trend in the time series is deemed not significant.
ICA is a blind source separation method that can extract independent components from an input matrix of mixed time series signals (Song et al., 2023). To find a transformation matrix that maximizes the independence of the components, a target function is defined to measure their independence. Common target functions include maximizing higher-order statistics, such as Gaussianity, non-Gaussianity, and entropy. By optimizing this target function, a suitable unmixing matrix W can be found. ICA is widely used in fields such as signal processing, electroencephalogram (EEG) analysis, and stock market forecasting. Common algorithms for ICA implementation include the Infomax algorithm and the FastICA algorithm. This study employs the FastICA algorithm, which estimates independent components based on the fixed-point iteration theory. The algorithm separates independent components by finding the direction with maximum non-Gaussianity, often measured using negative entropy. FastICA is characterized by high computational efficiency, fast convergence speed, and insensitivity to initial values. It can quickly and accurately extract independent components in most cases, making it one of the most widely used ICA algorithms. It is flexible and applicable to data of different dimensions and types. In this study, Principal Component Analysis (PCA) is used as a data preprocessing method to calculate the variance contribution ratio of components in the mixed signal matrix. The input for PCA is the groundwater level observation matrix X. PCA identifies the number of components that capture the majority of source signal characteristics, which then determines the number of independent components retained for subsequent ICA.
Assume the original observation matrix X is an n*t matrix, where n represents the data points and t represents the observation time points. The source signal matrix is denoted as S, with its components assumed to be mutually independent. Each column of S represents the spatial contribution of an independent component. The mixing matrix A describes how the source signals are linearly combined to generate the observed signals. The model is expressed as Equation 4:
Before extracting independent components, the mixed signal undergoes preprocessing, including centering and whitening. Centering involves subtracting the mean from each data point, resulting in a centered matrix
Covariance Matrix Calculation: Compute the covariance matrix for the centered data (Equation 5):
Eigenvalue Decomposition: Perform eigenvalue decomposition on the covariance matrix to obtain eigenvalues and eigenvectors (Equation 6):
E is the matrix of eigenvectors, and
Whitening Transformation: The whitening matrix Z is computed as (Equation 7):
D is a diagonal matrix, and its diagonal elements are the inverse square roots of the eigenvalues in
ICA Iterative Optimization: Initialize the weight matrix W randomly. In each iteration, update each weight vector to maximize non-Gaussianity. After each iteration, orthogonalize the weight matrix W to maintain the independence of the components.
Convergence Criterion: Check if the change in the weight matrix W is below a predefined threshold to determine whether the algorithm has converged.
Independent Component Calculation: Once the algorithm converges, use the final weight matrix W to compute the independent components (Equation 8):
ICA decomposition is applied to the original mixed signals, separating them into several independent source signals while maximizing the statistical independence of each component. Independent component analysis can effectively extract the features of the original input signals (Peng, 2023). In this study, X represents the input matrix of groundwater level time series observations, the mixing matrix A represents the temporal variations of the components, and each column in S corresponds to an independent component, representing a distinct pattern of groundwater level variation. The FastICA process is shown in Figure 5.
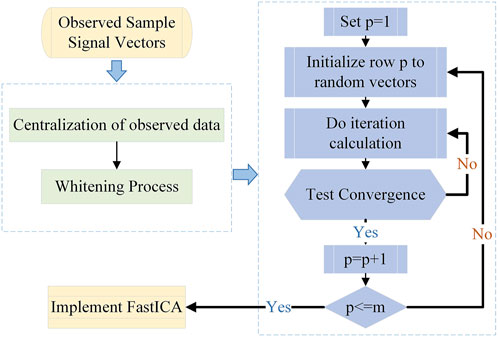
Figure 5. FastICA flow chart.
Cross Wavelet Transform is a signal processing method based on wavelet transform. It involves crossing two wavelet functions to obtain a set of new wavelet functions. These new wavelet functions possess better time-frequency localization properties, enabling a more accurate description of the signal’s time-frequency characteristics. Cross Wavelet Transform combines wavelet transform with cross-spectral analysis, revealing the temporal and frequency relationships between two time series. The principle involves decomposing the signal into wavelet coefficients at multiple scales and frequencies, then cross-analyzing these coefficients to obtain new wavelet coefficients. Finally, the inverse transform is applied to obtain the signal after Cross Wavelet Transform (Grinsted et al., 2004).
The cross-wavelet transform of two time series
The cross-wavelet coherence spectrum is defined as
In the formula:
For each time point m, the phase angle
Arg denotes the operation of extracting the phase angle of a complex number.
The calculation methods used in this study primarily reference Grinsted et al. (2004) and Qi et al. (2015). In cross-wavelet analysis, the common oscillation period represents the shared variation cycle between two time series. If two time series exhibit a significant correlation over a given time interval, a specific phase relationship in their variations can be observed. This phase relationship is used to calculate the lag characteristics of one time series relative to the other. In this study, precipitation time series values corresponding to groundwater monitoring locations were extracted from grid data. The input time series x and y represent precipitation and groundwater level time series at the corresponding monitoring points, respectively. The phase angle obtained from the cross-wavelet transform indicates the lagging phase of groundwater level changes relative to precipitation changes. Multiplying this phase lag by their common oscillation period yields the lag time of groundwater level responses to precipitation changes (Yu and Lin, 2015).
The monthly precipitation raster data for the North Shandong Plain were extracted by clipping from 1 km precipitation raster source data. The annual average precipitation spatial distribution was obtained by calculating the mean values of multiple grid cells. The average value of the entire grid was used to represent monthly precipitation, allowing for the observation of temporal variations. From 2012 to 2023, the annual precipitation in the North Shandong Plain showed relatively small interannual variation, with some years identified as wet years (precipitation significantly above the multi-year average) and others as dry years (precipitation significantly below the multi-year average). Intra-annual precipitation was unevenly distributed, with a pattern of rainy summers and dry winters. Notably, precipitation was abundant in 2013, 2021, and 2022, reaching approximately 300 mm in July, while 2014 and 2015 experienced markedly lower precipitation, with the lowest annual precipitation recorded at only 495 mm (Figure 6).
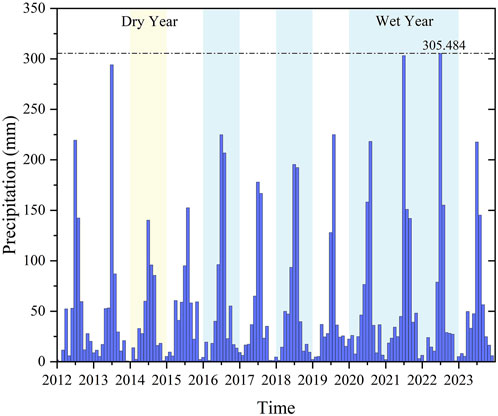
Figure 6. The temporal variation of precipitation from 2012 to 2023.
The spatial distribution of average monthly precipitation across the North Shandong Plain exhibited a general increase from the northwest inland to the southeast coastal regions. As shown in Figure 6, the 650 mm isohyet serves as a boundary, with most of the northwest receiving significantly less precipitation than the southeast. In the northwestern part of Dezhou City, the long-term average annual precipitation was less than 550 mm. In the southeastern region, the annual average precipitation generally exceeds 650 mm. In some areas on the northern foothills of Mount Tai, it even surpasses 800 mm. These regions, located on the windward slope of Mount Tai’s northern side, receive abundant precipitation due to the uplift of warm and moist air currents (Figure 7).
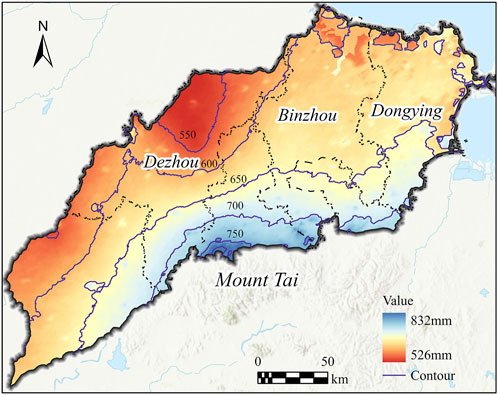
Figure 7. The spatial distribution of annual average precipitation in the North Shandong Plain from 2012 to 2023, with purple lines representing precipitation isolines at 50 mm intervals.
The monthly grid mean is calculated as the input for precipitation trend analysis. Based on the results of the M-K test for precipitation, the Z-score of the time series falls within the range of ±2.58, indicating that precipitation changes over time remain stable at the 99% confidence level. In Figure 8, the red line represents the UF statistic, the blue line represents the UB statistic, and the yellow dashed line indicates the 0.01 significance level. If the UF and UB statistics significantly exceed the 0.01 significance level, the corresponding time series is considered to have passed the 99% confidence level test, exhibiting a significant trend. Conversely, if the fluctuation range remains within the significance threshold, the time series does not exhibit a significant trend. When UF >0 and lies above the positive significance level, it indicates a significant increasing trend. When UF <0 and lies below the negative significance level, it indicates a significant decreasing trend. If the UF and UB curves intersect, the intersection point represents the abrupt change point in the time series. As shown in Figure 8, the UF statistic for precipitation changes in the study area remains greater than 0 but below the positive significance level. This similarly indicates a slight upward trend in precipitation from 2012 to 2023. However, this increasing trend is not significant and does not pass the significance test.
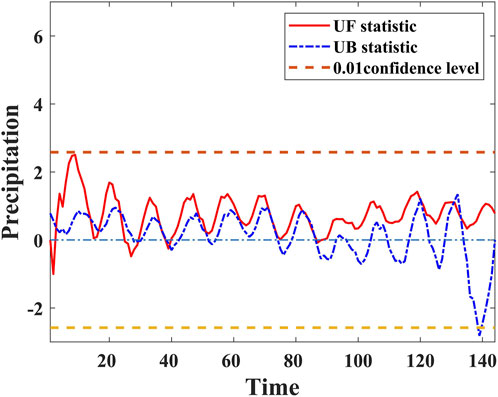
Figure 8. Precipitation M-K test result, UF statistics provided in Equation 2.
Shallow groundwater is directly recharged by vertical infiltration from precipitation, irrigation return flow, and lateral seepage from rivers and canals. It is the primary source of water for agriculture and rural domestic use in the region. In most areas, the shallow groundwater levels remained stable from 2012 to 2020, with relatively small fluctuations. A minor peak typically occurred between August and September each year, followed by a decline, with an average water level variation of 4.8 m. In Decheng District, point 5 exhibited stable water levels in earlier years, but between 2015 and 2018, frequent fluctuations were observed due to increased precipitation, leading to several small peaks (Figure 9). In the groundwater depression cone area of southern Guangrao County, monitoring point 60 in Sujia Village, Lique Town, experienced frequent oscillations. The well depth, ranging from 40 to 80 m, penetrated Quaternary strata (Ji et al., 2019). This region is characterized by a water-rich loose rock aquifer with large pore spaces, leading to significant water level declines and subsequent rebounds. Before 2006, the water level dropped significantly; after 2006, with increased precipitation and reduced groundwater extraction, recharge, and discharge reached a balance (Liu et al., 2021).
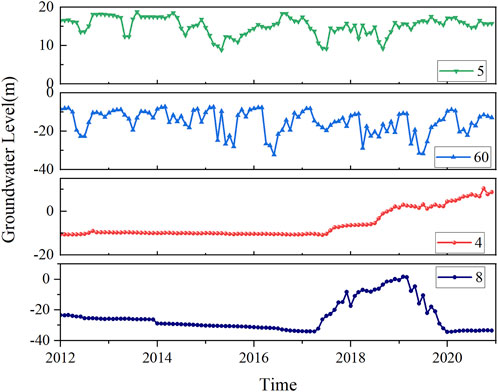
Figure 9. The groundwater level variations at typical monitoring points: Points 5 and 60 are shallow monitoring wells located in Decheng District of Dezhou City and Guangrao County of Dongying City, respectively; Points 4 and 8 are deep monitoring wells located in Lingcheng District and Qihe County of Dezhou City, respectively. The locations of these points are marked in Figure 1.
Deep groundwater extraction primarily occurs in urban centers and densely populated areas, with industrial use being dominant. Over years of intensive pumping, regional deep groundwater depression cones formed in the Decheng District of Dezhou, Bincheng District of Binzhou, Boxing County, and Guangrao County of Dongying. The maximum water table depth reached 137.83 m in Dezhou’s depression cone center and 111.19 m in Binzhou’s center. Most deep groundwater levels exhibited a continuous decline, with an average variation of 18.3 m. The maximum drop of 36 m was observed at monitoring point 8 in Qihe County, Dezhou, where the well depth reached 321 m. From 2012 to early 2017, the water level declined steadily at a slow rate, then rapidly rose to a peak in February 2019 before resuming a linear descent. By early 2020, the water level stabilized. Various regulatory measures led to some recovery in deep groundwater levels starting in 2015. Monitoring point 4 in Lingcheng District showed stable water levels initially, followed by continuous rises starting in 2017 due to increased recharge (Table 3). The spatial distribution of the monitoring points is shown in Figure 1.
M-K test was conducted on 61 shallow groundwater monitoring data. The results show that 19 monitoring wells had positive Z-scores, indicating an upward trend in water levels, with 12 of these points having Z-scores greater than 2.58, passing the significance test, suggesting significant groundwater level increases. The remaining seven points had Z-scores between 0 and 2.58, indicating stable or not significantly rising water levels. Areas with significant groundwater level increases were mainly concentrated in the southern regions of Dongying and Binzhou cities, while in Dezhou, only monitoring well 22 showed an increasing trend. This well is located near the Tu Hai River, far from the groundwater depression funnel center, allowing shallow groundwater to be replenished more promptly, which is why its water level change differs significantly from other monitoring wells in Dezhou. At the 99% confidence level, 42 other groundwater wells showed significant decreasing trends in water levels, with most concentrated near the groundwater depression funnel in the northwest of Dezhou, and the remaining distributed in the central and eastern parts of the North Shandong Plain. From southwest to northeast, the North Shandong Plain transitions from the foothill alluvial and floodplain to the delta alluvial and marine sedimentary plain. As seen in Figure 10, the groundwater levels in the central and western foothill plain area showed an overall decreasing trend from 2012 to 2020. Since the 1960s, with the increasing groundwater extraction, regional deep groundwater over-exploitation funnels formed in Dezhou and Binzhou, altering the natural groundwater flow field and leading to a convergence toward the funnel center. In the eastern part of the Yellow River alluvial plain and delta alluvial plain, especially in areas like Guangrao County and Boxing County, far from the groundwater depression funnel, shallow water levels remain stable, with some showing clear increasing trends.
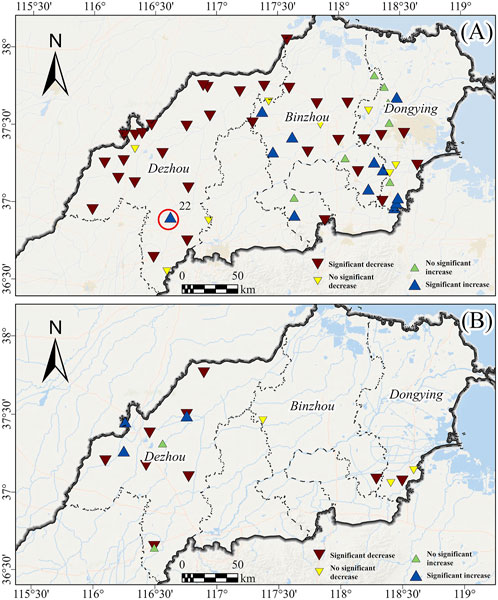
Figure 10. Spatial distribution of groundwater level change trends. (A) Represents the spatial distribution of shallow groundwater levels, and (B) represents the spatial distribution of deep groundwater level change trends.
A trend test was conducted on 17 sets of deep groundwater monitoring data, showing that five monitoring wells had Z-scores greater than 0, all located in Dezhou, with 3 of these showing a significant upward trend. There are fewer deep groundwater monitoring points in Binzhou and Dongying, and the trend test results indicate that from 2012 to 2020, deep groundwater levels generally showed a downward trend. In total, about 70% of the monitoring wells showed a decreasing trend. According to Table 4, the groundwater extraction volume has decreased overall, but certain years have shown rebounds. Therefore, it remains necessary to continue implementing strict groundwater extraction control and restriction measures while increasing recharge efforts.
The entire groundwater level time series is used as the original observation matrix X. PCA is applied to calculate the variance contribution rates, revealing that the cumulative variance contribution of the first three components accounts for 82.08% (Figure 11). ICA is then performed to decompose the data into temporal variation patterns and the spatial distribution represented by the mixing matrix. The first three independent components are retained to analyze the spatiotemporal evolution characteristics.
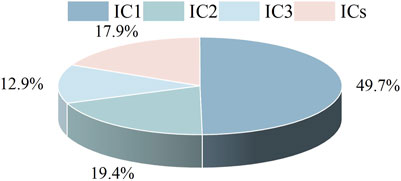
Figure 11. Variance contribution of principal components of groundwater level.
The results of the ICA decomposition (Figure 12) reveal three main patterns of groundwater level evolution. Based on the temporal variation and spatial distribution, IC1 shows a continuous declining trend before 2018, followed by a significant rebound after 2018. IC2 exhibits a periodic fluctuation pattern with two consecutive cycles occurring between 2013–2015 and 2016–2018. IC3 highlights the variation of specific points, where the groundwater level remained stable from 2012 to 2018, rapidly increased in 2018, and peaked in 2020, consistent with the characteristics of deep monitoring point 8. In terms of spatial distribution, IC1 has the highest scores in Dezhou City, Huimin County, and Guangrao County, with most of these points located near the centers of groundwater depression cones. IC2 has high scores in the northwest (Decheng District) and southeast (Guangrao County), while IC3 is concentrated in the northwest region of the North Shandong Plain. Among the three patterns, IC1 accounts for over 60% of the signal contribution, indicating that the dominant trend of groundwater levels in the North Shandong Plain from 2012 to 2018 was a decline, consistent with the results of the M-K trend test. The significant rebound observed after 2018 can be attributed to the increased water supply in the region from 2017 to 2019 (Table 3) and reduced dependence on groundwater for water supply, which promoted the recovery of groundwater levels.

Figure 12. Temporal variations and spatial distribution of IC1, IC2, and IC3: (A) depicts the temporal variations of the three independent components, while (B–D) respectively illustrate the spatial distribution of the three independent components.
Using cross-wavelet transform, the cross-wavelet coherence maps of precipitation and groundwater level changes are obtained. In the maps, yellow and blue represent the peaks and troughs of energy density, respectively, and the color depth indicates the relative changes in energy density. The black thick solid line-closed region passed the 95% confidence interval red noise test, indicating a significant resonance period. The black thin solid line below the cone-shaped region is the Cone of Influence (COI) area, representing the region where edge effects are more pronounced. The direction of the arrows in the plot reflects the phase relationship between precipitation and monitored water levels. Arrows pointing from left to right indicate in-phase correlation, while arrows pointing from right to left indicate anti-phase correlation. A downward vertical direction signifies a 1/4 period advance in precipitation wavelet transform, while an upward vertical direction indicates a 3/4 period advance or a 1/4 period lag in precipitation (Kong, 2022).
For shallow groundwater level changes (Figure 13; Table 5), the resonance period between precipitation and groundwater at the monitoring points is approximately 12 months. The groundwater level response lag to precipitation is shortest in Binzhou, averaging about 2 months. In Dezhou, the average lag is approximately 4 months, while in Dongying, the response lag is the longest, reaching up to 6 months. The average lag time for shallow groundwater is approximately 3.6 months. However, significant resonance between precipitation and groundwater levels does not persist throughout the entire time series. In Dezhou, significant resonance occurs from 2015 to 2018; in Binzhou, it spans from 2017 to 2019; while in Dongying, the monitoring point at Guangrao County (point 60) shows continuous significant resonance from 2012 to 2020. Because shallow wells are closer to surface water bodies, they can quickly receive precipitation recharge when precipitation reaches the surface. Consequently, shallow groundwater levels are more directly influenced by precipitation, resulting in shorter lag times.
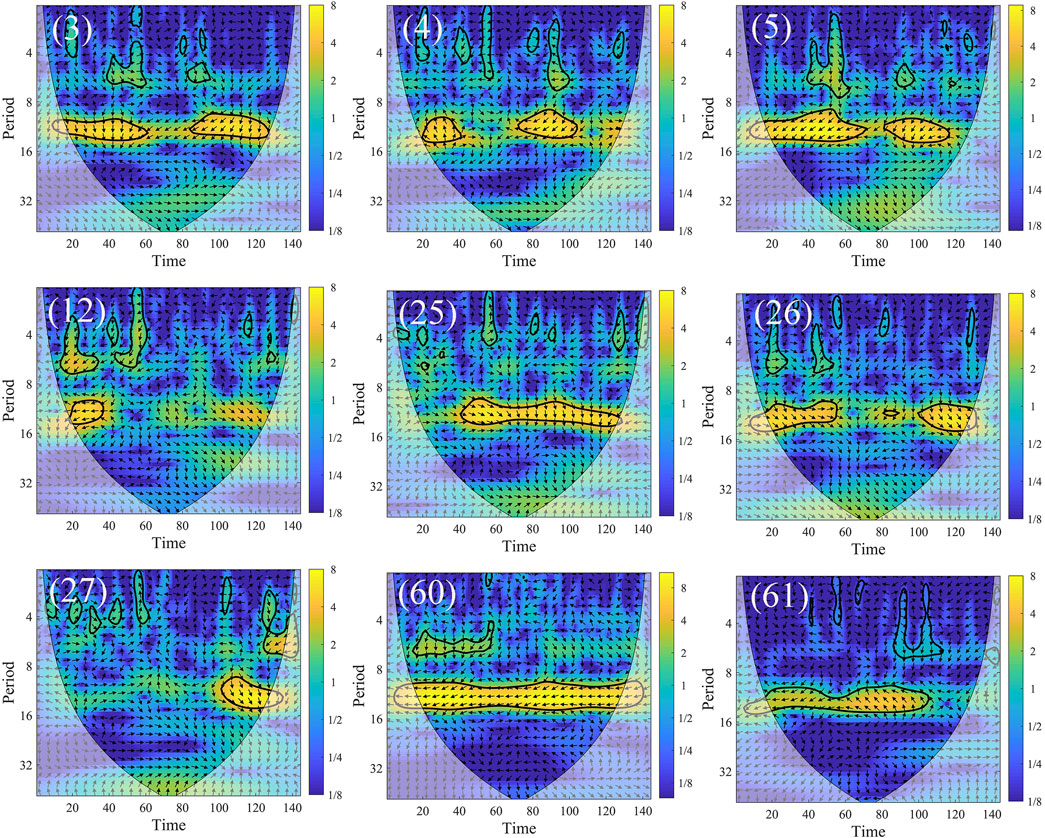
Figure 13. Cross coherence plot between shallow monitoring well groundwater level and precipitation.
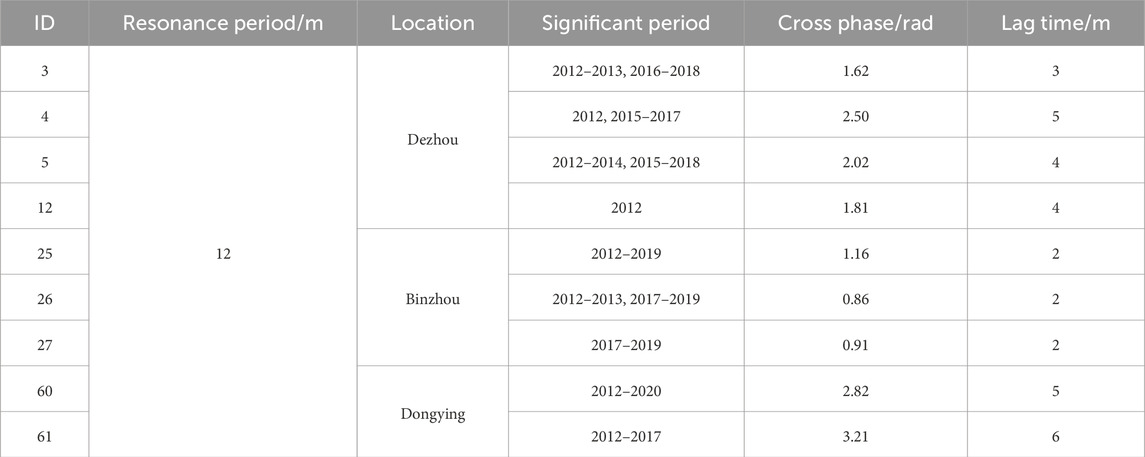
Table 5. Cross-phase and lag time of shallow groundwater to precipitation.
For deep groundwater level changes (Figure 14; Table 6), the groundwater lags behind precipitation for a longer period, with an average lag time of 8 months. Point 9 in Dezhou shows a relatively rapid response, with a lag time of 3 months. The lag times at other points range from 5 to 6 months, with the maximum lag reaching 11–12 months. Deep groundwater has a longer renewal cycle due to the presence of an aquitard separating it from shallow groundwater and the surface, resulting in a prolonged or even negligible response to precipitation. Monitoring points with a lag time of 12 months are mainly located in the groundwater depression cone area in western Dezhou. In such cases, even with precipitation recharge, the water level deficit caused by excessive pumping must be replenished before any groundwater level recovery occurs, further extending the lag time of groundwater response to precipitation changes (Guan et al., 2023).
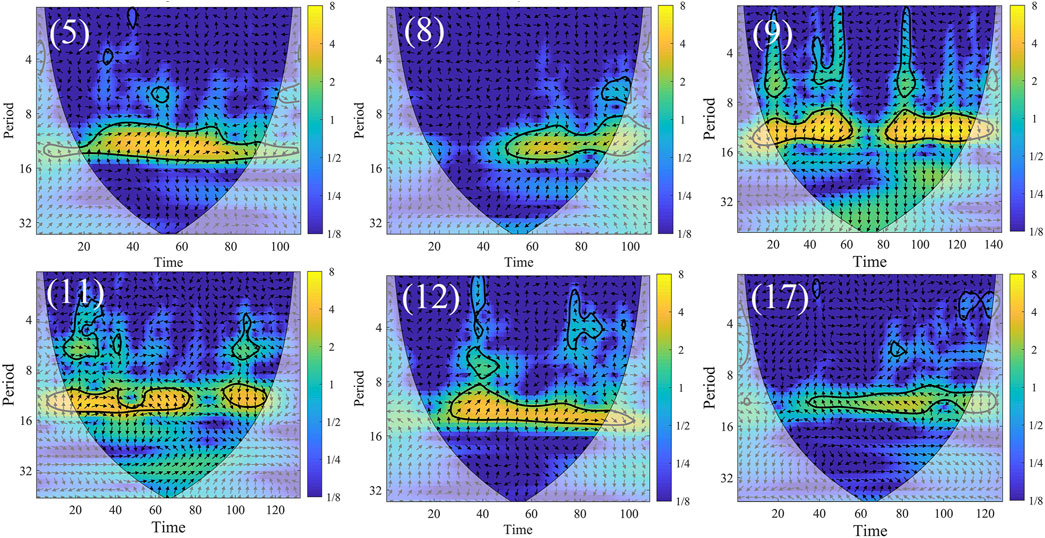
Figure 14. Cross coherence plot between mid-deep monitoring well groundwater level and precipitation.
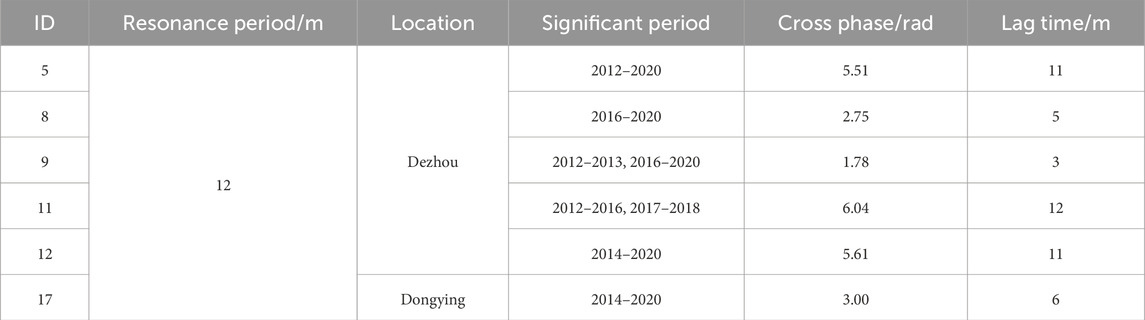
Table 6. Cross-phase and lag time of mid-deep monitoring wells to precipitation.
This study combines non-parametric testing, blind source signal separation, and cross-wavelet transform methods to analyze the spatiotemporal variations of precipitation and groundwater levels, and their response relationship in the North Shandong Plain. The ICA-XWT method contributes to a deeper understanding of groundwater variation characteristics and its response to precipitation. The main conclusions are as follows.
1) From 2012 to 2023, precipitation in the North Shandong Plain remained stable with a slight increase, displaying a spatial distribution decreasing from southwest to northeast. According to the M-K trend test, about 70% of the shallow and deep groundwater levels were declining, mainly concentrated in the northwest groundwater drop funnel of Dezhou and central areas. Excessive groundwater extraction is the primary factor influencing the decline in groundwater levels.
2) Based on the independent component analysis method, three primary groundwater level evolution patterns were identified. IC1 represents a long-term declining trend, with a continuous decrease before 2018 followed by a significant recovery. IC2 exhibits periodic fluctuations, while IC3 reflects groundwater level changes at specific points. Spatially, IC1 has the highest scores, predominantly located in the centers of groundwater depression cones, with Dezhou showing high scores across all three components. IC1 contributes over 60% among the three patterns, indicating that the groundwater level in the North Shandong Plain primarily declined between 2012 and 2018, consistent with the M-K trend test results. The recovery of water levels after 2018 was attributed to increased water supply and reduced groundwater usage in the region between 2017 and 2019.
3) The lag time between groundwater levels and precipitation varies between shallow and deep groundwater. For shallow groundwater, the lag times increase sequentially across Binzhou, Dongying, and Dezhou, at 2, 4, and 6 months, respectively, with an average lag time of 3.6 months, indicating a faster response to precipitation recharge. The average lag time for deep groundwater levels is 8 months, with a maximum of up to 12 months, with the latter primarily occurring in the groundwater depression cone in western Dezhou. Considering both shallow and deep groundwater systems, although artificial groundwater recharge has been implemented, the deficit caused by past excessive extraction has not yet been fully replenished. Continued restrictions on groundwater extraction and enhanced recharge efforts are necessary to ensure a gradual recovery of groundwater levels.
Publicly available datasets were analyzed in this study. This data can be found here: http://www.geodata.cn.
XL: Writing–original draft, Formal Analysis, Methodology, Validation, Visualization. CZ: Conceptualization, Funding acquisition, Supervision, Writing–review and editing. HG: Funding acquisition, Supervision, Writing–review and editing. BC: Funding acquisition, Supervision, Writing–review and editing. XG: Visualization, Writing–review and editing. YY: Resources, Writing–review and editing. XS: Resources, Writing–review and editing.
The author(s) declare that financial support was received for the research, authorship, and/or publication of this article. This work was supported by the National Natural Science Foundation of China [42201081, 42371081, 42371089, 41930109]; the Beijing Outstanding Young Scientist Program [BJJWZYJH01201910028032]; and the R&D Program of Beijing Municipal Education Commission [KM 202210028010].
Acknowledgement for the data support from “National Earth System Science Data Center, National Science and Technology Infrastructure of China. (http://www.geodata.cn)”.
The authors declare that the research was conducted in the absence of any commercial or financial relationships that could be construed as a potential conflict of interest.
The author(s) declare that Generative AI was used in the creation of this manuscript. Generative AI was used for the creation of this manuscript. During the preparation of this work the author used ChatGPT in order to improve readability and language. After using this tool, the author reviewed and edited the content as needed and takes full responsibility for the content of the publication.
All claims expressed in this article are solely those of the authors and do not necessarily represent those of their affiliated organizations, or those of the publisher, the editors and the reviewers. Any product that may be evaluated in this article, or claim that may be made by its manufacturer, is not guaranteed or endorsed by the publisher.
Dang, L. J., Xu, Y., and Xu, X. X. (2011). Surface water and groundwater response to precipitation in loess hilly region: a case study of kanggou watershed. Prog. Geogr. 30 (01), 87–94. doi:10.11820/dlkxjz.2011.01.011
de Graaf, I. E., Gleeson, T., Sutanudjaja, E. H., and Bierkens, M. F. (2019). Environmental flow limits to global groundwater pumping. Nature 574, 90–94. doi:10.1038/s41586-019-1594-4
Di, S. T., Jia, C., Zhang, S. P., Ding, P. P., Shao, M., and Zhang, Y. W. (2020). Characteristics and evolutionary trend prediction of ground subsidence area caused by over-pumping in North Shandong plain. Acta Geol. Sin. 94 (05), 1638–1654. doi:10.19762/j.cnki.dizhixuebao.2020158
Gao, M., and Luo, Y. (2016). Change of groundwater resource and prevention and control of seawater intrusion in coastal zone. Bull. Chin. Acad. Sci. 31 (10), 1197–1203. doi:10.16418/j.issn.1000-3045.2016.10.009
Ghanbari, R. N., and Bravo, H. R. (2011). Evaluation of correlations between precipitation, groundwater fluctuations, and lake level fluctuations using spectral methods (Wisconsin, USA). Hydrogeol. J. 19 (4), 801–810. doi:10.1007/s10040-011-0718-1
Grinsted, A., Moore, J. C., and Jevrejeva, S. (2004). Application of the cross wavelet transform and wavelet coherence to geophysical time series. Nonlin. Process. Geophys. 11 (5/6), 561–566. doi:10.5194/npg-11-561-2004
Guan, N., Bi, H. X., Zhang, Q. T., Li, S. S., and Jiao, Z. H. (2023). Spatial and temporal dynamic characteristics and response to precipitation of groundwater burial depth in different strata in changping District, beijing. J. Irrig. Drain. Eng. 42 (s01), 103–108. doi:10.13522/j.cnki.ggps.2023220
Hu, J. M., Chen, B. B., Chu, X. Y., Gong, H. L., Zhou, C. F., Yang, Y. B., et al. (2024). Simulation and prediction of land subsidence in Decheng District under the constraint of InSAR deformation information. Front. Earth Sci. 12, 1458416. doi:10.3389/feart.2024.1458416
Huang, T. M., Ma, B. Q., Pang, Z. H., Li, Z., Li, Z. B., and Long, Y. (2020). How does precipitation recharge groundwater in loess aquifers? Evidence from multiple environmental tracers. J. Hydrol. 583, 124532. doi:10.1016/j.jhydrol.2019.124532
Jasechko, S., Seybold, H., Perrone, D., Fan, Y., Shamsudduha, M., Taylor, R., et al. (2024). Rapid groundwater decline and some cases of recovery in aquifers globally. Nature 625, 715–721. doi:10.1038/s41586-023-06879-8
Ji, H. L., Yang, Y. B., Zhang, Y. W., Liu, S. Z., and Zhu, Z. Y. (2019). Quaternary deposition characteristics and ground subsidence model analysis in North Shandong plain. Acta Geol. Sin. 93 (S1), 241–250. doi:10.19762/j.cnki.dizhixuebao.2019234
Kong, X. R. (2022). Cross wavelet analysis of formation deformation and groundwater level stratification monitoring data. Coal Geol. Explor. 50 (6), 138–146. doi:10.12363/issn.1001-1986.21.10.0562
Lai, S., Lin, J., Dong, J., Wu, J., Huang, X., and Liao, M. (2024). Investigating overlapping deformation patterns of the Beijing Plain by independent component analysis of InSAR observations. Int. J. Appl. Earth Obs. Geoinf. 135, 104279. doi:10.1016/j.jag.2024.104279
Li, J. (2020). Study on airborne transient electromagnetic method of denoising based on empirical mode decomposition and independent component analysis. Xi’an, China: Changan University. doi:10.26976/d.cnki.gchau.2020.002097
Li, L., Gong, H. L., Guo, L., Zhu, L., and Chen, B. B. (2024). Research advances on hydrologic time series analysis methods. J. Geo-inf. Sci. 26 (4), 927–945. doi:10.12082/dqxxkx.2024.230336
Liu, G. Y. (2001). Basic characteristics of deep groundwater and water environment problems in lubei plain. Geol. Shandong (05), 43–47. doi:10.3969/j.issn.1000-3665.2001.03.012
Liu, S., Liu, Z. T., Duan, X. F., Feng, Y., Jiang, S. J., and Huang, S. (2021). Dynamic monitoring of the groundwater in Guangrao county in Shandong province and the analysis of its geological environmental effect. Geol. Surv. China 8 (3), 49–57. doi:10.19388/j.zgdzdc.2021.03.06
Niu, C. W. (2004). Spatial and temporal variability of precipitation and hydrological response in the North China region. Wuhan, China: Wuhan University. doi:10.7666/d.Y631809
Peng, M., Lu, Z., Zhao, C., Motagh, M., Bai, L., Conway, B. D., et al. (2022). Mapping land subsidence and aquifer system properties of the willcox basin, Arizona, from InSAR observations and independent component analysis. Remote Sens. Environ. 271, 112894. doi:10.1016/j.rse.2022.112894
Peng, M. M. (2023). Research on the multi-scale surface deformation monitoring, prediction, and groundwater storage inversion with multi-temporal InSAR technique. Xi’an, China: Chang’an University. doi:10.26976/d.cnki.gchau.2023.000037
Peng, S. Z., Ding, Y. X., Liu, W. Z., and Li, Z. (2019). 1 km monthly temperature and precipitation dataset for China from 1901 to 2017. Earth Syst. Sci. Data 11, 1931–1946. doi:10.5194/essd-11-1931-2019
Qi, X. F., Li, W. P., Yang, S. Z., Shang, H., and Yi, F. (2015). Intra-annual time-lag analysis of the response of groundwater level dynamics to precipitation in the Baiquan spring area of Jinan. Earth Environ. 43 (06), 619–627. doi:10.14050/j.cnki.1672-9250.2015.06.004
Ren, J. C., Gu, S. Q., and Lu, X. N. (2024). Regional characteristics and trend analysis of annual precipitation in Shandong province based on REOF. Res. Soil Water Conserv. 31 (1), 224–231. doi:10.13869/j.cnki.rswc.2024.01.018
Song, Y., Zhang, Y. H., Wu, H. A., Wei, J. J., and Kang, Y. H. (2023). Land subsidence study in hengshui city combined with InSAR and independent component analysis. Sci. Surv. Mapp. 48 (07), 155–162. doi:10.16251/j.cnki.1009-2307.2023.07.018
Sun, Q. Q., Zhang, P., Wei, H., Liu, A. X., You, S. C., and Sun, D. F. (2020). Improved mapping and understanding of desert vegetation-habitat complexes from intra annual series of spectral endmember space using cross-wavelet transform and logistic regression. Remote Sens. Environ. 236, 111516. doi:10.1016/j.rse.2019.111516
Tatas, , Chu, H. J., and Thomas, J. B. (2022). Estimating future (next-month’s) spatial groundwater response from current regional pumping and precipitation rates. J. Hydrol. 604, 127160. doi:10.1016/j.jhydrol.2021.127160
Wang, D., Li, P. Y., He, X. D., and He, S. (2023). Exploring the response of shallow groundwater to precipitation in the northern piedmont of the Qinling Mountains, China. Urban Clim. 47, 101379. doi:10.1016/j.uclim.2022.101379
Wang, H. T., Gong, H. L., Chen, B. B., Zhou, C. F., Yang, Y. B., and Sun, X. X. (2024). Research on land subsidence-rebound affected by dualistic water cycle driven by climate change and human activities in Dezhou City, China. J. Hydrol. 636, 131327. doi:10.1016/j.jhydrol.2024.131327
Wang, M. Z., and Wan, J. W. (2020). Analysis and suggestions on land subsidence control in Dezhou city, Shandong province. Chin. Geol. Surv. 7 (03), 96–103. doi:10.19388/j.zgdzdc.2020.03.13
Xiang, Y., Yuan, X., Xie, Z. H., and Liu, Z. Y. (2006). Application of transfer function-autoregressive model in groundwater depth estimation. Hydrology (04), 55–59+93. doi:10.3969/j.issn.1000-0852.2006.04.012
Xu, Y., Gong, H. L., Chen, B. B., Zhang, Q. Q., and Li, Z. Z. (2021). Long-term and seasonal variation in groundwater storage in the North China Plain based on GRACE. Int. J. Appl. Earth Obs. Geoinf. 104, 102560. doi:10.1016/j.jag.2021.102560
Yang, P., Zhang, S. C., Guo, B. L., Yang, C. J., Feng, Q. Y., Lv, Y. C., et al. (2024). Characteristic of groundwater level dynamic variation and the potential influence factors in different aquifer categories in rizhao area, Shandong province. J. Jilin Univ. (Earth Sci. Ed.) 54 (3), 967–979. doi:10.13278/j.cnki.jjuese.20220322
Yin, X. R., Shu, L. C., Wang, Z., Lu, C. P., and Liu, B. (2023). Time-frequency analysis of groundwater depth variation based on the ICA-WTC composite method. J. Hydrol. 617 (A), 128914. doi:10.1016/j.jhydrol.2022.128914
Yu, H. L., and Lin, Y. C. (2015). Analysis of space–time non-stationary patterns of rainfall–groundwater interactions by integrating empirical orthogonal function and cross wavelet transform methods. J. Hydrol. 525, 585–597. doi:10.1016/j.jhydrol.2015.03.057
Zhang, C., Duan, Q. Y., Yeh, P.J.-F., Pan, Y., Gong, H. L., Moradkhani, H., et al. (2021). Sub-regional groundwater storage recovery in North China Plain after the South-to-North water diversion project. J. Hydrol. 597, 126156. doi:10.1016/j.jhydrol.2021.126156
Zheng, W. B., and Wang, S. Q. (2021). Extreme precipitation accelerates the contribution of nitrate sources from anthropogenetic activities to groundwater in a typical headwater area of the North China Plain. J. Hydrol. 603 (C), 127110. doi:10.1016/j.jhydrol.2021.127110
Keywords: precipitation, groundwater, trend analysis, ICA, XWT
Citation: Li X, Zhou C, Gong H, Chen B, Gao X, Yang Y and Sun X (2025) Study on spatiotemporal variation patterns of groundwater in the North Shandong Plain and its response to precipitation. Front. Earth Sci. 13:1543335. doi: 10.3389/feart.2025.1543335
Received: 11 December 2024; Accepted: 17 February 2025;
Published: 07 March 2025.
Edited by:
Tianming Huang, Chinese Academy of Sciences (CAS), ChinaReviewed by:
Chuntan Han, Chinese Academy of Sciences (CAS), ChinaCopyright © 2025 Li, Zhou, Gong, Chen, Gao, Yang and Sun. This is an open-access article distributed under the terms of the Creative Commons Attribution License (CC BY). The use, distribution or reproduction in other forums is permitted, provided the original author(s) and the copyright owner(s) are credited and that the original publication in this journal is cited, in accordance with accepted academic practice. No use, distribution or reproduction is permitted which does not comply with these terms.
*Correspondence: Chaofan Zhou, Njg0M0BjbnUuZWR1LmNu
Disclaimer: All claims expressed in this article are solely those of the authors and do not necessarily represent those of their affiliated organizations, or those of the publisher, the editors and the reviewers. Any product that may be evaluated in this article or claim that may be made by its manufacturer is not guaranteed or endorsed by the publisher.
Research integrity at Frontiers
Learn more about the work of our research integrity team to safeguard the quality of each article we publish.