 Changsheng Wang1,2
 Ying Zhou
 Xin Nie
- 1National Engineering Laboratory for Exploration and Development of Low-Permeability Oil and Gas Fields, Xi’an, China
- 2Exploration and Development Research Institute, PetroChina Changqing Oilfield Company, Xi’an, China
- 3Key Laboratory of Exploration Technologies for Oil and Gas Resources, Yangtze University, Wuhan, China
The characterization of carbonate microstructure is of great significance for the evaluation of carbonate oil and gas resources. However, due to the complexity and heterogeneity of the pore structure of tight carbonate rocks, high-pressure mercury intrusion, nuclear magnetic resonance (NMR) and other methods have different limitations in the characterization. This study takes tight carbonate core samples in the fourth member of the Ordovician Majiagou Formation in the Ordos Basin as the research object, and the rock physics experiments, computed tomography (CT), high resolution large-scale backscatter scanning electron microscopy (MAPS), quantitative evaluation of minerals by scanning electron microscopy (QEMSCAN) and focused ion beam-scanning electron microscopy (FIB-SEM) was utilized to characterize the pore structure from micrometer to nanometer, revealing the main mineral composition, and systematically analyzing the relationship between different mineral and pore structures. The results show that the microscopic reservoir space in the study area is mainly composed of inter-crystalline pores, intra-crystalline pores and microfractures; there are obvious differences in the pore structure of different lithologies. The samples with more dolomite have the largest number of pores and throats, the largest coordination number, and the best connectivity; the samples with more calcite have the smallest pore radius. The presence of quartz is conducive to the preservation of pores. This multi-scale characterization method using digital core technology provides us with comprehensive pore characteristic, provides important clues for further understanding the pore structure of tight carbonate reservoirs.
1 Introduction
Carbonate rocks, as important hydrocarbon reservoirs, play an important role in hydrocarbon exploration and development. The pore and throat structural characteristics have a crucial influence on reservoir performance and fluid transport. In particular, as one of the largest onshore basins in China, the Ordos Basin has deep Ordovician sub-salt reservoirs that are one of the important areas for gas exploration in China (Shao et al., 2019; Li and Chen, 2020; Ren et al., 2024). Due to the complex pore structure and multiple pore coupling effects of tight carbonate rocks, the resistivity of its reservoir varies over a wide range, and the causes of high and low resistances are unknown, which makes it difficult to descript, and thus the accurate characterization of the microscopic pore structure of the reservoir is of great significance for oil and gas fields exploration and development (Ji et al., 2019; Liu et al., 2022a; Liu et al., 2022b; Li et al., 2023).
Tight carbonate reservoirs are carbonate formations with an average porosity of less than 2% and permeability of less than 0.1 × 10⁻³μm2 (Wei et al., 2017). The microstructure characterization requires some special methods. The main methods include scanning electron microscopy (SEM) (Liu et al., 2022a; c), transmission electron microscopy (TEM), X-ray diffraction (XRD) and nuclear magnetic resonance (NMR) (Takahashi and Sugiyama, 2019; Luo, 2022). Among them, SEM can provide high-resolution images, but cannot provide information on the three-dimensional (3D) structure of the core; The sample preparation is complicated for TEM scanning, and the sample is too small to be representative; XRD can describe mineral composition of the sample, but cannot show information on pore structure. Taken together, characterization of tight carbonate rocks requires a combination of methods to gain a more comprehensive understanding. For example, combining SEM and Brunauer–Emmett–Teller (BET) can simultaneously characterize the pore structure of the rock (Ge et al., 2024).
Digital core technology, as a non-invasive, high-resolution, 3D rock imaging and analysis technique, provides a unique perspective (Nie et al., 2016; Wang et al., 2022; Jin et al., 2023). Through high-resolution digital core experiments ranging from micro-to nano-scale can achieve multiscale pore structure characterization, which reveals the characteristics of reservoir more accurately and comprehensively (Sheng et al., 2019; Zhao et al., 2020; Zhou et al., 2024). Compared with the traditional core analysis methods, digital core technology can intuitively obtain the pore radius, throat radius, connectivity and other information of the core, which provides an important support for the quantitative study of the pore structure of the rock (Liu X. et al., 2022; Li et al., 2023; Li et al., 2024).
This paper takes the tight carbonate reservoirs of the fourth member of Majiagou (Ma4) Formation in the lower Paleozoic of the Ordos Basin as the research object, characterizing with a carbonate rock-salt rock coexisting system and a variety of complex pore types. By using the “micrometer-nanometer” multi-scale digital core characterization technology, from micro-computed tomography (CT) to Focused Ion Beam Scanning Electron Microscopy (FIB-SEM), the fine characterization of micro-pore structure has been achieved. Subsequently, the relationship between the lithology and the pore structure was analyzed, providing strong data support for numerical simulation and more future work.
2 Geological settings
The Ordos Basin, located in central China, is one of the largest terrestrial basins in China (Figure 1), with complex geological structures and rich sedimentary rock systems (Ding et al., 2015; Jia et al., 2023; Guo et al., 2024). Due to the isolation of the 6 subsection 5 section of the Ordovician Majiagou Formation, the pathway for downward supply of hydrocarbons from the Upper Paleozoic coal source rocks has been blocked on a large scale, resulting in the formation of two independent hydrocarbon formation systems. The upper reservoir system is mainly supplied by the hydrocarbon source rocks of the Upper Paleoproterozoic coal system, which is called the “above-salt” reservoir system, while the lower reservoir system mainly relies on the hydrocarbon supply from the marine hydrocarbon source rocks of the Ordos System itself, which is called the “below-salt” reservoir system (Kong et al., 2024). The deep subsalt layer is an important sedimentary system in the Ordos Basin, and is one of the major shale gas exploration areas in China, with tight carbonate rocks and shale as the main reservoir types (Li et al., 2022; Jia et al., 2023; Qi et al., 2024). Its rocks are mainly composed of carbonate minerals, such as calcite and dolomite, with high compaction and densification. The pore structure of the reservoir is complex, mainly composed of micropores and fractures, etc., and the storage space is relatively limited. The Majiagou Formation is divided into six sections from bottom to top, including Ma1∼Ma6 sections, of which Ma1, Ma3 and Ma5 sections are sea retreat sedimentary cyclones, which mainly develop the deposition of anhydrite, and Ma2, Ma4 and Ma6 sections are sea invasion sedimentary cyclones, which mainly develop the deposition of carbonate rock (Wu et al., 2021). Among them, Ma4 has shown great potential in natural gas exploration in recent years, and several wells have obtained industrial gas flow, which is a favorable area for exploration at present (Li et al., 2015; Guo et al., 2024).
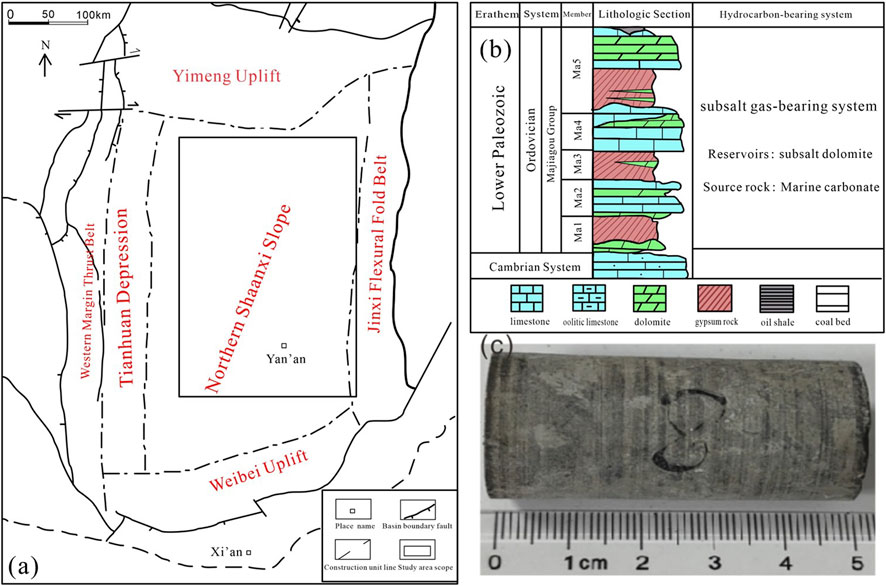
Figure 1. Geographic location of the study area and images of rock samples (modified from Ren et al., 2024). (A) Paleogeographic map of the Majiagou Formation in the Ordos Basin; (B) Comprehensive stratigraphic histogram; (C) Actual picture of rock samples.
3 Samples and methods
3.1 Samples and rock physics experiments
Combined with the logging interpretation results, coring was carried out according to the different dolomite contents and physical properties of Ma4, and 29 plug rock samples (2.5 cm in diameter) were selected as research objects.
The porosity and permeability, as well as resistivity measurement instruments used in this study, are part of the UQZJ-100 High-Temperature and High-Pressure Full-Diameter Multi-Parameter Testing System. This device is capable of simulating high-temperature and high-pressure conditions and can measure the porosity and permeability parameters of full-diameter core samples under such conditions. Furthermore, the system is equipped with a comprehensive software operation platform that allows for numerical control data acquisition and real-time monitoring during the testing process, significantly improving measurement accuracy.
3.2 Multiscale scanning methods
3.2.1 Micro-CT
In recent years, X-CT has gradually become one of the commonly used methods for fine evaluation of pore structure in unconventional reservoirs. This method uses conical X-rays to penetrate samples, magnify images through sample lenses of different magnifications, and reconstruct the 3D structural characteristics of pore throats from a large number of X-ray attenuation images obtained by 360° rotation. In this paper, a full-core high-precision CT scanner is used to scan the plunger core with a scanning resolution of 23.1 μm/voxel. The grayscale value of the image reflects the density of different areas of the core slice, where the larger the grayscale value, the higher the density, and the smaller the grayscale value, the lower the density. After scanning and 3D reconstruction, the distribution of pores and minerals in 3D space is obtained through filtering, threshold segmentation and other processes.
3.2.2 MAPS
The MAPS experiment uses argon ions to polish the carbonate rock end face, scans with an electron beam and divides the selected scanning area into a series of grids, selects the secondary electron imaging mode, and automatically forms a high-precision MAPS image after splicing. This method has significant advantages in analyzing rock cores with strong heterogeneity under a large field of view. It provides the ability to identify pores at the nanometer scale, so that the microstructure of rock samples can be accurately analyzed and detailed information of pore characteristics can be obtained.
3.2.3 QEMSCAN
It is difficult to use a single MAPS image to clearly identify the minerals represented by different grayscales in the core. The QEMSCAN scanning makes up for this shortcoming. Combined with QEMSCAN scanning, the distribution of different minerals in the core can be obtained, the different pore types in the core can be clarified, and the microscopic pore structure can be described more finely. QEMSCAN uses a scanning electron microscope and energy spectrum to scan the core surface, thereby realizing fully automatic quantitative analysis of minerals in rock samples.
3.2.4 FIB-SEM
FIB-SEM is a dual-beam system formed by installing FIB and SEM on the same probe. It can also use other probes or detection instruments such as X-ray energy scattering spectrometer to directly measure the sample, which is also the mainstream method of core analysis in nanoscale. The FIB was utilized to cut and polish the sample surface, and then the SEM was used to scan high-resolution imaging. FIB-SEM can be used to achieve in situ scanning of core slice, cut and scan carbonate cores, reconstruct a series of two-dimensional (2D) images into 3D digital cores, and study the microscopic pore structure characteristics of the core at the nanoscale.
To accurately and comprehensively characterize the micropore structure of carbonate rocks, rock physics experiment and multi-scale digital core scanning were applied to samples, subsequently the characteristic of the pore and the relationship between the pore and the mineral can be obtained. Figure 2 depicted the flowchart.
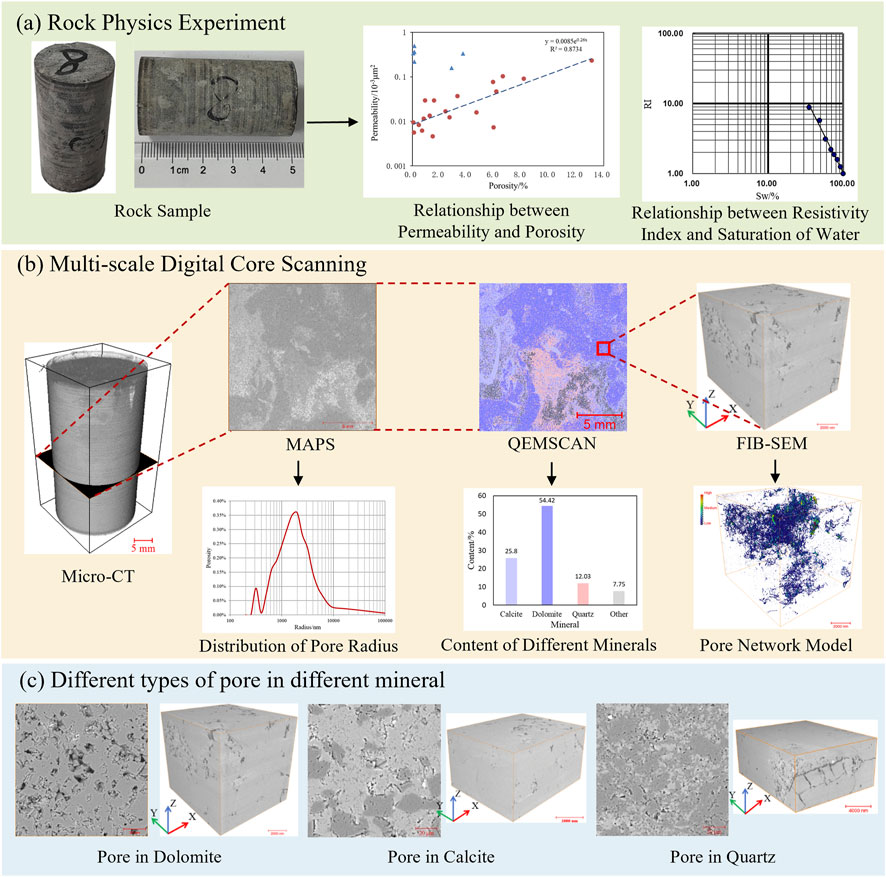
Figure 2. Flowchart for multi-scale characterization of tight carbonate rocks. (A) Rock physics experiment, (B) Multi-scale digital core scanning, (C) Different types of pore in different mineral.
4 Results
4.1 Physical properties
A large number of previous studies have shown that the content of calcite affects the pore structure, porosity and permeability of rocks, thereby affecting the resistivity of the samples (Ehrenberg et al., 2006; Fantle and Higgins, 2014; Omidpour et al., 2022). In order to accurately analyze the effect of calcite content on the microscopic pore structure, cores with different calcite contents were selected for rock physics experiments based on the logging results, and representative core samples were screened through the rock physics experimental structure for core scanning experiments.
4.1.1 Petrophysical measurement results
The rock physics experiment includes three main steps. First, prepare the rock samples and perform necessary operations such as drilling, cutting, and polishing to ensure a smooth surface. Then, set up the experimental device. The porosity and permeability test measures the saturated gas on the core. The resistivity test measures the electric field or current on the core. Finally, record the experimental data such as porosity, permeability, and resistivity. Table 1 shows the porosity and permeability test results of 29 groups of samples and the rock electrical test results of 20 groups samples. The results show that the porosity of four groups of samples is less than the lower limit of 0.1%, the porosity of 84% of the samples is below 6%, the porosity of 72% of the samples is below 4%, and the average porosity of all samples is 2.92%; the permeability distribution range is 0.004–0.493 mD, and the average permeability is 0.094mD. The porosity and permeability results show that the study area is a tight carbonate reservoir.
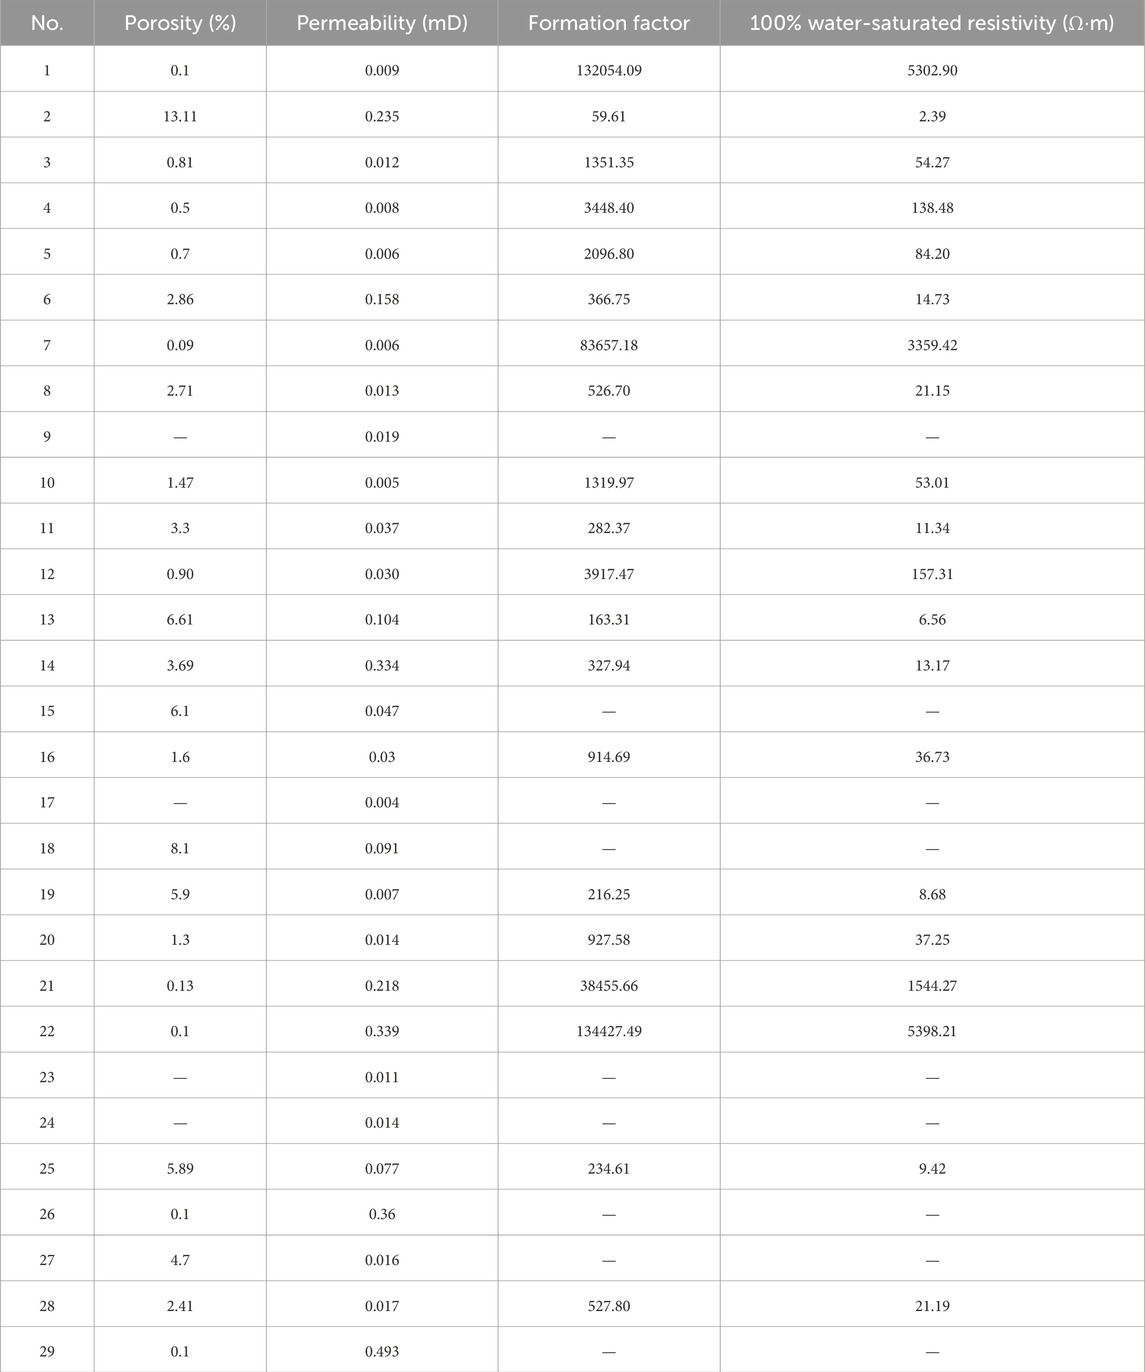
Table 1. Results of rock physics experiments.
The rock physics experiment caused some samples to be damaged (samples 18, 23, 26, and 29), and considering multiple parameters such as lithology, porosity, and resistivity, 12 representative samples were finally selected for micrometer CT scanning.
4.1.2 Mineral composition analysis based on QEMSCAN
The mineral composition and distribution of rocks are important for characterizing the microstructure of rocks. Clarifying the types and distribution characteristics of each mineral component can more accurately carry out precise evaluation of the microscopic pore structure based on digital cores. In this study, MAPS scanning was performed on the selected scanning area with a resolution of 250 nm. As shown in Figure 3, the 12 groups of cores are dominated by dolomite and calcite. The contents of calcite and dolomite in different samples are different, which is conducive to our analysis of the influence of different dolomite contents on the pore structure of rock samples.
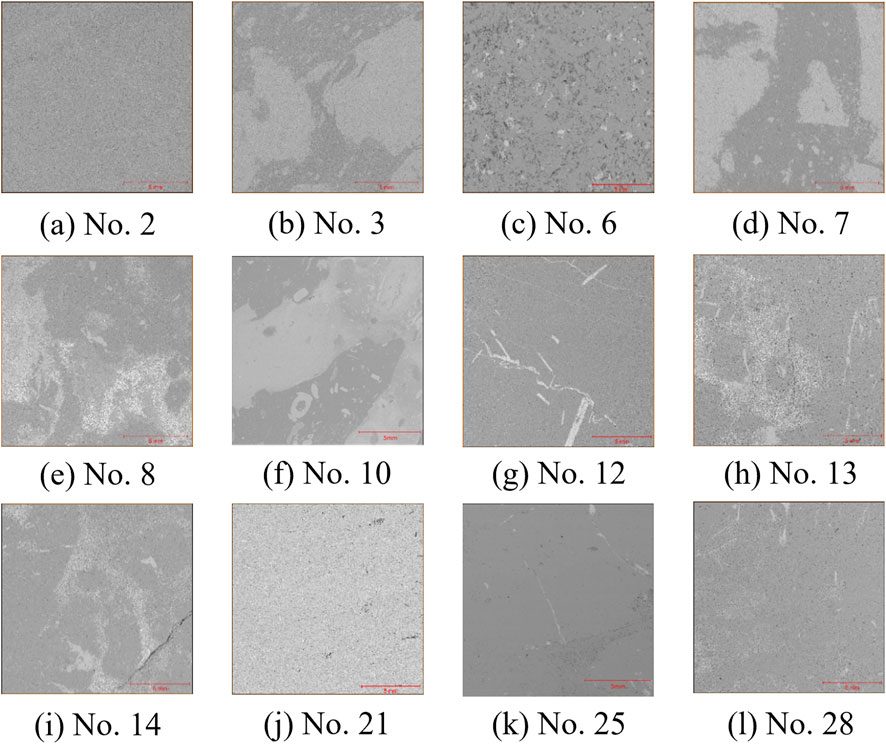
Figure 3. The image of MAPS. (A) The image of sample 2, (B) The image of sample 3, (C) The image of sample 6, (D) The image of sample 7, (E) The image of sample 8, (F) The image of sample 10, (G) The image of sample 12, (H) The image of sample 13, (I) The image of sample 14, (J) The image of sample 21, (K) The image of sample 25, (L) The image of sample 28.
The QEMSCAN experiment was used to analyze the minerals of the MAPS experimental samples in the previous article. The scanning resolution was 20 μm/pixel. The mineral distribution obtained after scanning is shown in Figure 4. The main minerals in samples No. 2, No. 6, No. 12, No. 25 and No. 28 are dolomite, containing a small amount of calcite. In addition, samples No. 6 and No. 25 contain a small amount of anhydrite (purple area in the figure); the dolomite content of samples No. 3 and No. 7 is equivalent to the calcite content; samples No. 8, No. 13, No. 14 and No. 28 all contain varying amounts of quartz (pink area in the image); the minerals in sample No. 21 are mainly calcite. In the rock samples with dolomite as the matrix, some obvious calcite bands can be observed (samples No. 2, No. 12 and No. 25).
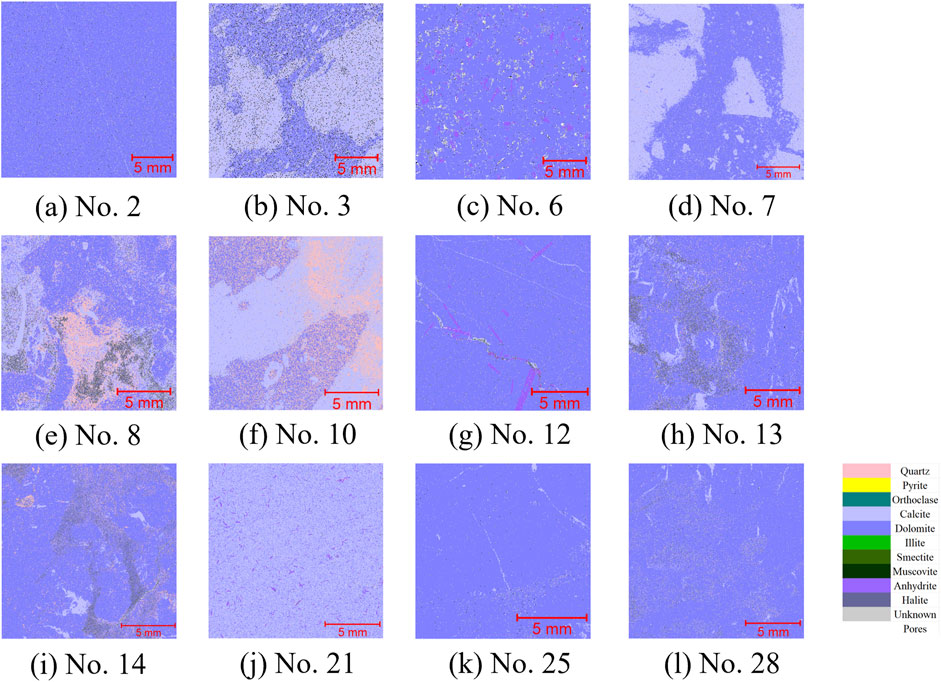
Figure 4. The image of QEMSCAN. (A) The image of sample 2, (B) The image of sample 3, (C) The image of sample 6, (D) The image of sample 7, (E) The image of sample 8, (F) The image of sample 10, (G) The image of sample 12, (H) The image of sample 13, (I) The image of sample 14, (J) The image of sample 21, (K) The image of sample 25, (L) The image of sample 28.
4.2 Pore characterization based on different experiments
Pore type identification is an important part of reservoir pore structure evaluation. Existing studies have shown that the pore types of carbonate reservoirs in the Ordos Basin are mainly inter-crystalline (dissolved) pores, and pores in cores are generally identified by casting thin sections and scanning electron microscopy. However, for tight carbonate reservoirs, conventional methods are difficult to characterize them in detail, and higher-resolution experiments are needed to achieve this.
From the MAPS data, it can be seen that the pore types are mainly inter-crystalline pores, and other types of pores include intracrystalline pores and microfractures. The different types of pores were shown in Figures 5A–I. The pore development of different mineral matrices in the samples is quite different. The number of inter-crystalline pores in the samples with calcite as the matrix is large, but the pore size is small, while the pore size in the samples with dolomite as the main mineral is large, and most of the pores contain fillers (calcite) (Figure 5C); the pore shape of intracrystalline pores is mostly round, and the number of pores is small; microfractures are also developed in the samples, but some of the fractures are filled with calcite (Figure 5H).
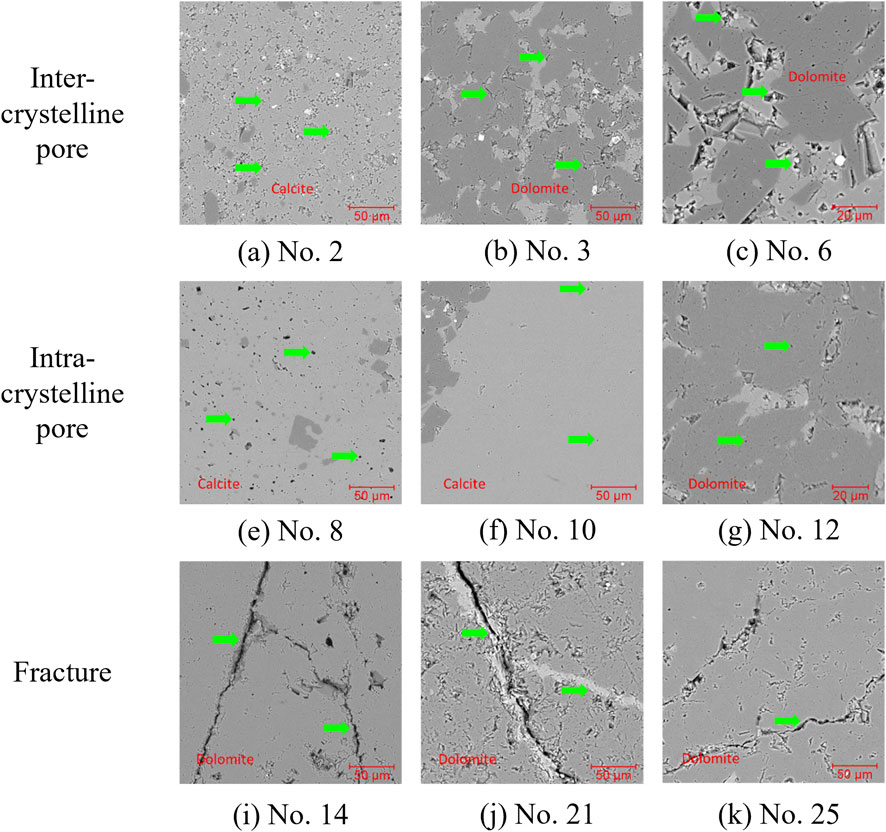
Figure 5. The different types of pores based on MAPS. (A) Inter-crystalline pore in calcite, (B, C) Inter-crystalline pore in dolomite, (D, E) Intra-crystalline pore in calcite, (F) Intra-crystalline pore in dolomite, (G–I) Fracture in dolomite.
With the help of MAPS data, it is not difficult to find that the core of the tight carbonate reservoir in the study area has strong heterogeneity and complex pore structure. Traditional rock physics experiments have great difficulty in quantitatively characterizing the microscopic pore structure. Therefore, this study combines multi-scale core scanning experiments, including micro-CT, MAPS and FIB-SEM experiments, to build a bridge between the reservoir microstructure and macroscopic physical properties, finely depict the inside microstructure of the reservoir, and reveal the characteristics of the reservoir microscopic pore structure.
4.2.1 Micropore characterization based on Micro-CT
In micro-CT, high-density minerals appear as bright areas with high grayscale values on CT images, while low-density minerals appear as dark areas. At the current resolution, most cores are mainly composed of two types of minerals (samples 3, 6, 7, 8, and 10), and a few cores have microscale factures. As can be seen from Figure 6, cracks are developed in cores 2, 12, 14, and 21. Among them, the fractures developed in samples 2, 14, and 21 are connected in the Z direction, and the porosity of the fracture is 3.11%, 2.59%, and 0.82%, respectively. Microscale pores are developed in samples 6, 8, 13, 25, and 28, and some samples contain a little amount of high-density materials, such as the blocky rocks in sample six and the slender strip minerals in sample 12. In addition, the core sample six showed anomalies during the experiment (the porosity at both ends and around the core was higher than that in the middle, and CT showed that the density in the middle of the core was higher), and the subsequent analysis was not taken into consideration.
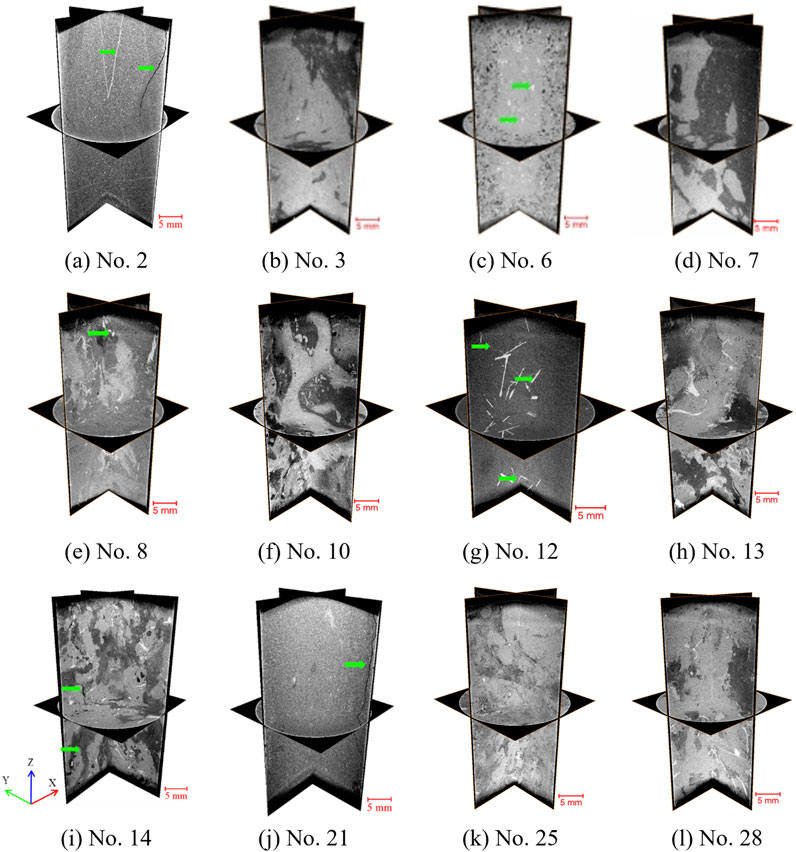
Figure 6. The 3D image of Micro-CT. (A) The image of sample 2, (B) The image of sample 3, (C) The image of sample 6, (D) The image of sample 7, (E) The image of sample 8, (F) The image of sample 10, (G) The image of sample 12, (H) The image of sample 13, (I) The image of sample 14, (J) The image of sample 21, (K) The image of sample 25, (L) The image of sample 28.
Since it is difficult to quantitatively analyze microstructural features at the micrometer CT scanning resolution, the microscopic pores are finely characterized based on higher resolution MAPS scanning.
4.2.2 Pore type and parameter extraction
As shown in Figure 7, the pore types and pore shapes in different lithological matrices are different. The pores in the dolomite matrix are mainly inter-crystalline pores, and some pores are filled with minerals such as calcite, quartz or anhydrite, and the shapes are mostly long and narrow; some samples have developed dissolution pores, and the dissolution pores are mostly filled with calcite or other minerals. The pores in the calcite matrix are mainly inter-crystalline pores and intracrystalline pores. The pore diameter of inter-crystalline pores is larger than that of intracrystalline pores. The pore morphology of inter-crystalline pores is mostly long and narrow, and the pore morphology of intracrystalline pores is mostly round or elliptical.
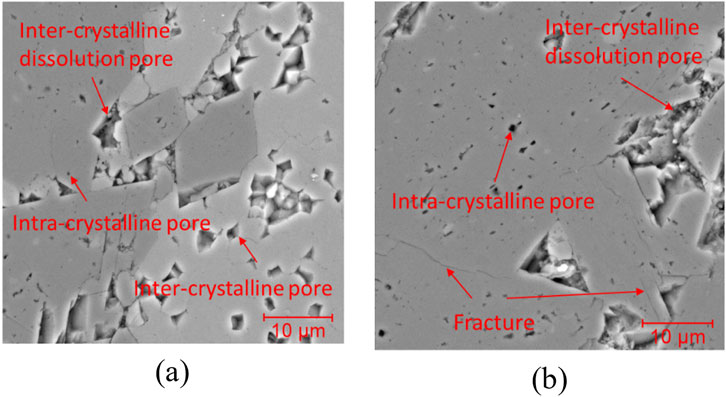
Figure 7. The different types of pores. (A) Different types of pores in dolomite, (B) Different types of pores in calcite, inter-crystalline dissolution pore is filled with calcite or other minerals.
In order to quantitatively characterize different types of pores, and considering the large amount of calculation of the original MAPS data, representative sub-samples were selected for the subsequent microscopic pore structure study, and the representative sub-samples were measured by areal porosity. Taking sample No. 2 as an example, Figure 8 shows the change of areal porosity with image size. When the image side length increases to 1600 pixels, the change of areal porosity begins to stabilize. Therefore, in the subsequent analysis, the sub-sample MAPS image size we selected was 1600 × 1600. Based on the Otsu threshold method, the pores in the core image were extracted, and then the areal porosity, pore radius, and aspect ratio were calculated. We used the same method to complete the processing of 11 groups of samples. The pore parameter extraction results of 11 groups of core samples are shown in Table 2. It can be seen from the results that the areal porosity extracted by MAPS is consistent with the porosity results obtained by rock physics experiments, which proves the reliability of analyzing rock microstructure based on MAPS data.
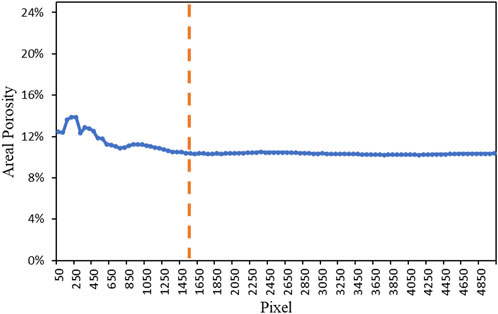
Figure 8. The change between image size and areal porosity.
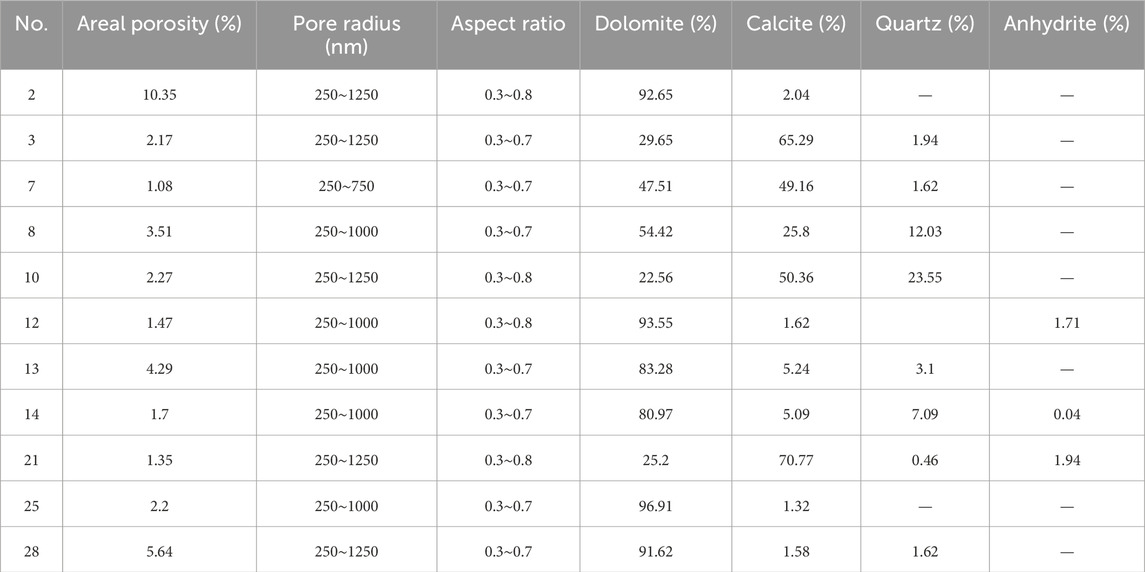
Table 2. Results of parameter extraction of different samples.
The 12 groups of core samples have different dolomite contents, among which sample No. 25 has the highest dolomite content and a porosity of 2.2%; sample No. 10 has the lowest dolomite content and a porosity of 2.27%. Among all samples, sample No. 2 has the highest porosity of 10.35%, and the pore size distribution is between 250 and 1250 nm; sample No. 7 has the lowest porosity of only 1.08%, and the sample pore size distribution is between 250 and 750 nm.
The 2D MAPS data can accurately describe micro-nanoscale pores, but it cannot describe the shape of the core in 3D space and the degree of connectivity between different pores. FIB-SEM, as a high-precision 3D core imaging method, can accurately describe the 3D pores at the nanoscale. It has significant advantages in characterization.
4.2.3 3D pore structure in different mineral
Based on the MAPS images, it was found that the main pore types in different mineral matrices are different. The results of 2D pore analysis found that the pore sizes and aspect ratios of pores in different matrices are also different. In order to more accurately evaluate the pore structure characteristics in different matrices, sub-samples were selected and the pore sizes, throat radii, and coordination numbers of different matrix pores were extracted through high-precision FIB-SEM experiments, which can analyze the connectivity of different pores in 3D space.
The main minerals in sample eight are dolomite, calcite and quartz. Three sub-samples with different minerals were selected from sample 8, namely, 8-1, 8-2 and 8-3. The sub-sample selection positions are shown in Figure 9. The main mineral of sub-sample 8-1 is quartz, the main mineral of sub-sample 8-2 is dolomite, and the main mineral of sub-sample 8-3 is calcite.
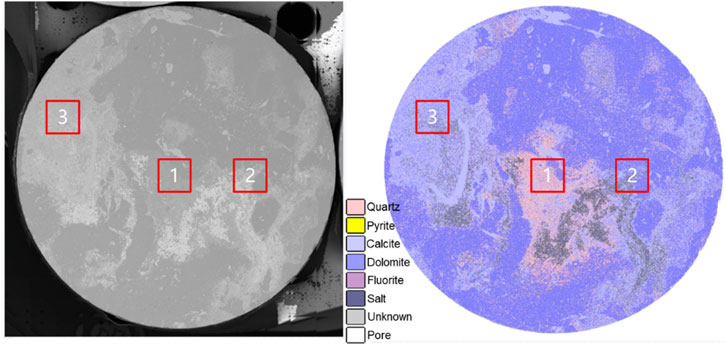
Figure 9. The location of selected sub-sample on sample 8. The backscattered electron image (left) and the QEMSCAN image (right).
The etching rate of the focused ion beam changes when it encounters pores, resulting in periodic vertical stripes in the FIB-SEM data, which is called the “curtain effect”. After investigation, the fast Fourier transform method has a satisfactory effect on filtering this type of noise, so this method is selected to eliminate the noise in the core. Subsequently, the pores are extracted by the threshold segmentation method and the 3D spatial distribution of the pores is obtained. Based on the “maximum sphere algorithm”, a pore network model is established to obtain the 3D topological structure and parameter information of the pores and throats (Table 3). Figure 10 shows the original FIB-SEM data of the three groups of sub-samples in sample No. 8, the distribution of pores in 3D space, and the pore network model image. From the original core image, it can be observed that pores are developed in all three groups of sub-samples, the pores of 8-1 and 8-3 are locally connected, and the pore connectivity of sub-sample 8-2 is better.

Table 3. The pore and throat parameters extraction of sub-samples.
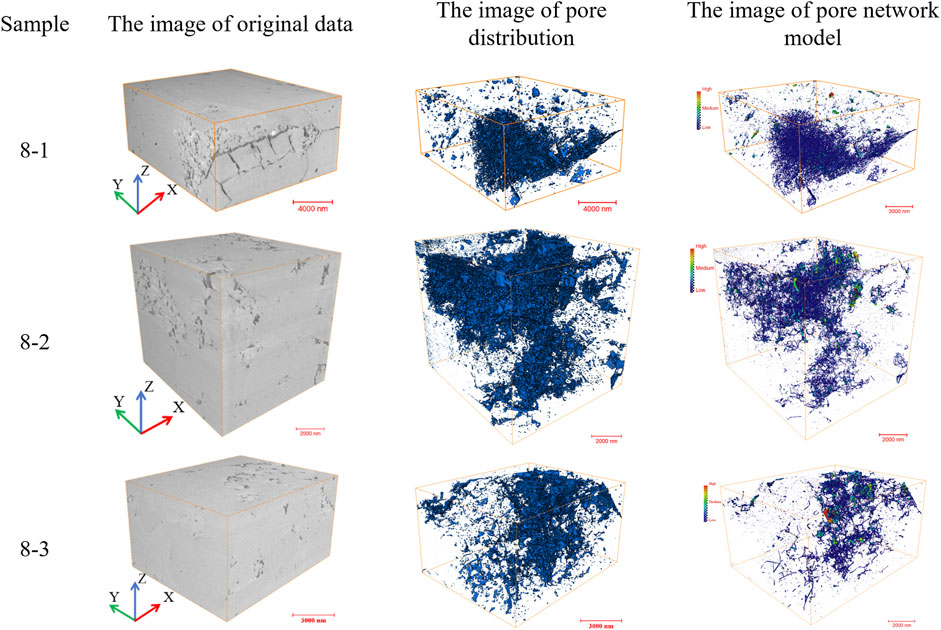
Figure 10. The 3D image of sub-samples. The different rows represent the different sub-samples 8-1, 8-2 and 8-3, the different columns show the image of original data, the image of pore distribution and the image of pore network model respectively.
The pore radius, throat radius, throat length and coordination number of the samples were calculated based on the pore network model. Among the three groups of samples, sample No. 2 has the largest porosity and the largest number of pores (Figure 11).
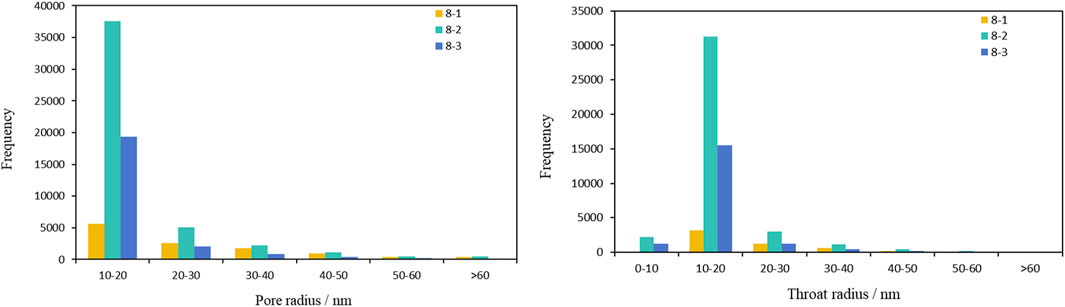
Figure 11. The pore and throat radius distribution. The distribution of pore radius (left) and throat radius (right) of different samples.
The coordination number of sample 8-1 is mainly between 0 and 3, and the pore radius is mainly between 10 and 60 nm. Its throat radius is mainly between 10 and 20 nm, and the throat length is mainly between 100 and 200 nm; the coordination number of sample 8-2 is mainly between 0 and 5, and the pore radius is mainly between 10 and 50 nm. Its throat radius is mainly between 10 and 20 nm, and the throat length is mainly between 0 and 300 nm; the coordination number of sample 8-3 is mainly between 0 and 5, and the pore radius is mainly between 10 and 20 nm. Its throat radius is mainly concentrated between 10 and 20 nm, and the throat length is mainly concentrated between 0 and 300 nm.
5 Discussion
5.1 Multiscale pore characteristic of tight carbonate rocks
The pore types in the study area are mainly inter-crystalline pores, intracrystalline pores and microfractures. The pore diameter of inter-crystalline pores is mainly distributed between 200 and 1400 nm, and the pore morphology is mostly narrow and long; the pore diameter of intracrystalline pores is smaller, mainly distributed between 250 and 1000 nm, and the pore morphology is mostly round and elliptical; microfractures are mainly developed between crystals, and the pore aspect ratio is very small. Based on micron CT, MAPS and FIB-SEM data, inter-crystalline pores and microfractures can be observed at multiple scales. Among them, the inter-crystalline pores of dolomite are mostly filled with minerals such as calcite and quartz, and some fractures are filled with calcite or anhydrite. Based on MAPS images, it can be observed that there are a small number of intracrystalline pores inside the limestone matrix. It can be seen from data of different scales that the reservoir space in the study area is mainly composed of micrometer-nanometer inter-crystalline pores. Analysis of the pore size distribution of all core samples shows that (Figure 12) the pore size distribution of the rocks in the study area is mainly unimodal, and the pore size distribution of a few cores is weakly bimodal; the pore size peaks are mainly distributed around 1,600 nm.

Figure 12. The pore size distribution of different samples.
Previous studies have confirmed that the reservoir space of the dolomite reservoir in the Ma4 in the Ordos Basin mainly includes inter-crystalline (dissolved) pores, residual intergranular pores, microfractures and other types, and that fillers such as anhydrite, quartz and calcite are common in the pores (He et al., 2022; Wang et al., 2023; Yu et al., 2024). The formation of inter-crystalline pores is mainly related to dolomitization. The inter-crystalline pores are expanded by the later diffuse dissolution to form inter-crystalline dissolved pores with good connectivity, which are high-quality reservoir spaces in the region; the formation of microfractures is mainly related to tectonic action. Mineral fillings (calcite) are common in the fractures, and the overall storage capacity is poor, which helps to improve the permeability of local rocks (Mou et al., 2023).
This study found that the pores of different scales in the sample are of different sizes, which shows that the pores in the target sample have strong heterogeneity. Integrating the parameters of different types of pores extracted is an important direction for future research.
5.2 The relationship between the physical property and lithology
There is a certain relationship between the core porosity and the dolomite content in the core. As shown in Figure 13, with the increase of dolomite content in the core, the core porosity tends to increase as a whole.
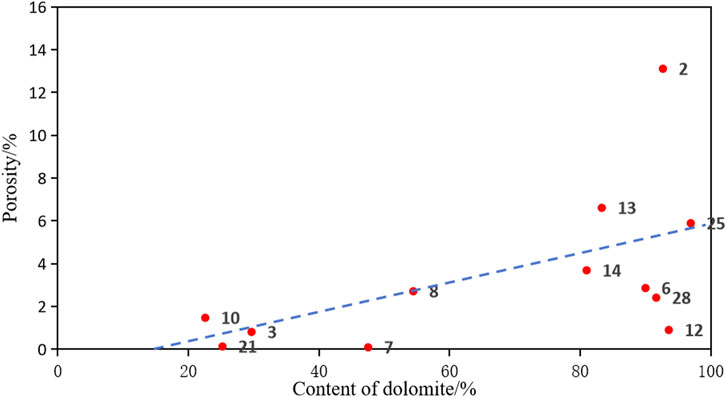
Figure 13. The relationship between the porosity and the content of dolomite.
However, the porosity of some samples with high content of dolomite is relatively small. For example, the dolomite content of samples 6, 12, 14 and 28 is greater than 90%, and the porosity is between 2% and 4%. Combining MAPS and QEMSCAN data, it is found that the filling of anhydrite and calcite may be the reason for the reduction of porosity (Figures 14A, B) (Jones and Xiao, 2005). The dolomite content of samples 7 and 8 is similar, but the porosity is quite different. It is found that the content of quartz in sample 8 is higher, and quartz has a certain supporting effect on the pores, which is conducive to the preservation of the pores (Figures 14G–I). Some pores in sample 7 are filled or cemented, and the porosity is relatively small (Figures 14E, F).
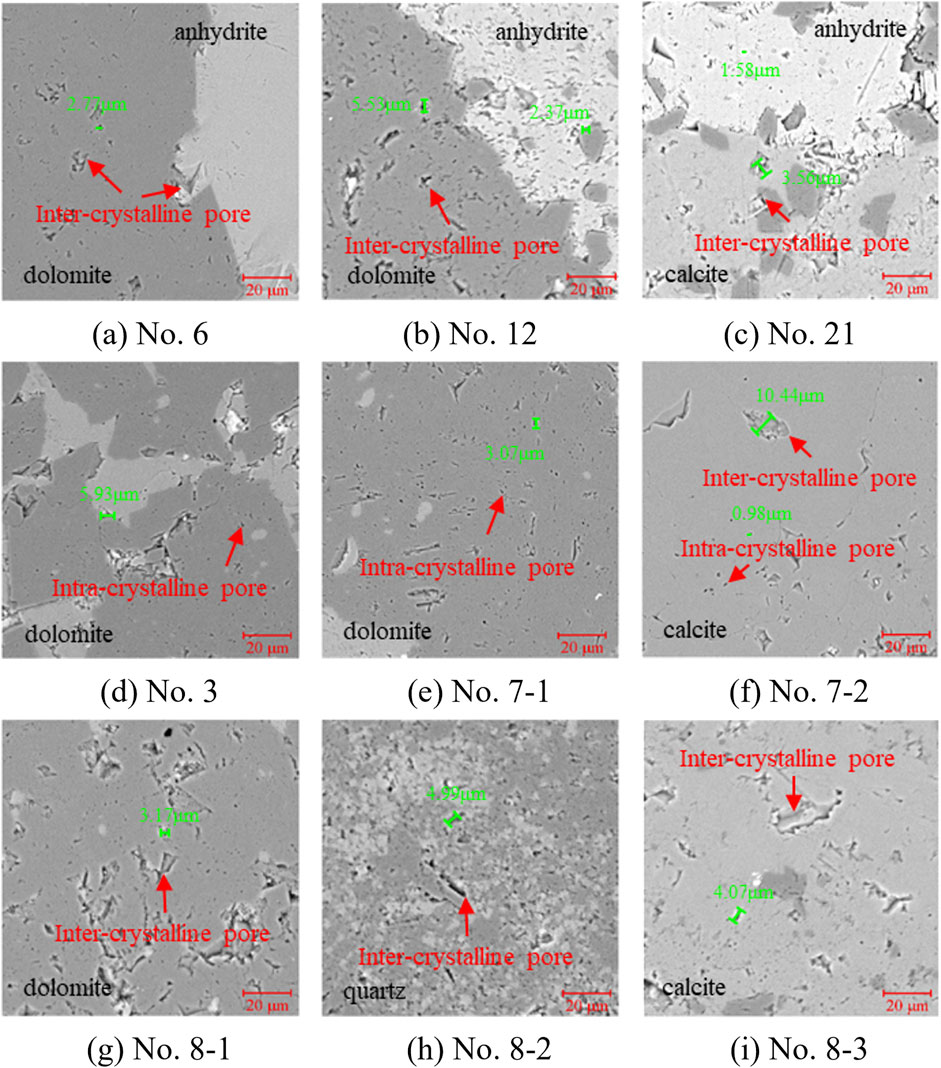
Figure 14. Different pore characteristic of different mineral. (A) Inter-crystalline pore in dolomite and anhydrite of sample 6, (B) Inter-crystalline pore in dolomite and anhydrite of sample 12, (C) Inter-crystalline pore in calcite and anhydrite of sample 21, (D) Intra-crystalline pore in dolomite of sample 3, (E) Intra-crystalline pore in dolomite of sample 7, (F) Different types of pore in calcite of sample 7, (G) Inter-crystalline pore in dolomite of sample 8, (H) Inter-crystalline pore in quartz of sample 8, (I) Inter-crystalline pore in calcite of sample 8
The pore network model established by FIB-SEM shows that the sample 8-1 (with a high quartz content) has the least number of pores, the largest average pore radius of 25.16 nm, the largest pore volume, but the smallest average coordination number. Overall, the 8-1 sample has larger pores but poor connectivity. The minerals in the sample 8-1 are mainly quartz, which has high hardness, good stability, and strong resistance to compaction, which is conducive to the preservation of pores.
The minerals in sample 8-2 are mainly dolomite, with the largest number of pores and the largest porosity of 3.77%. The average pore radius is 16.18nm, and the pore coordination number is between 0 and 5, indicating good pore connectivity. Burial genesis can transform limestone into dolomite. During the dolomitization process, the metasomatism of equal molecular weight can increase the porosity by 16%, resulting in the development of inter-crystalline pores in large-grained dolomite, which is often accompanied by the formation of small caves, and can become a good reservoir (Weyl, 1960; Luo et al., 2008). Moore, Lucia and Ehrenberg and other scholars believe that another contribution of dolomite to pores is its anti-compaction effect, which is conducive to the preservation of pores (Ehrenberg et al., 2006; Lucia, 2007; Moore, 2007).
The content of calcite in sample 8-3 is relatively high. The experimental results show that its pore radius is lower than that of dolomite, with an average pore radius of 15.75 nm and a porosity of 1.36%.
In summary, different mineral compositions have a significant impact on the pore structure of tight carbonate rocks. Samples composed of quartz have larger pore radius but fewer pores in number. Samples composed of dolomite have relatively smaller pores in number and their pores are smaller. The largest number and good connectivity. Compared with dolomite samples, samples whose minerals are dominated by calcite have worse pore development and smaller pore radius. Ehrenberg et al. have found in their research that as time and burial depth increase, the porosity of dolomite becomes higher than that of limestone, and dolomite is more resistant to compaction and solubility than limestone (Ehrenberg et al., 2006). Experts such as Zhang et al. have also pointed out that the pores of dolomite formations are generally higher than those of corresponding limestone formations (Zhang et al., 2010), which is sufficient to verify the reliability of the results of this article.
6 Conclusion
In this study, we used a variety of high-resolution imaging methods to perform multi-scale pore characterization on tight carbonate rock samples from the Ma4 Formation in the Ordos Basin, and deeply explored the complex pore structure characteristics inside tight carbonate rocks and their correlation with mineral composition. The following insights were obtained:
(1) The results of rock physics experiments show that the studied samples belong to tight carbonate rocks with low porosity and extremely low permeability.
(2) The pores of tight carbonate rocks in the study area mainly include three types: inter-crystalline pores, intracrystalline pores and microfractures. Among them, the pore diameter of inter-crystalline pores is relatively large, mainly distributed between 200 and 1,400 nm, and the morphology of the pores are mostly narrow and long, with a relatively small aspect ratio; intracrystalline pores are mostly round and elliptical, with pore diameters mainly distributed between 200 and 1,000 nm; some pores and microfractures are filled with minerals.
(3) There are obvious differences in the pore structures of different mineral matrices. The samples with quartz as the main mineral have larger pores but poor connectivity, the samples with dolomite as the main mineral have larger pores and better connectivity, and the samples with calcite as the main mineral have smaller pores. The compression resistance and pressure dissolution of dolomite are conducive to the preservation of pores.
This multi-scale characterization method using digital core technology provides us with comprehensive rock pore characteristic information, important clues for further understanding the pore structure of tight carbonate reservoirs, as well as data support for the next step of numerical simulation work.
Data availability statement
The original contributions presented in the study are included in the article/supplementary material, further inquiries can be directed to the corresponding authors.
Author contributions
CW: Writing–original draft, Conceptualization, Data curation. LT: Writing–original draft, Investigation. CS: Writing–original draft, Formal Analysis, Methodology. YD: Writing–original draft, Formal Analysis, Methodology. YZ: Writing–original draft, Conceptualization, Methodology. XN: Writing–original draft, Conceptualization, Methodology.
Funding
The author(s) declare that financial support was received for the research, authorship, and/or publication of this article. National Engineering Laboratory for Exploration and Development of Low-Permeability Oil and Gas Fields and the National Natural Science Foundation of China (No. 42474159).
Conflict of interest
Authors CW and LT were employed by PetroChina Changqing Oilfield Company.
The remaining authors declare that the research was conducted in the absence of any commercial or financial relationships that could be construed as a potential conflict of interest.
Generative AI statement
The author(s) declare that no Generative AI was used in the creation of this manuscript.
Publisher’s note
All claims expressed in this article are solely those of the authors and do not necessarily represent those of their affiliated organizations, or those of the publisher, the editors and the reviewers. Any product that may be evaluated in this article, or claim that may be made by its manufacturer, is not guaranteed or endorsed by the publisher.
Supplementary material
The Supplementary Material for this article can be found online at: https://www.frontiersin.org/articles/10.3389/feart.2025.1538316/full#supplementary-material
References
Ding, X., Liu, G., Zha, M., Huang, Z., Gao, C., Wang, P., et al. (2015). Characteristics and origin of lacustrine source rocks in the Lower Cretaceous, Erlian Basin, northern China. Mar. Petroleum Geol. 66, 939–955. doi:10.1016/j.marpetgeo.2015.08.002
Ehrenberg, S. N., Eberli, G. P., Keramati, M., and Moallemi, S. A. (2006). Porosity-permeability relationships in interlayered limestone-dolostone reservoirs. AAPG Bull. 90, 91–114. doi:10.1306/08100505087
Fantle, M. S., and Higgins, J. (2014). The effects of diagenesis and dolomitization on Ca and Mg isotopes in marine platform carbonates: implications for the geochemical cycles of Ca and Mg. Geochimica Cosmochimica Acta 142, 458–481. doi:10.1016/j.gca.2014.07.025
Ge, M., Bao, S., and Shi, D. (2024). Multi−scale characterization of shale pore structure of Niutitang Formation in southeastern Guizhou and its influence on shale gas enrichment. Geol. China 51, 57–72. doi:10.12029/gc20210923001
Guo, J., Liu, G., and Li, L. (2024). High-frequency sequence division and its control on reservoirs in the ma51-5 sub-member of the ordovician Majiagou Formation, tao 7 block, Ordos Basin. Acta Sedimentol. Sin., 1–17. doi:10.14027/j.issn.1000-0550.2024.023
He, H., Guo, X., Zhao, Z., Xi, S., Wang, J., Song, W., et al. (2022). New understandings on gas accumulation and major exploration breakthroughs in subsalt Ma 4 member of ordovician Majiagou Formation, Ordos Basin, NW China. Petroleum Explor. Dev. 49, 489–501. doi:10.1016/s1876-3804(22)60041-7
Ji, L., Lin, M., Cao, G., and Jiang, W. (2019). A multiscale reconstructing method for shale based on SEM image and experiment data. J. Petroleum Sci. Eng. 179, 586–599. doi:10.1016/j.petrol.2019.04.067
Jia, L., Liu, H., and Xue, Y. (2023). Characterization of pore structure of carbonate reservoirs and study of storage and seepage capacity of them: taking lower paleozoic Ma 51 +2 reservoir in jingbian gasfield of Ordos Basin as an example. J. Xi’an Shiyou Univ. Nat. Sci. Ed. 38, 38–46. doi:10.3969/j.issn.1673-064X.2023.04.005
Jin, Y., Xiao, L., Li, W., Wang, G., and Long, W. (2023). Simulation of NMR response of microfractures based on digital rock technology. Geoenergy Sci. Eng. 227, 211876. doi:10.1016/j.geoen.2023.211876
Jones, G. D., and Xiao, Y. D. (2005). Dolomitization, anhydrite cementation, and porosity evolution in a reflux system: insights from reactive transport models. AAPG Bull. 89, 577–601. doi:10.1306/12010404078
Kong, Q., Yao, J., and Ren, J. (2024). Sources and exploration potential of Ordovician subsalt natural gas in Ordos Basin. Nat. Gas. Geosci. 35, 1187–1201. doi:10.11764/j.issn.1672-1926.2023.12.009
Li, G., Yang, X., and Geng, N. (2015). The study on oil-water relative permeability and displacement efficiency in bohai oilfield. J. Yangtze Univ. Nat. Sci. Ed. 12, 61–65+7. doi:10.16772/j.cnki.1673-1409.2015.14.012
Li, W., Tu, L., and Lu, M. (2024). Study on complex pore characteristics of carbonate reservoirs based on digital core: a case study of Feixianguan Formation in Puguang Gas Field. Fault-Block Oil and Gas Field 31, 114–122. doi:10.6056/dkyqt202401014
Li, X., and Chen, H. (2020). Deep-Water contour currents deposits of upper ordovician lashizhong Formation in western margin of Ordos Basin. Earth Sci. 45, 1266–1280. doi:10.3799/dqkx.2019.119
Li, X., Li, B., Liu, F., Li, T., and Nie, X. (2023). Advances in the application of deep learning methods to digital rock technology. Adv. Geo-Energy Res. 8, 5–18. doi:10.46690/ager.2023.04.02
Li, X., Zhang, J., and Chen, C. (2022). Fracture development characteristics and quantitative prediction of tight reservoirs in well block Ma 2, Northwestern Margin, Junggar basin. Special Oil Gas Reserv. 29, 50–56. doi:10.3799/dqkx.2021.195
Liu, C., Zhang, L., Li, Y., Liu, F., Martyushev, D. A., and Yang, Y. (2022a). Effects of microfractures on permeability in carbonate rocks based on digital core technology. Adv. Geo-Energy Res. 6, 86–90. doi:10.46690/ager.2022.01.07
Liu, H., Ban, S., Bédard, K., and Giroux, B. (2022b). Characteristics of Precambrian basement intruded by Cretaceous geological intrusions in Monteregian Igneous Province and their impacts on regional thermal structure. Adv. Geo-Energy Res. 6, 206–220. doi:10.46690/ager.2022.03.04
Liu, X., Zhang, X., and Zeng, X. (2022c). Pore structure characterization of shales using SEM and machine learning-based segmentation method. J. China Univ. Petroleum Ed. Nat. Sci. 46, 23–33. doi:10.3969/j.issn.1673-5005.2022.01.003
Lucia, F. J. (2007). Carbonate reservoir characterization: an integrated approach. Berlin: Springer.
Luo, B. (2022). The reservoir permeability prediction based on machine learning and NMR logging data. China University of Petroleum.
Luo, P., Zhang, J., and Liu, W. (2008). Characteristics of marine carbonate hydrocarbon reservoirs in China. Earth Sci. Front., 36–50.
Moore, C. H. (2007). Carbonate reservoirs: porosity evolution and diagenesis in a sequence stratigraphic framework. Amsterdam London Heidelberg: Elsevier.
Mou, C., Xu, J., and Gu, Y. (2023). Reservoir characteristics and main controlling factors of the fourth member of Ordovician Majiagou Formation in the central and eastern Ordos Basin. Petroleum Geol. Exp. 45, 780–790. doi:10.11781/sysydz202304780
Nie, X., Zou, C., and Li, Z. (2016). Numerical simulation of the electrical properties of shale gas reservoir rock based on digital core. J. Geophys. Eng. 13, 481–490. doi:10.1088/1742-2132/13/4/481
Omidpour, A., Mahboubi, A., Moussavi-Harami, R., and Rahimpour-Bonab, H. (2022). Effects of dolomitization on porosity – permeability distribution in depositional sequences and its effects on reservoir quality, a case from Asmari Formation, SW Iran. J. Petroleum Sci. Eng. 208, 109348. doi:10.1016/j.petrol.2021.109348
Qi, R., Li, G., and Zhang, J. (2024). Mechanism and significance of hydrothermal activity in the Majiagou Formation, fuxianarea, OrdosBasin. J. Palaeogeogr. 26, 632–643. doi:10.7605/gdlxb.2024.03.058
Ren, J., Shi, P., and Zhang, T. (2024). Characteristics and exploration potential of Ordovician subsalt gas-bearing system in the Ordos Basin. Nat. Gas. Geosci. 35, 435–448. doi:10.11764/j.issn.1672-1926.2023.09.022
Shao, D., Bao, H., and Wei, L. (2019). Tectonic palaeogeography evolution and sedimentary filling characteristics of the Ordovician in the Ordos area. J. Palaeogeogr. 21, 537–556. doi:10.7605/gdlxb.2019.04.035
Sheng, J., Yang, X., and Li, G. (2019). Application of multiscale X-CT imaging digital core technique on observing micro-pore structure of carbonate reservoirs. Geoscience 33, 653–661+671. doi:10.19657/j.geoscience.1000-8527.2019.03.17
Takahashi, H., and Sugiyama, T. (2019). Application of non-destructive integrated CT-XRD method to investigate alteration of cementitious materials subjected to high temperature and pure water. Constr. Build. Mater. 203, 579–588. doi:10.1016/j.conbuildmat.2019.01.128
Wang, B., Wei, L., and Yu, X. (2023). Petrophysical response characteristics of carbonate rocks with different pore structures and new reservoir prediction method: a case study of the fourth member of Ordovician Majiagou Formation in the Ordos Basin. Nat. Gas. Ind. 43, 46–58. doi:10.3787/j.issn.1000-0976.2023.03.005
Wang, S., Tan, M., Wu, H., Li, Y., Xie, G., and Zhang, L. (2022). A digital rock physics-based multiscale multicomponent model construction of hot-dry rocks and microscopic analysis of acoustic properties under high-temperature conditions. SPE J. 27, 3119–3135. doi:10.2118/209785-pa
Wei, X., Chen, H., Zhang, D., Dai, R., Guo, Y., Chen, J., et al. (2017). Gas exploration potential of tight carbonate reservoirs: a case study of Ordovician Majiagou Formation in the eastern Yi-Shan slope, Ordos Basin, NW China. Petroleum Explor. Dev. 44, 347–357. doi:10.1016/s1876-3804(17)30041-1
Weyl, P. K. (1960). Porosity through dolomitization--Conservation-of-mass requirements. J. Sediment. Res. 30, 85–90. doi:10.1306/74D709CF-2B21-11D7-8648000102C1865D
Wu, J., Chen, X., Yang, Y., Zhi, Q., Wang, X., Zhang, J., et al. (2021). Application of TEM based on HTS SQUID magnetometer in deep geological structure exploration in the baiyun gold deposit, NE China. J. Earth Sci. 32, 1–7. doi:10.1007/s12583-020-1086-3
Yu, Z., Luo, X., and Zhou, J. (2024). Development characteristics and genetic mechanisms of high-quality dolomite reservoirs in the 4th member of ordovician Majiagou Formation in the Ordos Basin. Nat. Gas. Ind. 44, 30–39. doi:10.3787/j.issn.1000-0976.2024.02.004
Zhang, X., Liu, B., and Cai, Z. (2010). Dolomitization and carbonate reservoir formation. Geol. Sci. Technol. Inf. 29, 79–85.
Zhao, J., Chen, H., and Li, N. (2020). Research advance of petrophysical application based on digital core technology. Prog. Geophys. 35, 1099–1108. doi:10.6038/pg2020DD0486
Keywords: tight carbonate rocks, digital core technology, multi-scale characterization, pore structure, Ordos Basin
Citation: Wang C, Tian L, Sun C, Deng Y, Zhou Y and Nie X (2025) Multi-scale characterization of tight carbonate rocks based on digital cores. Front. Earth Sci. 13:1538316. doi: 10.3389/feart.2025.1538316
Received: 02 December 2024; Accepted: 09 January 2025;
Published: 28 January 2025.
Edited by:
Xin Sun, Sinopec Matrix Co., LTD., ChinaReviewed by:
Luanxiao Zhao, Tongji University, ChinaLiang Xiao, China University of Geosciences, China
Copyright © 2025 Wang, Tian, Sun, Deng, Zhou and Nie. This is an open-access article distributed under the terms of the Creative Commons Attribution License (CC BY). The use, distribution or reproduction in other forums is permitted, provided the original author(s) and the copyright owner(s) are credited and that the original publication in this journal is cited, in accordance with accepted academic practice. No use, distribution or reproduction is permitted which does not comply with these terms.
*Correspondence: Ying Zhou, WmZnMTg3MTFAMTYzLmNvbQ==; Xin Nie, bmlleGluX2N1Z2JAMTI2LmNvbQ==