 Jinhai Yang1†
 Lei Wen
 Yun Wang
 Meihong Ma
94% of researchers rate our articles as excellent or good
Learn more about the work of our research integrity team to safeguard the quality of each article we publish.
Find out more
ORIGINAL RESEARCH article
Front. Earth Sci., 11 February 2025
Sec. Geohazards and Georisks
Volume 13 - 2025 | https://doi.org/10.3389/feart.2025.1538235
This article is part of the Research TopicMonitoring, Early Warning and Mitigation of Natural and Engineered Slopes – Volume IVView all 30 articles
Flood forecasting is crucial for disaster mitigation, particularly in regions prone to flash floods. This study introduces a novel flood forecasting framework by coupling the Geomorphological Instantaneous Unit Hydrograph (GIUH) with the Xinanjiang model and optimizing parameters using the Cooperation Search Algorithm (CSA). Applied across six diverse Chinese catchments, the framework significantly improved computational efficiency and accuracy. Key findings demonstrate that: 1) CSA achieved high Nash-Sutcliffe Efficiency (NSE >0.9) with only 16 optimization trials on average, outperforming the SCE-UA algorithms; 2) The model performed exceptionally in data-sparse regions, achieving NSE values >0.9 even with minimal datasets; and 3) Enhanced runoff routing via GIUH enabled accurate simulation of extreme rainfall events. These results highlight the framework’s potential for operational flood forecasting and disaster management globally. Future research will expand validation datasets and explore applications across varied hydrological and climatic conditions.
Flood forecasting plays a crucial role in water resource management and disaster risk reduction, particularly in catchments prone to flash floods. These catchments, characterized by steep terrain and rapid hydrological responses, are highly sensitive to intense rainfall events, making them vulnerable to severe flooding (Ragettli et al., 2017, Qiu et al., 2024). Accurate and efficient flood forecasting models are essential for mitigating the impacts of such events. However, achieving reliable simulations is challenging due to the variability in hydrological conditions and the scarcity of observational data in many regions (Addor et al., 2017; Singh et al., 2014). Accurate and efficient flood forecasting systems are critical for mitigating these impacts.
Flood forecasting frameworks now integrate hydrological models, data analytics, and machine learning to provide accurate predictions and timely warnings for flood mitigation. The literature on this topic spans a range of methodologies, from traditional hydrodynamic models to cutting-edge artificial intelligence and geospatial data analysis (Wei et al., 2024). Rostami et al. (2024) introduced a framework using data from VIIRS water fractions to improve flood predictions, focusing on dynamic inundation models for flood-prone regions. Zhou (2024) demonstrated the application of big data and deep learning in hydrological modeling, leading to improved accuracy in flood prediction systems. Chen et al. (2024) explored Bayesian models for analyzing spatial extremes, which are critical for understanding flood risks in varied geographical settings. Belcore et al. (2024) applied geoinformatics within early warning systems, enhancing flood resilience in regions like the Sahel. Lo et al. (2024) investigated combining conformer models with rainfall-runoff simulations to increase the reliability of hydrological forecasts. Porter et al. (2024) emphasized the importance of future population and socioeconomic scenarios in assessing flood exposure under varying conditions. Duraisekaran et al. (2024) implemented a framework that combines simulation and optimization for effective flood management, particularly in conservation reservoirs. Chang et al. (2025) proposed a multi-step correction framework to refine runoff forecasts using ensemble methods. Feng et al. (2025) showcased a framework that leverages digital twin technology for real-time flood forecasting and resource management. Flood forecasting frameworks are transitioning toward data-centric and AI-driven approaches, integrating geospatial and probabilistic models for enhanced accuracy. These frameworks are critical for disaster preparedness and risk mitigation, particularly in the face of climate change.
Traditional flood forecasting models (Zhu et al., 2024; Feng et al., 2025), such as hydrodynamic and statistical methods, have been widely applied. However, their effectiveness is often limited by high computational demands, inadequate representation of hydrological processes, and challenges in calibrating parameters under data-scarce conditions (Singh et al., 2014). These limitations underscore the necessity of developing innovative frameworks that integrate physical realism, computational efficiency, and adaptability to varying hydrological scenarios.
Recent advancements in hydrological modeling and optimization techniques offer new opportunities to address these challenges. Metaheuristic algorithms, such as the Cooperation Search Algorithm (CSA), have emerged as powerful tools for efficient parameter optimization. Unlike traditional methods such as the Shuffled Complex Evolution University of Arizona (SCE-UA) algorithm, CSA leverages collaborative behavior to explore complex solution spaces and achieve faster convergence (Feng et al., 2021). Meanwhile, integrating geomorphological insights through the Geomorphological Instantaneous Unit Hydrograph (GIUH) enhances the physical representation of runoff processes, particularly in ungauged or data-scarce catchments (Moussa, 2008).
This study bridges these advancements by coupling GIUH with the Xinanjiang model (Zhao and Wang, 1988), a widely used hydrological model that accounts for soil moisture dynamics, and optimizing its parameters using CSA. The proposed framework is applied to six representative catchments across China, encompassing diverse climatic and hydrological conditions. The objectives of this research are: 1) to evaluate the efficiency and accuracy of CSA compared to SCE-UA for parameter optimization; 2) to assess the performance of the GIUH-enhanced Xinanjiang model in data-scarce and data-rich catchments; and 3) to contribute to the development of a robust and scalable flood forecasting framework that addresses the challenges of varying data availability. By addressing these objectives, this study advances the field of flood forecasting by offering a computationally efficient and adaptable framework with significant potential for disaster preparedness and water resource management.
Six representative catchments are in Six different Chinese provinces (Figure 1): Anhui, Fujian, Hainan, Henan, Hunan and Jiangxi, and each catchment has different weather, soil types and vegetation. All study catchments have in common that winters are dry and flash floods occur after intensive summer rainstorms. Catchment areas range between 105.3 and 722.0 km2 (Table 1), and the average area of catchments is 272.3 km2. Meteorological data are available from 37 rain gauges located within or in the close vicinity of the 6 catchments provided by the China Meteorological Data Service Center (http://data.cma.cn.). Data from rain gauges and hydrological stations are available only for the summer storm events, which includes hourly rainfall and hourly observed discharge data (provided by China Institute of Water Resources and Hydropower Research). The county weather stations provide the information about daily rainfall amounts outside of the storm events and daily air temperature data.
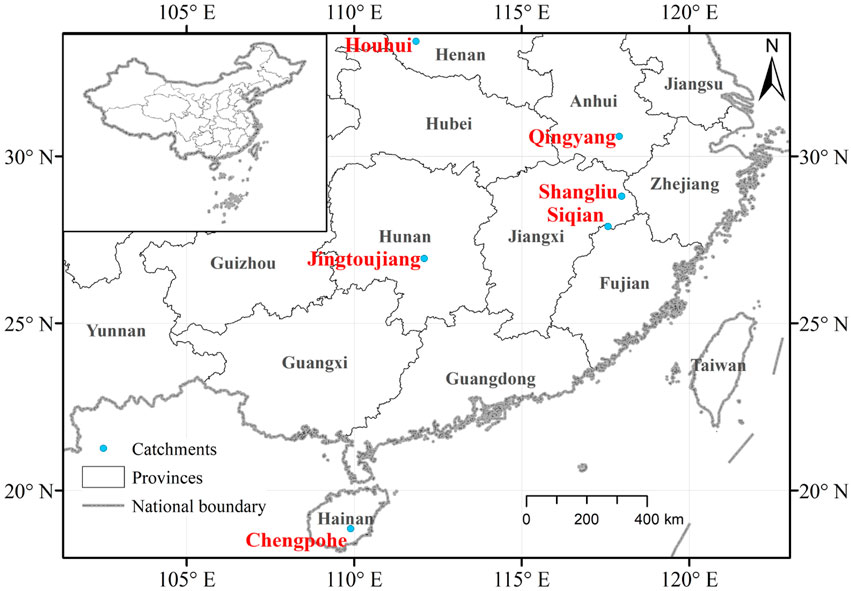
Figure 1. Map of study area showing the position of six catchments.
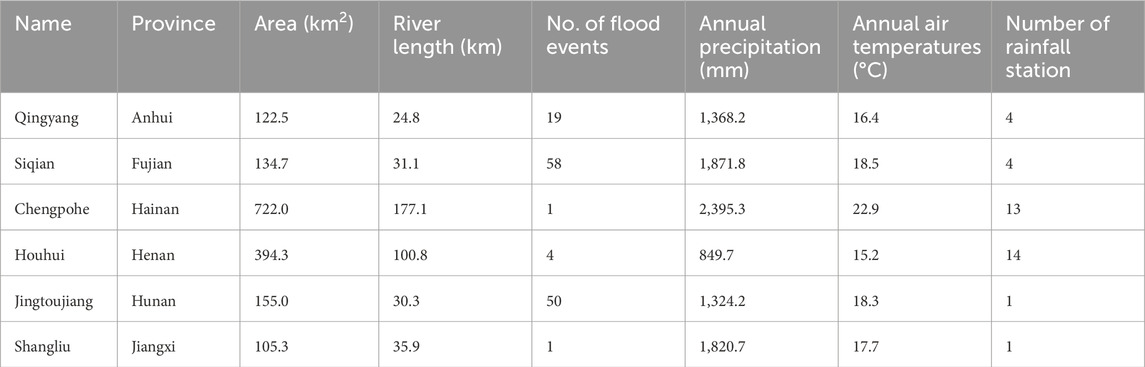
Table 1. Summary of study catchments.
The attributes have been selected for their potential to affect catchment hydrology (e.g., Addor et al., 2017; Berghuijs et al., 2014; Singh et al., 2014) and are available for whole China. The attributes are extracted from the following data sets.
Topographical attributes such as altitude, aspect or slope are extracted from digital elevation model (DEM) data, and the resolution of the DEM is 30 m, which was provided by the Geospatial Data Cloud site, the Computer Network Information Center, and the Chinese Academy of Sciences (http://www.gscloud.cn).
Information about soil is provided by the Soil and Terrain database (SOTER) for China, version 1.0, at scale 1:1 million, compiled by the Institute of Soil Science, Chinese Academy of Science (ISSAS) and ISRIC-World Soil Information (Dijkshoorn et al., 2008). The soil texture was resampled to 30 m with the same resolution as DEM in this study.
Landuse and vegetation information is provided by the 2009 Global Land Cover Map (GlobCover) (Bontemps et al., 2011). The land cover map has a resolution of 300 m. For this study, it was resampled to 30 m with the same resolution as DEM.
This study adopts a systematic approach to develop and validate a novel flood forecasting framework by integrating hydrological modeling with advanced optimization techniques. The flood forecasting framework comprising two main components (Figure 2): 1) Hydrological Model Development: The Xinanjiang model is enhanced with the Geomorphological Instantaneous Unit Hydrograph (GIUH) to improve runoff routing accuracy. This integration aims to account for geomorphological characteristics derived from Digital Elevation Models (DEMs), providing a robust representation of the hydrological processes in diverse catchments. 2) Parameter Optimization: The Cooperation Search Algorithm (CSA) is applied for efficient parameter optimization. CSA’s collaborative and population-based mechanism ensures fast convergence to optimal solutions, addressing challenges like data scarcity and model complexity. We compared the performance of CSA with the Shuffled Complex Evolution University of Arizona (SCE-UA) algorithm to highlight its advantages.
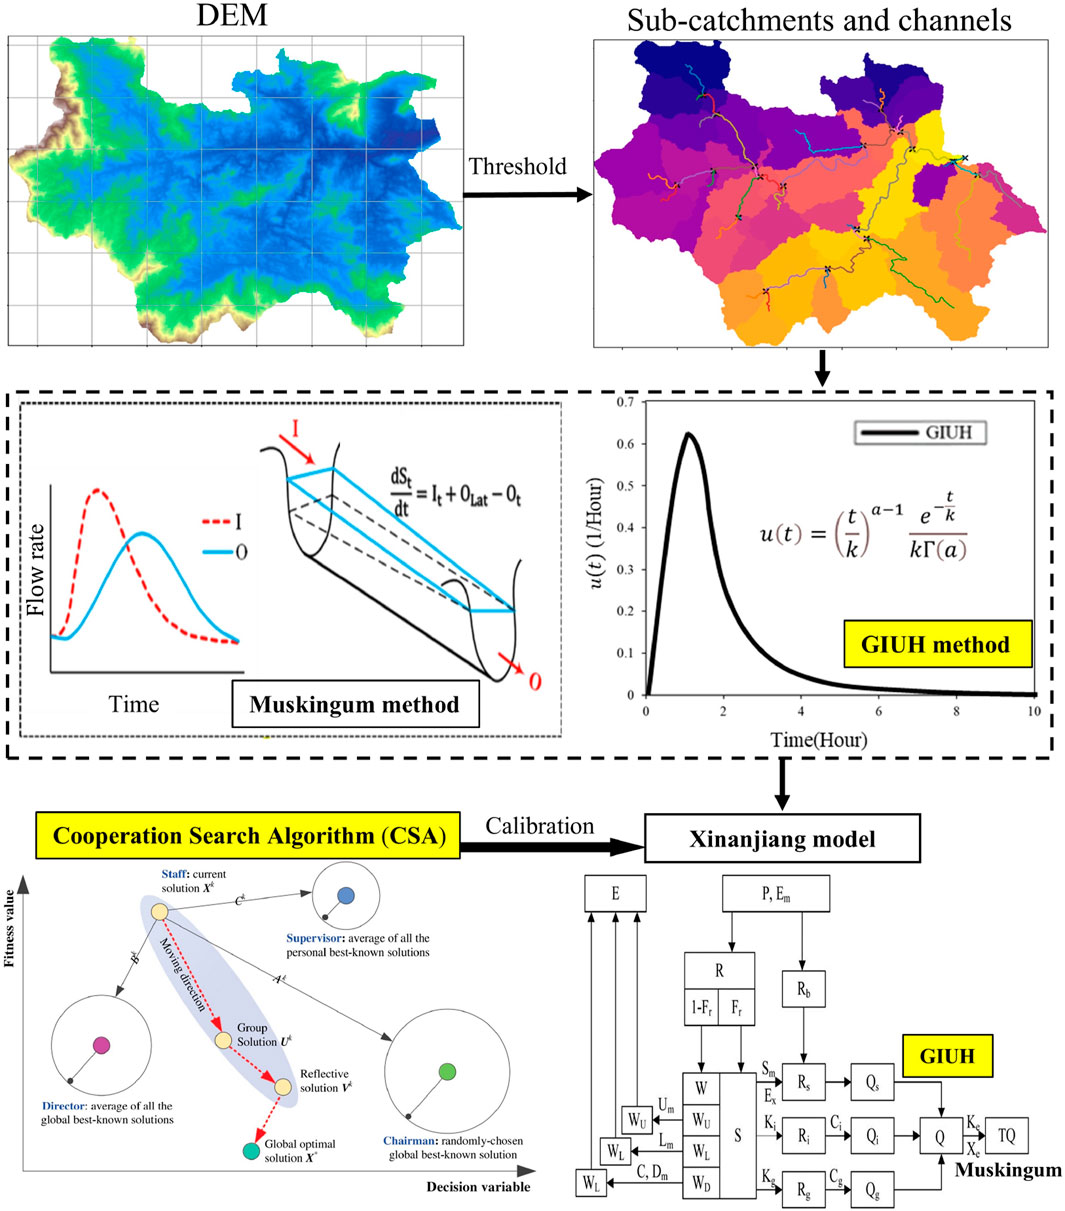
Figure 2. Flowchart of the cooperative search algorithm-based Flood Forecasting Framework.
The Xinanjiang model was developed to forecast flows to the Xinanjiang reservoir by Zhao and Wang (1988). The main hypothesis used in the model development is the concept of runoff formation on repletion of storage. The original Xinanjiang model includes a runoff generating component and a runoff routing component. It has 6 parameters that include seven runoff generating component parameters (
The geomorphological instantaneous unit hydrograph (GIUH, Bamufleh et al., 2020; Lei et al., 2023) is used for the routing of runoff from the overland flow plane to the river channel. GIUH based on Nash model, the equation for GIUH, which is a function of Horton ratios, is given by gamma distribution as (Nash, 1960). The formula for calculating this parameter is given in Equation 1:
Where
This paper applies two parameter optimization algorithms, shuffled complex evolution of the University of Arizona (Duan et al., 1994) and Cooperation Search Algorithm (CSA, Feng et al., 2021), for the hydrological model parameter optimization, and compares the efficiency of the two optimization algorithms. SCE-UA algorithm, as a global search algorithm, was compared against the multi-start simplex (MSX) method and the adaptive random search (ARS) method on watershed model calibration problems (Duan et al., 1994). The results showed that SCE-UA was a much superior method than MSX and ARS method. The SCE-UA has been widely used in various watershed model calibrations (Sorooshian et al., 1993; Duan et al., 1994; Luce and Cundy, 1994; Gan and Biftu, 1996; Yapo et al., 1996; Cooper et al., 1997; Kuczera, 1997; Franchini et al., 1998; Abdulla et al., 1999; Thyer et al., 1999; Eckhardt and Arnold, 2001). Recently, the SCE-UA has also been applied with success to Soil and Water Assessment Tool (SWAT) for hydrologic parameters (Eckhardt and Arnold, 2001) and hydrologic and water quality parameters (van Griensven and Bauwens, 2003). Cooper et al. (2007) applied the global optimization SCE-UA method with the established hydrologic process-based constraints to calibrate the Tank Model. It is found that performances of the SCE and GA are better than simulated annealing. More recently, the SCE, simple genetic algorithm (SGA) and micro-genetic algorithm (μGA), are applied in the parameter calibration of a grid-based distributed rainfall-runoff model (GBDM) and their performances are compared (Wang et al., 2010). Goswami and O’Connor (2007) applied SCE-UA to calibrate SMAR model parameters. These studies demonstrate that the SCE-UA method is a robust, effective and efficient search algorithm.
The Cooperation Search Algorithm (CSA) is a novel metaheuristic optimization algorithm proposed by Feng et al. (2021). This algorithm is inspired by the collaborative behavior of modern corporate teams and is characterized by strong optimization ability and fast convergence. The objective function Nash-Sutcliffe efficiency (NSE) was used for parameter calibration. The CSA primarily consists of four stages: Team building phase, Team communication operator, Reflective learning operator, and Internal competition operator.
In this stage, all the staff members in the team are randomly assigned according to Equation 2. After evaluating the performance of all the solutions,
where
Each staff member can gain new information by exchanging knowledge with the chairman, as well as with the board of directors and supervisors. As shown in Equation 3, the team communication process involves three components: the chairman’s knowledge
where
Aside from learning from the leader’s solutions, the staff can also gain new knowledge by reflecting on their own experiences in the opposite direction, which can be expressed as follows:
where
The team gradually enhances its market competitiveness by ensuring that all staff members with better performance are consistently retained, which can be expressed as follows:
where
where
The pseudo-code of the CSA method is given as below:
Via the above carefully-designed operators, the CSA method in Figure 3 can effectively improve the quality of all the obtained solutions to approximate the global optima. Next, the traits of the CSA method are summarized as below.
1) Compared with individual-based methods, the population-based evolutionary mechanism used in CSA generates multiple solutions within the search space, which helps identify promising regions and escape from local optima.
2) The swarm achieves a balance between global exploitation and local exploration through the team communication and reflective learning operators, which increases the likelihood of approximating the global optimal solution.
3) With the internal competition operator, the best solutions discovered so far are stored and dynamically updated during the evolutionary process, which effectively ensures the global convergence of the population.
4) The optimization problem is treated as a black box, where the output depends only on specific inputs. As a result, the CSA method can theoretically be applied to any optimization problem. This allows the operator to focus on the modeling process rather than the development of the optimization algorithm, thereby improving work efficiency.
5) In CSA, the original large swarm can be naturally divided into several small but independent subpopulations, which can be processed on multiple different computing units. In other words, developing a parallel version of CSA to improve execution time and solution quality in high-performance computing environments is straightforward.
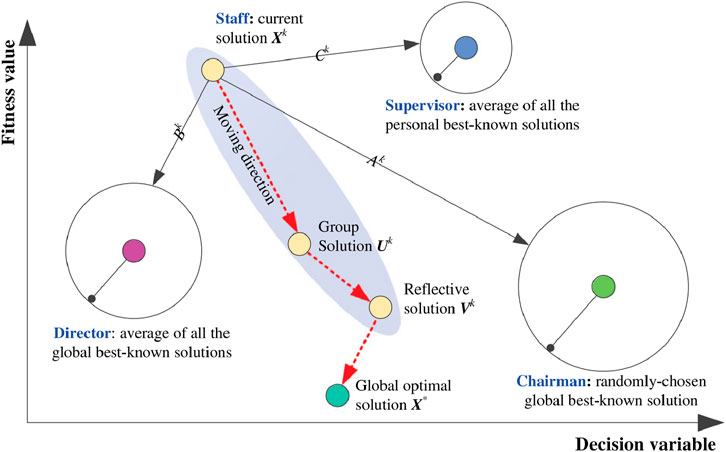
Figure 3. Sketch map of the CSA method.
The evaluation of the model’s performance focuses on two key aspects.
The model’s ability to reproduce streamflow dynamics at the event scale is assessed using the Nash-Sutcliffe Efficiency (NSE; Nash and Sutcliffe, 1970; Table 2) metric. This statistic evaluates how well the simulated streamflow matches observed data, providing an overall measure of model accuracy.

Table 2. List of statistical metricsa.
The model’s capability to accurately simulate critical flood characteristics, such as peak flow and peak timing, is evaluated using the Absolute Peak Flood Error (EQP, Table 2). These metrics are essential for effective flood warning and disaster management.
The evaluation of the model performance aimed to (1) assess the capacity of the model to reproduce an overall streamflow fit at the event scale and (2) evaluate its ability to accurately identify streamflow extremes, i.e., the peak flow and the peak time, which are important for flood warning. The Nash-Sutcliffe efficiency (NSE; Nash and Sutcliffe, 1970) metric is used to assess the overall streamflow fit, and the absolute peak flood error (EQP) is used to evaluate the performance of peak flow (Table 2).
Using the same initial parameter values and parameter optimization range (Table 3), the CSA and SCE-UA algorithms were applied separately to calibrate the parameters for the six catchments. Due to a little flood event in the Chengpohe, Houhui, and Shangliu catchments, only parameter calibration was performed for these three catchments. The calibration periods for the Qingyang, Siqian, and Jingtoujiang catchments are 1995–1997, 1971–1976, and 1994–1998, respectively. The validation periods are 1997–2013, 1971–1992, and 1998–2004, respectively. The resulting number of optimization trials and the optimal NSE values are shown in Figure 4. The results show that CSA required an average of 16 trials, compared to 2056 for SCE-UA, making it over 100 times more efficient while achieving higher NSE values.
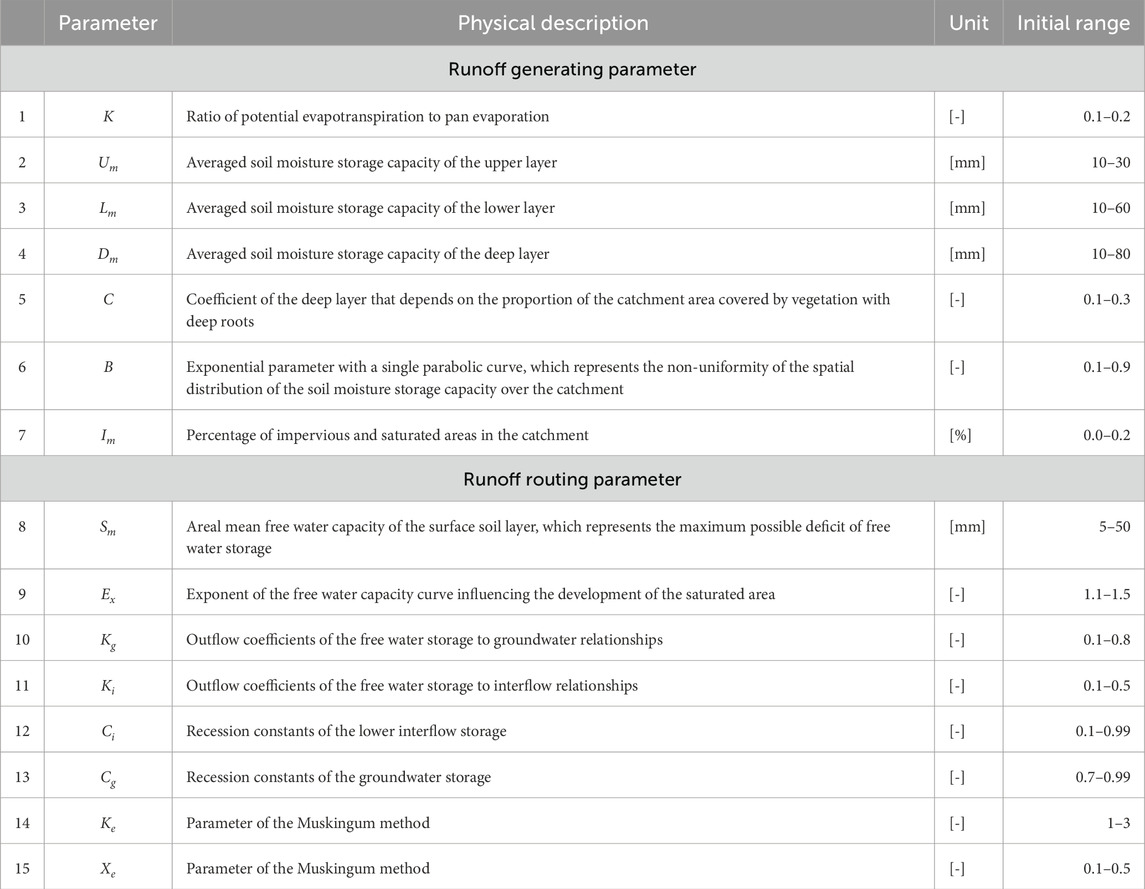
Table 3. Parameters to be calibrated.
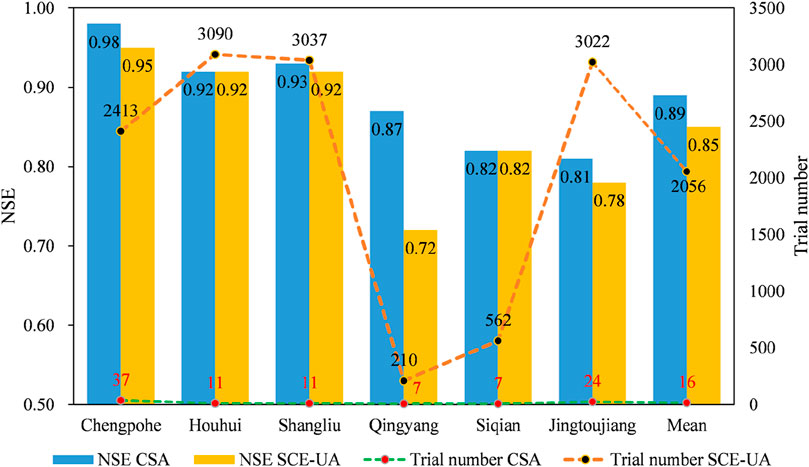
Figure 4. The parameter optimization trial number and objective function (NSE) graph of the CSA and SCE-UA algorithms.
Figure 5 shows the convergence process of the CSA during parameter optimization of the Xinanjiang model for various river catchments. The vertical axis represents the objective function (Nash-Sutcliffe Efficiency, or NSE), which is a measure of model performance. Higher NSE values indicate better model accuracy in simulating the observed data. The horizontal axis represents the trial number, which corresponds to the iteration count in the optimization process.
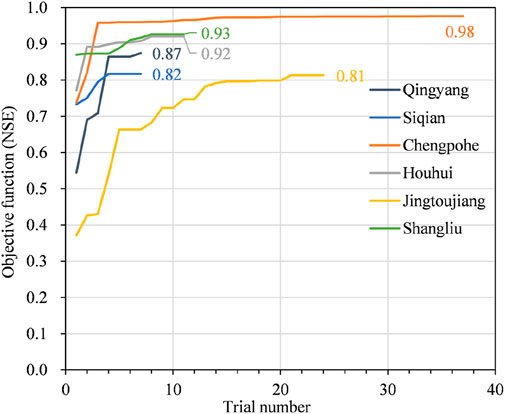
Figure 5. The parameter optimization trial number and objective function (NSE) the CSA algorithms.
Each line in the plot represents a different river catchment (Qingyang, Siqian, Chengpohe, Houhui, Jingtoujiang, and Shangliu), and the progress of each line shows how the NSE value improves with each iteration. The results showed that: chengpohe Catchment (orange line): the CSA algorithm achieves rapid convergence for Chengpohe, reaching a high NSE value of 0.98 in the first few iterations and maintaining this performance, indicating effective optimization. Shangliu Catchment (green line): the optimization process for Shangliu also shows fast convergence, reaching an NSE of 0.93 after about 10 iterations. Houhui Catchment (gray line): Houhui reaches an NSE of 0.92 after around 10 iterations, with a stable performance afterward. Siqian Catchment (blue line): Siqian’s optimization curve shows slower convergence compared to the catchments above but achieves an NSE of 0.82 within 5 iterations. Qingyang Catchment (dark blue line): Qingyang reaches an NSE of 0.87 after around 5 iterations, showing gradual improvement. Jingtoujiang Catchment (yellow line): This catchment shows the slowest convergence, gradually increasing to an NSE of 0.81 over 20 iterations. In summary, the CSA algorithm effectively converges to high NSE values for most catchments within a reasonable number of iterations, particularly for the Chengpohe, Shangliu, and Houhui catchments, which achieved NSE values above 0.9.
The rapid convergence of CSA is evident from the optimization curves shown in Figure 4, where most catchments reached high NSE values within a few iterations. For instance, the Chengpohe catchment attained an NSE of 0.98 within 37 trials, whereas SCE-UA required 2,413 trials to achieve a slightly lower NSE of 0.95. This efficiency highlights the advantages of CSA’s population-based evolutionary mechanism, which balances global exploration and local exploitation to approximate optimal solutions effectively.
Table 4 shows the calibrated parameters of the Xinanjiang model, optimized using the CSA for the various catchments. Each row represents a different parameter of the model, and the columns show the values of these parameters for different catchments. The values in Table 4 show that each parameter varies across catchments, which indicates that each catchment has unique hydrological characteristics that were captured during the optimization process by CSA.
Table 4. Calibrated parameters of Xinanjiang model with CSA.
The Chengpohe, Houhui, and Shangliu catchments were calibrated using the CSA optimization method; however, their flood event records were insufficient to conduct a robust validation analysis. Despite this limitation, the model’s calibration results in these catchments demonstrated exceptional performance, as reflected by the Nash-Sutcliffe Efficiency (NSE) values (Table 5). For Chengpohe, the NSE reached 0.98, indicating that the CSA achieved near-perfect alignment between the observed and simulated streamflows. Similarly, the Houhui and Shangliu catchments exhibited NSE values of 0.92 and 0.93, respectively, underscoring the algorithm’s ability to optimize the Xinanjiang model parameters effectively.
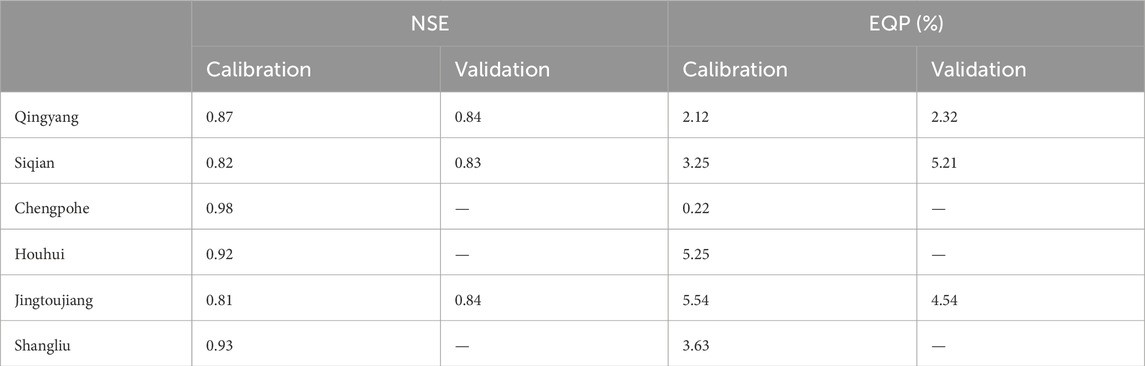
Table 5. Statistical metrics of six catchments.
The flow hydrographs (Figure 6) illustrate the CSA’s capability to closely capture the temporal dynamics of streamflow during calibration. The simulated discharge in these catchments aligns well with the observed data, particularly in reproducing the peak flows and timing, which are critical for flood forecasting. The Chengpohe catchment, in particular, showcased the model’s efficiency in simulating high-intensity flood events with a limited dataset. However, the lack of validation data in these catchments poses challenges for assessing the model’s generalizability. It remains uncertain whether the parameters optimized using CSA would perform consistently under different climatic or hydrological conditions. This underscores the need for additional flood event records to validate the robustness and reliability of the CSA-optimized parameters. Future efforts should focus on expanding the dataset for these catchments to validate the model’s robustness. Incorporating regional hydrological characteristics through parameter transfer techniques may also enhance model reliability in data-scarce regions.
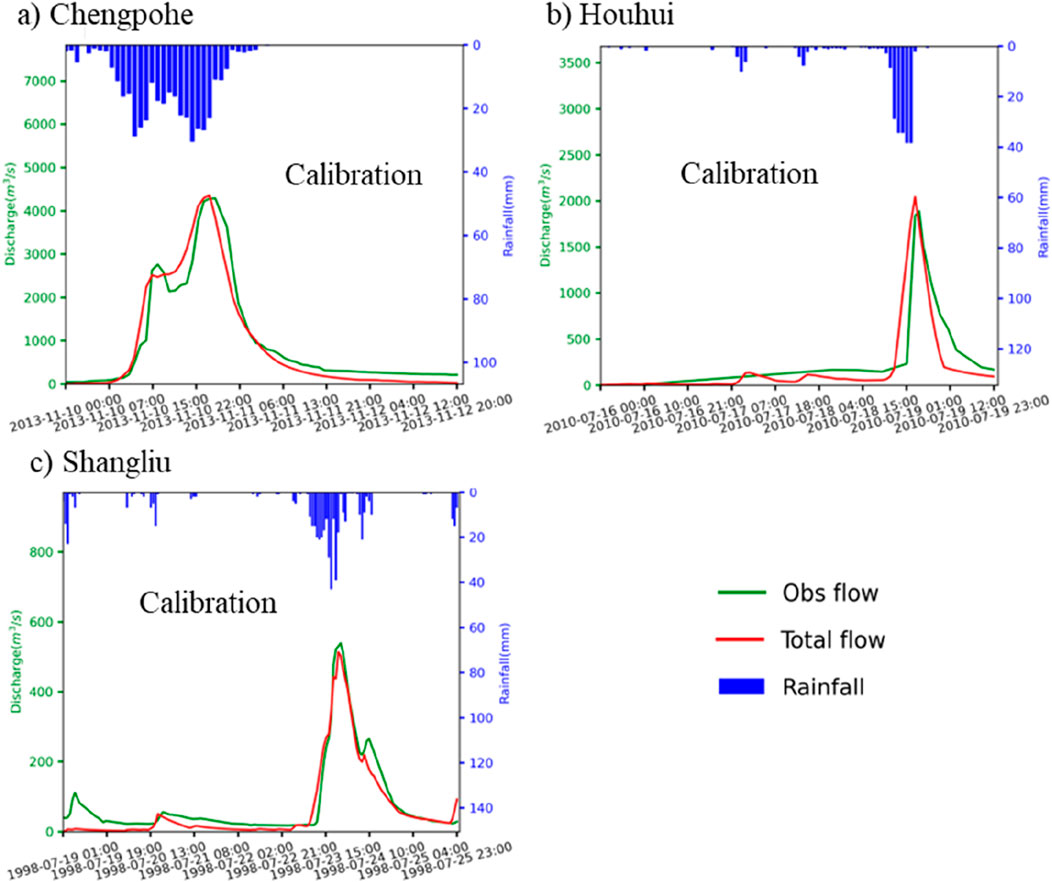
Figure 6. Flow hydrographs simulated by the flood forecasting framework for the three data-scare catchments (Obs flow: observed discharge; Total flow: simulated discharge; Rainfall: observed rainfall). (A) Chengpohe. (B) Houhui. (C) Shangliu.
In contrast, the Qingyang, Siqian, and Jingtoujiang catchments provided extensive datasets, allowing for both calibration and validation. The CSA-optimized parameters performed well, with NSE values of 0.87, 0.82, and 0.81 during calibration, and 0.84, 0.83, and 0.84 during validation (Table 5). Figure 7 demonstrates that the Xinanjiang model, calibrated using the CSA, simulates the flow hydrographs with a high degree of accuracy in these catchments. The model’s ability to replicate the observed discharge, particularly during critical high-flow events, is evident, showcasing the CSA’s effectiveness in parameter optimization.
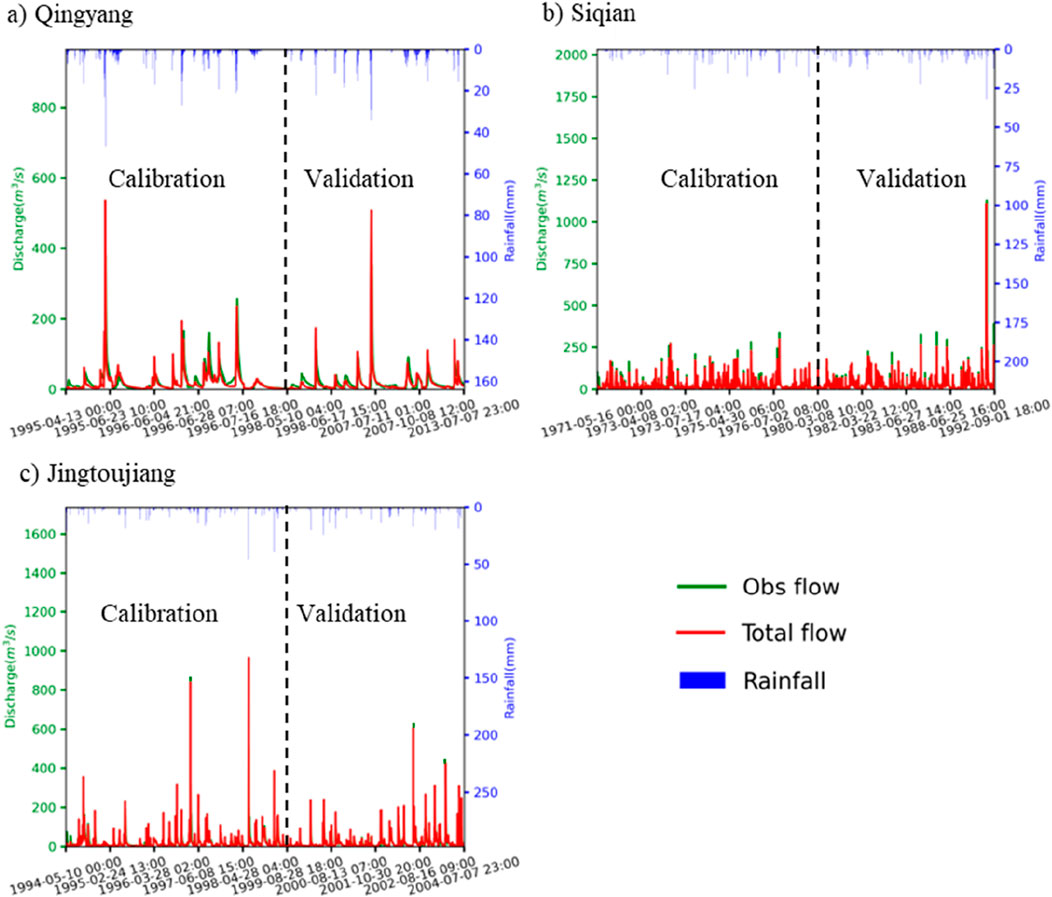
Figure 7. Flow hydrographs calibrated and validated by the flood forecasting framework for the three data-rich catchments (Obs flow: observed discharge; Total flow: simulated discharge; Rainfall: observed rainfall). (A) Qingyang. (B) Siqian. (C) Jingtoujiang.
The peak flow comparison in Figure 8 for the calibration period reveals that the model’s predictions are in close agreement with the observed peak flows, indicating a strong capability to capture the extreme hydrological events. This is further supported by the flow process comparison in the calibration period, where the model’s simulated hydrograph closely follows the observed hydrograph, suggesting a reliable representation of the catchment’s response to rainfall.
Figure 8. Comparison chart of observed and simulated peak flow. (A) Qingyang. (B) Siqian. (C) Jingtoujiang.
The Qingyang catchment exhibited consistent performance across calibration and validation, with low Absolute Peak Flood Error (EQP) values of 2.12% and 2.32%, respectively (Table 5). This indicates reliable predictions of both magnitude and timing of peak flows. In the Siqian catchment, while the model performed well during calibration, it slightly underestimated extreme peak flows during validation, as shown in Figure 8. This discrepancy may reflect the catchment’s complex hydrological response to extreme rainfall events.
The validation of the model’s performance in these catchments is further reinforced by the statistical metrics provided in Table 2. The Nash-Sutcliffe Efficiency (NSE) values, as mentioned in this paper, are relatively high for these catchments, indicating a good overall streamflow fit. The Absolute Peak Flood Error (EQP) values are also within acceptable limits, demonstrating the model’s accuracy in predicting peak flows, which is essential for flood warning systems.
The CSA-optimized flood forecasting framework demonstrated strong performance across all six catchments, achieving high NSE values and accurately capturing peak flows and timings. Notably, the framework excelled in data-scarce catchments, where traditional models often struggle due to limited historical data. For example, in the Chengpohe catchment, CSA achieved an NSE of 0.98 with only 37 optimization trials, significantly outperforming the SCE-UA algorithm, which required 2,413 trials to reach an NSE of 0.95.
This efficiency can be attributed to CSA’s population-based evolutionary mechanism, which effectively balances global exploration and local exploitation. By retaining elite solutions through its internal competition operator, CSA converges quickly while avoiding local optima. These characteristics make CSA particularly suitable for resource-constrained settings or time-sensitive applications like real-time flood forecasting.
However, the absence of validation datasets in data-scarce catchments such as Chengpohe, Houhui, and Shangliu limits the assessment of model generalizability. While the calibration results are promising, the lack of independent validation data poses challenges for assessing the robustness of the CSA-optimized parameters under different hydrological conditions.
Overall, the application of CSA to the flood forecasting framework significantly improved parameter optimization efficiency and simulation accuracy, particularly in the catchments with adequate calibration data. The CSA’s rapid convergence to optimal parameter values (average trial number of 16 compared to 2056 for SCE-UA, Figure 4) is a key advantage, especially for catchments with complex hydrological characteristics like Chengpohe. The high NSE values achieved during calibration demonstrate the algorithm’s effectiveness in fine-tuning model parameters to match observed stream flows.
However, the validation results underscore the importance of a comprehensive dataset for model calibration and testing. The limited flood events in Chengpohe, Houhui, and Shangliu restrict the ability to fully evaluate the model’s predictive capabilities (Figure 9). Figure 9B) showed that the correlation coefficient (R2) between observed and simulated flow in the Houhui watershed is 0.54. Although the peak flow fits well, the overall flood process simulation is less accurate. While the validation results in Qingyang, Siqian, and Jingtoujiang suggest some sensitivity to varying hydrological conditions. This highlights the necessity of robust validation datasets and potentially the inclusion of regionalization techniques to enhance model performance in data-scarce catchments.
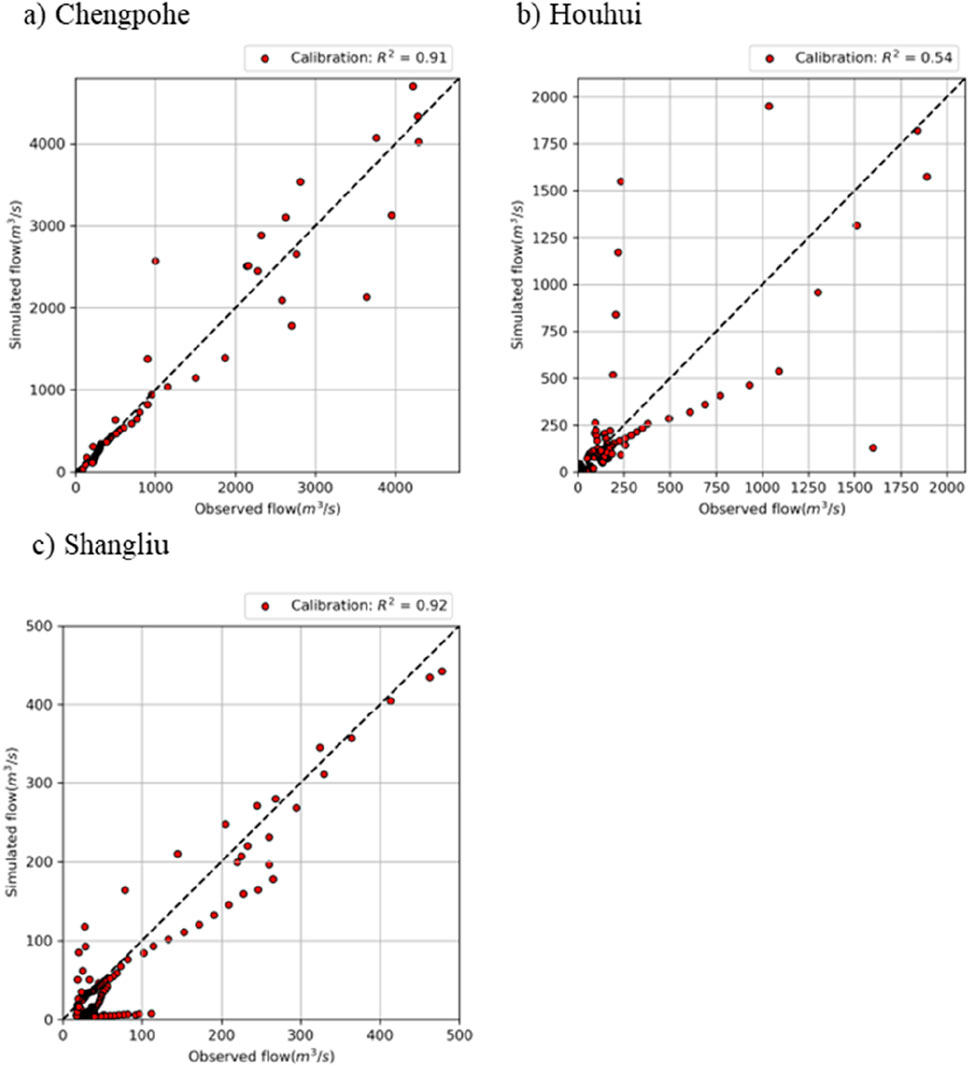
Figure 9. Comparison chart of observed and simulated flow process. (A) Chengpohe. (B) Houhui. (C) Shangliu.
The CSA-optimized flood forecasting framework holds significant promise for improving flood forecasting capabilities in diverse catchments. Its ability to capture peak flows and timing is particularly valuable for flash flood warning systems. Future research should focus on extending the dataset for validation, integrating additional hydrological insights into the CSA framework, and exploring the model’s applicability to other catchment types under varying climatic conditions.
Moreover, the ability to accurately predict peak flows and timing, as demonstrated in this study, makes the model well-suited for flash flood forecasting, where rapid responses are required. The framework’s applicability to diverse climatic and hydrological conditions further enhances its potential as a global tool for flood management and early warning systems.
However, while the CSA-optimized model has shown promising results, its performance under real-time conditions should be further tested. Implementing the model in real-world flood forecasting systems would require continuous data assimilation and real-time calibration to ensure that the model adapts to rapidly changing conditions. Future research should focus on integrating the model with real-time data sources, such as satellite-based rainfall estimates and streamflow observations, to evaluate its performance in dynamic, operational settings.
While the results demonstrate the robustness and efficiency of the CSA-optimized framework, several limitations must be addressed.
The accuracy of GIUH relies heavily on the resolution and quality of DEM data. In regions with low-resolution DEMs, the model’s ability to simulate geomorphological processes may be compromised. Future research should explore the integration of satellite-based topographical data or machine learning techniques to enhance DEM quality and applicability.
The absence of extensive flood event records in data-scarce catchments restricts the ability to fully validate the model’s performance under diverse conditions. Expanding validation datasets through collaborative efforts or by employing parameter regionalization techniques can help address this limitation.
Although the framework demonstrates strong performance, its real-time application requires integration with dynamic data sources such as satellite rainfall estimates or streamflow sensors. This would allow for continuous data assimilation and adaptive calibration, ensuring accurate predictions during rapidly changing flood conditions.
Testing the model across catchments with varied climatic and hydrological conditions will provide deeper insights into its scalability and robustness. For example, applying the framework to arid or snow-dominated regions may uncover additional parameter adjustments or methodological improvements. This will help assess the robustness and generalizability of the model, ensuring its applicability in diverse real-world flood forecasting scenarios. The integration of more advanced techniques, such as hybrid modeling or machine learning, could further enhance the model’s predictive capabilities and adaptability.
This study successfully integrates the Geomorphological Instantaneous Unit Hydrograph (GIUH) with the Xinanjiang model, optimized by the Cooperation Search Algorithm (CSA), to develop an efficient and robust flood forecasting framework. Key findings include.
The CSA significantly outperforms the Shuffled Complex Evolution University of Arizona (SCE-UA) algorithm, achieving higher Nash-Sutcliffe Efficiency (NSE) values with far fewer optimization trials (an average of 16 trials for CSA compared to 2056 for SCE-UA). This substantial improvement in computational efficiency makes CSA an ideal choice for resource-constrained regions.
In catchments with limited flood event data, such as Chengpohe, Houhui, and Shangliu, the CSA-optimized model demonstrated exceptional performance, with NSE values exceeding 0.9. This highlights CSA’s robustness in data-scarce settings and its potential to provide accurate flood forecasting even in regions with sparse hydrological data.
The model also showed strong performance in data-rich catchments (e.g., Qingyang, Siqian, and Jingtoujiang), accurately simulating both streamflow dynamics and peak flows during calibration and validation. The low Absolute Peak Flood Error (EQP) values confirmed the model’s ability to predict flood peaks and timings reliably.
Integrating GIUH improved the model’s ability to capture streamflow dynamics during extreme rainfall, showcasing the value of combining conceptual and geomorphological approaches.
The CSA-optimized model offers a computationally efficient and scalable tool for operational flood forecasting, with particular relevance to flash flood prediction. Its ability to simulate critical flood characteristics, such as peak flow and peak timing, makes it highly applicable for early warning systems in flood-prone regions. Moreover, the model’s adaptability to different hydrological and climatic conditions suggests its potential for global use in flood risk management and disaster preparedness.
Expanding datasets, refining optimization constraints, and testing across diverse climates and hydrological models are recommended to further enhance its robustness.
This study demonstrates the CSA-optimized framework’s effectiveness, but further research is needed to validate its robustness by expanding flood event datasets, integrating real-time data, and testing it in diverse climatic conditions. In summary, the CSA-optimized Xinanjiang model, enhanced with GIUH, provides a powerful, efficient, and reliable approach for flood forecasting. This study contributes to advancing hydrological modeling techniques and offers practical tools for flood risk mitigation, with significant potential for improving disaster management and resilience in flood-prone regions worldwide.
The original contributions presented in the study are included in the article/supplementary material, further inquiries can be directed to the corresponding author.
JY: Writing–original draft. LW: Writing–original draft. JG: Writing–review and editing. YC: Writing–review and editing. YZ: Writing–review and editing. YW: Writing–review and editing. MM: Writing–review and editing.
The author(s) declare that financial support was received for the research, authorship, and/or publication of this article. This research was supported by National Natural Science Foundation of China (42371086), the OpenExtreme21GFund of the China institute of Water Resources and Hydropower Research (IWHR-SKL-KF202310) and the CRSRI Open Research Program (Program SN: CKWV2021885/KY).
Author JY was employed by Shanxi Water Resources Research Institute Co., Ltd. Author YZ was employed by Shaoxing Designstitute of Water Conservancy and Hydro-Electric Power Co., Ltd.
The remaining authors declare that the research was conducted in the absence of any commercial or financial relationships that could be construed as a potential conflict of interest.
The reviewer ZM declared a shared affiliation with the author LW to the handling editor at time of review.
The author(s) declare that no Generative AI was used in the creation of this manuscript.
All claims expressed in this article are solely those of the authors and do not necessarily represent those of their affiliated organizations, or those of the publisher, the editors and the reviewers. Any product that may be evaluated in this article, or claim that may be made by its manufacturer, is not guaranteed or endorsed by the publisher.
Abdulla, F. A., Lettenmaier, D. P., and Liang, X. (1999). Estimation of the ARNO model baseflow parameters using daily streamflow data. J. Hydrology 222, 37–54. doi:10.1016/s0022-1694(99)00096-7
Addor, N., Newman, A. J., Mizukami, N., and Clark, M. P. (2017). The CAMELS data set: catchment attributes and meteorology for large-sample studies. Hydrology Earth Syst. Sci. 21 (10), 5293–5313. doi:10.5194/hess-21-5293-2017
Bamufleh, S., Al-Wagdany, A., Elfeki, A., and Chaabani, A. (2020). Developing a geomorphological instantaneous unit hydrograph (GIUH) using equivalent Horton-Strahler ratios for flash flood predictions in arid regions. Geomatics, Nat. Hazards Risk 11 (1), 1697–1723. doi:10.1080/19475705.2020.1811404
Belcore, E., De Filippis, T., Ganora, D., Piras, M., Tarchiani, V., Tiepolo, M., et al. (2024). Geospatial capacity building for flood resilience in the sahel: the SLAPIS project case study. Int. Arch. Photogramm. Remote Sens. Spat. Inf. Sci. XLVIII-5-2024, 1–7. doi:10.5194/isprs-archives-xlviii-5-2024-1-2024
Berghuijs, W. R., Sivapalan, M., Woods, R. A., and Savenije, H. H. G. (2014). Patterns of similarity of seasonal water balances: a window into streamflow variability over a range of time scales. Water Resour. Res. 50 (7), 5638–5661. doi:10.1002/2014wr015692
Bontemps, S., Defourny, P., Van, B. E., Arino, O., Kalogirou, V., and Ramos, P. J. (2011). GLOBCOVER 2009, products description and validation report. ESA GlobCover Proj. doi:10.013/epic.39884.d016
Chang, X., Guo, J., Liu, Y., Wei, X., Wang, X., and Qin, H. (2025). Study on runoff forecasting and error correction driven by atmosphere–ocean-land dataset. Expert Syst. Appl. 263, 125744. doi:10.1016/j.eswa.2024.125744
Chen, M., Martin, L., and Reza, R. (2024). SpatialGEV: fast Bayesian inference for spatial extreme value models in R. J. Open Source Softw. 9 (103), 6878. doi:10.21105/joss.06878
Cooper, V. A., Nguyen, V. T. V., and Nicell, J. A. (1997). Evaluation of global optimization methods for conceptual rainfall-runoff model calibration. Water Sci. Technol. 36 (5), 53–60. doi:10.2166/wst.1997.0163
Cooper, V. A., Nguyen, V. T. V., and Nicell, J. A. (2007). Calibration of conceptual rainfall–runoff models using global optimisation methods with hydrologic process-based parameter constraints. J. Hydrology 334, 455–466. doi:10.1016/j.jhydrol.2006.10.036
Dijkshoorn, J. A., van Engelen, V. W. P., and Huting, J. R. M. (2008). Soil and landform properties for LADA partner countries (Argentina, China, Cuba, Senegal, South Africa and Tunisia). ISRIC—World Soil Information (Wagemomgem).
Duan, Q. Y., Sorooshian, S., and Gupta, V. K. (1994). Optimal use of the SCE-UA global optimization method for calibrating watershed models. J. Hydrology 158, 265–284. doi:10.1016/0022-1694(94)90057-4
Duraisekaran, E., Kumar, K., Yaswanth, P., Bindhu, V., and Narasimhan, B. (2024). A simulation - optimization framework for effective flood management in a conservation reservoir. doi:10.2139/ssrn.5007522
Eckhardt, K., and Arnold, J. G. (2001). Automatic calibration of a distributed catchment model. J. Hydrology 251, 103–109. doi:10.1016/s0022-1694(01)00429-2
Feng, J., Tang, H., Zhou, S., Cai, Y., and Zhang, J. (2025). Cognitive digital twins of the natural environment: framework and application. Eng. Appl. Artif. Intell. 139, 109587. doi:10.1016/j.engappai.2024.109587
Feng, Z.-K., Niu, W.-J., and Liu, S. (2021). Cooperation search algorithm: a novel metaheuristic evolutionary intelligence algorithm for numerical optimization and engineering optimization problems[J]. Appl. Soft Comput. J. 98, 106734. doi:10.1016/j.asoc.2020.106734
Franchini, M., Galeati, G., and Berra, S. (1998). Global optimization techniques for the calibration of conceptual rainfall-runoff models. Hydrological Sci. J. 43, 443–458. doi:10.1080/02626669809492137
Gan, T. Y., and Biftu, G. F. (1996). Automatic calibration of conceptual rainfall-runoff models: optimization algorithms, catchment conditions, and model structure. Water Resour. Res. 32, 3513–3524. doi:10.1029/96wr02195
Goswami, M., and O’Connor, K. M. (2007). Comparative assessment of six automatic optimization techniques for calibration of a conceptual rainfall-runoff model. Hydrological Sci. J. 52, 432–449. doi:10.1623/hysj.52.3.432
Kuczera, G. (1997). Efficient subspace probabilistic parameter optimization for catchment models. Water Resour. Res. 33, 177–185. doi:10.1029/96wr02671
Lei, W., Zhongbo, Y., Ke, Z., Ragettli, S., Minpei, Z., Yiyan, G., et al. (2023). Factors influencing calibration of a semi-distributed mixed runoff hydrological model: a study on nine small mountain catchments in China. J. Hydrology Regional Stud. 47, 101418. doi:10.1016/j.ejrh.2023.101418
Lo, W., Wang, W.-J., Chen, H.-Y., Lee, J.-W., and Vojinovic, Z. (2024). Feasibility study regarding the use of a conformer model for rainfall-runoff modeling. Water 16 (21), 3125. doi:10.3390/w16213125
Luce, C. H., and Cundy, T. W. (1994). Parameter identification for a runoff model for forest roads. Water Resour. Res. 30, 1057–1069. doi:10.1029/93wr03348
McCarthy, G. T. (1938). “The unit hydrograph and flood routing,” in Conference of north atlantic division (New London, CT: US Army Corps of Engineers). US Engineering.
Moussa, R. (2008). Effect of channel network topology, basin segmentation and rainfall spatial distribution on the geomorphologic instantaneous unit hydrograph transfer function. Hydrol. Process 22 (3), 395–419. doi:10.1002/hyp.6612
Nash, J. E. (1960). A unit hydrograph study, with particular reference to British catchments. Proc. Inst. Civ. Eng. 17 (3), 249–282. doi:10.1680/iicep.1960.11649
Nash, J. E., and Sutcliffe, J. V. (1970). River flow forecasting through conceptual models part I—a discussion of principles. J. hydrology 10 (3), 282–290. doi:10.1016/0022-1694(70)90255-6
Porter, J. R., Shu, E. G., Hauer, M., Hirsch, Z. M., and Buresch, J. (2024). Decomposing future exposure from increasing flood risk and forecast population changes across shared socioeconomic pathways (SSPs) in the United States. Water 16 (22), 3289. doi:10.3390/w16223289
Qiu, H. J., Su, L. L., Tang, B. Z., Yang, D. D., Ullah, M., Zhu, Y., et al. (2024). The effect of location and geometric properties of landslides caused by rainstorms and earthquakes. Earth Surf. Process. Landforms 49 (7), 2067–2079. doi:10.1002/esp.5816
Ragettli, S., Zhou, J., Wang, H., Liu, C., and Guo, L. (2017). Modeling flash floods in ungauged mountain catchments of China: a decision tree learning approach for parameter regionalization. J. Hydrology 555, 330–346. doi:10.1016/j.jhydrol.2017.10.031
Rostami, A., Chang, C.-H., Lee, H., Wan, H.-H., Du, T. L. T., Markert, K. N., et al. (2024). Forecasting flood inundation in U.S. Flood-prone regions through a data-driven approach (FIER): using VIIRS water fractions and the national water model. Remote Sens. 16 (23), 4357. doi:10.3390/rs16234357
Singh, R., Archfield, S. A., and Wagener, T. (2014). Identifying dominant controls on hydrologic parameter transfer from gauged to ungauged catchments - a comparative hydrology approach. J. Hydrology 517, 985–996. doi:10.1016/j.jhydrol.2014.06.030
Sorooshian, S., Duan, Q. Y., and Gupta, V. K. (1993). Calibration of rainfall-runoff models: application of global optimization to the Sacramento soil moisture accounting model. Water Resour. Res. 29, 1185–1194. doi:10.1029/92wr02617
Thyer, M., Kuczera, G., and Bates, B. C. (1999). Probabilistic optimization for conceptual rainfall-runoff models: a comparison of the shuffled complex evolution and simulated annealing algorithms. Water Resour. Res. 35, 767–773. doi:10.1029/1998wr900058
van Griensven, A., and Bauwens, W. (2003). Multiobjective autocalibration for semidistributed water quality models. Water Resour. Res. 39, 1348. doi:10.1029/2003wr002284
Wang, Y. C., Yu, P. S., and Yang, T. C. (2010). Comparison of genetic algorithms and shuffled complex evolution approach for calibrating distributed rainfall-runoff model. Hydrol. Process. 24, 1015–1026. doi:10.1002/hyp.7543
Wei, Y. D., Qiu, H. J., Liu, Z. J., Huangfu, W. C., Zhu, Y. R., Liu, Y, et al. (2024). Refined and dynamic susceptibility assessment of landslides using InSAR and machine learning models. Geosci. Front. 15, 101890. doi:10.1016/j.gsf.2024.101890
Yapo, P. O., Gupta, H. V., and Sorooshian, S. (1996). Automatic calibration of conceptual rainfall-runoff models: sensitivity to calibration data. J. Hydrology 181, 23–48. doi:10.1016/0022-1694(95)02918-4
Zhao, R. J., and Wang, P. L. (1988). Analysis of Xinanjiang Model Parameters. J. Hydrol. 1988 (06), 2–9. doi:10.19797/j.cnki.1000-0852.1988.06.001
Zhou, L. (2024). Perspective chapter: big data and deep learning in hydrological modeling. River Basin Manag. - Challenges Coping Strategies [Working Title]. IntechOpen. doi:10.5772/intechopen.1007640
Keywords: flood forecasting, geomorphological instantaneous unit hydrograph (GIUH), cooperation search algorithm, parameter optimization, diverse catchment
Citation: Yang J, Wen L, Guo J, Chen Y, Zhu Y, Wang Y and Ma M (2025) A cooperative search algorithm-based flood forecasting framework: application across diverse Chinese catchments. Front. Earth Sci. 13:1538235. doi: 10.3389/feart.2025.1538235
Received: 02 December 2024; Accepted: 20 January 2025;
Published: 11 February 2025.
Edited by:
Haijun Qiu, Northwest University, ChinaReviewed by:
Zhou Minpei, Hohai University, ChinaCopyright © 2025 Yang, Wen, Guo, Chen, Zhu, Wang and Ma. This is an open-access article distributed under the terms of the Creative Commons Attribution License (CC BY). The use, distribution or reproduction in other forums is permitted, provided the original author(s) and the copyright owner(s) are credited and that the original publication in this journal is cited, in accordance with accepted academic practice. No use, distribution or reproduction is permitted which does not comply with these terms.
*Correspondence: Meihong Ma, bWFtaEB0am51LmVkdS5jbg==
†These authors share first authorship
Disclaimer: All claims expressed in this article are solely those of the authors and do not necessarily represent those of their affiliated organizations, or those of the publisher, the editors and the reviewers. Any product that may be evaluated in this article or claim that may be made by its manufacturer is not guaranteed or endorsed by the publisher.
Research integrity at Frontiers
Learn more about the work of our research integrity team to safeguard the quality of each article we publish.