 Yaling Zhu1,2
 Wenmei Tan
- 1School of Geosciences, Yangtze University, Wuhan, China
- 2Hubei Key Laboratory of Complex Shale Oil and Gas Geology and Development in Southern China, Wuhan, China
- 3Mineral Geological Survey Institute of Ningxia Hui Autonomous Region, Yinchuan, China
- 4Institute of Mineral Geology of Ningxia Hui Autonomous Region, Yinchuan, China
The Jurassic Yan ’an Formation in the southwestern margin of Ordos Basin has developed many sets of coal-associated and non-associated mudstone as well as oil shale. Different analytical methods including total organic carbon (TOC), Rock-Eval pyrolysis, and conventional biomarker analyses were applied on the mudstone, the coal and the oil shale extracts to unravel their organic geochemical characteristics and the paleo depositional environment. Results reveal that all the source rock samples are immature to mature with good petroleum generation potentials. The redox environment is generally reducing. The organic matter input is mainly terrestrial higher plants. The low Ga/C30 hopane ratio of all the samples indicate the low salinity of the paleo-water column. The oil shale samples show much higher thermal maturity than the coals and mudstones as indicated by the higher C31 homohopane isomerization indexes, C32 homohopane isomerization indexes and the C29 sterane ααα20S/(S + R) ratios. The depositional environment of the oil shale is more reduced compared to the coals and mudstones as can be reflected by the low oxygen index and the higher C35 hopane/(C31-C35 homohopanes) ratios. Thus, the oil shale layers should be the target of the next exploration and development. And the Oil shale and coal can be exploited simultaneously in Pengyang area.
1 Introduction
Ordos basin is one of the most important coal-bearing and hydrocarbon-bearing basin in China. In recent years, a series of new reservoirs have been discovered in Pengyang area in the southwest of the basin, which makes the southwest area of the basin gradually become an important exploration zone (Liu et al., 2020).
The main oil-bearing strata in Pengyang area are the third member of Triassic Chang Yanchang Formation and the lower part of Jurassic Yan ’an Formation (Li et al., 2022; Yu et al., 2012). Therefore, previous studies mainly focus on the characteristics of sedimentary reservoirs of Yanchang and Yan ’an Formations in this area. It has been concluded that the size of Yan ’an Formation reservoir in this area is small and the exploration is difficult, but the reservoir has good physical property and high productivity (Guo et al., 2008; Liu et al., 2010; Wu et al., 2009; Yu et al., 2012; Zheng et al., 2021).
A large set of coal seams, mudstone and oil shale also developed in Yan ’an Formation in Pengyang area. However, concerns mainly focus on the exploration and development of coal resources, researches on the oil shale in this area were very rare (Du et al., 2024; Yang et al., 2024). With the increasing development of the oil shale exploitation and extraction technology, more attention has been paid on the oil shale. The thick oil shale often appears as the top and bottom of coal seam or interbedded with coal seam in this area. As the main source rock of Mesozoic in Ordos Basin, the oil shale in Yan ’an Formation has attracted more and more attention (Hai et al., 2022; He et al., 2022; Liu et al., 2010; Yang et al., 2024).
This study collected core samples from Yan ’an Formation. The organic geochemical analysis of total organic carbon (TOC), rock-eval pyrolysis, chloroform asphalt “A” extraction, group component separation and gas chromatography-mass spectrometry (GC-MS) were carried out. The hydrocarbon generation potential of source rock in this area have been discussed, and the depositional environment of the source rocks have been further analyzed. It can provide the basic references for further exploration and exploration of Yan ’an Formation source rocks in southwest Ordos Basin.
2 Geological settings
Ordos Basin is the second largest sedimentary basin located in the central and western part of North China, which is a Craton Basin with an area of 25 × 104 km2. The basin has undergone multi-stage tectonic evolution and the superposition of multiple sedimentary systems. The basin was uplifted as a whole and eventually formed a large inland sedimentary basin through the depression. In the Late Triassic, due to the squeezing of the North China plate and the Yangtze plate, the eastern part of North China entered the orogenic period. The situation of see in the south and land in the North began to rise gradually toward the east and develop into the western depression, which eventually formed the Ordos Basin. According to the present tectonic characteristics, the basin can be divided into six tectonic units, which are the Western Thrust Belt, the Tianhuan depression, the Yishan slope, the Jinxi Flexural Belt, the Yimeng uplift and the Weibei uplift. The research area is in Pengyang area of southwestern Ordos Basin, which is located in the southern part of the Tianhuan Depression adjacent to the Yishan Slop in the east and the Western Thrust Belt in the west (Figure 1).
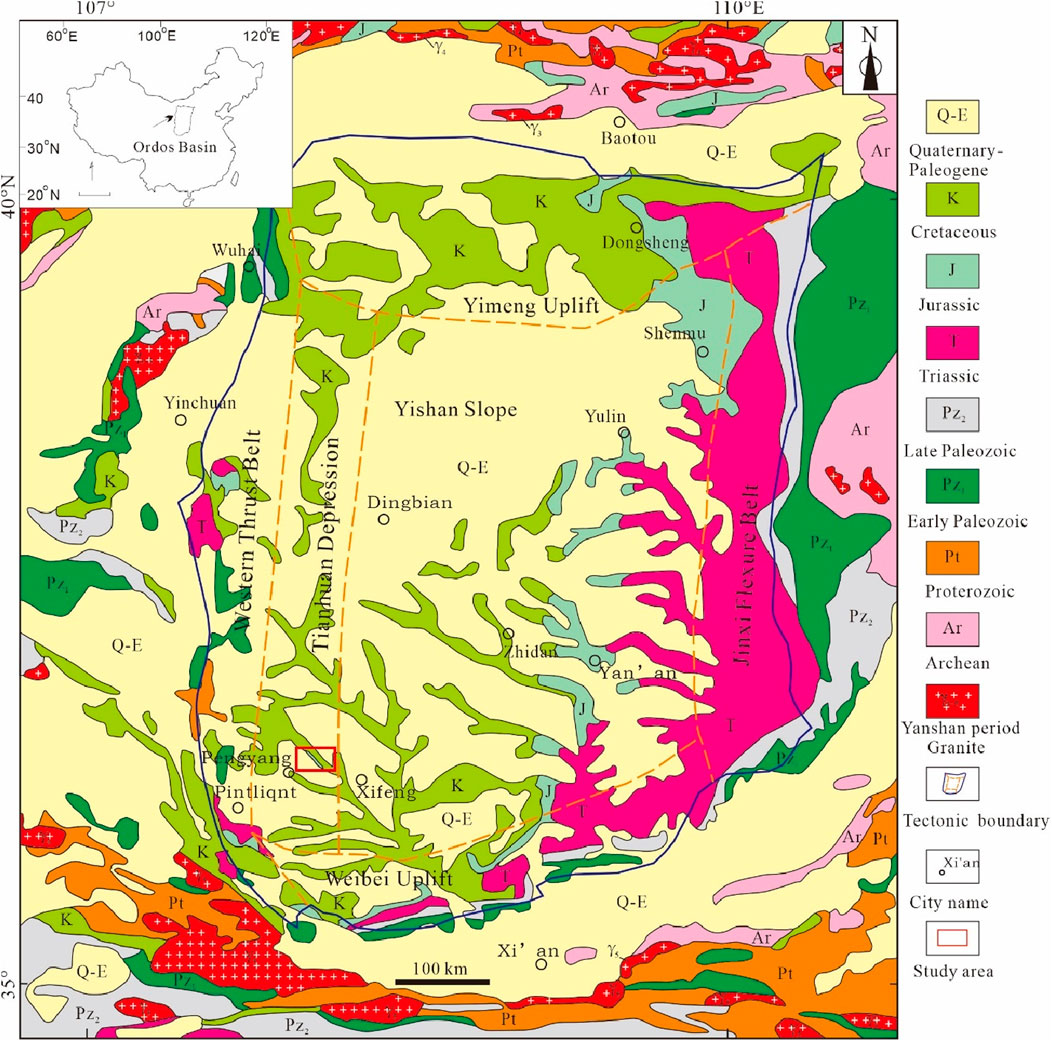
Figure 1. Structural unit and geological map of Ordos Basin, modified from the work of (Zhao et al., 2020).
The Mid-Jurassic Yan’an Formation is the target layer, which is in parallel unconformity contact with the overlying Zhiluo Formation and the underlying Fuxian Formation. Due to the continuous depression and subsidence of the basin during this period, a thick coal-bearing stratum was formed in the study area. According to the lithology and petrographic assemblage characteristics, the Middle Jurassic Yan’an Formation can be divided into five coal-bearing lithologic segments (Hai et al., 2022). Oil shale is mainly developed in the first, third and fifth coal-bearing sections with certain thickness and considerable resources. Therefore, the samples in this paper are mainly selected from the above three coal-bearing sections (Figure 2).
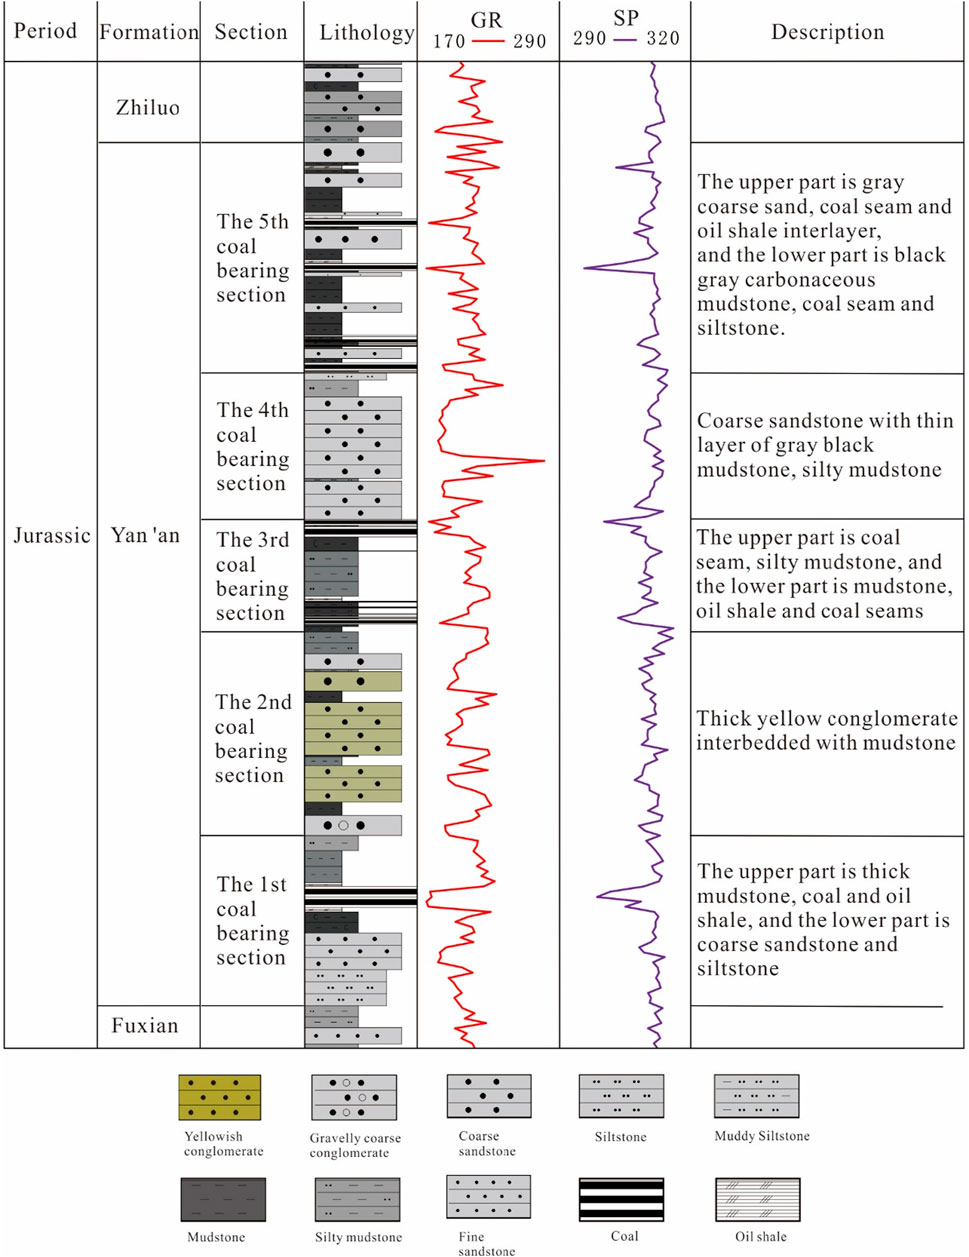
Figure 2. Stratigraphic column of Yan ’an formation in southwestern Ordos Basin, modified after (Yang et al., 2024).
3 Sample and methods
3.1 Samples
In this study, core samples from the oil shale geological survey boreholes ZK1306, ZK1802 and ZK1803 were collected for both bulk TOC and Rock-eval screening (Figure 1). In the following, 12 samples were selected as key representatives according to their lithology and TOC content for detailed investigations by means of biomarker identification and quantification.
3.2 Analytical methods
3.2.1 Total organic carbon and rock-eval pyrolysis
All samples were collected for TOC determination. The finely crushed core samples were treated with 10% HCl at 60°C to remove carbonate and washed with distilled water. Afterwards, the washed samples were dried and combusted in oxygen at 1,350°C with a Leco CS-200 combustion oven. The Rock-Eval pyrolysis was carried out on the pulverized samples using the Rock-Eval 6, following the established methods (Behar et al., 2001). The crashed samples were heated at 300°C for 3 minutes to get the S1 fractions. Then the heating temperature was increase to 600°C with the heating rate of 50°C to get the S2 fractions.
3.2.2 Extraction and fractionation
Soxhlet extraction experiments was carried out on the powered samples for 48 h at 60°C. The extraction solvent is a mixture of dichloromethane and methanol (99:1 vol:vol). After extraction, asphaltenes were precipitated with n-hexane from the extracted bitumen according to the method developed by Theuerkorn et al. (2008). Medium-pressure liquid chromatography (MPLC) fractionation was performed to the maltene fraction with the method of Radke et al. (1980). Aliphatic hydrocarbon, aromatic hydrocarbon and resins (nitrogen, sulfur, and oxygen (NSO) compounds) were separated.
3.2.3 Gas chromatography–mass spectrometry (GC-MS)
The GC–MS measurements were performed using an Agilent 6890A gas chromatograph coupled with a Finnigan MAT 95 XL mass spectrometer (MS). The GC was equipped with a fused silica capillary column (SGE BPX5, 0.22 mm I.D., 0.25 μm phase). Helium was used as the carrier gas at a constant flow rate of 1 mL/min. The oven temperature was increased from 50°C (held for 1 min) to 310°C with a heating rate of 3°C/min (held for 30 min). Full scan mass spectra were recorded over a range of m/z 100–650 at 1 scan per second and an interscan time of 0.2 s. Data evaluation was carried out using the XcaliburTM software. The quantification was performed using 5α-Androstane and 1-ethylpyrene as internal standards for aliphatic and aromatic hydrocarbon fractions, respectively.
4 Results
4.1 Screening data
TOC and Rock-eval data as the organic geochemical parameters, can provide basic information about the organic richness, maturity and quality of organic matter in potential source rock. All the Yan’an Formation samples show TOC content above 1%. The coal and oil shale samples contain TOC above 10% (Table 1), which indicate very good hydrocarbon generation potential as defined by Peters and Cassa (1994). Most samples show HI value below 300 mg/g TOC except one outlier shows HI value up to 700 mg/g TOC (Figure 3), which indicate the samples contain mainly type II2 and type III kerogen (Espitalie et al., 1977). All the samples characterized by Tmax value below 435°C that their thermal maturity is very low. It can be observed that the coal and oil shale samples show much higher S2 value, lower oxygen index (OI = S3/TOC*100%) and higher sulfur content compared to the mudstone samples (Table 1).
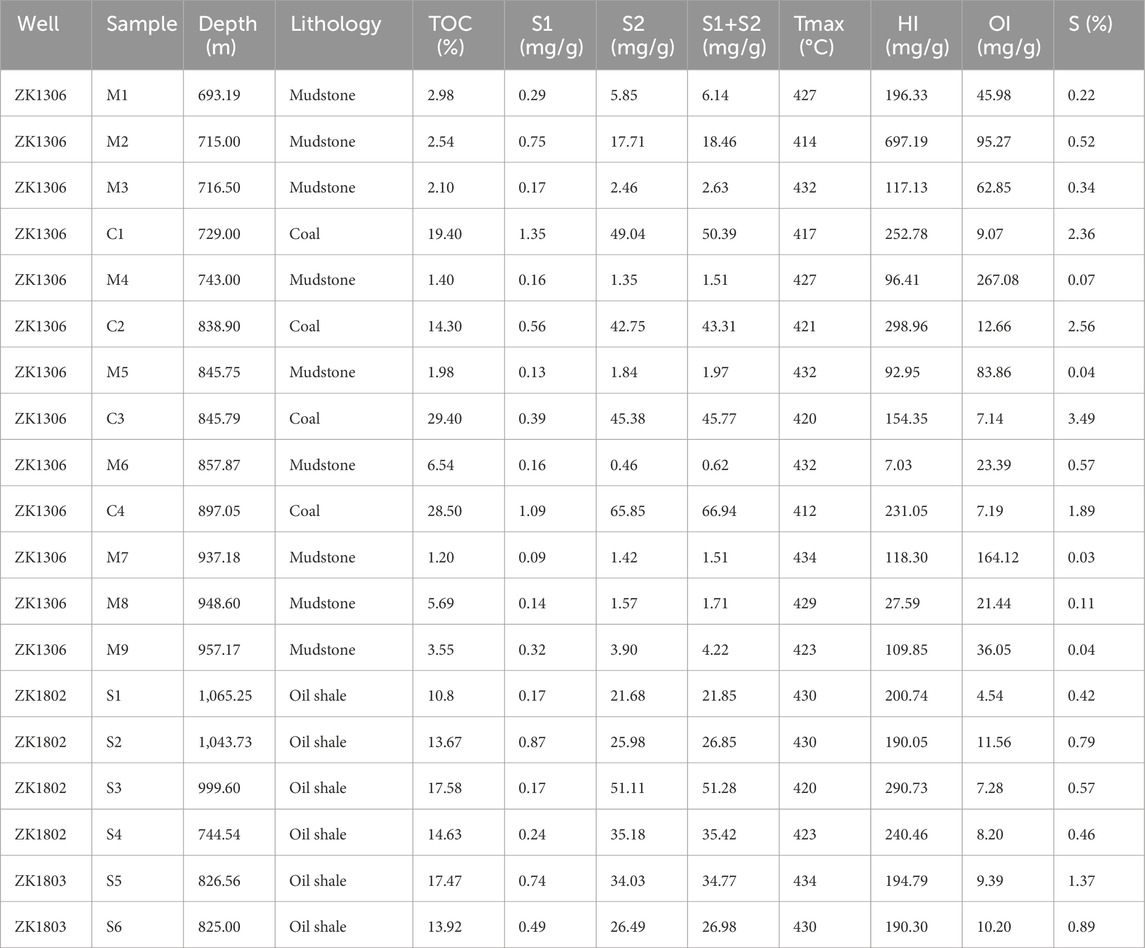
Table 1. TOC and Rock-Eval parameters for source rock samples from Yan ’an Formation.
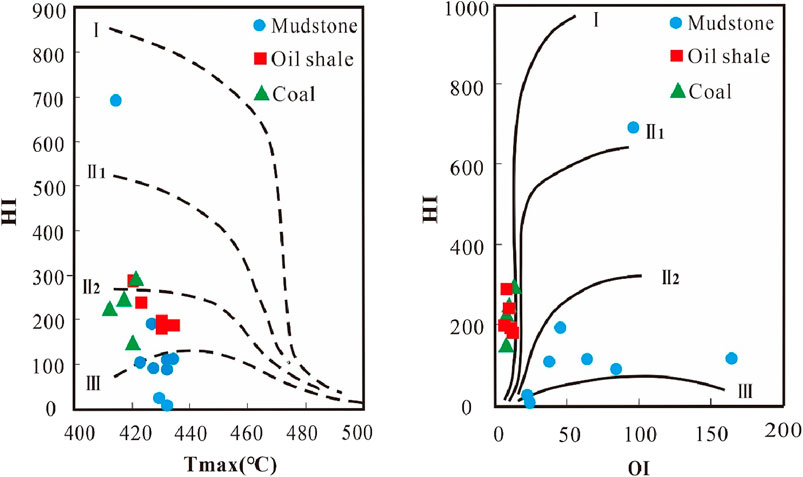
Figure 3. Hydrogen index (HI) against Tmax and HI against Oxygen index (OI) for the source rock samples of Jurassic Yan ‘an Formation, diagram from Espitalie (1986).
4.2 Characterization of SARA
Based on the TOC value and lithology, four mudstone and two coal samples selected from the Well ZK1306, four oil shales from the Well ZK1802 and two oil shales from the Well ZK1803 of Yan ’an Formation were extracted with Soxhlet extractor. From the extraction results, it can be observed that the extracted organic matter (EOM) of the coal samples (ave. 0.84 mg/g) is much higher than that of the oil shales (ave. 0.22 mg/g) and the mudstones (ave. 0.18 mg/g), which might due to the high TOC content of the coal samples (Table 2). With MPLC fractionation, EOM of the samples can be divided into saturate hydrocarbon (saturates), aromatic hydrocarbon (aromatics), resins, and asphaltenes (SARA) (Jewell et al., 1974; Jewell et al., 1972). All the coal and mudstone samples show lower amount of saturates and aromatics as well as high content of resins and asphaltenes, while the maltenes of the four oil shales are dominated by saturates and aromatics. The relatively higher amount of saturates and aromatics suggest a relatively higher maturity of the oil shale samples (Peters et al., 2005).
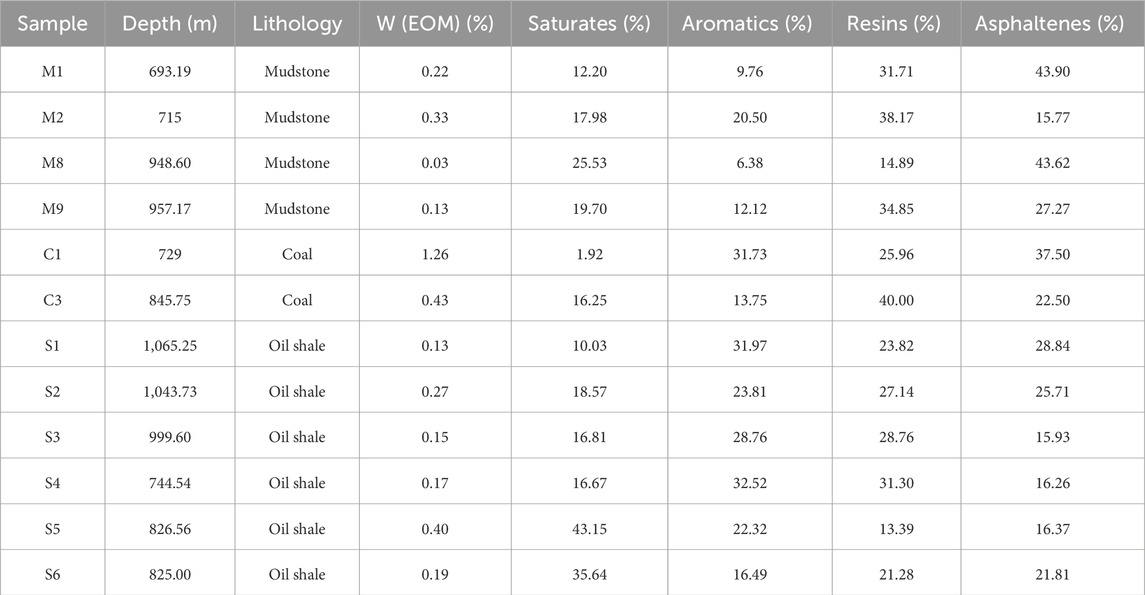
Table 2. Organic matter extracted from shales and coals of Jurassic Yan ’an Formation, southwestern Ordos Basin.
4.3 n-Alkanes and isoprenoids
The n-alkane and isoprenoid parameters derived from the gas chromatograms are contained in Table 3. The Upper Triassic Yan ’an Formation source rocks show that they contain well-developed n-alkanes and exhibit unimodal characteristics (Figure 4). The dominant peak carbon numbers are nC23, nC25, nC27 for different samples. A clear odd/even preference (OEP) and Carbon Preference Index (CPI) in their n-alkane distributions can be observed, which indicate the input of higher terrestrial plants (Peters et al., 2004). It is obvious that the OEP and CPI values of the oil shale samples are much lower compared to that of the coals and mudstones, which might indicate the higher thermal maturity of the oil shales. It can be confirmed by the higher Tmax value of the oil shale samples (Table 1).
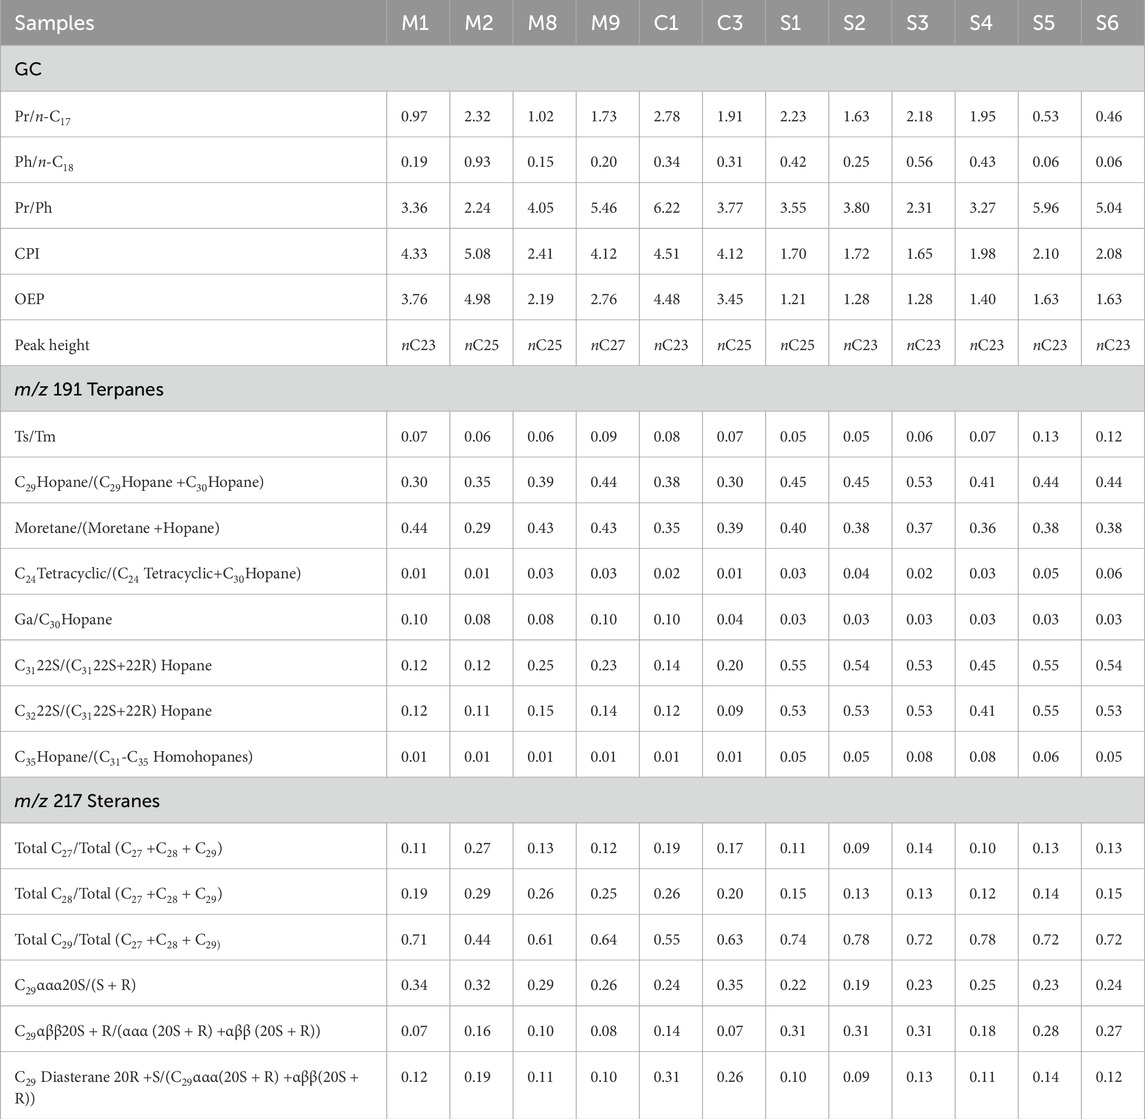
Table 3. Calculated biomarker ratios of the source rocks in Jurassic Yan ’an Formation, southwestern Ordos Basin.
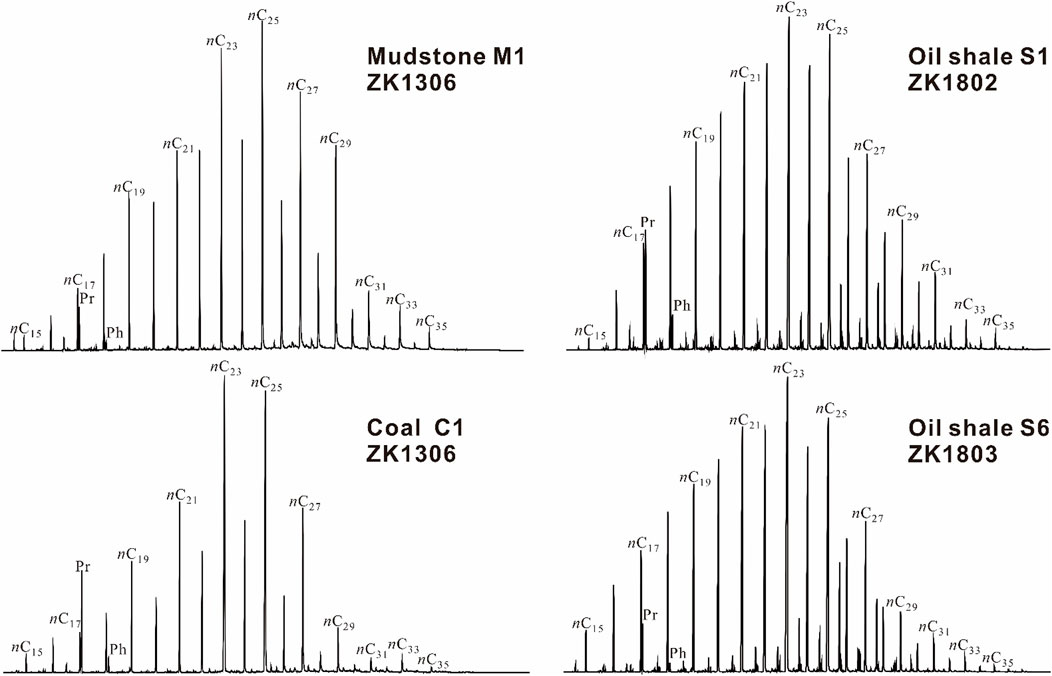
Figure 4. n-Alkane and isoprenoid distributions in the extracts of representative mudstone, coal and oil shale samples. Pr = pristane; Ph = phytane.
The pristane/phytane ratio (Pr/Ph) has been widely used to characterize the depositional environment (Chandra et al., 1994; Large and Giże, 1996). The Pr/Ph ratios below 1.0 usually indicate anoxic, marine carbonate lithology and values from 1.0 to 1.5 marine shale lithology. Values higher than 2 indicate deltaic shales or terrestrial environments (Peters et al., 2005). Most of the samples show high Pr/Ph ratios above 3.0, indicating the terrestrial swamp depositional condition.
4.4 Terpanes
The m/z 191 Chromatograms with peaks related to different terpane compounds are shown in Figure 5 and the biomarker ratios calculated from the chromograms are given in Table 3. It is obvious that the relative peak heights of the tricyclic terpanes are extremely low for all the samples. Most samples show C30 hopane as the dominant component and much low amount of gammacerane. The diahopane are nearly undetectable. All the samples show significant higher peak of 22,29,30, 18a-trisnorneohopane (Ts) compared to the peak of 22,29,30, 17a-trisnorhopane (Tm). The homohopanes also show very low peak heights.
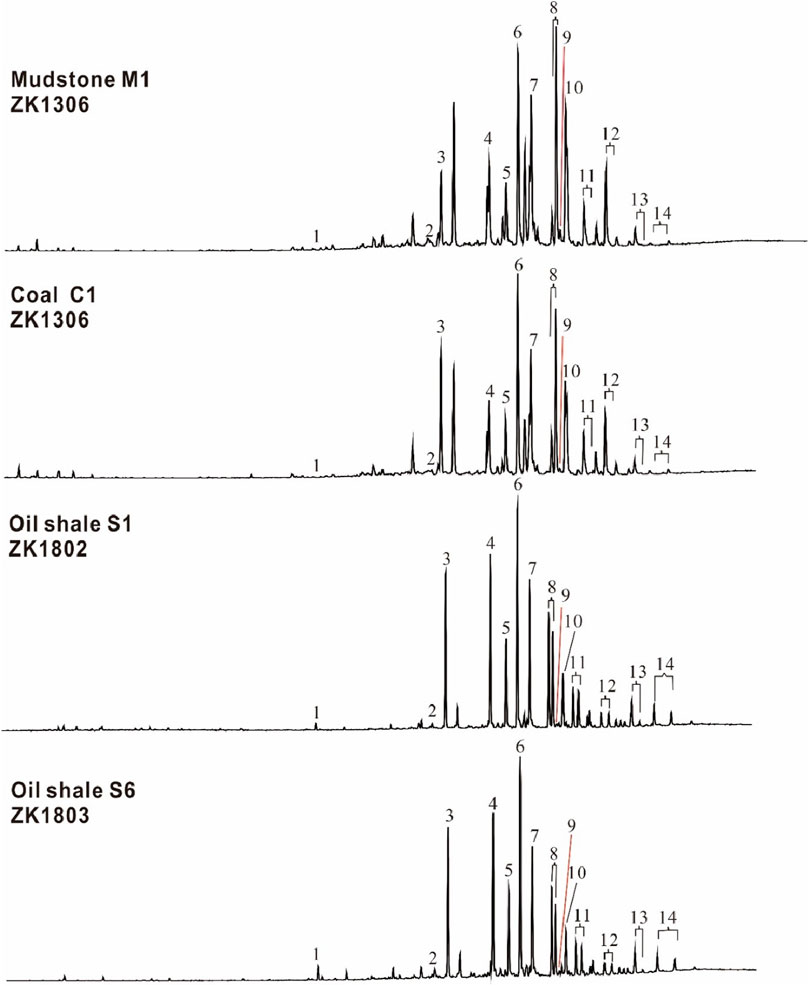
Figure 5. The m/z 191 chromatograms for the representative mudstone, coal and oil shale samples. Numbered peaks corresponding to different terpane biomarker compounds are as follows: 1 = C24 tetracyclic; 2 = Ts; 3 = Tm; 4 = C29 moretane; 5 = C29 hopane; 6= C30 hopane; 7 = C30 moretane; 8 = C31 homohopanes; 9 = gammacerane; 10 = C31 homomoretane; 11 = C32 homohopanes; 12= C33 homohopanes; 13 = C34 homohopanes; 14 = C35 homohopanes.
The tricyclic terpanes are thought to derived from microorganisms and algae, or they can also be transformed from hopanoid at high level of maturity (Seifert and Michael Moldowan, 1978). The extremely low ratios of the tricyclic to pentacyclic terpanes might indicate low maturity of the samples (Figure 5).The ratio of Ts/(Ts + Tm) varies with organic matter input and thermal maturity (Peters and Moldowan, 1993), which is strongly influenced by the transformation from Tm to Ts due to increasing maturity. Slightly high values of Ts/(Ts + Tm) can be observed for the two oil shale samples from Well ZK1803, indicating the higher maturity of the two samples. The C31 homohopane isomerization indexes and C32 homohopane isomerization indexes are also closely linked with the thermal maturity. The indexes will reach a final ratio of about 60% with increasing maturity as the hopane 22R can generally be transformed to hopane 22S (Peters and Moldowan, 1993). The oil shale samples show much higher C31 homohopane isomerization indexes and C32 homohopane isomerization indexes compare to the coal and the mudstone samples, which indicate the higher maturity of the oil shale samples.
The gammacerane index (Ga/C30H) is generally considered to be an indicator of restricted depositional environment that is characterized by a stratified saline and hypersaline water column (Philp et al., 1991; Sinninghe Damsté et al., 1995; Summons et al., 2008). The Ga/C30H values of all the source rock samples are ≤0.1, which indicates the freshwater depositional condition of Yan ’an Formation in this area. However, the slightly higher Ga/C30H values of the mudstone and coal samples indicate the higher salinity of their depositional water column.
The C35 homohopanes can be observed in all the source rock samples, indicating at least suboxic condition. The calculated ratios of C35 Hopane/(C31-C35 homohopanes) are all very low, which indicate the depositional environment was not strongly anoxic. As the oil shale samples show much higher C35 hopane/(C31-C35 homohopanes) ratios compared to the coals and mudstones (Table 3), which indicate the more anoxic depositional environment of the oil shale samples.
4.5 Steranes
The steranes chromatograms with m/z 217 for the source rock samples in this study are show in Figure 6. The C27, C28, C29 regular steranes occur in all the extracts and the C29 ααα20R is the prominent component. The C21, C22 pregnanes are hardly detectable, and the diasteranes also show very low relative peak heights.
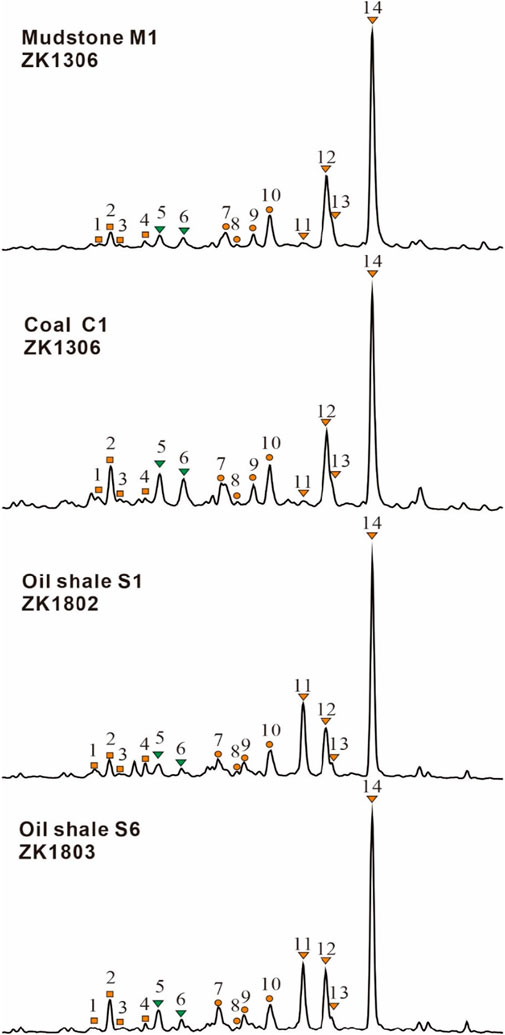
Figure 6. The m/z 217 chromatograms for the representative mudstone, coal and oil shale samples. Numbered peaks correspond to different sterane biomarker compounds as follows: 1 = C27 ααα20S; 2 = C27 αββ20R; 3 = C27 αββ20S; 4 = C27 ααα20R; 5 = C29 diasterane 20S; 6 = C29 diasterane 20R; 7 = C28 ααα20S; 8 = C28 αββ20R; 9 = C28 αββ20S; 10 = C28 ααα20R; 11 = C29 ααα20S; 12 = C29 αββ20R; 13 = C29 αββ20S; 14 = C29 ααα20R.
The biomarker ratios calculated from the steranes are shown in Table 3. It is generally believed that the C27 steranes related to the input of algae and aquatic organisms (Huang and Meinschein, 1979), the C28 steranes originated from the phytoplankton (Seifert and Michael Moldowan, 1978) and the C29 steranes derived from terrestrial high plants (Volkman, 1986). All the source rock samples are enriched in C29 steranes, suggesting the input of organic matter is mostly of terrigenous higher plants.
As with increasing maturity, the relative high abundance of C29 sterane 20S and C29 sterane αα can be transformed to C29 sterane 20R and C29 sterane ββ, respectively. The calculated C29αββ (20S + R)/(ααα (20S + R) +αββ (20S + R)) and C29ααα20S/(S + R) ratios can be used to evaluate the thermal maturity. The oil shale samples show much higher values of C29αββ (20S + R)/ααα (20S + R) +αββ (20S + R) ratios compared to the mudstone and coal samples, indicating the higher thermal maturity of the oil shale samples.
The formation of diasteranes might result from the clay-catalyzed rearrangement or thermal maturity induced transformation of regular steranes (Rubinstein et al., 1975). The two coal samples have higher diasterane/regular sterane ratios (0.26 and 0.31) compared to the oil shale and mudstone samples (around 0.1) indicating the active clays in the coal samples.
5 Discussion
5.1 Source rock evaluation
The quantity and quality of the hydrocarbons that can be generated from source rock are mainly controlled by the abundance of organic matter, the type of the organic matter input, and the thermal maturity (Vandenbroucke and Largeau, 2007). It seems that one parameter alone is generally insufficient to yield high potential oil or gas prone sediments (Peters et al., 2004; Yunker et al., 2005).
The average TOC amounts of the mudstone, oil shale and the coal samples are 3.11%, 14.68% and 22.90%, respectively. The values point to the good and very good TOC content (above 1%). Petroleum generation potential (S1 + S2) is another important parameter to evaluate the hydrocarbon generation potential of kerogen. It has been suggested that the S1 + S2 value above 6 is related to good and very good hydrocarbon generation potential and the value below 6 indicates very poor to fair source rock (Tissot and Welte, 1979). According to Figure 7 the oil shale and coal samples show good to very good potential while most of the mudstones have poor to fair potential.
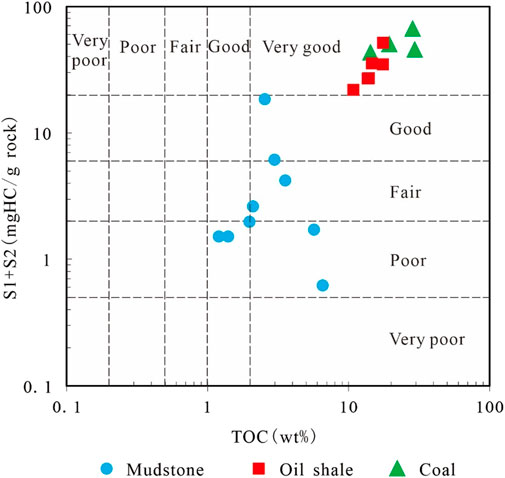
Figure 7. Total Organic Carbon (TOC) vs S1+S2 for all the source rock samples, after (Safaei-Farouji et al., 2021).
The plot of Pr/n-C17 versus Ph/n-C18 can be used to assess the organic matter input of source rocks (Hanson et al., 2000; Ramanampisoa and Radke, 1995). As shown in Figure 8, all the sample’s plot within the region of Type III kerogen. The organic matter of type III kerogen deposited in terrestrial environment is consistent with previous investigation based on the major and trace elements analysis (He et al., 2022). Another common way to distinguish the sedimentary environment and the main source of organic matter for the kerogen is to use the C27-C28-C29 ternary plots (Peters and Moldowan, 1993). The relatively higher C29 regular sterane contents also indicate the terrestrial depositional environment and the mainly higher plant input for all the samples (Figure 9).
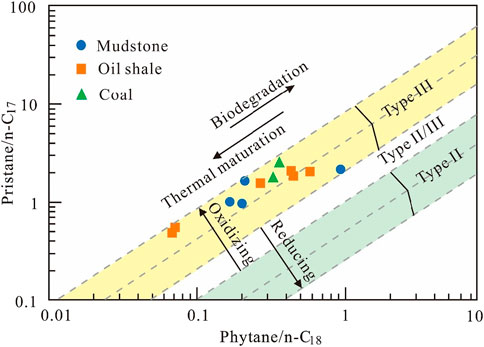
Figure 8. GC-derived pristane/n-C17 versus phytane/n-C18 for depositional environment typing.
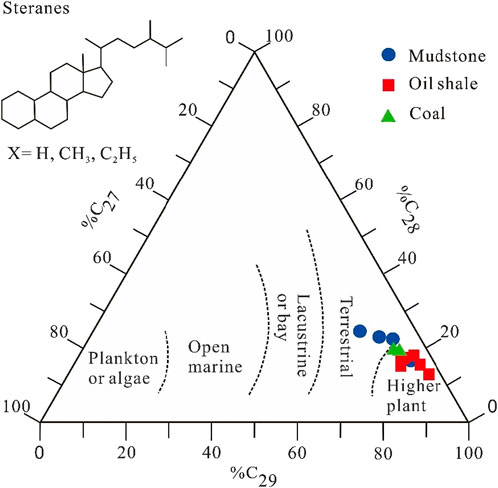
Figure 9. Ternary diagram of C27, C28, C29 regular sterane compositions for the source rock sample extracts based on high resolution biomarker analysis. Chemical structures are show on left. The corners of the triangle represent the relative percentage of the corresponding sterane homologs. Inferred types of ecosystems are shown on the background modified from Huang and Meinschein (1979).
The isomerization values of steranes are usually used to measure the thermal maturity of organic matter. With increasing maturity, isomerization at C-20 in the C29ααα sterane lead to the ratio of 20S/(20S + 20R) increase from 0 to about 0.5 (equilibrium = 0.52–0.55) (Seifert and Michael Moldowan, 1978). Moreover, the C2917α(H), 21α(H) sterane will also be transformed to the C2917β(H), 21β(H) sterane, and the equilibrium value is about 0.57–0.62 (Peters and Cassa, 1994). Based on the cross plot of C29 sterane ββ/(ββ+αα) versus C29 sterane 20S/(20S + 20R) ratio (Figure 10), the analyzed source rock samples are immature to low mature and most of the oil shale samples reached a thermal maturity level equivalent to oil generation window. The biomarker results are consistent with the low Tmax values of the samples. All the samples show Tmax values below 435°C, the low Tmax values might be suppressed by the hydrogen-rich macerals as the oil shale and coal samples show much higher HI values (Dewing and Sanei, 2009; Yang and Horsfield, 2020). It has been reported that the vitrinite reflectance of the oil shale samples is between 0.44% and 0.57% with average value of 0.51% (Yang et al., 2024). Thus, the samples are within maturity level of immature to low mature. The higher C31 homohopane isomerization indexes, C32 homohopane isomerization indexes of the oil shale samples also confirmed that oil shales show much higher thermal maturity compared to the mudstones and coal samples (Table 3).
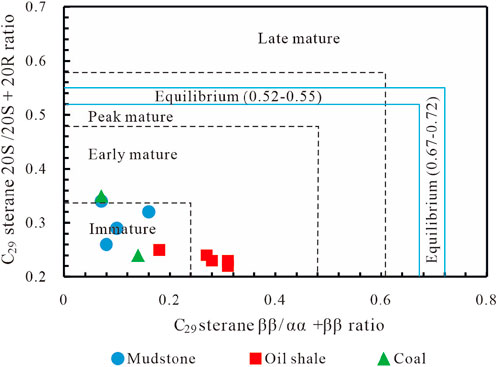
Figure 10. C29 sterane ββ/ββ+αα versus C29 sterane 20S/20S + 20R, modified from Peters et al. (2007).
In summary, the oil shale samples with much higher TOC content, higher thermal maturity compared to the mudstones and show much higher potential for hydrocarbon exploration.
5.2 Sedimentary environment
The OI values might somehow indicate the variation of redox condition of the samples at low thermal maturity (Peters et al., 2005). The samples deposited in the reducing environment normally contain lower oxygen content. Figure 11 shows the correlation between the TOC and OI for the source rock samples. It can be observed that the oil shale and coal samples are deposited in a more reducing condition compared to the mudstones. It can also be confirmed by the relatively high sulfur content of the coal and oil shale samples as sulfur content is very sensitive to the redox condition.
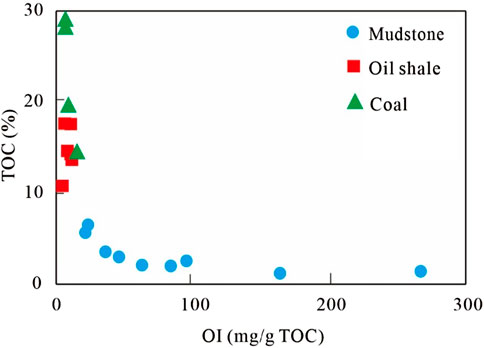
Figure 11. The negative correlation between the TOC content of the OI of the source rock samples.
The ratios of C35 hopane/(C31-C35 homohopanes), Pr/n-C17 and Ph/n-C18 can also be used to analyzed the depositional environment (Peters and Moldowan, 1993). The higher C35 hopane/(C31-C35 homohopanes) values of the oil shale samples reflect their relatively reducing environment compared to the coals and mudstones. Surprisingly, the ratios of pristane/n-C17 and phytane/n-C18 plotted in the oxidizing area in Figure 8. As the source rock samples contains high TOC amount, the depositional environment should not be oxidizing. The high Pr/n-C17 values might be explained by the kerogen sulfurization and associated chemical reactions at early diagenesis that lead to the elevation of pristane (Ghassal et al., 2016).
The co-deposition of oil shale and coal indicate both the similarity and variability of the depositional condition. The development of coal and oil shales generally requires relatively stable structures, warm and humic climate as well as abundant organic matter input (Wang et al., 2016). The difference is that the coals developed in a shallow swampy environment, while the water column of the oil shales are deeper.
The Ga/C30 hopane values of the oil shale samples are slightly lower compared to the coals (Table 3), reflecting the lower salinity of the depositional water column. The low salinity might indicate the deep-water column of the oil shale formation and less influence from the adjacent gypsum rock (Xian et al., 2023). The deduction is also consistent with the redox environment of the samples. The oil shale developed in the deeper and more reducing environment and the coal developed in the shallow water environment with more higher plant organic matter input.
6 Conclusion
To explore the source rock hydrocarbon exploration potential, a series of organic geochemical analysis were conducted to different mudstone, oil shale and coal samples from the Middle Jurassic Yan ’an Formation of Pengyang area.
The results show that the source rocks have high TOC content, low thermal maturity and type III organic matter, the sediment was deposited in a reducing freshwater terrestrial environment. By comparing different biomarkers including the alkane, isoprenoids, terpenes and steranes of oil shale, coal and mudstone samples, it is found that the oil shales show higher thermal maturity and higher hydrocarbon generation potential than other samples. The relatively low Ga/C30 hopane values of oil shale samples indicate a deeper water and more reducing sedimentary environment, which is more conducive to organic matter enrichment. The mudstones with lower TOC values, lower thermal maturity and less reducing depositional environment show less oil and gas exploration potential compared to the oil shales. It is suggested that the oil shale and coal resources should be effectively and comprehensively exploited at the same time, not only the waste of the oil shale can be reduced, but also huge economic benefits and application prospects will be generated.
Data availability statement
The original contributions presented in the study are included in the article/supplementary material, further inquiries can be directed to the corresponding author.
Author contributions
YZ: Writing–original draft, Writing–review and editing, Software, Supervision. WT: Writing–original draft, Writing–review and editing, Data curation, Formal Analysis. LH: Project administration, Resources, Writing–review and editing. CM: Project administration, Resources, Writing–review and editing. KW: Investigation, Methodology, Writing–review and editing. ML: Investigation, Methodology, Writing–review and editing.
Funding
The author(s) declare financial support was received for the research, authorship, and/or publication of this article. This work is supported by the Key Laboratory of Tectonics and Petroleum Resources (China University of Geosciences), Ministry of Education, Wuhan 430074, China (Grant number TPR-2021-11), the National Nature Science Foundation of China (Grant number 42002155), and Ningxia key research and development project (Grant number 2024BEH04018).
Conflict of interest
The authors declare that the research was conducted in the absence of any commercial or financial relationships that could be construed as a potential conflict of interest.
Generative AI statement
The author(s) declare that no Generative AI was used in the creation of this manuscript.
Publisher’s note
All claims expressed in this article are solely those of the authors and do not necessarily represent those of their affiliated organizations, or those of the publisher, the editors and the reviewers. Any product that may be evaluated in this article, or claim that may be made by its manufacturer, is not guaranteed or endorsed by the publisher.
References
Behar, F., Beaumont, V., De, B., and Penteado, H. L. (2001). Rock-eval 6 technology: performances and developments. Oil & Gas Sci. Technol. - Rev. IFP 56 (2), 111–134. doi:10.2516/ogst:2001013
Chandra, K., Mishra, C. S., Samanta, U., Gupta, A., and Mehrotra, K. L. (1994). Correlation of different maturity parameters in the Ahmedabad-Mehsana block of the Cambay basin. Org. Geochem. 21, 313–321. doi:10.1016/0146-6380(94)90193-7
Dewing, K., and Sanei, H. (2009). Analysis of large thermal maturity datasets: examples from the Canadian Arctic Islands. Int. J. COAL Geol. 77 (3-4), 436–448. doi:10.1016/j.coal.2008.04.009
Du, F., Liu, C., Ning, S., Qiao, J., Zhao, X., He, X., et al. (2024). Analysis of coal-rock characteristics and main controlling factors of jurassic yan 'an Formation in Ordos Basin. Acta Geol. sin., 1–22. doi:10.19762/j.cnki.dizhixuebao.2024283
Espitalie, J. (1986). Use of Tmax as a maturation index for different types of organic matter: comparison with vitrinite reflectance1986.
Espitalie, J., Madec, M., Tissot, B., Mennig, J., and Leplat, P. (1977). “Source rock characterization method for petroleum exploration,” in Proceedings offshore technology Conference1977, offshore technology conference.
Ghassal, B., Littke, R., Sachse, V. F., Sindern, S., and Schwarzbauer, J. (2016). Depositional environment and source rock potential of Cenomanian and Turonian sedimentary rocks of the Tarfaya Basin, Southwest Morocco. Geol. Acta 14, 419–441. doi:10.1344/GeologicaActa2016.14.4.6
Guo, Z., Zhang, L., Chu, M., and Huang, J. (2008). The controlling effect of pre-Jurassic paleogeomorphology on lower Yan an Formation oil reservoir in southern Ordos Basin. J. Palaeogeogr. (01), 63–71.
Hai, L., Mu, C., Xu, Q., Sun, Y., Fan, H., Xie, X., et al. (2022). The sequence stratigraphic division and depositional environment of the jurassic yan’an Formation in the Pengyang area, southwestern margin of the Ordos Basin, China. Energies 15 (14), 5310. doi:10.3390/en15145310
Hanson, A. D., Zhang, S. C., Moldowan, J. M., Liang, D. G., and Zhang, B. M. (2000). Molecular organic geochemistry of the tarim basin, northwest China. AAPG Bull. 84 (8), 1109–1128. doi:10.1306/a9673c52-1738-11d7-8645000102c1865d
He, W., Tao, S., Hai, L., Tao, R., Wei, X., and Wang, L. (2022). Geochemistry of the tanshan oil shale in jurassic coal measures, western Ordos Basin: implications for sedimentary environment and organic matter accumulation. Energies 15, 8535. doi:10.3390/en15228535
Huang, W.-Y., and Meinschein, W. G. (1979). Sterols as ecological indicators. Geochimica Cosmochimica Acta 43 (5), 739–745. doi:10.1016/0016-7037(79)90257-6
Jewell, D. M., Albaugh, E. W., Davis, B. E., and Ruberto, R. G. (1974). Integration of chromatographic and spectroscopic techniques for the characterization of residual oils. Industrial and Eng. Chem. Fundam. 13 (3), 278–282. doi:10.1021/i160051a022
Jewell, D. M., Weber, J. H., Bunger, J. W., Plancher, H., and Latham, D. R. (1972). Ion-exchange, coordination, and adsorption chromatographic separation of heavy-end petroleum distillates. Anal. Chem. 44, 1391–1395. doi:10.1021/ac60316a003
Large, D. J., and Giże, A. P. (1996). Pristane/phytane ratios in the mineralized Kupferschiefer of the Fore-Sudetic Monocline, southwest Poland. Ore Geol. Rev. 11, 89–103. doi:10.1016/0169-1368(95)00017-8
Li, J., Wu, K., Liu, M., Kong, L., Ma, J., and Liu, F. (2022). Origin of H2S in jurassic oil associated gas in Pengyang area, Ordos Basin. Nat. Gas. Geosci. 33 (03), 472–483. doi:10.11764/j.issn.1672-1926.2021.12.007
Liu, L., Liu, J., Li, Y., and Wei, M. (2010). Analysis of main controlling factors of hydrocarbon accumulation in jurassic yanan Formation in Pengyang area, Ordos Basin. J. Earth Sci. Environ. 32 (03), 263–267.
Liu, X., Wang, F., Baojun, L., Jingchun, T., Ting, S., Jiong, M., et al. (2020). Factors controlling hydrocarbon accumulation in jurassic reservoirs in the southwest Ordos basin, NW China. Acta Geol. Sin. 94 (2), 467–484. doi:10.1111/1755-6724.14332
Peters, K., Walters, C., and Moldowan, J., (2005). The biomarker guide, vol. 2: Biomarkers in petroleum systems and Earth history.
Peters, K., Walters, C., and Moldowan, J. (2007). The Biomarker Guide: volume 2, Biomarkers and isotopes in petroleum systems and earth history. Cambridge University Press.
Peters, K. E., and Cassa, M. R. (1994). in The petroleum system. From source to trap. Editors L. B. Magoon, and W. G. Dow (Tulsa: American Association of Petroleum Geologists), 93–120.Applied source-rock geochemistry
Peters, K. E., and Moldowan, J. M. (1993). “The biomarker guide: interpreting molecular fossils in petroleum and ancient sediments,”. Englewood Cliffs: Prentice Hall.
Peters, K. E., Walters, C. C., and Moldowan, J. M. (2004). The biomarker guide: volume 1: biomarkers and isotopes in the environment and human history. Cambridge: Cambridge University Press.
Philp, R. P., Fan, P., Lewis, C. A., Zhu, H., and Wang, H. D. (1991). Geochemical characteristics of oils from the chaidamu, shanganning and jianghan basins, China. J. Southeast Asian Earth Sci. 5, 351–358. doi:10.1016/0743-9547(91)90048-3
Radke, M., Willsch, H., and Welte, D. H. (1980). Preparative hydrocarbon group type determination by automated medium pressure liquid chromatography. Anal. Chem. 52 (3), 406–411. doi:10.1021/ac50053a009
Ramanampisoa, L. R., and Radke, M. (1995). Extractable aromatic hydrocarbons in a short-term organic cycle of the Kimmeridge Clay formation, Yorkshire (UK): relationship to primary production and thermal maturity. Org. Geochem. 23 (9), 803–817. doi:10.1016/0146-6380(95)80002-9
Rubinstein, I., Sieskind, O., and Albrecht, P. (1975). Rearranged sterenes in a shale: occurrence and simulated formation. J. Chem. Society-perkin Trans. 1 (6), 1833–1836. doi:10.1039/p19750001833
Safaei-Farouji, M., Kamali, M. R., Rahimpour-Bonab, H., Gentzis, T., Liu, B., and Ostadhassan, M. (2021). Organic geochemistry, oil-source rock, and oil-oil correlation study in a major oilfield in the Middle East. J. Petroleum Sci. Eng. 207, 109074. doi:10.1016/j.petrol.2021.109074
Seifert, W. K., and Michael Moldowan, J. (1978). Applications of steranes, terpanes and monoaromatics to the maturation, migration and source of crude oils. Geochimica Cosmochimica Acta 42 (1), 77–95. doi:10.1016/0016-7037(78)90219-3
Sinninghe Damsté, J. S., Kenig, F., Koopmans, M. P., Koster, J., Schouten, S., Hayes, J. M., et al. (1995). Evidence for gammacerane as an indicator of water column stratification. Geochimica cosmochimica acta 59 (9), 1895–1900. doi:10.1016/0016-7037(95)00073-9
Summons, R. E., Hope, J. M., Swart, R., and Walter, M. R. (2008). Origin of Nama Basin bitumen seeps: petroleum derived from a Permian lacustrine source rock traversing southwestern Gondwana. Org. Geochem. 39, 589–607. doi:10.1016/j.orggeochem.2007.12.002
Theuerkorn, K., Horsfield, B., Wilkes, H., Primio, R. d., and Lehne, E. (2008). A reproducible and linear method for separating asphaltenes from crude oil. Org. Geochem. 39, 929–934. doi:10.1016/j.orggeochem.2008.02.009
Tissot, B. P., and Welte, D. H. (1979). B. P. Tissot & D. H. Welte 1978. Petroleum Formation and Occurrence: a New Approach to Oil and Gas Exploration.xviii + 538 pp., 243 figs, 70 tables. Berlin, Heidelberg, New York: Springer-Verlag. Price DM 79.00; U.S. $39.50. ISBN 3 540 08698 6. Geol. Mag. 116 (3), 243–244. doi:10.1017/s0016756800043685
Vandenbroucke, M., and Largeau, C. (2007). Kerogen origin, evolution and structure. Org. Geochem. 38 (5), 719–833. doi:10.1016/j.orggeochem.2007.01.001
Volkman, J. K. (1986). A review of sterol markers for marine and terrigenous organic matter. Org. Geochem. 9, 83–99. doi:10.1016/0146-6380(86)90089-6
Wang, D., Li, Z., Lv, D., Liu, H., Wang, P., and Feng, T. (2016). Co-association of coal and oil shale and its sequence stratigraphic characteristics in continental faulted basins. Earth Sci. 41 (03), 508–522. doi:10.3799/dqkx.2016.042
Wu, X., Zhang, Y., Zhang, Y., Ying, C., Tian, X., and Yang, G., (2009). Characteristics of Jurassic reservoirs and prediction of favorable areas in Pengyang area, Ningxia: Petrochemical Industry Application, v. 28, no. 03, p. 56–58.
Xian, W., Mu, C., Mei, C., and Qiang, T. (2023). Genesis and exploration potential of middle Jurassic coal measure oil shale in Tanshan area. Guyuan, Ningxia Inn. Mong. Petrochem. Ind. 49 (12), 94–97.
Yang, J., Xu, Q., Mu, C., Hai, L. F., Xu, H., and Yang, Z. (2024). Development characteristics and paleoenvironment restoration of Jurassic Yan 'an Formation oil shale in the southwest margin of Ordos Basin: geological science and technology Bulletin, 1–16.
Yang, S., and Horsfield, B. (2020). Critical review of the uncertainty of Tmax in revealing the thermal maturity of organic matter in sedimentary rocks. Int. J. Coal Geol. 225, 103500. doi:10.1016/j.coal.2020.103500
Yu, L., Chen, J., Jin, S., Chen, Z., Guo, X., and Che, F. (2012). Reservoir characteristics and evaluation of Yan 'an Formation and Chang 3 Formation in Pengyang area of Ordos Basin: Lithologic hydrocarbon reservoirs, 24 06, 49–53+59.
Yunker, M. B., Belicka, L. L., Harvey, H. R., and Macdonald, R. (2005). Tracing the inputs and fate of marine and terrigenous organic matter in Arctic Ocean sediments: A multivariate analysis of lipid biomarkers. Deep-sea Res. Part Ii-topical Stud. Oceanogr. 52, 3478–3508. doi:10.1016/j.dsr2.2005.09.008
Zhao, H., Li, J., Miao, P., Chen, L., Zhang, B., Zhu, Q., et al. (2020). Mineralogical study of Pengyang uranium deposit in the southwest margin of Ordos Basin and its indication to regional mineralization. Geotect. Metallogenia 44 (04), 607–618. doi:10.16539/j.ddgzyckx.2020.04.005
Keywords: Ordos basin, Yan ’an Formation, source rocks, biomarker, oil shale
Citation: Zhu Y, Tan W, Hai L, Mu C, Wang K and Li M (2025) Organic geochemical characteristics of Jurassic Yan ’an Formation source rock in Pengyang area of southwestern Ordos basin. Front. Earth Sci. 13:1536268. doi: 10.3389/feart.2025.1536268
Received: 28 November 2024; Accepted: 09 January 2025;
Published: 04 February 2025.
Edited by:
Jiawang Ge, Southwest Petroleum University, ChinaReviewed by:
Ren Wang, China University of Geosciences Wuhan, ChinaYufu Han, Tianjin University, China
Copyright © 2025 Zhu, Tan, Hai, Mu, Wang and Li. This is an open-access article distributed under the terms of the Creative Commons Attribution License (CC BY). The use, distribution or reproduction in other forums is permitted, provided the original author(s) and the copyright owner(s) are credited and that the original publication in this journal is cited, in accordance with accepted academic practice. No use, distribution or reproduction is permitted which does not comply with these terms.
*Correspondence: Wenmei Tan, MTgyMDM2NzM4MjBAMTYzLmNvbQ==