 Diwei Hua
 Dawei Jiang
 Shimin Zhang
- National Institute of Natural Hazards, Ministry of Emergency Management of China, Beijing, China
River terraces are essential objects for studying Quaternary landforms and active tectonics. Previous researchers often identified river terraces formed in different eras by height and landmark strata. However, terraces are usually scattered in regions with severe erosion, making comparing terraces of the same level challenging. Some sedimentary analyses, including abrasion of gravels, hardness of gravels, and weathering rind thickness, have been applied to compare terraces but proved limited and not quantitative. In this study, we interpreted and surveyed the terraces of the Qingyi River, which runs through the Longmen Shan Mountain in the eastern edge of the Tibetan Plateau. A systematic approach was presented to quantitatively compare river terraces in regions of high precipitation and erosion. Firstly, we summarized the interfering factors on sedimentation, the method of collecting samples, and the choice of testing materials. Secondly, weathering indicators derived from major element testing were applied to compare terraces of different ages. Finally, we concluded the relationship between weathering degree, the terrace age, and the terrace height. The results indicated that, within the terrace age range of 300 ka, the sediments in the terrace of the Qingyi river show a linearly increasing weathering trend. It proved that the degree of chemical weathering indicated by major elements can be well applied to studying river terraces and reflect the weathering differences between terraces of different ages, solving the problem of quantitative terrace comparison. Moreover, by combining the analysis of paleoclimate data, we reconstructed the weathering mechanisms of the terraces, which are controlled by the alternation between glacial and interglacial stages.
1 Introduction
Alluvial morphological surfaces, such as alluvial fans and terraces, can record ancient locations and heights of large rivers (England and Molnar, 1990; Whipple et al., 1999; Whipple et al., 2016). According to the Quaternary deformation of terraces, researchers have studied regional tectonic activities (Kirby and Whipple, 2001) and quantitatively calculated crustal shortening rates (Lavé and Avouac, 2000; Li et al., 2013; Saint-Carlier et al., 2016). During the previous studies, analyses of the terraces have mainly focused on geometry and chronology (Bridgland and Westaway, 2008; Gold et al., 2017; Trexler et al., 2020). Earlier studies on structural issues related to river terraces have generally relied on spatial elevation data or marker horizons as methods for classifying terraces (Pan et al., 2003; Avouac et al., 2015). However, the terraces are always fragmentary in some regions with humid climates. Especially without a marker bed, researchers encounter difficulties in convincingly distinguishing the terraces of different ages. Therefore, developing a quantitative method to differentiate river terraces of varying ages represents a pressing challenge in terrace research.
Some studies have presented that terraces’ weathering degree efficiently correlates with terraces of various ages (Brewer and Walker, 1969; Bradley, 1970; Knuepfer, 1988; Souri and Watanabe, 2017). Researchers have assessed weathering degree of river sediments mainly by analyzing characteristics of gravels, including the abrasion of gravels (Bradley, 1970), the weathering rind thickness (Knuepfer, 1988), the shape and weathering of sandstone (Nishiyama, 2002), the hardness of gravels (Alberti et al., 2013), and the bulk densities of quartzite pebbles (Viveen et al., 2013). Nevertheless, certain influencing factors remain unavoidable, including the lithological variation of river gravels, the impact of gravel size on the weathering process, and the sample quantity at individual sites. Furthermore, in the previous studies, the depths at which samples were collected varied widely. Some researchers have collected samples at a depth of 0–5 m on the outcrops (Viveen et al., 2013), while others have collected samples in the whole outcrops (Bradley, 1970; Knuepfer, 1988; Alberti et al., 2013). The change in weathering degree with depth was rarely noticed.
Rock weathering is a critical process in earth’s surface dynamics, which alters the mineral composition and structure of rocks through chemical, physical, and biological processes. Major elements (such as Si, Al, Fe, Ca, Mg, etc.) experience significant changes during weathering, making their analysis a crucial method for evaluating the degree of rock weathering (Nesbitt and Young, 1982). In recent years, substantial advancements have been made in the use of major element analysis to assess weathering intensity. Through quantitative analysis of major elements in rock samples across different weathering stages, researchers have revealed distinct elemental distribution patterns at each stage. For example, silicon (Si) and aluminum (Al) generally exhibit high stability during weathering, whereas iron (Fe), magnesium (Mg), and calcium (Ca) are more susceptible to dissolution or alteration into secondary minerals, thus reflecting the degree of weathering (Qiu et al., 2014). These elemental variations not only provide insights into the dynamics of the weathering process but also offer important information regarding the material cycling within earth’s surface processes (Liu et al., 2009). Major element analysis is frequently combined with other geochemical techniques, such as isotope analysis and mineralogical studies, to refine the precision of weathering process evaluations. Studies suggest that weathering indices (e.g., CIA, Chemical Weathering Index) and elemental ratios (e.g., Al/Si, Na/K) can quantify the extent of weathering in rocks and reveal the spatial heterogeneity of the weathering process (Singh, 2009). Overall, major element analysis has become a widely used and effective approach for evaluating rock weathering.
Therefore, we conducted this study in the Qingyi River to ascertain the weathering degree of the terraces using the method of major element testing. The Qingyi River flows through the Longmen Shan area on the eastern edge of the Tibetan Plateau, which has a humid climate and is an ideal subject for terrace research (Figure 1). Furthermore, we proposed a systematic strategy to assess the ability to distinguish river terraces of varying ages through the analysis of weathering processes using major element testing. Firstly, the weathering variation with depth is analyzed to decide the position of collecting samples on a terrace outcrop. The matrices that fill the crevices between the gravels are collected as the testing material because they are well-mixed and not limited to specific lithology. Secondly, after acquiring the major element data for river terraces of varying ages, indicators derived from major elements are applied to quantitatively classify the terraces of different ages. The results indicate that various major element weathering indices can accurately and quantitatively distinguish river terraces of varying ages. Thirdly, we further conducted a detailed analysis of the correlation between the weathering indices of river terraces of varying ages and their age distribution as well as terrace elevation. The analysis results show that, over time scales extending up to 300 ka or more, the weathering intensity indices of the terraces exhibit a strong linear correlation with terrace age, while the degree of weathering shows only a generally similar trend with terrace elevation.
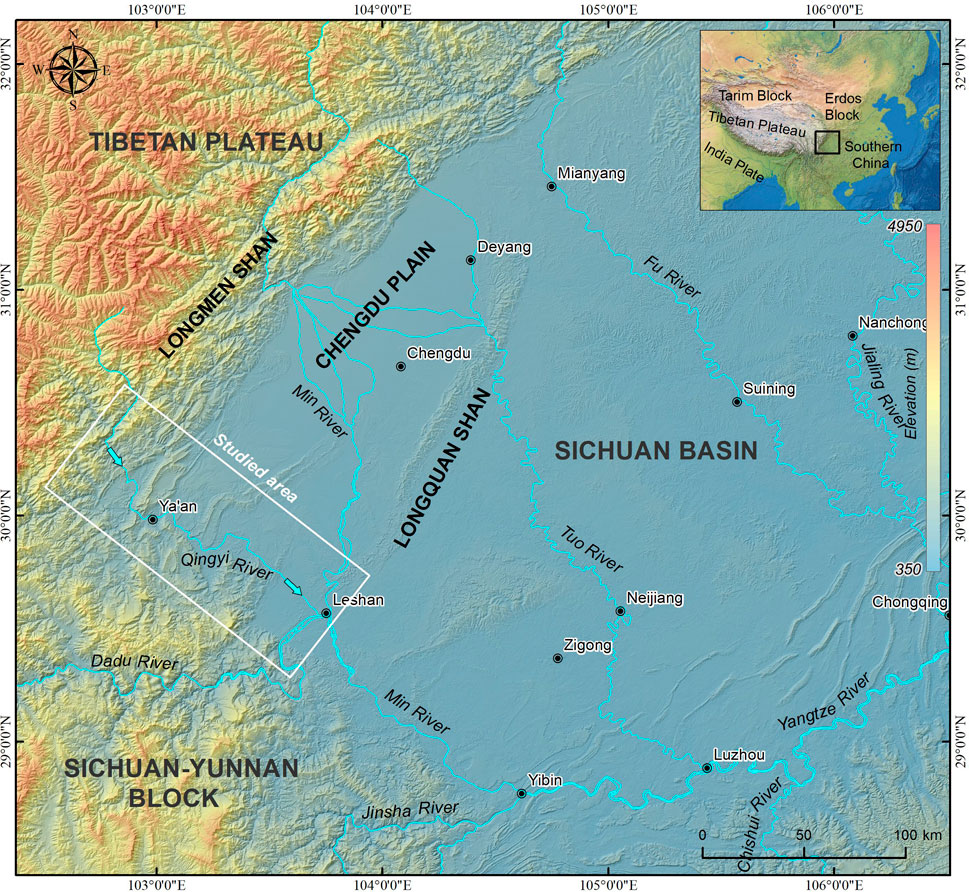
Figure 1. Geographical map of the Qingyi River within the Longmen Shan region on the eastern Tibetan Plateau.
2 Geological setting
The Longmen Shan Mountains on the eastern edge of the Tibetan Plateau are the boundary tectonic belt between the Tibetan Plateau and the Southern China Block. They have undergone three tectonic stages: the formation of the Proterozoic basement, the extension of the passive continental margin from the late Proterozoic to the Triassic, and the thrust-nappe orogeny in the Mesozoic and Cenozoic eras, forming the current geomorphic pattern (Figure 1) (Royden et al., 2008; Wang et al., 2012). The Longmen Mountains area has dense river networks and a humid climate. The Qingyi River originates in Baoxing, Tianquan, and Yingjing and has multiple tributaries. It flows southeast through Hongya, Jiajiang, and Leshan at the exit of the Ya’an Mountain (Jiang et al., 2016). The Qingyi River basin contains six terrace levels, ranging from low to high: T1–T6. Terraces T1–T4 are widespread throughout the basin, while T5 and T6 are localized, found in the upper to middle reaches. The Qingyi River has a narrow valley in the upper mountainous area with a large river slope. Terraces are mainly developed in areas with slightly wider valleys, such as Zhonggang Village, Yongfu Township, Longdong Town, Wulong Town, and Baoxing County. After flowing through Baoxing town, the Qingyi River enters the low mountain and hilly areas, where the valley widens and the river slope decreases. In the lower river reaches of Ya’an, the Qingyi River flows into a relatively flat foreland, where the valley widens significantly, resulting in the development of well-formed terraces with expansive and continuous surfaces (Figure 2).
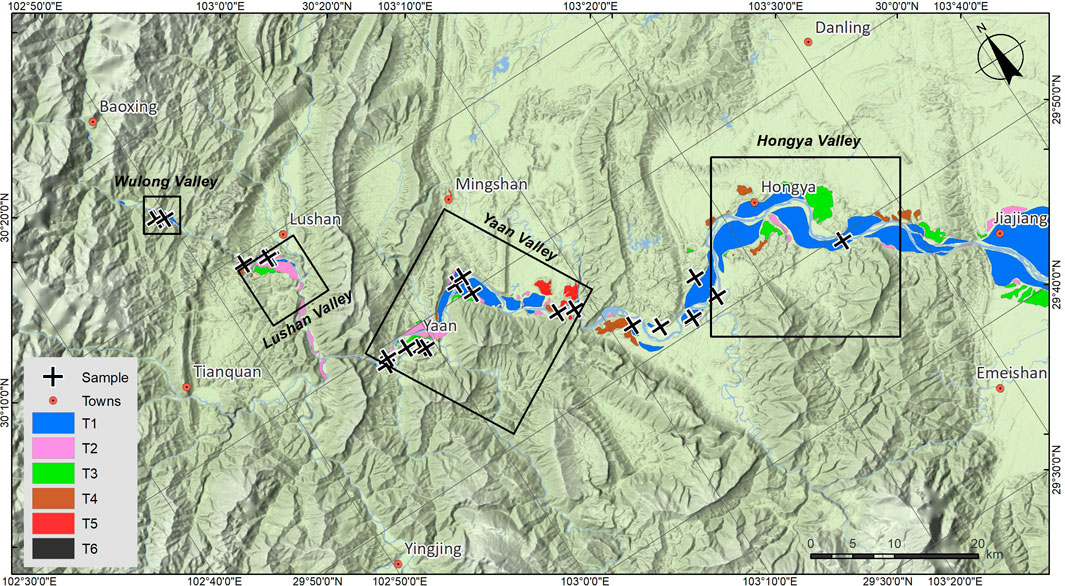
Figure 2. Distribution map of the major element samples on the different terraces along the Qingyi River, which runs through the southern Longmen Shan area, eastern Tibetan Plateau. The extent of this figure is marked in Figure 1.
3 Materials and methods
3.1 Interpretation and field survey
We initially performed a detailed analysis of the river terraces along the Qingyi River, employing a 12.5-meter resolution Advanced Land Observing Satellite (ALOS) digital elevation model combined with high-resolution satellite imagery to comprehensively identify terrace surfaces on both riverbanks and to statistically assess their relative elevations. Fieldwork was subsequently conducted to validate the morphology and relative elevations of these terraces. During field measurements, we employed a Global Positioning System (GPS) equipped with network real-time kinematic (RTK) differential functionality, capable of achieving a planar accuracy of 5 cm and an elevation accuracy of 8 cm, enabling high-precision surveying. Besides, we conducted field measurements of several geological profiles across river channels along the Qingyi River to analyze the distribution, terrace elevations, sediment thickness, and other relevant characteristics. According to the field survey, the terraces of the Qingyi River are spatially discontinuous because of heavy erosion. Tectonic activities further changed the height of these discontinuously distributed terraces. Terraces of different ages are difficult to distinguish during field surveys. However, in the process of terrace profile analysis, it was found that there were specific differences in terrace sediments of different ages, mainly reflected in the hardness of gravel and the properties of matrix sand filled between gravels. The older the terrace, the stronger the degree of fragmentation, and the corresponding matrix is more cemented and clay-like. In addition, there are apparent differences in the color of matrix sand between gravels of different ages in terrace sediments. These characteristics probably reflect the attributes of terrace sediments becoming more weathered with increasing age. Therefore, we hope to compare the weathering degree of river terraces quantitatively. To realize the comparison work, a few problems must be solved.
3.2 Sample collecting method
The primary challenge in sampling major elements is determining the appropriate method for selecting the material to be analyzed. An ideal sample should accurately represent the average degree of weathering of a terrace surface. Through the features of terrace outcrops, it can be seen that the gravel’s degree of weathering reflects the terrace’s age. In the high terraces, the gravels are fragmented, whereas those in the lower terraces remain largely intact. The sandstones and mudstones in terraces T5 and T6 have weathered into mud (Jiang et al., 2016; Jiang et al., 2022). However, assessing the degree of gravel weathering is challenging, primarily due to the heterogeneous provenance of the gravels. Some are sourced from distant sedimentary deposits in the river’s upper reaches, while others come from proximal deposits in nearby tributaries. Consequently, there is no quantitative means of judging the degree of gravel weathering (Alberti et al., 2013; Nishiyama, 2002). However, due to the long-distance transportation and thorough mixing, the matrix sand filling the interstices between gravels is relatively uniform and can more generally represent the terrace sediments (Jennings and Shulmeister, 2002; Chambers et al., 2013). Therefore, we analyze the weathering degree of the matrix sand between gravels and further solve the problem of quantitative terrace comparison.
Another significant issue is determining the appropriate depth for sample collection. Most sedimentary terraces have a typical binary structure. Previous studies on terraces have found that mountain rivers often experience basin-wide floods, resulting in mixed flood sediments deposited on the top of the binary structure. This sediment type is called Slackwater Deposits and Paleostage Indicators (SWD-PSI) (Kochel and Baker, 1982; Baker, 1987; Baker, 2008). These flood deposits are often younger and more variable in age, and their sediments cannot represent the age of the original sediments of the terraces, which usually causes the problem of terraces being too young in terrace chronology studies (Lavé and Avouac, 2000) (Figure 3A). Therefore, we avoided flood and floodplain deposits during sampling. On the other hand, in our previous study, we conducted systematic sampling along the depth of a terrace near Qingshen County, collected sand filled between gravels as major element test samples, and analyzed the variation characteristics of the weathering degree of a fine-grained matrix with depth, to determine a suitable scheme for the sample depth of terrace weathering degree research (Jiang et al., 2021). We observed a gradual decrease in the weathering index from the surface to greater depths in the profile. Above a depth of 2 m, the weathering degree is high, and the weathering intensity tends to be consistent. Below 2 m, it begins to show a linear decreasing trend. At a depth of about 10 m, the weathering index decreases to 50, and no more extended changes (Figure 3B). This indicates that samples collected within 2 m from the ground surface can better represent the maximum weathering degree of the terrace (Jiang et al., 2021). In this study, samples were collected from the upper section of the gravel layer beneath the floodplain deposits, along with sand that filled the spaces between the gravels, to be used as the testing material.
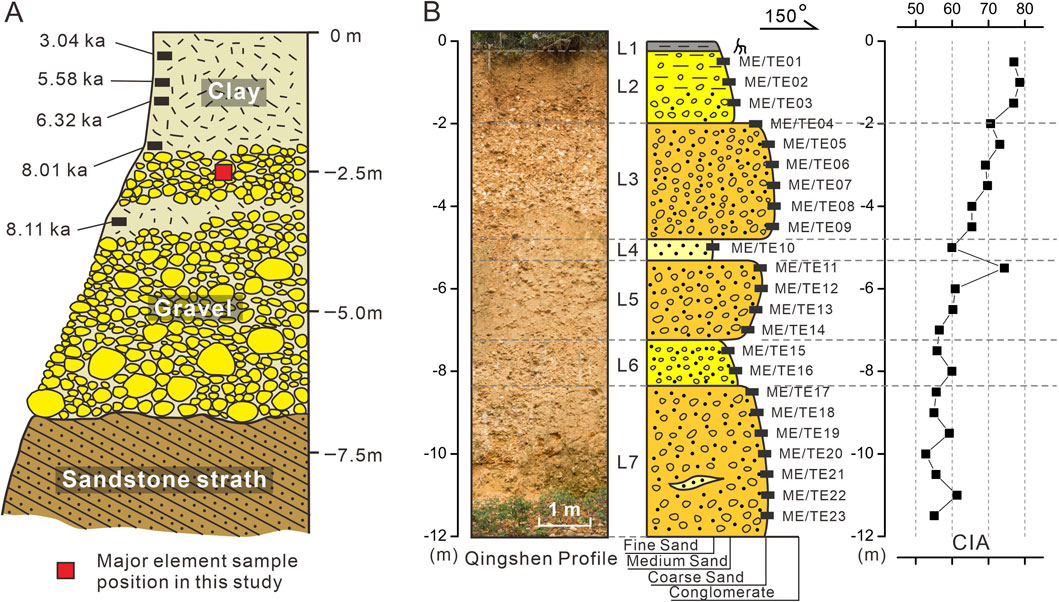
Figure 3. Sample collecting position on a terrace outcrop. (A) The sediment age of sand on a terrace profile influenced by floods, modified from (Lavé and Avouac, 2000). (B) The relationship between the weathering degree of fine-grain sediments and depth which was modified from (Jiang et al., 2021). The CIA is the abbreviation of Chemical Index of Alteration, which was used to calculate the degree of weathering (Nesbitt and Young, 1982; Mclennan, 1993). Code names of ME01-ME23 mean major element samples, and that of TE01-TE23 mean trace element samples (Jiang et al., 2021).
3.3 Major element test
Major elements experience significant changes during weathering, making their analysis a crucial method for evaluating the degree of rock weathering (Nesbitt and Young, 1982; Singh, 2009). In Quaternary geological research, major elements are extensively applied to investigate the weathering processes of paleosols (Wang and Miao, 2006; Buggle et al., 2011; Song et al., 2018; Wang et al., 2023). In the studies focusing on riverbed and terrace sediment deposits, the major element is usually applied in analyzing river provenance, source area tracing, regional tectonic evolution, river system evolution, and river pollution (Potter, 1978; Potter, 1994; Sarin et al., 1989; Dupré et al., 1996; Canfield, 1997; Vital and Stattegger, 2000). Few studies have specifically explored the spatiotemporal distribution characteristics of major elements in river terrace sediments. This paper used the major element testing to ancient river sediments in terraces of different ages to estimate their weathering degree. The major element testing was completed at the Key Laboratory of Compound and Chained Natural Hazards Dynamics, Ministry of Emergency Management of China.
First, 0.7 g of powdered rock sample was mixed with 7 g of X-ray fluorescence flux, which consisted of anhydrous lithium tetraborate, anhydrous lithium metaborate, and lithium fluoride. Next, 3–5 drops of lithium bromide solution were added to the mixture. The samples were then preheated in a high-frequency furnace for 6 min, followed by heating to 950°C, where they were held for 7 min. After the sample is melted and mixed evenly, it will become homogeneous glasses after 9 min of self-cooling and air cooling. Then, samples were analyzed on a Panalytical Axios X-ray fluorescence spectrometer. The national standard GSR-1 was used for analysis, and the working conditions were 50 kV and 60 mA. Finally, 0.7 g of the sample was weighed into a crucible, heated in a Mabo furnace, then placed directly into a dryer. After drying, the sample was weighed again, and the loss on ignition was calculated. The loss on ignition refers to the mass lost by a sample when heated to high temperatures, primarily due to the volatilization of volatile substances (such as moisture and carbon dioxide) and the combustion of organic matter (Heiri et al., 2001). In geochemical experiments, the determination of loss on ignition helps to ensure the complete removal of moisture from the sample prior to testing, as well as evaluate the compositional changes resulting from high-temperature exposure (Santisteban et al., 2004).
To quantitatively assess weathering, the Chemical Index of Alteration (CIA) (Nesbitt and Young, 1982; Mclennan, 1993), which was shown to be effective in fluvial sediments (Singh et al., 2005; Caceres et al., 2013), was used to calculate the degree of weathering. The detailed parameters in this formula merit attention, as they are primarily based on the specific experimental results of previous researchers (Nesbitt and Young, 1982). The term CaO* represents the molar content of calcium oxide in silicate minerals, excluding contributions from carbonate and phosphate sources (Nesbitt and Young, 1989; Nesbitt et al., 1996). Given that CaO and Na2O typically occur in similar proportions in silicates, the calculation of CaO* follows a specific method. If the molar concentration of CaO is lower than that of Na2O, the value of m(CaO) is equal to m(CaO*). However, if the concentration of CaO exceeds that of Na2O, then m(CaO*) is set equal to m(Na2O) (Mclennan, 1993); this correction method is applied in the present study. In addition, several weathering indicators were applied to distinguish terrace samples of varying ages, including CIA, Na/K, A-CN-K diagram, A–CNK–FM diagram, S/10-CM-NK diagram, and Pettijohn classification.
4 Results
4.1 Geomorphologic features interpretation and survey results
Through interpretation and field surveys, we found that the upper reaches of the Qingyi River feature a narrow valley and a steep gradient, with terraces mainly developed in the wider sections of the valley, such as Zhonggang Village, Wulong Town, and Lushan County. In the middle reaches, the valley widens, and the river gradient decreases, allowing terraces to develop in both the wide valley and gorge sections. In the lower reaches, the river flows through a relatively flat basin, where the valley widens significantly. The Qingyi River basin contains six terrace levels, labeled from lowest to highest as T1, T2, T3, T4, T5, and T6. Terraces T1–T4 are extensively distributed across the basin and are primarily sedimentary or piedmont terraces. Terraces T5 and T6, which are mostly located in wider sections of the river valley, include erosional terraces in the upper reaches, piedmont terraces in the middle reaches, and are less common in the lower reaches. The terrace development at key locations along the Qingyi River, from the upper to the lower reaches, is summarized below.
Wulong Town is located in a relatively wide river valley area in the upper reaches of the Qingyi River, where six levels of terraces have developed (Figure 4). Among these, T1 is a sediment terrace, T2 and T3 are piedmont terraces, and T4, T5, and T6 are erosional terraces. The elevation of the terraces ranges from 4 to 5 m (T1), 15–16 m (T2), 48–55 m (T3), 85–90 m (T4), 117–120 m (T5), to 148–155 m (T6). The surface of the T1 terrace is flat, approximately 100–200 m wide, with a sediment thickness of about 4 m. It features a river facies binary structure, with well-rounded gravel and a lithology primarily consisting of limestone and quartzite. The T2 terrace surface is about 20–30 m wide, with a sediment thickness of approximately 3 m. The gravel is moderately rounded, and the lithology is mainly limestone. The T3 terrace surface is about 100 m wide, with a sediment thickness of around 5 m. The gravel is moderately rounded, and the lithology is primarily limestone (Figures 4A, C).
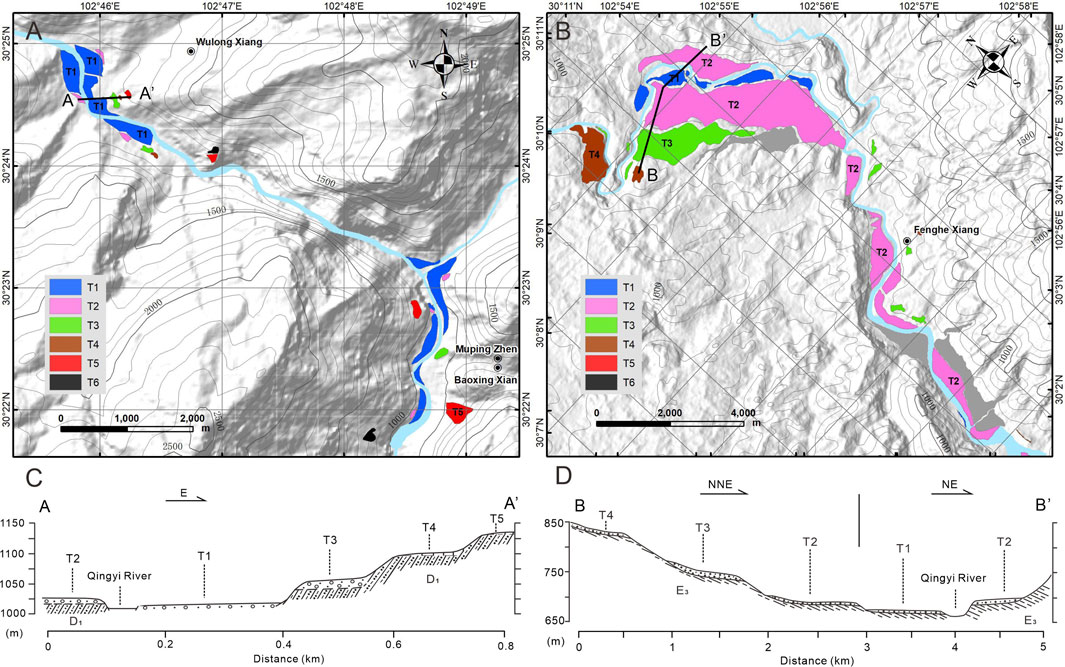
Figure 4. Terrace characteristics of the Wulong and Lushan valleys in the upper reaches of the Qingyi River. The extents of Figures (A, B) are shown in Figure 2. The base map in Figures (A, B) are generated using a 12.5-meter resolution ALOS digital elevation model. Cross section profiles in Figures (C, D) are marked in Figures (A, B), respectively. The legends are the same with Figure 2.
In the Lushan County river valley, located in the upper reaches of the Qingyi River, four levels of terraces are present (Figures 4B, D). The T1–T4 terraces are all piedmont terraces, with elevations ranging from 8 to 13 m (T1), 18–33 m (T2), 85–97 m (T3), and 131–152 m (T4). The T1 terrace forms a narrow strip along both banks of the river, with a sediment thickness of about 4 m and well-rounded gravel. The T2 terrace has a sedimentary layer about 14 m thick, characterized by a typical binary structure, with well-rounded gravel. The T3 terrace has a sediment thickness of 12 m, with well-rounded gravel. The T4 terrace features a sedimentary layer with a visible thickness of 12.7 m, where the gravel, composed of sandstone and mudstone, is weathered and fragmented (Figures 4B, D).
In the Ya’an river valley of the middle reaches of the Qingyi River, six levels of terraces are preserved, making it the section of the Qingyi River basin with the most complete terrace preservation (Figures 5A, C). The terrace elevations are as follows: T1 is 4–8 m, T2 is 15–18 m, T3 is 48–59 m, T4 is 88–92 m, T5 is 120–130 m, and T6 is 201–205 m. The T1 terrace has a sediment thickness of about 5 m, with gravel primarily composed of granite and diorite. The T2 terrace has a sediment thickness of about 11 m, with well-sorted and well-rounded gravel. The T3 terrace has a sediment thickness of about 9 m. The T4 terrace has a sediment thickness of approximately 12 m, with lithology dominated by sandstone and quartzite, and heavily weathered sandstone gravel. The T5 terrace has a sediment thickness of about 18 m, with gravel consisting of quartzite, sandstone, mudstone, and minor igneous rock, showing a high degree of weathering. The T6 terrace has a sediment thickness of about 6 m, with gravel composed of quartzite and mudstone (Figures 5A, C).
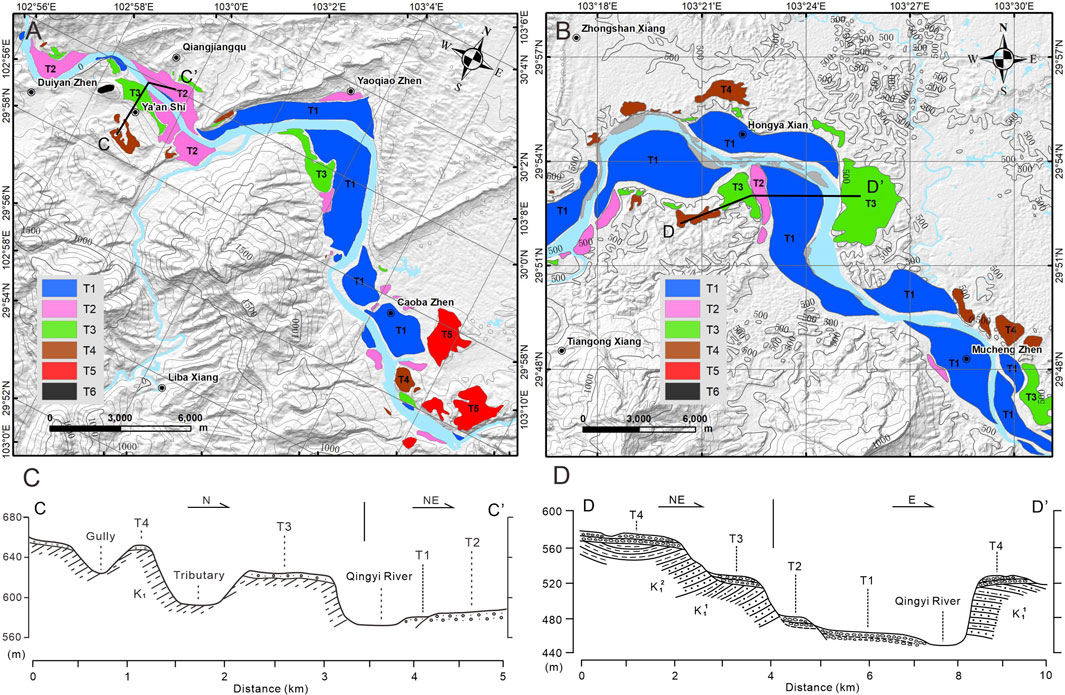
Figure 5. Terrace characteristics of the Yaan and Hongya valleys in the lower reaches of the Qingyi River. The extents of Figures (A, B) are shown in Figure 2. The base map in Figures (A, B) are generated using a 12.5-meter resolution ALOS digital elevation model. Cross section profiles in Figures (C, D) are marked in Figures (A, B), respectively. The legends are the same with Figure 2.
In the Hongya Valley, the elevations of the terrace fronts relative to the current riverbed vary as follows (Figures 5B, D): Terrace T1 lies between 6 and 8 m, Terrace T2 between 21 and 25 m, Terrace T3 between 74 and 81 m, and Terrace T4 between 127 and 132 m. These terraces (T1–T4) are distributed across the basin, with T1 and T2 extending throughout the valley. The exposed gravels mainly consist of sandstone and mudstone, with a reddish-brown sand and silt matrix. Terrace T3 has a more limited distribution, characterized by a gravel layer approximately 16 m thick. The gravels in this layer are primarily quartzite, sandstone, and mudstone, with a brown, clayey sand matrix. Terrace T4 is concentrated around the valley’s highest hills, where the gravel thickness above the bedrock strath reaches up to 20 m. The sediments here are predominantly quartzite and mudstone gravels, with diameters ranging from 10 to 30 cm, embedded in a clay-rich matrix (Figures 5B, D).
4.2 Terraces profile characteristics
To evaluate the weathering extent of the terraces, samples were obtained and analyzed for their major element composition. The sampling sites were located beneath the overbank deposits and at the top of the gravel layers, with the matrices filling the interstitial spaces between the gravels also being sampled. The sample locations are shown in Figure 2, and typical profiles for terraces T1–T6 are provided in Figure 6. According to the profiles, the matrix between the gravels of T1 is black-gray, while T2 is brown-gray, T3 is brown, while T4, T5, and T6 are all reddish-brown. These color variations likely indicate the increasing weathering of terrace sediments with age.
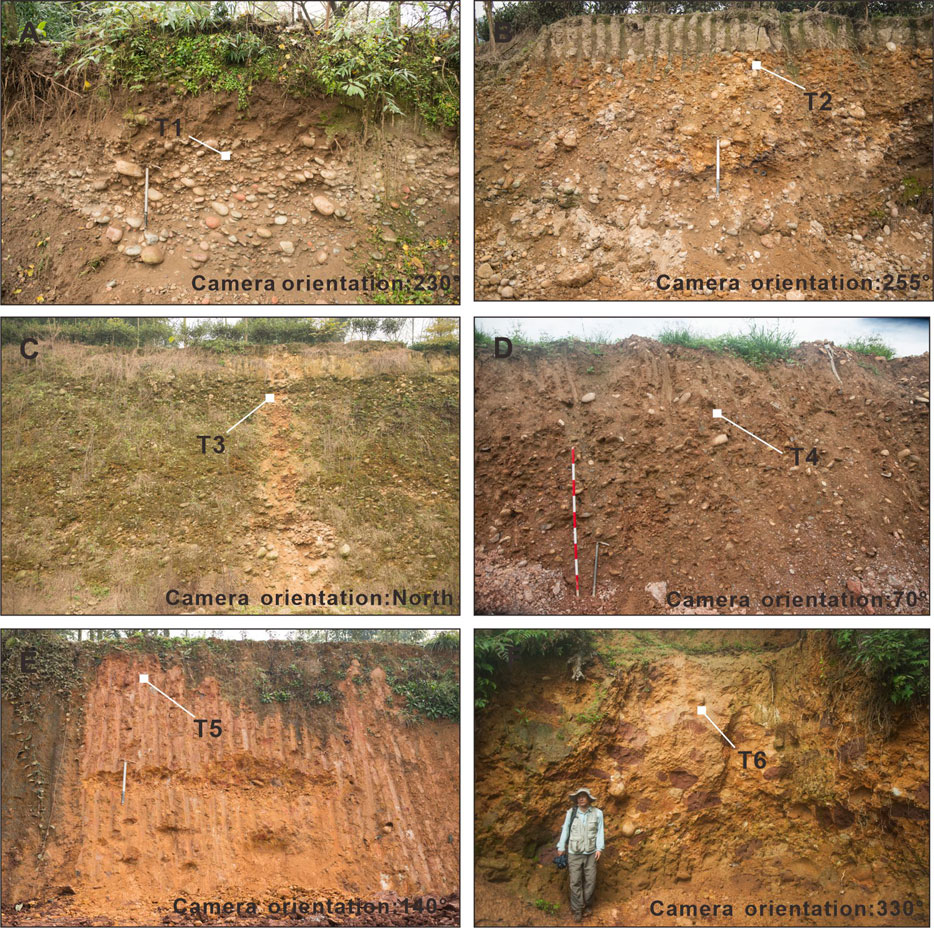
Figure 6. Typical outcrop pictures of terraces T1–T6 in the Qingyi River basin. Panels (A–F) display field photographs of the T1–T6 terraces.
4.3 Major element testing result
In our previously published article (Jiang et al., 2016), we conducted major element testing on the Qingyi River terrace, analyzing 12 samples which were reported in that article. These 12 samples are labeled as m13-m18 and m23-m28 in Table 1. In the current study, we tested the major elements of 33 new samples from the Qingyi River terrace. These samples are labeled as m1-m12, m19-m22, and m29-m45 in Table 1. All these data are listed together in Table 1 for convenience in further data analysis in the following sections. In addition to these results, several representative materials are included for comparison, such as terrigenous shale (Taylor and Mclennan, 1985), world sediments (WS) (Mclennan, 1995), Luochuan loess (Gallet et al., 1996), Xiashu loess (Zhang et al., 2007), western Sichuan loess (Yu et al., 2020), and Xuancheng loess (Hong et al., 2010).
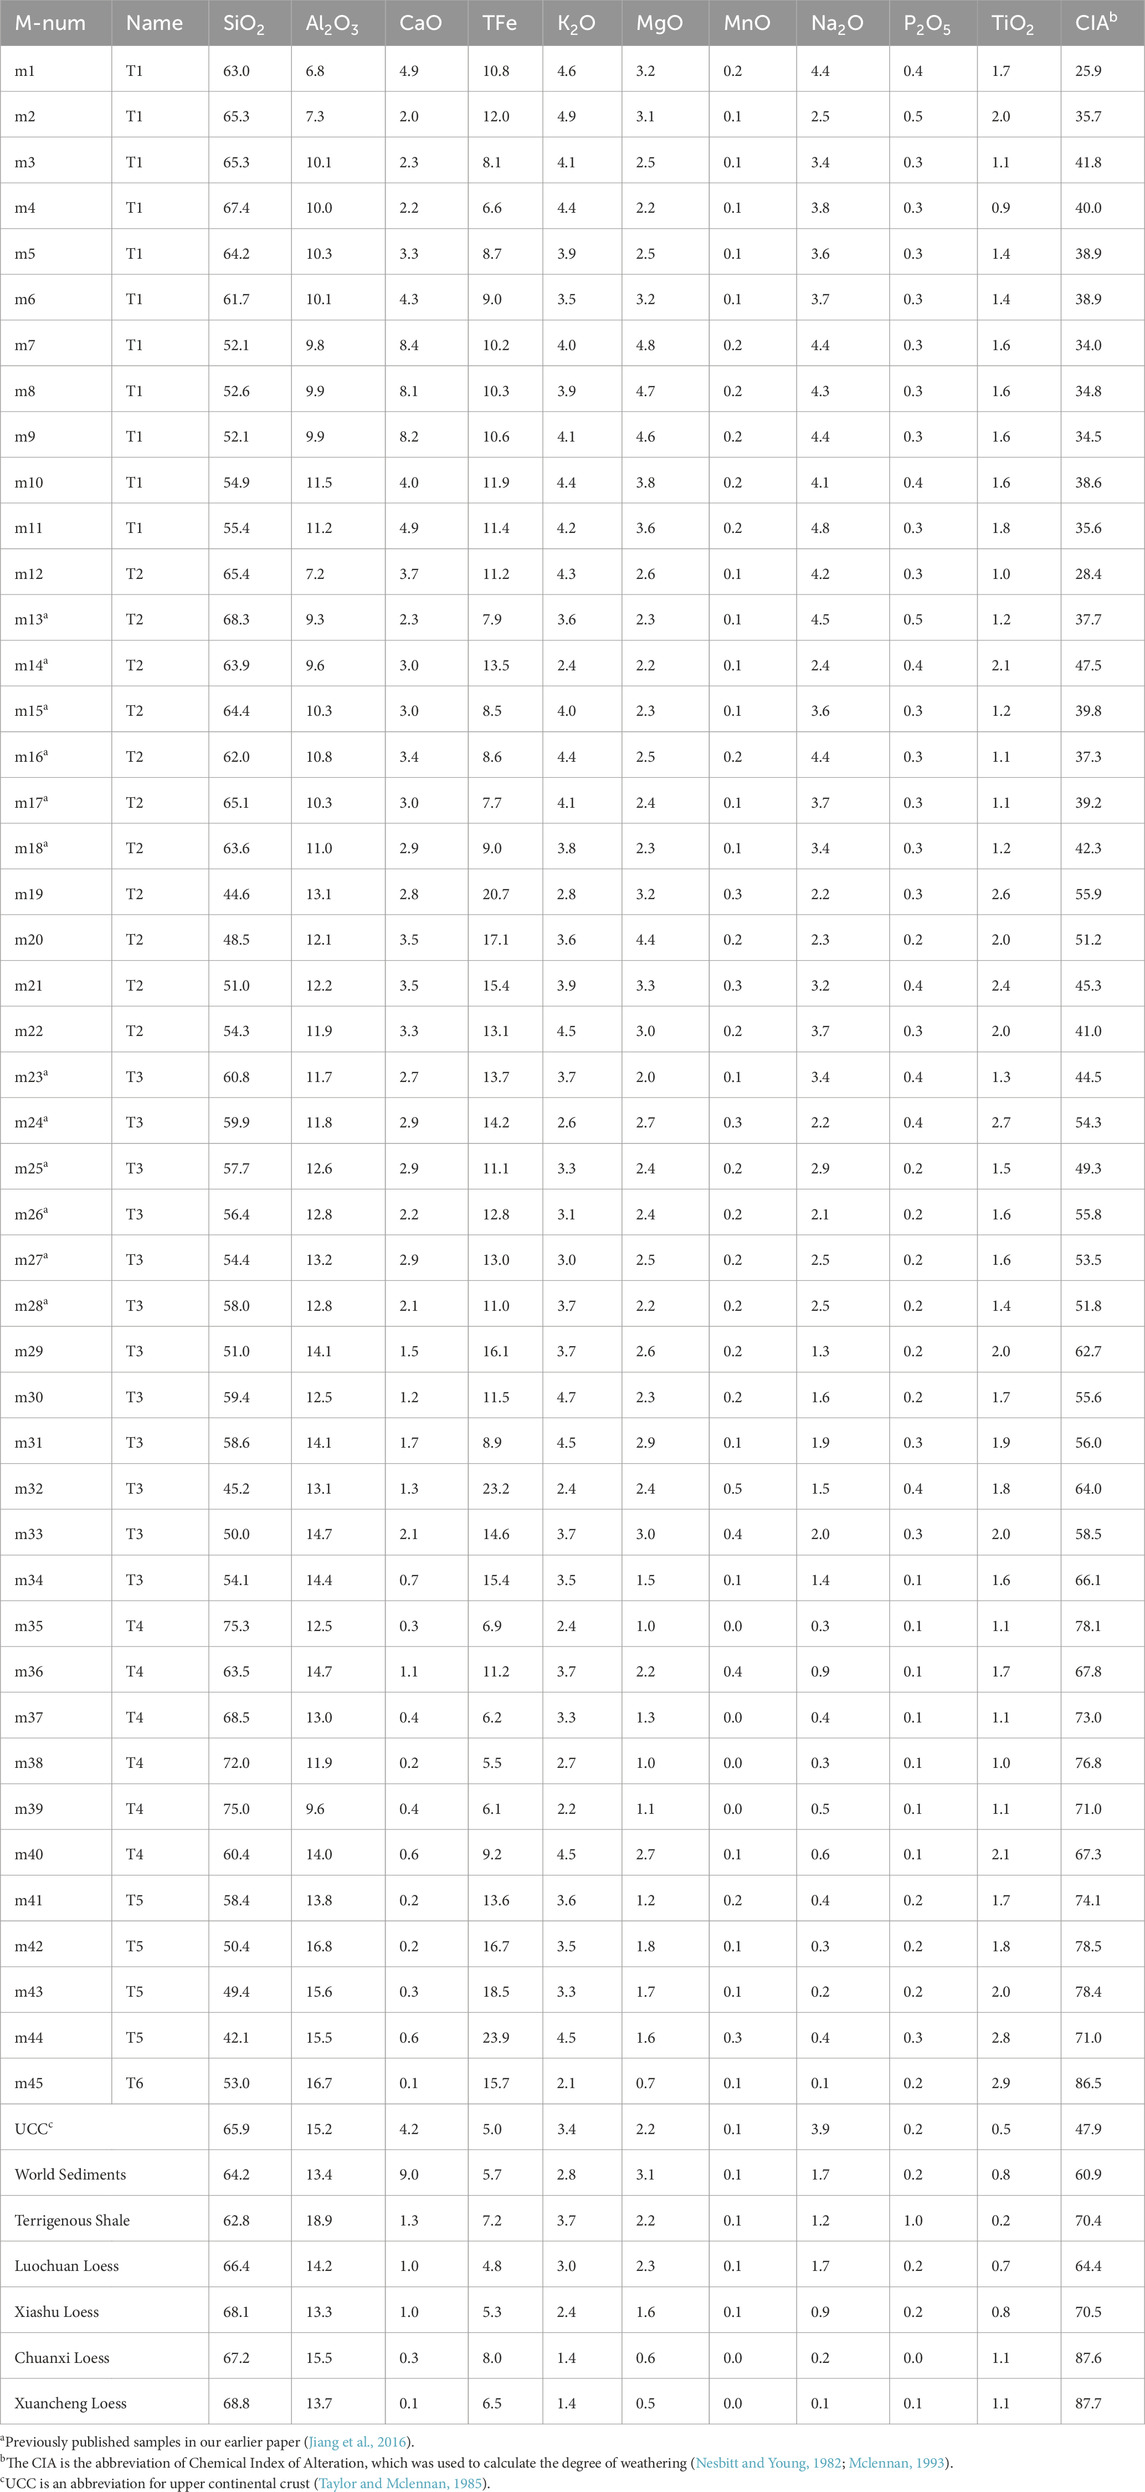
Table 1. The testing results of the bulk elements.
The ratios of average major element concentrations normalized to the upper continental crust content (Taylor and Mclennan, 1985) reveal the variability in elemental distributions across the different terraces (Figure 7). The content of major elements in the samples has the same tendencies, indicating that the samples may have an extensive material source. We also found that the TiO2 and total content of iron oxides (TFe) in samples were more significant than in the content of upper crust materials (UCC). This may be because of the transport of minerals as fine particles, such as biotite. These minerals are more likely to be suspended in the river and thus to be carried into the terrace sediments (Vital and Stattegger, 2000; Singh et al., 2005). Additionally, from terrace T1 to terrace T6, a gradual decrease occurs in the MgO, CaO, Na2O, and K2O contents, which reveals an increasing degree of weathering. As the main rock-forming mineral, the decomposition of feldspar dominates the weathering process. Plagioclase is more easily weathered among the feldspars than orthoclase (Nesbitt et al., 1980). Correspondingly, the weathering process can be divided into three stages: an early stage characterized by the leaching of Na and Ca, a middle stage with the leaching of K, and a late stage marked by the leaching of Si. As the terraces age, the loss of mobile elements becomes more pronounced. Overall, the terrace sediments in the Qingyi River basin appear to have undergone weathering primarily during the early and middle stages (Figure 7).
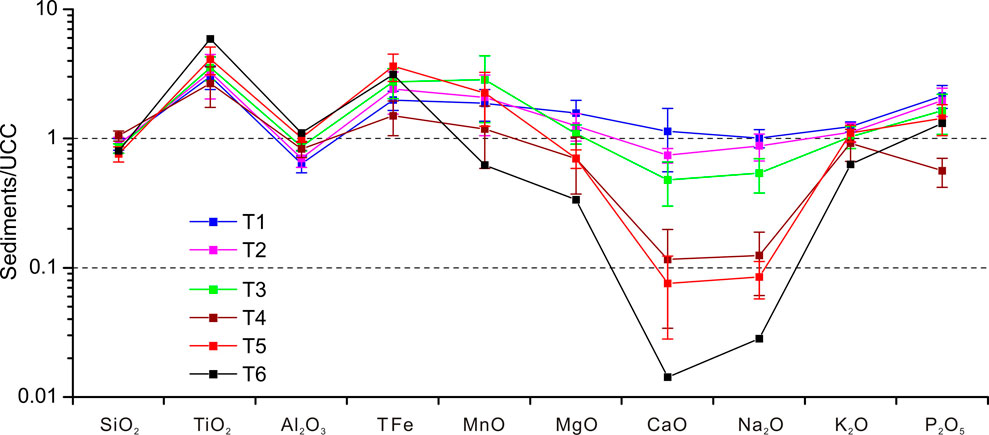
Figure 7. Elemental ratios for multiple terraces, calculated based on average major element concentrations normalized to the upper continental crust. UCC is an abbreviation for upper continental crust (Taylor and Mclennan, 1985).
4.4 Indicators of major element
The CIA index can directly quantify the degree of weathering of the sample (Figure 8). Besides, the Na/K ratio serves as a key indicator for assessing the weathering of plagioclase in the samples and can also provide insights into the overall chemical alteration of the sediments. Plagioclase is characterized by a high concentration of sodium, whereas potassium feldspar, illite, and mica are enriched in potassium. Due to the significantly higher weathering rate of plagioclase compared to potassium feldspar, the Na/K ratio in weathering profiles exhibits an inverse relationship with the degree of weathering. Combining the CIA index and Na/K ratio, we can further deepen our understanding of the sample’s degree of weathering. (Figure 8). For reference, several representative materials are included for comparison alongside the major element analytical results, such as terrigenous shale (Taylor and Mclennan, 1985), world sediments (WS) (Mclennan, 1995) (serving as a global reference for various sediment types), Luochuan loess (Gallet et al., 1996) and Xiashu loess (Zhang et al., 2007) (representing sediments that have undergone significant early-stage weathering), as well as Chuanxi loess (Yu et al., 2020) and Xuancheng loess (Hong et al., 2010) (which are in the intermediate stage of weathering, showing notable potassium loss). It can be seen that Na/K and CIA show an apparent negative correlation, reflecting the trend of increasing weathering degree of river sediments from new to old. Both T1 and T2 are lower than UCC, indicating that due to provenance reasons, sorting, and mixing when the sediments were formed, feldspar was enriched to a certain extent compared to UCC, resulting in higher contents of Ca and Na. In the terraces T4 and T5, the weathering of the terraces reached a level equivalent to that of terrigenous shale, but overall it was less than the weathering of laterite. Only T6 has almost reached the weathering degree of laterite. Since few T6 terraces are preserved, we only collected one sample in the Ya’an River Valley.
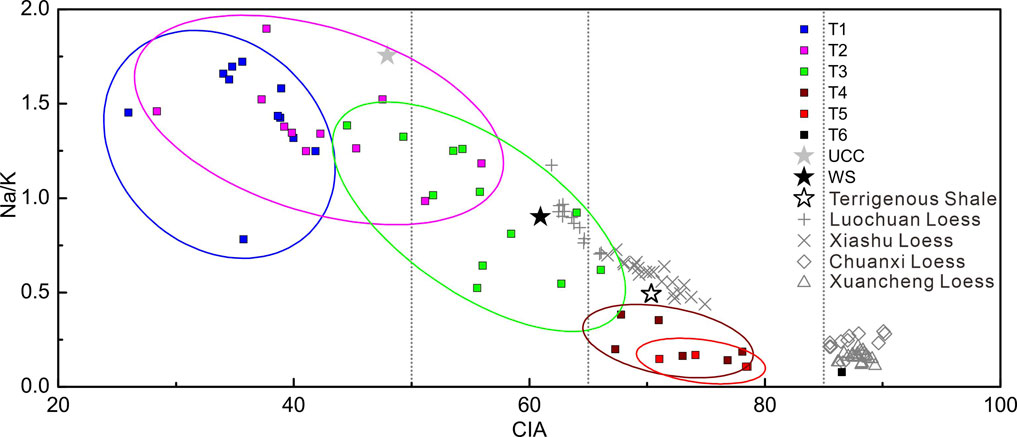
Figure 8. The terrace samples plotted in the Na/K-CIA diagram. As reference indicators, UCC is the abbreviation of Content of Upper Crust materials (Taylor and Mclennan, 1985), and WS is the abbreviation of material statistic of World Sediments (Mclennan, 1995). Terrigenous shale (Taylor and Mclennan, 1985), Luochuan loess (Gallet et al., 1996), Xiashu loess (Zhang et al., 2007), Chuanxi loess (Yu et al., 2020), and Xuancheng loess (Hong et al., 2010) are also projected as references.
The degree of weathering can be further represented by an A–CN–K ternary diagram, in which A denotes Al2O3, CN represents CaO + Na2O, and K stands for K2O, in combination with the CIA. This diagram serves as a model for illustrating the weathering progression of the UCC. In the early stage of continental weathering, the weathering of anorthosite follows a trend parallel to the line from A to CN, with a direction toward A. This stage typically reflects the weathering process from the UCC to terrigenous shale. As weathering advances to the A–K line, the process enters the middle stage, characterized by the weathering of orthoclase and illite. Subsequently, the weathering trend aligns parallel to the A–K line. In the final stage of continental weathering, the weathering products undergo a silicon runoff process, positioning near point A on the diagram (Figure 9). The data from each terrace sample are plotted on the A–CN–K ternary diagram (Figure 9), alongside the positions of major rock-forming minerals, the UCC, and natural water. It shows the terrace data in the diagram span a broad area (Figure 9), revealing significant differences in the weathering characteristics of terraces of varying ages along the Qingyi River. The weathering trends of T1 and T2 deviate from the UCC and shift towards the natural water direction, suggesting that these younger sediments are enriched in river solutes, with higher calcium and sodium contents compared to the original crust. Conversely, the weathering trends of T3, T4, and T5 align with the UCC weathering pattern, indicating a more consistent progression. The geomorphic surface connections between terraces suggest a clear progression from fresh to older sediments, with pronounced separation and distinct weathering trends.
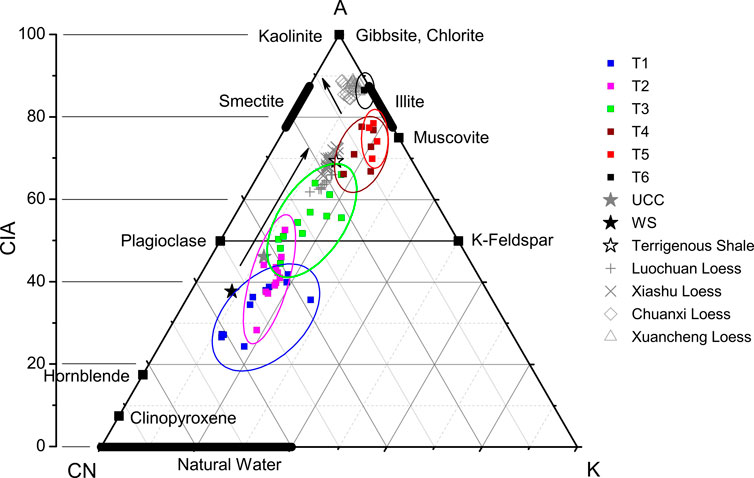
Figure 9. Ternary diagram showing the degrees of weathering. Endpoints including A (Al2O3), CN (CaO + Na2O), and K (K2O) are plotted. All data were calculated using percentages of ages (%). Other indicators, such as UCC, are indicated in Figure 8.
The A–CNK–FM ternary diagram provides an alternative perspective for examining the weathering trends of river sediments. When the Qingyi River sediment data are projected onto this A–CNK–FM diagram (Figure 10), in which A denotes Al2O3, CNK represents CaO + Na2O+ K2O, and FM stands for Fe + Mg, they show distinct patterns in comparison to standard materials such as UCC, terrigenous shale, and loess. Specifically, the Qingyi River sediments are generally displaced towards the FM corner, indicating a higher concentration of iron and magnesium oxides. This shift suggests that, throughout the river’s development, fine-grained minerals like iron hydroxides and biotite are more readily transported by flowing water and become suspended in the river sediments. Previous studies of modern rivers and riverbeds have similarly demonstrated this behavior (Vital and Stattegger, 2000; Hong et al., 2010). These suspended fine-grained minerals eventually settle and accumulate in the riverbed, and as the river continues its erosional activity and forms terraces, these minerals are preserved in the sediment layers. The diagram further reveals that as the river sediments age, there is a gradual enrichment of Fe and Mg (Figure 10).
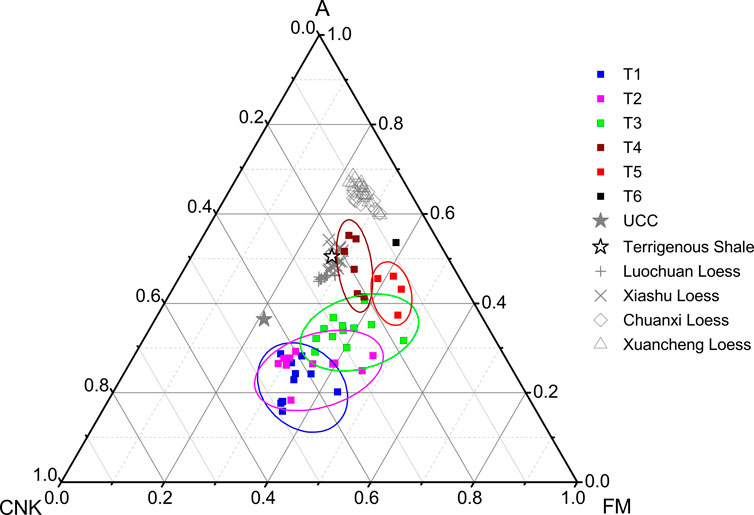
Figure 10. The A-CNK-FM ternary diagram showing projections of the terrace samples. Endpoints including A (Al2O3), CNK (CaO + Na2O+ K2O), and FM (Fe + Mg) are plotted. Other indicators, such as UCC, are indicated in Figure 8.
In the S/10-CM-NK projection diagram, which S denotes Si, CM represents CaO + Mg, and NK stands for Na2O+ K2O, the young sediments from the Qingyi River are positioned towards the CM vertex, while the older sediments trend towards the S/10 vertex. This pattern reflects the enrichment and loss of quartz in the material composition of the sediments (Figure 11). The overall trend from younger to older terrace samples follows a path parallel to the S/10-CM axis, suggesting that the migration of sodium and potassium remains relatively consistent throughout the weathering process. However, the S/10-CM-NK diagram primarily captures variations in silicon content, and as a result, the early stages of the weathering process are not clearly discernible. Moreover, the diagram does not show a distinct separation between the terraces of different ages (Figure 11).
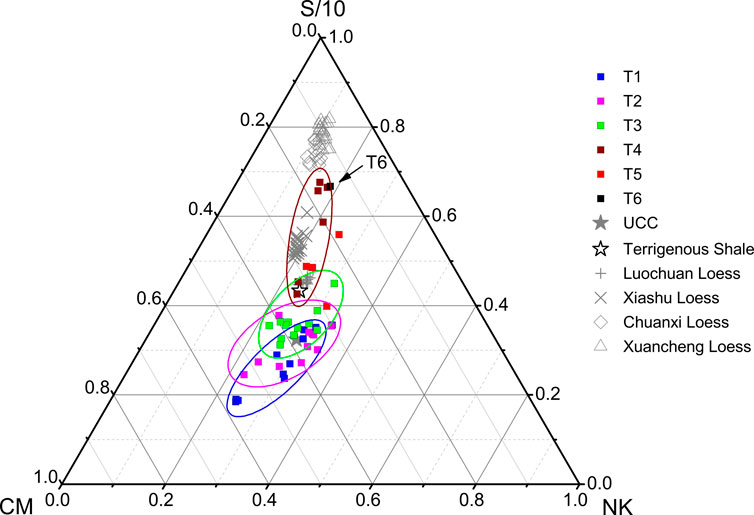
Figure 11. The S/10-CM-NK ternary diagram showing projections of the terrace samples. Endpoints including S/10 (Si/10), CM (CaO + Mg), and NK (Na2O+ K2O) are plotted. Other indicators, such as UCC, are indicated in Figure 8.
The chemical indices of major elements, such as the SiO2/Al2O3 ratio, provide insights into the relative abundances of quartz, feldspar, and clay minerals (Potter, 1978). Similarly, the Fe2O3/Al2O3 ratio offers an indication of mineral stability and can be used for classifying arkosic compositions (Herron, 1988). Furthermore, comprehensive indices are useful for assessing sediment maturity (Pettijohn et al., 2012). In this study, the samples were classified using the Pettijohn lithological classification scheme (Figure 12). The analysis reveals a progression in the elemental characteristics of the terrace sediments, shifting from arkosic and subarkosic compositions to litharenite with increasing age. This trend demonstrates a clear distinction between terraces of varying ages, with older sediments exhibiting greater maturity. However, terraces T1 and T2 are not clearly differentiated within the Pettijohn framework, suggesting that these younger terraces are still in an early stage of weathering.
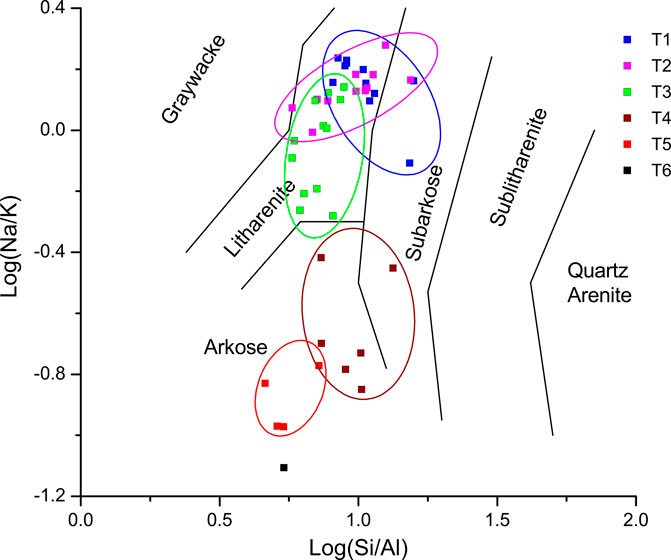
Figure 12. Terrace samples plotted in the Pettijohn lithological classification (Pettijohn et al., 2012).
5 Discussion
5.1 Effectiveness and performance of weathering indicators
We applied several weathering indicators to distinguish terrace samples of varying ages, including CIA, Na/K, A-CN-K diagram, A–CNK–FM diagram, S/10-CM-NK diagram, and Pettijohn classification. The CIA and Na/K indicators can distinguish terraces of different levels according to their weathering degree in a more efficient method. Still, the only problem is that the samples of low terraces are relatively discrete. In future work, this issue can be improved by optimizing the methods for selecting sampling targets. In the A-CN-K diagram, these terraces are in the early weathering stage characterized by the removal of Ca and Na. In the age of terrace T6, which is about 300 ka, the sediments begin to shift towards the A–CN axis, marking the transition into the middle weathering stage, where potassium is depleted. The A-CN-K diagram shows a relatively comprehensive superiority in distinguishing the different terraces. The A–CNK–FM diagram highlights a clear separation of samples from different terrace levels, which effectively illustrates the early weathering process, particularly the removal of calcium and sodium. This trend mirrors the weathering progression observed from the UCC to terrigenous shale. However, the elements of iron and magnesium exhibit irregular distribution characteristics in the terrace sediments, making the A–CNK–FM diagram not stable in differentiating terrace samples. The S/10-CM-NK diagram does not show a distinct separation between the terraces of different ages, indicating the terraces samples are not sensitive in the distribution of Si element. The Pettijohn classification appears to be particularly effective for distinguishing between the older terraces rather than young terraces.
Furthermore, we performed a detailed comparison of several weathering proxies with diagrams to assess their sensitivity in distinguishing samples from river terraces of different ages (Figure 13). For the CIA, NA/K, and Pettijohn classification, we directly constructed box plots to compare the data from different terrace samples. For the A-CN-K, A-CNK-FM, and S/10-CM-NK diagrams, due to the challenge of determining the relative weights of the three vertex indices, we applied the geometric mean method to combine the three sets of data and generated box plots for comparison (Nicolli et al., 1989; Burt et al., 2003; Pekey et al., 2004). The result shows that, depending on the specific contextual requirements, the three indices derived from major elements—CIA, Na/K, and the A-CN-K diagram—are highly suitable for distinguishing the weathering degree of terrace samples from different ages. In contrast, the A–CNK–FM diagram, S/10-CM-NK diagram, and Pettijohn classification are more sensitive to terrace sediments older than 100 ka, but less so for younger sediments, making them less effective for terrace classification (Figure 13). Based on the data presented in this paper, we hypothesize that the A–CNK–FM diagram, S/10-CM-NK diagram, and Pettijohn classification indicators may have greater application potential for terraces or ancient alluvial fans on timescales exceeding 100 ka, or even extending to 1 Ma time scale.
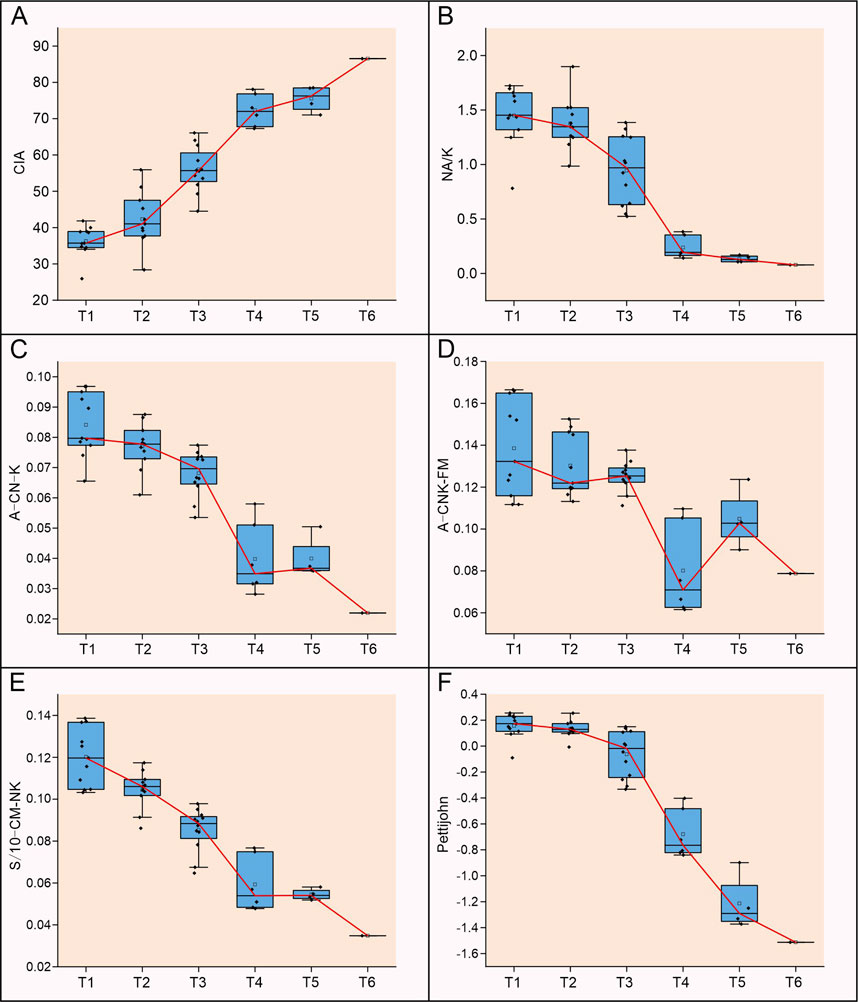
Figure 13. Comparison of the sensitivity of several weathering indices to samples from different terraces. Panel (A) displays the sensitivity of CIA index. Panel (B) displays the sensitivity of Na/K index. Panel (C) displays the sensitivity of the A-CN-K diagram. Panel (D) displays the sensitivity of the A-CNK-FM diagram. Panel (E) displays the sensitivity of the S/10-CM-NK diagram. Panel (F) displays the sensitivity of the Pettijohn lithological classification. The data presented in the figure are derived from Figures 8–12. The red line shows the median regression of the data from different terrace samples.
5.2 Relationship between weathering and terrace’s age
The chronological results of the terraces examined in this study have been reported in our previously published work (Jiang et al., 2016; Liu et al., 2015; Jiang et al., 2022). Furthermore, the sampling profiles and locations for the major element analysis in this paper are consistent with those used for age analysis in previous terrace studies. The materials used for major element testing and age determination are identical, consisting of sand or clay filling the spaces between gravels in terrace deposits. For major element analysis, the samples assessed represent the overall major element content of the infill between gravels within the sedimentary strata. In chronological analysis, radiocarbon dating was used to determine the age of organic carbon in the sedimentary layers, rather than the age of discrete carbon particles, while optically stimulated luminescence (OSL) and electron spin resonance (ESR) dating were employed to measure the signal age of quartz particles within the sediment. The compiled terrace age results are shown in Table 2.
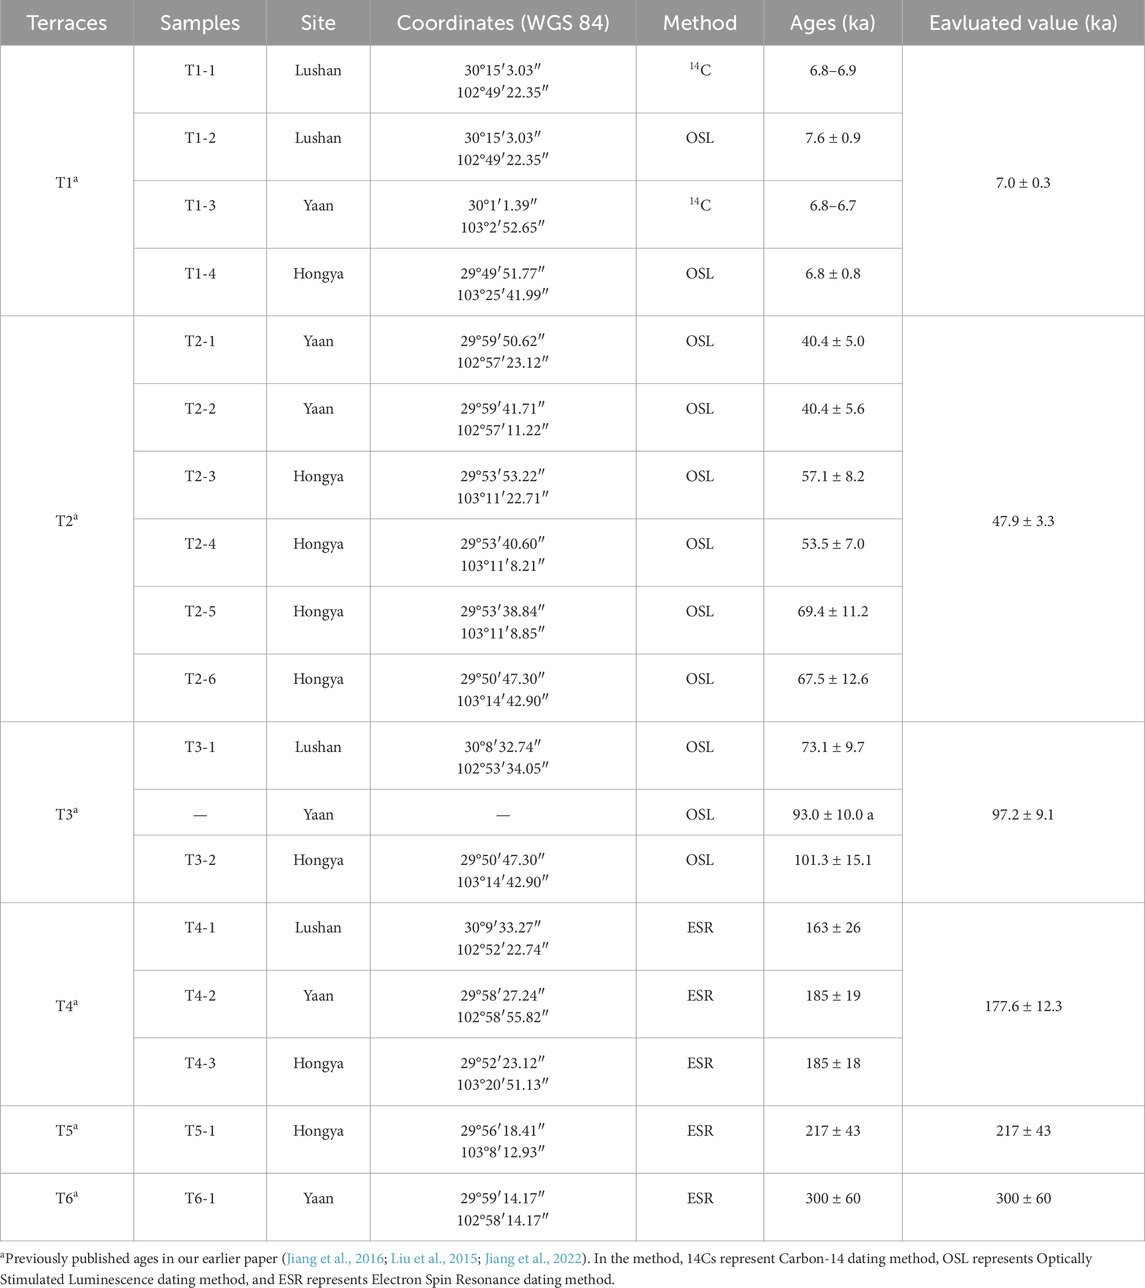
Table 2. Compiled terrace age results of the Qingyi River.
We combined the major element data of river terraces in this study with the river chronology data in previous studies to estimate the direct relationship between the weathering degree and age of the terraces (Figure 14). The fitting results of the CIA index and the terrace age show a linear relationship between the two as a whole, and the value of Pearson’s r is 0.99. It shows that within the age range of 300 ka of the T6 terrace, the sediments in the terrace show a linearly increasing weathering trend. In other words, most terraces can be compared by weathering indicators obtained by major elements. In addition, by projecting the CIA index and age of the terrace onto the climate curve, it can be found that the abandonment age of the terrace has a good correspondence with the interglacial period (Figure 14). The deep-sea oxygen isotope (Lisiecki and Raymo, 2005) and the Chinese loess sequence (Ding et al., 2002) were plotted in Figure 11 to show the paleoclimate information. On the deep-sea oxygen isotope curve, T1 corresponds to the Holocene warm period, T2 corresponds to the interglacial MIS3, T3 corresponds to the interglacial MIS5, T4 and T5 correspond to the interglacial MIS7, and T6 corresponds to the interglacial MIS9 (Figure 14). On the magnetic susceptibility curve of the loess sequence in Jingbian, T1 corresponds to the Holocene warm period S0, T2 and T3 correspond to the interglacial period S1, T4 and T5 correspond to the interglacial period S2, and T6 corresponds to the interglacial period S3 (Figure 14). This correspondence shows that during the interglacial period in the Qingyi River Basin, the amount of river water increased and the cutting ability became more powerful, resulting in the abandonment of the riverbed to form terraces. We believe that when the terraces were formed during the interglacial period, they began to experience intense weathering under the environment of heavy precipitation. In the glacial period, precipitation decreased, and weathering weakened. Higher-level terraces often experience one more interglacial weathering process than lower-level terraces, and a new-level terrace develops during the interglacial period. Therefore, this stable terrace formation pattern and weathering process leads to a linear increase in the degree of terrace weathering.
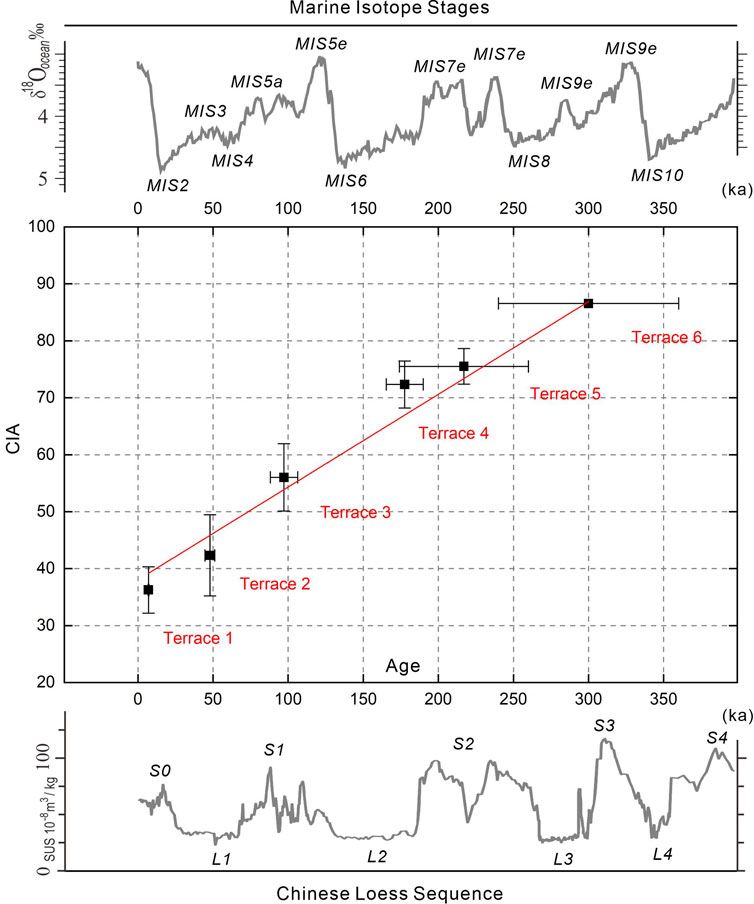
Figure 14. The relationship between CIA and terrace’s age. The deep-sea oxygen isotope curve (Lisiecki and Raymo, 2005) and the magnetic susceptibility curve of the loess sequence in Jingbian (Ding et al., 2002) are also plotted to show paleoclimate information. The error bars of terrace age represent standard deviation. The red line represents the result of the linear regression of the terrace age. MIS is an abbreviation of Marine Isotope Stage, in which even numbers represent glacial period (Lisiecki and Raymo, 2005). S stands for soil, which correspond to interglacial period. L stands for loess, which correspond to glacial period (Ding et al., 2002).
5.3 Relationship between weathering and terrace’s height
In this study, the height of terraces above the river bed is also considered to influence the weathering process. We collected the terrace’s heights in previous studies and compared them to the sites of major element samples in this study (Jiang et al., 2016; Liu et al., 2015; Jiang et al., 2022). Results show that the CIA index and the terrace’s height above the river seem to own a linear relationship on the plot (Figure 15). According to the calculation, the value of Pearson’s r is 0.97. We think the chemical weathering of the terrace’s sediment is influenced by precipitation more than riverbeds. Once the terrace is abandoned and relatively higher than the riverbed, it is no longer directly affected by the river erosion and transport system. The weathering process of the terraces is more like feedback to ancient climate changes.
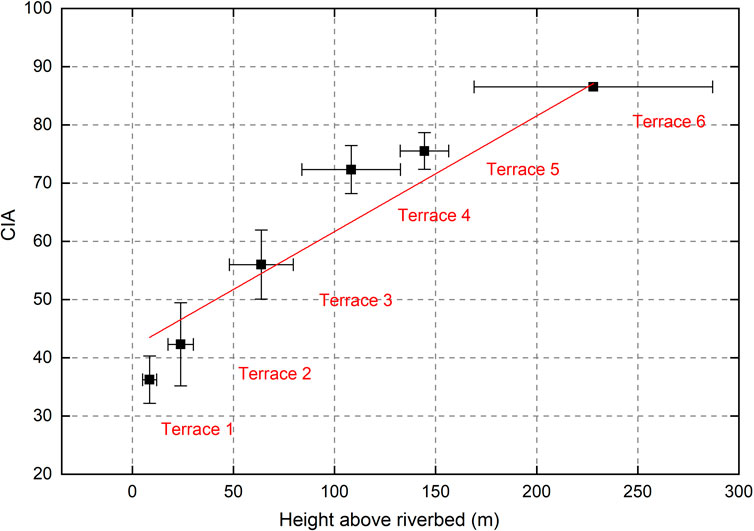
Figure 15. Plot showing the relationship between CIA and the terrace’s height. The red line represents the result of the linear regression of the CIA and terrace’s height above riverbed.
6 Conclusion
(1) According to the study on the terraces of the Qingyi River on the eastern edge of the Tibetan Plateau, the weathering indicators based on major elements can be utilized to differentiate river terraces of varying ages. Quantitative weathering parameters exhibit a near-linear correlation with terrace age.
(2) Indicators CIA, Na/K, and A-CN-K diagram are highly suitable for distinguishing the weathering degree of terrace aged within 300 ka or even more. Indicators A–CNK–FM diagram, S/10-CM-NK diagram, and Pettijohn classification are not sensitive to terraces aged within 100 ka.
(3) Sample collection should occur in the gravel layer at the terrace top, excluding floodplain deposits to avoid flood sediment influence. The matrix sand between the gravels is appropriate for major element analysis.
(4) The terraces are formed during the interglacial period and suffered intense weathering under heavy precipitation. In the glacial period, precipitation decreased, and weathering weakened. Higher-level terraces often experience one more interglacial weathering process than the lower-level terraces.
Data availability statement
The original contributions presented in the study are included in the article/supplementary material, further inquiries can be directed to the corresponding author.
Author contributions
DH: Data curation, Formal Analysis, Investigation, Visualization, Writing–original draft, Writing–review and editing. DJ: Conceptualization, Investigation, Methodology, Project administration, Supervision, Writing–original draft, Writing–review and editing. SZ: Formal Analysis, Funding acquisition, Investigation, Writing–review and editing. RD: Investigation, Software, Writing–review and editing. YC: Investigation, Visualization, Writing–review and editing.
Funding
The author(s) declare that financial support was received for the research, authorship, and/or publication of this article. This research was funded by The National Natural Science Foundation of China, grant numbers U2039201, 41802226, and 41272234.
Conflict of interest
The authors declare that the research was conducted in the absence of any commercial or financial relationships that could be construed as a potential conflict of interest.
Generative AI statement
The authors declare that no Generative AI was used in the creation of this manuscript.
Publisher’s note
All claims expressed in this article are solely those of the authors and do not necessarily represent those of their affiliated organizations, or those of the publisher, the editors and the reviewers. Any product that may be evaluated in this article, or claim that may be made by its manufacturer, is not guaranteed or endorsed by the publisher.
References
Alberti, A. P. E. R., Gomes, A., Trenhaile, A., Oliveira, M., and Horacio, J. (2013). Correlating river terrace remnants using an Equotip hardness tester: an example from the Mino River, northwestern Iberian Peninsula. Geomorphology 192, 59–70. doi:10.1016/j.geomorph.2013.03.017
Avouac, J., Meng, L., Wei, S., Wang, T., and Ampuero, J. (2015). Lower edge of locked main himalayan thrust unzipped by the 2015 gorkha earthquake. Nat. Geosci. 8 (9), 708–711. doi:10.1038/NGEO2518
Baker, V. R. (1987). Paleoflood hydrology and extraordinary flood events. J. Hydrol. 96 (1-4), 79–99. doi:10.1016/0022-1694(87)90145-4
Baker, V. R. (2008). Paleoflood hydrology: origin, progress, prospects. Geomorphology 101 (1-2), 1–13. doi:10.1016/j.geomorph.2008.05.016
Bradley, W. C. (1970). Effect of weathering on abrasion of granitic gravel, Colorado River (Texas). Geol. Soc. Am. Bull. 81 (1), 61–80. doi:10.1130/0016-7606(1970)81[61:EOWOAO]2.0.CO;2
Brewer, R., and Walker, P. H. (1969). Weathering and soil development on a sequence of river terraces. Soil Res. 7 (3), 293–305. doi:10.1071/sr9690293
Bridgland, D., and Westaway, R. (2008). Climatically controlled river terrace staircases: a worldwide Quaternary phenomenon. Geomorphology 98 (3-4), 285–315. doi:10.1016/j.geomorph.2006.12.032
Buggle, B., Glaser, B., Hambach, U., Gerasimenko, N., and Marković, S. (2011). An evaluation of geochemical weathering indices in loess--paleosol studies. Quat. Int. 240 (1-2), 12–21. doi:10.1016/j.quaint.2010.07.019
Burt, R., Wilson, M. A., Mays, M. D., and Lee, C. W. (2003). Major and trace elements of selected Pedons in the USA. J. Environ. Qual. 32 (6), 2109–2121. doi:10.2134/jeq2003.2109
Caceres, L. M., Olias, M., de Andres, J. R., Rodriguez-Vidal, J., Clemente, L., Galvan, L., et al. (2013). Geochemistry of Quaternary sediments in terraces of the Tinto River (SW Spain): paleoenvironmental implications. Catena 101, 1–10. doi:10.1016/j.catena.2012.09.011
Canfield, D. E. (1997). The geochemistry of river particulates from the continental USA: major elements. Geochim. Cosmochim. Acta 61 (16), 3349–3365. doi:10.1016/S0016-7037(97)00172-5
Chambers, J. E., Wilkinson, P. B., Penn, S., Meldrum, P. I., Kuras, O., Loke, M. H., et al. (2013). River terrace sand and gravel deposit reserve estimation using three-dimensional electrical resistivity tomography for bedrock surface detection. J. Appl. Geophys. 93, 25–32. doi:10.1016/j.jappgeo.2013.03.002
Ding, Z. L., Derbyshire, E., Yang, S. L., Yu, Z. W., Xiong, S. F., and Liu, T. S. (2002). Stacked 2.6-Ma grain size record from the Chinese loess based on five sections and correlation with the deep-sea δ18O record. Paleoceanography 17 (3), 1–5. doi:10.1029/2001PA000725
Dupré, B., Gaillardet, J., Rousseau, D., and Allègre, C. J. (1996). Major and trace elements of river-borne material: the Congo Basin. Geochim. Cosmochim. Acta 60 (8), 1301–1321. doi:10.1016/0016-7037(96)00043-9
England, P., and Molnar, P. (1990). Surface uplift, uplift of rocks, and exhumation of rocks. Geology 18 (12), 1173–1177. doi:10.1130/0091-7613(1990)018<1173:SUUORA>2.3.CO;2
Gallet, S., Jahn, B., and Torii, M. (1996). Geochemical characterization of the Luochuan loess-paleosol sequence, China, and paleoclimatic implications. Chem. Geol. 133 (1-4), 67–88. doi:10.1016/S0009-2541(96)00070-8
Gold, R. D., Cowgill, E., Arrowsmith, J. R., and Friedrich, A. M. (2017). Pulsed strain release on the Altyn Tagh fault, northwest China. Earth Planet. Sci. Lett. 459, 291–300. doi:10.1016/j.epsl.2016.11.024
Heiri, O., Lotter, A. E. F., and Lemcke, G. (2001). Loss on ignition as a method for estimating organic and carbonate content in sediments: reproducibility and comparability of results. J. Paleolimnol. 25, 101–110. doi:10.1023/a:1008119611481
Herron, M. M. (1988). Geochemical classification of terrigenous sands and shales from core or log data. J. Sediment. Res. 58 (5). doi:10.1306/212F8E77-2B24-11D7-8648000102C1865D
Hong, H., Gu, Y., Li, R., Zhang, K., and Li, Z. (2010). Clay mineralogy and geochemistry and their palaeoclimatic interpretation of the Pleistocene deposits in the Xuancheng section, southern China. J. Quat. Sci. 25 (5), 662–674. doi:10.1002/jqs.1340
Jennings, R., and Shulmeister, J. (2002). A field based classification scheme for gravel beaches. Mar. Geol. 186 (3-4), 211–228. doi:10.1016/s0025-3227(02)00314-6
Jiang, D., Zhang, S., and Ding, R. (2021). Weathering process of the alluvial fans in western Sichuan basin, eastern margin of the Tibetan Plateau. Nat. Hazards Res. 1 (2), 36–47. doi:10.1016/j.nhres.2021.05.001
Jiang, D., Zhang, S., and Ding, R. (2022). Spatial pattern of late quaternary shortening rate in the longmen Shan foreland, eastern margin of the Tibetan plateau. Lithosphere 2021 (2), 9167174. doi:10.2113/2022/9167174
Jiang, D., Zhang, S., and Li, W. (2016). Research on the Quaternary fluvial geomorphological surface sequence of the foreland region in southern Longmen Shan, eastern Tibet. Geomorphology 269, 133–148. doi:10.1016/j.geomorph.2016.06.036
Kirby, E., and Whipple, K. (2001). Quantifying differential rock-uplift rates via stream profile analysis. Geology 29 (5), 415–418. doi:10.1130/0091-7613(2001)029<0415:QDRURV>2.0.CO;2
Knuepfer, P. L. (1988). Estimating ages of late Quaternary stream terraces from analysis of weathering rinds and soils. Geol. Soc. Am. Bull. 100 (8), 1224–1236. doi:10.1130/0016-7606(1988)100<1224:EAOLQS>2.3.CO;2
Kochel, R. C., and Baker, V. R. (1982). Paleoflood hydrology. Science 215 (4531), 353–361. doi:10.1126/science.215.4531.353
Lavé, J., and Avouac, J. P. (2000). Active folding of fluvial terraces across the siwaliks hills, himalayas of central Nepal. J. Geophy. Res. - Solid Earth 105 (B3), 5735–5770. doi:10.1029/1999JB900292
Li, T., Chen, J., Thompson, J. A., Burbank, D. G., and Yang, X. (2013). Quantification of three-dimensional folding using fluvial terraces: a case study from the Mushi anticline, northern margin of the Chinese Pamir. J. Geophys. Res.: Solid Earth 118 (8), 4628–4647. doi:10.1002/jgrb.50316
Lisiecki, L. E., and Raymo, M. E. (2005). A Pliocene-Pleistocene stack of 57 globally distributed benthic δ18O records. Paleoceanography 20, PA1003. doi:10.1029/2004PA001071
Liu, S., Zhang, S., Ding, R., Ren, J., Xie, F., Jiang, D., et al. (2015). Upper crustal folding of the 2013 Lushan earthquake area in southern Longmen Shan, China, insights from Late Quaternary fluvial terraces. Tectonophysics 639, 99–108. doi:10.1016/j.tecto.2014.11.016
Liu, Z., Zhao, Y., Colin, C., Siringan, F., and Wu, Q. (2009). Chemical weathering in Luzon, Philippines from clay mineralogy and major-element geochemistry of river sediments. Appl. Geochem. 24 (11), 2195–2205. doi:10.1016/j.apgeochem.2009.09.025
Mclennan, S. M. (1993). Weathering and global denudation. J. Geol. 101 (2), 295–303. doi:10.1086/648222
Mclennan, S. M. (1995). A handbook of physical constants: rock physics and phase relations. Washington, DC: American Geophysical Union Reference Shelf.
Nesbitt, H. W., Markovics, G., and Price, R. C. (1980). Chemical processes affecting alkalis and alkaline-earths during continental weathering. Geochim. Cosmochim. Acta 44 (11), 1659–1666. doi:10.1016/0016-7037(80)90218-5
Nesbitt, H. W., and Young, G. M. (1982). Early proterozoic climates and plate motions inferred from major element chemistry of lutites. Nature 299 (5885), 715–717. doi:10.1038/299715a0
Nesbitt, H. W., and Young, G. M. (1989). Formation and diagenesis of weathering profiles. J. Geol. 97 (2), 129–147. doi:10.1086/629290
Nesbitt, H. W., Young, G. M., Mclennan, S. M., and Keays, R. R. (1996). Effects of chemical weathering and sorting on the petrogenesis of siliciclastic sediments, with implications for provenance studies. J. Geol. 104 (5), 525–542. doi:10.1086/629850
Nicolli, H. B., Suriano, J. M., Gomez Peral, M. A., Ferpozzi, L. H., and Baleani, O. A. (1989). Groundwater contamination with Arsenic and other trace elements in an area of the Pampa, province of Cordoba, Argentina. Environ. Geol. Water Sci. 14, 3–16. doi:10.1007/bf01740581
Nishiyama, K. (2002). Rates of rock property changes due to weathering: sandstone gravel in fluvial terrace deposits in the Miyazaki Plain. Science Reports of the Institute of Geoscience, University of Tsukuba. Section a. Geogr. Sci. 23, 1–40.
Pan, B. T., Burbank, D., Wang, Y. X., Wu, G. J., Li, J. J., Guan, Q., et al. (2003). A 900 ky record of strath terrace formation during glacial-interglacial transitions in northwest China. Geology 31 (11), 957–960. doi:10.1130/G19685.1
Pekey, H., Karaka, D., and Bakoglu, M. (2004). Source apportionment of trace metals in surface waters of a polluted stream using multivariate statistical analyses. Mar. Pollut. Bull. 49 (9-10), 809–818. doi:10.1016/j.marpolbul.2004.06.029
Potter, P. E. (1978). Petrology and chemistry of modern big river sands. J. Geol. 86 (4), 423–449. doi:10.1086/649711
Potter, P. E. (1994). Modern sands of south-America - composition, provenance and global significance. Geol. Rundsch 83 (1), 212–232. doi:10.1007/BF00211904
Qiu, S., Zhu, Z., Yang, T., Wu, Y., Bai, Y., and Ouyang, T. (2014). Chemical weathering of monsoonal eastern China: implications from major elements of topsoil. J. Asian Earth Sci. 81, 77–90. doi:10.1016/j.jseaes.2013.12.004
Royden, L. H., Burchfiel, B. C., and van der Hilst, R. D. (2008). The geological evolution of the Tibetan plateau. Science 321 (5892), 1054–1058. doi:10.1126/science.1155371
Saint-Carlier, D., Charreau, J., Lavé, J., Blard, P. H., Dominguez, S., Avouac, J. P., et al. (2016). Major temporal variations in shortening rate absorbed along a large active fold of the southeastern Tianshan piedmont (China). Earth Planet. Sci. Lett. 434, 333–348. doi:10.1016/j.epsl.2015.11.041
Santisteban, J. I., Mediavilla, R., Lopez-Pamo, E., Dabrio, C. J., Zapata, M., Garcia, M., et al. (2004). Loss on ignition: a qualitative or quantitative method for organic matter and carbonate mineral content in sediments? J. Paleolimnol. 32, 287–299. doi:10.1023/b:jopl.0000042999.30131.5b
Sarin, M. M., Krishnaswami, S., Dilli, K., Somayajulu, B. L. K., and Moore, W. S. (1989). Major ion chemistry of the ganga-brahmaputra river system - weathering processes and fluxes to the bay of bengal. Geochim. Cosmochim. Acta 53 (5), 997–1009. doi:10.1016/0016-7037(89)90205-6
Singh, M., Sharma, M., and Tobschall, H. J. (2005). Weathering of the Ganga alluvial plain, northern India: implications from fluvial geochemistry of the Gomati River. Appl. Geochem 20 (1), 1–21. doi:10.1016/j.apgeochem.2004.07.005
Singh, P. (2009). Major, trace and REE geochemistry of the Ganga River sediments: influence of provenance and sedimentary processes. Chem. Geol. 266 (3-4), 242–255. doi:10.1016/j.chemgeo.2009.06.013
Song, B., Zhang, K., Zhang, L., Ji, J., Hong, H., Wei, Y., et al. (2018). Qaidam Basin paleosols reflect climate and weathering intensity on the northeastern Tibetan plateau during the early eocene climatic optimum. Palaeogeogr. Palaeoclimatol. Palaeoecol. 512, 6–22. doi:10.1016/j.palaeo.2018.03.027
Souri, B., and Watanabe, M. (2017). Comparative evaluation of age and weathering condition of the Sirvan river terraces in western Iran. Geosci. J. 21, 33–46. doi:10.1007/s12303-016-0011-3
Taylor, S. R., and Mclennan, S. M. (1985). The continental crust: its composition and evolution. London: Blackwell Scientific Press.
Trexler, C. C., Cowgill, E., Spencer, J. Q. G., and Godoladze, T. (2020). Rate of active shortening across the southern thrust front of the Greater Caucasus in western Georgia from kinematic modeling of folded river terraces above a listric thrust. Earth Planet. Sci. Lett. 544, 116362. doi:10.1016/j.epsl.2020.116362
Vital, H., and Stattegger, K. (2000). Major and trace elements of stream sediments from the lowermost Amazon River. Chem. Geol. 168 (1-2), 151–168. doi:10.1016/S0009-2541(00)00191-1
Viveen, W., Schoorl, J. M., Veldkamp, A., van Balen, R. T., Desprat, S., and Vidal-Romani, J. R. (2013). Reconstructing the interacting effects of base level, climate, and tectonic uplift in the lower Miño River terrace record: a gradient modelling evaluation. Geomorphology 186, 96–118. doi:10.1016/j.geomorph.2012.12.026
Wang, E., Kirby, E., Furlong, K. P., van Soest, M., Xu, G., Kamp, P. J. J., et al. (2012). Two-phase growth of high topography in eastern Tibet during the Cenozoic. Nat. Geosci. 5 (9), 640–645. doi:10.1038/NGEO1538
Wang, T., Wang, Q., Han, C., Cui, D., and Sauer, D. (2023). Development and application of new transfer functions between climate and soil weathering indices for paleoclimatic reconstructions from Chinese loess-paleosol sections. Catena 224, 106974. doi:10.1016/j.catena.2023.106974
Wang, X., and Miao, X. (2006). Weathering history indicated by the luminescence emissions in Chinese loess and paleosol. Quat. Sci. Rev. 25 (13-14), 1719–1726. doi:10.1016/j.quascirev.2005.11.009
Whipple, K. X., Kirby, E., and Brocklehurst, S. H. (1999). Geomorphic limits to climate-induced increases in topographic relief. Nature 401 (6748), 39–43. doi:10.1038/43375
Whipple, K. X., Shirzaei, M., Hodges, K. V., and Arrowsmith, J. R. (2016). Active shortening within the Himalayan orogenic wedge implied by the 2015 Gorkha earthquake. Nat. Geosci. 9 (9), 711–716. doi:10.1038/NGEO2797
Yu, Y., Lin, L., Deng, X., Wang, Y., Li, Y., and Guo, Y. (2020). Geochemical features of the Middle--Upper Permian cherts and implications for origin, depositional environment in the Sichuan Basin, SW China. Geol. J. 55 (2), 1493–1506. doi:10.1002/gj.3511
Keywords: eastern Tibetan Plateau, Qingyi River, river terrace, geomorphological interpretation, terrace comparison
Citation: Hua D, Jiang D, Zhang S, Ding R and Chen Y (2025) Chemical weathering as a tool for distinguishing river terraces of varying ages: a case study of the Qingyi River on the eastern Tibetan Plateau. Front. Earth Sci. 13:1534898. doi: 10.3389/feart.2025.1534898
Received: 26 November 2024; Accepted: 06 January 2025;
Published: 21 January 2025.
Edited by:
Bo Li, University of Wollongong, AustraliaReviewed by:
Siwei Lin, Nanjing Normal University, ChinaManuel E. Camacho Umaña, University of Costa Rica, Costa Rica
Copyright © 2025 Hua, Jiang, Zhang, Ding and Chen. This is an open-access article distributed under the terms of the Creative Commons Attribution License (CC BY). The use, distribution or reproduction in other forums is permitted, provided the original author(s) and the copyright owner(s) are credited and that the original publication in this journal is cited, in accordance with accepted academic practice. No use, distribution or reproduction is permitted which does not comply with these terms.
*Correspondence: Dawei Jiang, ZGF3ZWlqaWFuZ0BuaW5obS5hYy5jbg==