 Zhaodong Li
 Zhiyong Huang3,4
- 1School of Geological Engineering and Geomatics, Chang’an University, Xi’an, Shaanxi, China
- 2Water Cycle and Geological Environment Observation and Research Station for the Chinese Loess Plateau, Ministry of Education, Zhengning, Gansu, China
- 3Institute of Mountain Hazards and Environment, Chinese Academy of Sciences, Chengdu, Sichuan, China
- 4University of Chinese Academy of Sciences, Beijing, China
- 5PowerChina Northwest Engineering Corporation Limited, Xi’an, Shaanxi, China
Micro accelerometers are crucial tools for monitoring and providing early warning of geological disasters. This study focuses on the potential debris flow in Wangjiayuan, Fang County, Hubei Province, aiming to explore the relationship between clay content and debris flow motion characteristics. Physical model experiments were designed with varying clay content to simulate debris flow motion, and micro accelerometers were employed to monitor and record vibration acceleration changes during debris flow initiation and motion. Frequency spectra were generated using Fourier transform to analyze the motion characteristics in the frequency domain. The results showed that the predominant period of debris flow initiation ranged from 15 Hz to 29 Hz, while the period during motion in the middle section of the flow area ranged from 36 Hz to 54 Hz. Higher clay particle content was associated with a decrease in both the frequency range and mean of the predominant period, as well as a reduction in the Fourier amplitude extremum. These findings provide a foundation for monitoring and predicting debris flows, and the vibration signal characteristics of debris flow initiation and motion can be used to infer the clay content, offering insights into early warning systems for such geological hazards.
1 Introduction
Debris flows, characterized by their saturation and the carriage of substantial sediment and stones, are gravity-driven phenomena occurring in steep valleys (Cui et al., 2005; Hungr et al., 2014). Their formation is predominantly attributed to surface runoff, rainstorm-induced groundwater level increases, and earthquake-triggered soil liquefaction, which destabilize loose or weathered earth and rock layers, prompting rapid movement along the flow path (Cui et al., 2017; Guo et al., 2021; 2022c). Debris flows are noted for their intense movement, strong destructive potential, and extensive range of impact (Chen et al., 2010; Guo et al., 2022a; Dong et al., 2023). With monitoring and early warning equipment assuming a critical role in geological hazard warning systems (Otero et al., 2022; Fang et al., 2023a; 2024), effective monitoring and prevention of potential debris flow disaster sites are essential (Hürlimann et al., 2003; Faillettaz et al., 2019; Zeng et al., 2023).
Micro accelerometers, a phenomenon where an object experiences inelastic deformation under external environmental or mechanical forces, is associated with events such as landslides, collapses, and mudslides (Hu et al., 2018). These geological disasters occur when internal fractures, resulting from friction or collision within the rock and soil mass during deformation and movement, induce surface vibrations (Huang et al., 2008; Vouillamoz et al., 2018). The characteristics of these vibrations are influenced by surface density (Schimmel and Hübl, 2016), hence sensor sensitivity, disaster scale, movement distance, and site conditions significantly affect the recorded seismic signals (Biescas et al., 2003). The primary source of vibration in debris flows arises from fluid-substrate collisions and the interaction with the ground. Consequently, passive monitoring of surface vibrations is an effective method for the monitoring and early warning of geological disasters, including debris flows (Huang et al., 2007; Najafabadi et al., 2024). Micro vibration acceleration monitoring, a form of surface vibration surveillance with relatively low frequency, enables long-distance vibration acceleration detection, compensating for the limitations of traditional monitors that require placement on disaster bodies (Arattano, 1999; Biescas et al., 2003; Lei et al., 2018; Coviello et al., 2019). For instance, surface displacement monitoring stations must be situated within debris flow source areas. Therefore, considerations for reuse and effective protection are necessary (Hürlimann et al., 2003; Tu et al., 2013; Cina et al., 2019; Faillettaz et al., 2019). Currently, micro accelerometers for surface vibration monitoring have been extensively applied in countries such as China, Japan, and the United States (Lavigne et al., 2000; Suwa et al., 2009), offering high accuracy and strong timeliness to effectively warn of disaster occurrences (Hu et al., 2013; 2018). These accelerometers are not only suitable for monitoring geological disasters like landslide and debris flow but also for rockfall disaster (Lacroix and Helmstetter, 2011; Coviello et al., 2015; Wang et al., 2019).
Surface vibration characteristics during disaster initiation and movement are influenced by factors such as the type, mass, volume, and movement speed of the disaster body, in addition to the properties of the rock and soil mass itself (Arattano, 1999; Bessason et al., 2007; Abanco et al., 2012; Guo et al., 2022b; Schimmel et al., 2022). Lei et al. (2018) discovered through model experiments that debris flows with different fluid phases exhibit distinct signal frequency ranges and energy levels. Farin et al. (2019) extended existing models, identifying the average diameter and average flow velocity of debris flow particles as the most significant parameters affecting surface vibration frequency. Solid concentration also impacts the surface vibration characteristics of debris flows, as determined by Schimmel et al. (2022) and Yang et al. (2024).
In this study, clay particles are defined sedimentologically as particles with a diameter less than 0.005 mm (Chen et al., 2010; 2018). The clay content, which refers to the percentage of clay particles in soil, plays a binding role, affecting the flow characteristics and shear strength of soil and significantly impacting the formation of landslides and debris flows (Qi et al., 2016; He et al., 2022; Hu et al., 2022). The percentage and activity of clay minerals are related to the yield stress of debris flows (Yu et al., 2012). Clay content has been identified as a key factor in debris flow movement and sedimentation by Iverson and LaHusen (1989) and in debris flow initiation and dynamic model experiments by Cui (1992) and Takahashi (2014). Iverson et al. (2000) determined that an optimal clay content significantly diminishes the resistance to debris flow movement. Furthermore, clay particle content influences both the travel distance and depositional development of debris flows. Additionally, the clay particle content affects the transformation and movement distance of landslides and debris flows. Reid et al. (2003) found that excessive clay content can inhibit the transformation of landslide to debris flows. Nishiguchi and Uchida. (2022) determined that when the clay content in a debris flow exceeds 22%, increased viscosity reduces the flow’s travel distance. Chen et al. (2010) found that soils with moderate clay content (5%–10%) are most susceptible to damage and debris flow initiation following heavy rainfall.
Clay content’s impact on debris flow movement is well-established; however, scant research has addressed its effects on debris flow dynamics and ground vibration signatures. This study employs physical model experiments to simulate debris flow movement, monitoring and documenting changes in initiation, transit time, and vibration acceleration. It further investigates the correlation between clay content and vibration acceleration, thereby furnishing a scientific foundation for field monitoring and debris flow warning threshold establishment. Additionally, it examines how clay content in the source affects debris flow vibration signal characteristics and movement duration. Integrating these findings with prior research on clay content’s role in debris flow movement allows for a more effective prediction of debris flow kinematics and impact zones post-occurrence. The structure of this article is as follows: Section 1 offers an overview of the research background, current status, and research content; Section 2 details the research area and experimental design; Section 3 presents a comprehensive introduction to the physical model design and experimental procedures. Section 4 applies the short-time Fourier transform to the data, examining the correlation between start-up time, total duration, and clay content. Section 5 investigates the correlation between Fourier amplitude and clay content throughout the initiation and progression of debris flows. Section 6 offers a comprehensive summary of the research findings.
2 Materials and methods
2.1 Study area and material
This study focuses on the Wangjiayuan debris flow, located in the northern part of Fang County within Danjiangkou City. The source of the debris flow originates from a massive ancient rock landslide. The protolith of the slope is characterized as chlorite quartz schist, featuring medium-thick layers interspersed with thin layers. The sliding is governed by structural planes, including foliation and joints. As depicted in Figure 1, the debris flow source area resembles a tongue, being narrow at the top and widening towards the bottom. The material source’s accumulation area measures approximately 370 m in length, 290 m in width, with an estimated volume of 1.1 × 10⁵ cubic meters. The elevation at the rear edge is 586 m, while the front edge is at 482 m, yielding a height difference of 104 m and an average slope gradient of about 16°. The circulation area extends 590 m from north to south and 220 m from east to west, with a height difference of approximately 290 m between the front and rear edges and a slope of about 30°. Soil in the accumulation area, subject to long-term weathering, primarily consists of weathered residual soil with fragmented stones, the largest of which reach 3–5 m in size. The loose soil in the source area, combined with a large downstream catchment area and a narrow, steep lower channel, predisposes the debris flows to overflow, exit the channel, and enter the river below. This can lead to damage to houses along the river and on the opposite bank.
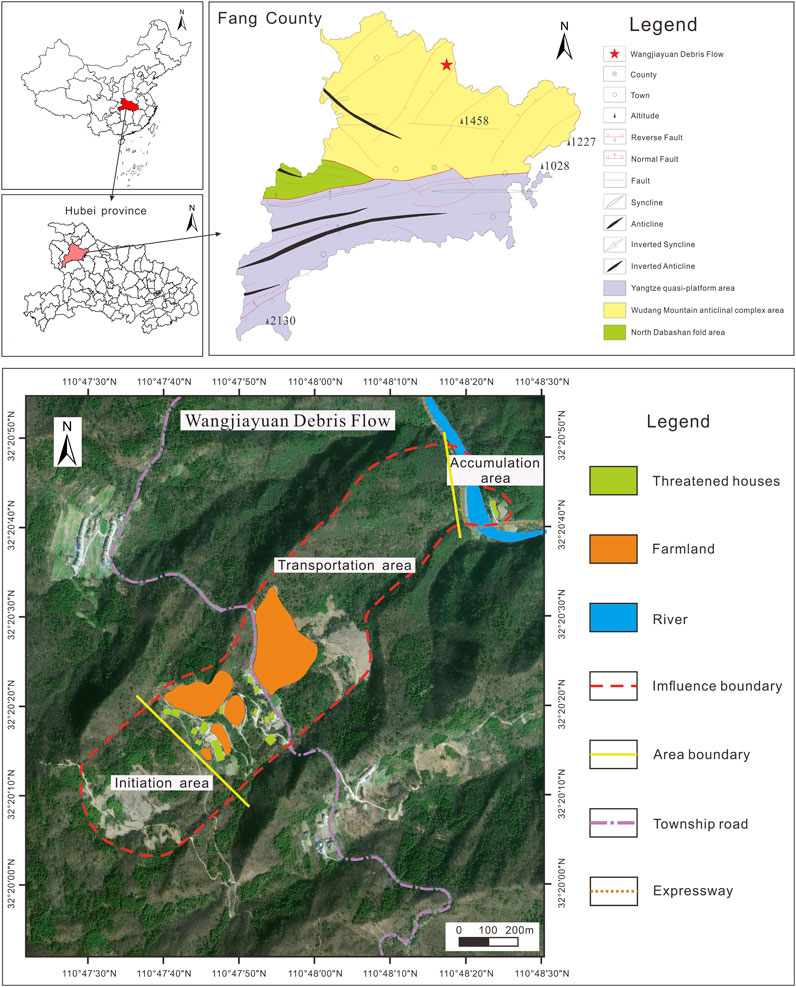
Figure 1. Location and optical imagery of the debris flow in Wangjiayuan.
2.2 Experimental design
Among numerous disaster monitoring and early warning devices available today, micro accelerometers stand out for their precision and timeliness. Typically, the time series data of vibration signals from experiments are analyzed using the short-time Fourier transform (STFT), as illustrated by Equation 1:
The vibration signal of debris flow is denoted as X(t), with g(t) representing the time-domain localized window function. The movement step size is denoted by τ, and the frequency by f. The Fourier transform, a ubiquitous tool in signal processing and analysis, is dedicated to converting time series into the frequency domain for spectral analysis (Wei and Liu, 2020). The short-time Fourier transform (STFT) involves decomposing waveforms into a sum of sinusoidal curves with varying frequencies (Lei et al., 2018), implying periodicity in both domains. Consequently, STFT holds more advantages in processing periodic signals (Huang et al., 2022).
The article commences with preprocessing of the original waveform by conducting mean and trend removal, along with a 1 Hz high-pass filter to eliminate the DC component and linear trend, and to mitigate unwanted low-frequency noise. This enables a clearer analysis of the signal’s high-frequency traits. Thereafter, the refined waveform undergoes a short-time Fourier transform, facilitated by SciPy (version 1.0), a fundamental tool for scientific computing in Python, to extract the frequency spectrum.
Globally, the clay content in debris flow cases has been statistically found to be around 5% (Institute of Mountain Hazards and Environment, Chinese Academy of Sciences, 2000). Perez (2001), in studying a clay debris flow in central Venezuela on 15 December 1999, discovered that the content of particles with a diameter less than 0.063 mm ranged from 1.3%–14.2%. Chen et al. (2010), based on records of 42 debris flow sediments along the 318 National Highway and the China Nepal Expressway, found that the content of silt and clay particles (less than 0.005 mm) varied between 1%–20%. Thus, five sets of flow channel experiments were designed with intervals of 1%–20% clay content. Simulating the initiation and movement process of debris flows with five distinct particle compositions, the experiments were conducted by mixing soil compositions with varying powder and clay contents, and instrument data recording was observed.
Physical model experiments were conducted to simulate the movement process of the Wangjiayuan debris flow, utilizing loose accumulated soil in the debris flow source area as the experimental material. Soil samples were prepared based on the in-situ soil moisture content and natural density, followed by the conduct of five experimental sets with varying clay content. Monitoring data from micro accelerometers were collected for subsequent analysis.
3 Physical model experiments
3.1 Experimental device
Based on the actual terrain of debris flow, a flow channel experimental installation for experimental use was designed and manufactured. The experimental installation measures 5.30 m in length, 1.65 m in width, and 1.65 m in height. Each groove’s corresponding material installation has a uniform width of 0.4 m and a capacity of 9.51 × 10⁻² cubic meters of material. The slope, which is 2.10 m in length, features a gradient of 32°. Baffles are positioned on both sides of the slope’s foot stacking area, which spans 3.00 m. The materials at the bottom and sides of the circulation area are crafted from tempered glass, facilitating clear observation of experimental phenomena and enabling more precise adjustments to the slope. A high-speed camera is positioned directly in front of the slope to capture the experimental process in real time, recording the landslide’s time and movement phenomena. A water flow channel is established behind the experimental installation to simulate groundwater, fulfilling experimental requirements, as depicted in Figure 2.
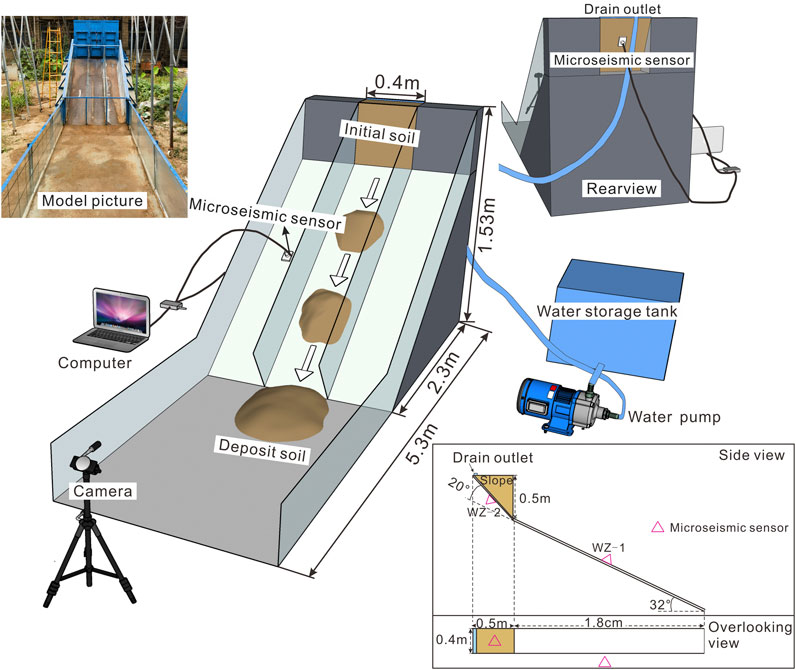
Figure 2. Experimental setup for physical model.
Two micro vibration sensors, labeled WZ-1 and WZ-2, are installed midway on the sliding bed in the source area and on the left slope of the circulation area, respectively. Both sensors are securely affixed to the acrylic board, as shown in Figure 2. WZ-1 is closely attached to the surface of the left slope to monitor the vibration acceleration changes during the middle source movement; WZ-2 is situated at the center of the bottom surface of the acrylic board within the material box and is used to detect the vibration acceleration changes of the sliding bed during startup.
This study incorporates a micro accelerometer supplied by the Chuo Kaihatsu Corporation for debris flow monitoring and early warning, as shown in Figure 3. Single-axis accelerometers was positioned near the monitored object to measure vibration acceleration. The system’s time correction, integrated with a GNSS receiver, was executed based on the measurement objectives and the actual bottom surface vibrations. During vibration monitoring, spectral analysis was conducted to determine the predominant period, with results wirelessly transmitted to the monitoring center via LoRa or FSK mode. So far, the company has successfully warned of debris flow disasters using this instrument.
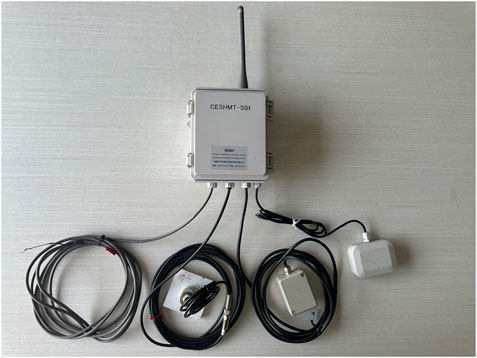
Figure 3. Micro accelerometer device.
The CESHMT-S01 miniature accelerometer was utilized in this experiment to monitor the onset and progression of debris flows. The instrument’s vibration monitoring bandwidth was configured to 0–125Hz, with Tera Term software facilitating real-time processing and visualization of the vibration waveforms. Upon initiation or as the debris flow traverses the mid-section of the flow path, the micro accelerometer captures data signals, logging the corresponding start and movement times in real time. Post-experiment, the collected raw data can be exported in XLS format for further analysis and processing.
3.2 Similarity of model experiment
Based on the similarity ratio experiment conducted by Guo et al. (2023) in the model experiment, the key of physical quantities in the model experiment can be written as follows:
Among these parameters, geometric length l, pore water pressure u, moisture content w, rainfall intensity q, displacement d, permeability coefficient k, time t, cohesion c, internal friction angle
According to Buckingham Pi’s theorem (Buckingham, 1914; 1915), Equation 2 can be expressed as Equations 3, 4 to obtain dimensionless parameters:
The model experiment is taken from loose deposits in the source area, so natural density and moisture content are used to fill the model. Therefore, the similarity ratio obtained through Equation 5 is:
Among them,
The Wangjiayuan debris flow source area, expansive in size, has a relatively low likelihood of being triggered by rainfall-induced runoff. Figure 4 illustrates that as rainfall intensity increases, the response of the groundwater level is more rapid, suggesting that the primary activation mechanism of the source area is likely groundwater recharge. Drawing on the research by Oke et al. (2015) and Hung and Merkel (2019) into the correlation between groundwater recharge rate and rainfall intensity, the rainfall monitoring data from the entire source area is integrated into the subsequent empirical formula:
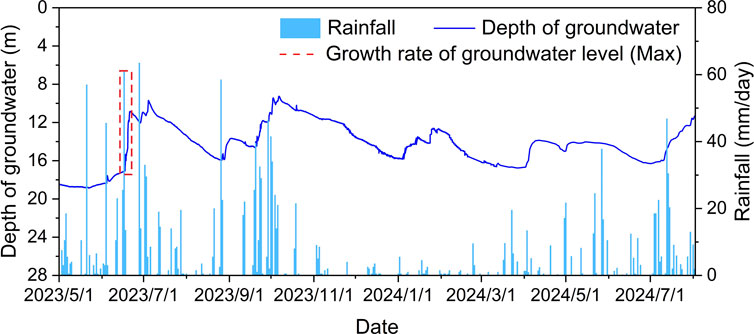
Figure 4. Monitoring data of rainfall and groundwater level in Wangjiayuan.
Among these parameters, R represents the groundwater recharge rate in millimeters per year (mm/year), and P denotes the rainfall rate in millimeters per year (mm/year). Referring to the rainfall intensity that elicited the greatest rise in groundwater level as depicted in Figure 4, the annual rainfall is calculated and then substituted into the empirical Equation 6. This yields a maximum recharge rate of 7710.5 mm/year, equating to 21.12 mm/day. The parameters of the model experiment are shown in Table 1.

Table 1. The physical and hydraulic properties of experimental soil.
Scale the model dimensions proportionally to the prototype’s dimensions, including length, width and height. Utilize on-site debris flow monitoring data and empirical formulas to determine the groundwater recharge rate. Concurrently, leveraging the prototype’s topography and recharge rate, simulate the debris flow movement process.
Fang et al. (2023b) presented a comprehensive plan for physical model experiments in a tabular format, which offers a detailed overview of the experiment’s key steps, including model preparation, instrument setup, testing procedures, and data collection methods. This structured approach ensures clarity in experimental design and streamlines the experimental process, ensuring that all fundamental steps are systematically executed and considered. By referring to this method, the study detailed various parameters of the model experiment (Table 2), facilitating understanding and potential replication of the experiment by others. This transparency in recording parameters enhances the study’s effectiveness and impact.
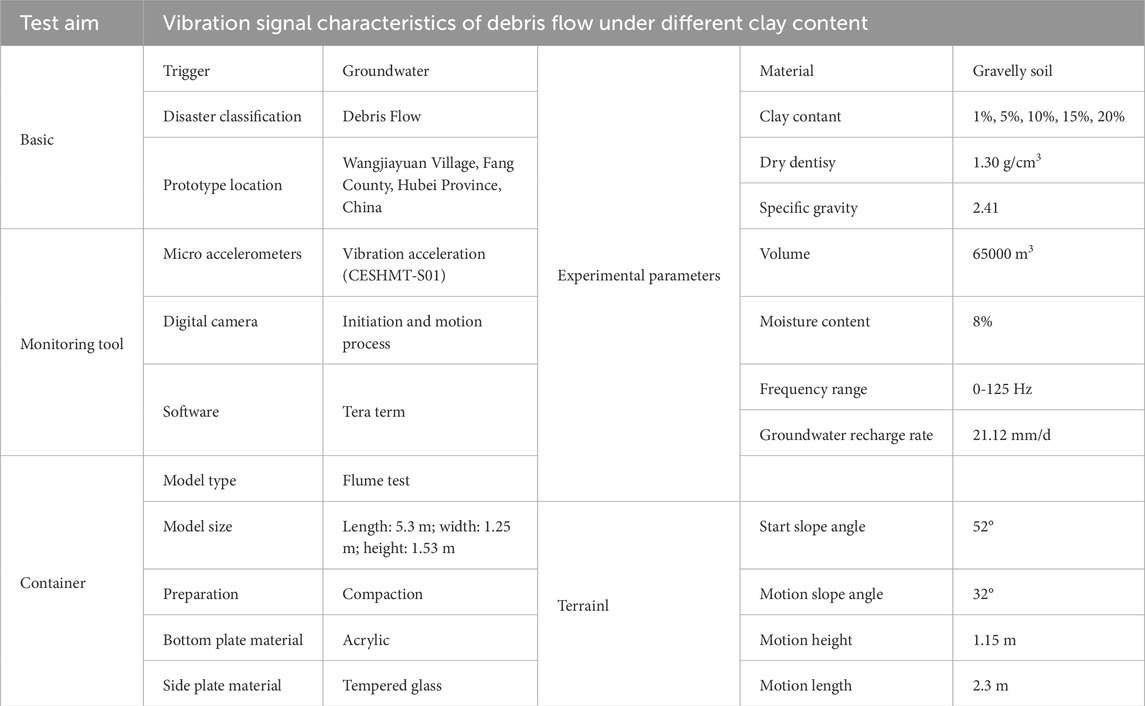
Table 2. Summarized protocol for a physical model test.
3.3 Experimental process
The experimental material consists of remolded soil from the loose source area of the Wangjiayuan debris flow. Building on prior experimental procedures (Tan et al., 2020; Lee et al., 2021; Li et al., 2022; Guo et al., 2023), and in accordance with geotechnical testing standards (Standardization Administration of the People’s Republic of China, 2019), soil samples with varying clay contents were designed and prepared as per the experimental protocol. The ratios for each set of samples are detailed in Table 1.
1. The experimental steps are outlined below.
(1) Sample preparation: Dry the experimental soil samples and measure their initial clay and moisture contents. Adjust the clay and moisture contents to meet the experimental requirements, mix thoroughly, then seal the soil samples in a glass jar for 24 h to ensure even moisture distribution.
(2) Instrument setup: Install micro accelerometers and other sensors at designated positions within the source and flow areas, connect the data cables to a computer, and verify their sensitivity and responsiveness. Concurrently, activate the groundwater simulation device to check its flow rate, ensuring all equipment operates correctly.
(3) Model preparation: Outline the slope on the experimental installation’s side wall based on the designed slope gradient, and fill it with soil samples. Each layer is filled to a height of 10 cm and compacted to the specified degree. Scrape the surface and proceed to the next layer until the designed height is attained.
(4) Experimental observation: Introduce water into the tank at the predetermined groundwater recharge rate and activate the high-speed camera to document the experiment. Cease collecting vibration acceleration data when more than 90% of the soil samples in the experimental installation have initiated movement and accumulated at the slope’s base, marking the end of the experiment. Record the accumulation pattern at the slope’s foot.
4 Results
4.1 Changes in ground vibration acceleration
This research involved five distinct physical model experiments, each characterized by unique particle size distributions. The initial data waveforms underwent preprocessing, which included trend removal, compensation for instrument response, and application of a 1 Hz high-pass filter. As an illustrative case, the experimental group with 1% clay content is highlighted, with the corresponding experimental procedure, data acquisition, and processing depicted in Figure 6.
Figures 5A, B exhibit the complete waveforms captured by two micro accelerometers post-processing. The source area experienced three significant startups, with corresponding waveforms, source area images, and final stacking morphologies depicted in Figure 5A. The startups occurred at 14.2 s, 38.7 s, and 48.2 s, respectively. The times for the flow to traverse the middle section of the circulation zone were 15.8 s, 44.1 s, and 53.2 s, respectively. During the initial startup, piping-induced runoff on the slope substantially reduced the sliding friction force, leading to a relatively short interval of 1.6 s between the startup and the flow’s passage through the middle section. Subsequent startups, where the material source lodged on the slope, increased the sliding friction force, thus extending the movement time. Consequently, the material source required 5.4 s and 5 s to reach the middle section of the circulation area after subsequent startups.
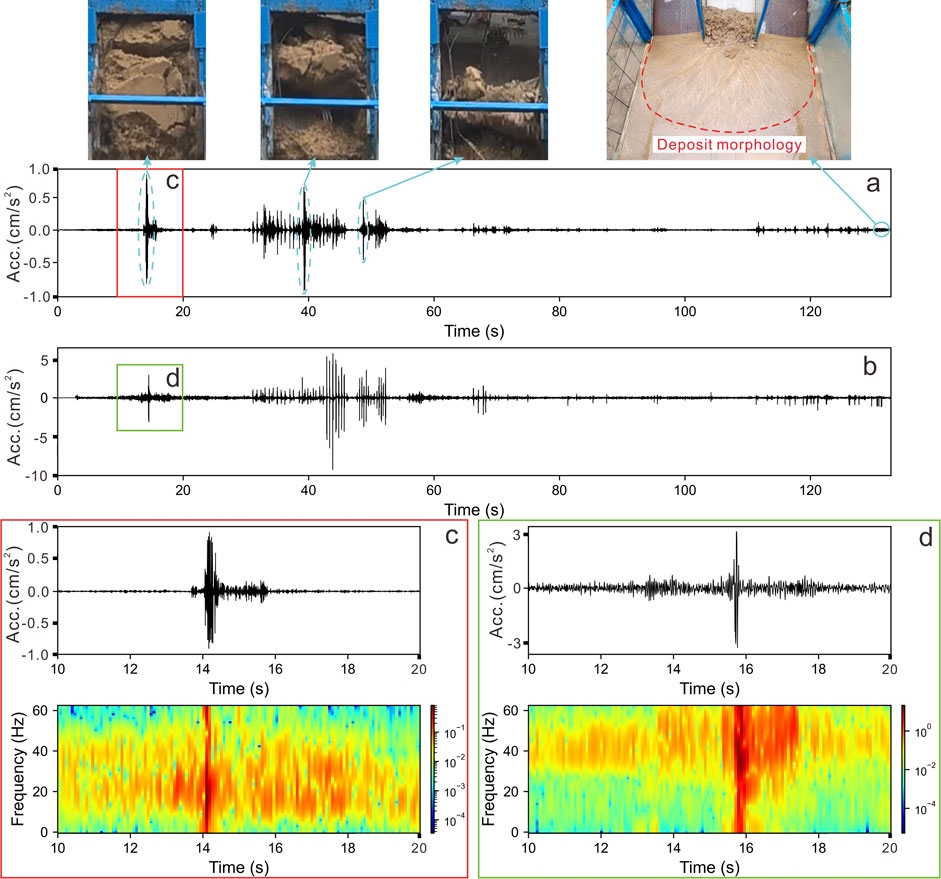
Figure 5. Pictures of the physical model test for the 1% clay content and the collection diagram of micro accelerometers (a-WZ-2; b-WZ-1; c-WZ-2 instrument waveform and time-frequency diagram; d-WZ-1 instrument waveform and time-frequency diagram.).
Figures 5C, D display the vibration acceleration waveform changes within the 10–20 s interval of the experiment, along with the time-frequency plots post-Fourier transform. The extreme value of the vibration acceleration for the three source startups recorded by the WZ-2 micro accelerometers sensor was 0.9 cm/s2, whereas the WZ-1 sensor recorded an extreme value of −9.1 cm/s2. As the debris flow evolves, a portion of the potential energy is converted into kinetic energy, resulting in increasing vibration acceleration.
4.2 Start and end times of physical model experiments
Data from the physical model experiments were utilized to statistically analyze the initial and final occurrence times of debris flows across five experimental groups. A power function was then fitted to these data, resulting in Figure 6.
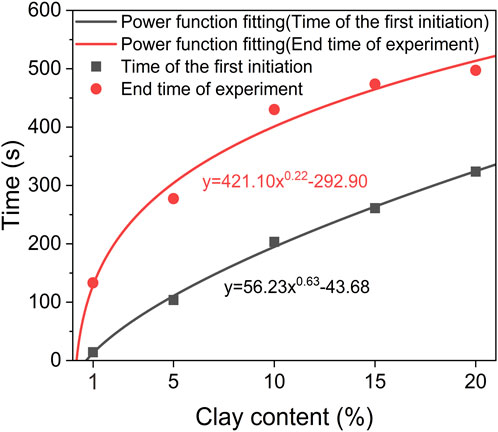
Figure 6. Power function fitting graph of the relationship between the clay content of five physical model experiments and the first start-up time and the end time of the experiment.
An increase in clay content correlates with a power function trend of increasing for both the initial start-up time and the total experimental duration. The source with a 10% clay content exhibits the longest time interval from the initial start to the experiment’s conclusion, as observed in the figure. Decreased clay content results in reduced self-cohesion of the source soil and lower shear strength, making it more susceptible to initiation under the influence of water flow erosion. Consequently, the source with a 1% clay content initiates earliest and concludes most rapidly, with the shortest time interval from the initial start to the experiment’s end. As clay particle content rises, the initial start-up time, end time, and intermediate intervals also increase. However, at a clay content of 15%, the interval between the initial start-up and the experiment’s end begins to decrease with further increases in clay content. On-site experimental analysis reveals that with higher clay content, the volume of source material initiating each time increases, necessitating fewer start-up instances to conclude the experiment and consequently shortening the debris flow duration.
The physical model experiment, designed to replicate actual debris flow terrain, incorporates the initiation and cessation timing patterns observed in the model. Utilizing the relationship between clay content and the timing of these events, it is possible to deduce the onset, conclusion, and duration of real-world debris flows. Consequently, timely public evacuation and emergency response measures can be implemented to mitigate the risk of disaster to the populace and safeguard their lives and property.
5 Discussion
5.1 Predominant period
The predominant period is defined as the interval during which the frequency component within a debris flow’s vibration signal exhibits the greatest prominence. It denotes the period of the most significant periodic fluctuations in the signal, aligning with the frequency component that possesses the maximum energy and extends over the longest interval (Zhao, 2006). Within the scope of the physical model experiment, a Fourier transform was applied to the vibration acceleration data corresponding to the initiation and motion phases of debris flows with varying clay contents, as illustrated in Figure 7. This analysis enabled the extraction of the predominant periods associated with these phases. Subsequently, the salient cycles for each clay content were compiled, with the findings presented in Figure 8.
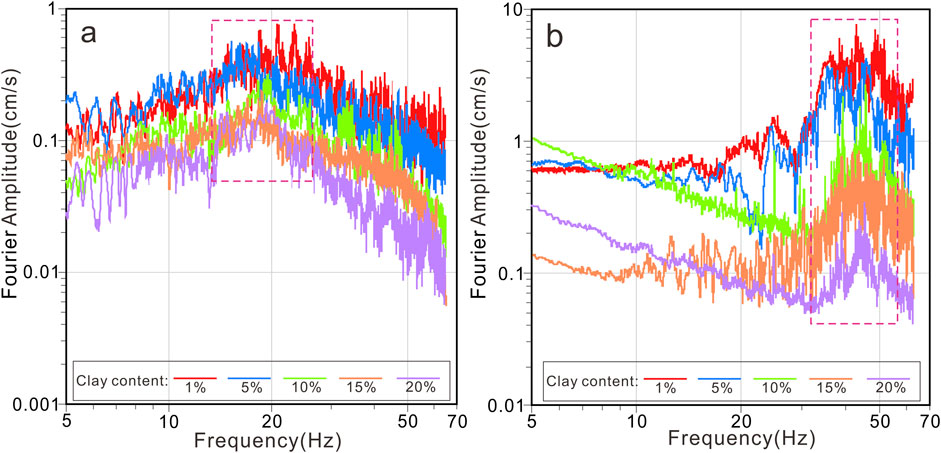
Figure 7. Spectral analysis of five sets of model experiments after short-time Fourier transform ((A)-data from the WZ-2 sensor, (B)-data from the WZ-1 sensor).
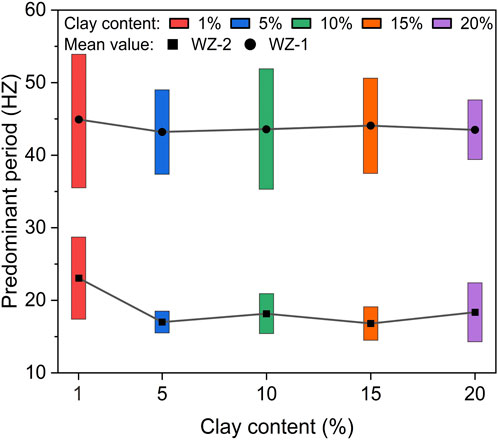
Figure 8. Corresponding graph of clay content and predominant period frequency in five sets of model experiments.
The predominant period of debris flow initiation was found to range from 15 to 29 Hz, with the 1% clay content group exhibiting the broadest predominant period range and the 5% clay content group the narrowest. The movement to the middle section of the circulation zone showed a predominant period frequency range of 36–54 Hz, with the 1% clay content group having the largest predominant period range and the 20% clay content group the smallest. Based on previous research on the excellence cycle, as shown in Figure 9, the frequency range of debris flow is between 2 and 120HZ. (Lai et al., 2018; Schimmel et al., 2018; 2022; Marchetti et al., 2019; Belli et al., 2022; Huang et al., 2022). This study diverges from its predecessors by amalgamating the optimal cycle frequency ranges from five model experiments, thereby enhancing the discrimination of the superior cycles associated with debris flow initiation and movement. This approach furnishes empirical evidence for the monitoring of debris flow vibration acceleration in the field. This experiment utilized a single debris flow source material, neglecting to examine the effects of diverse source materials on debris flow vibration signal characteristics. Future studies should address this gap.
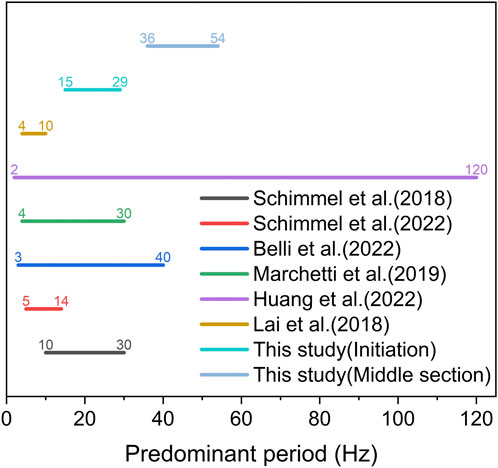
Figure 9. Summary of predominant periods for this experiment and others.
Figure 8 illustrates the average frequency size and range of the predominant period for each experimental group. It shows a generally decreasing trend with increasing clay content and an increasing frequency range and mean as debris flow movement progresses. Huang et al. (2007) found that the peak frequency of ground vibrations generated by larger rocks is lower. This experiment corroborates that as debris flows progress, soil with lower clay content experiences stronger shear forces, leading to the breakdown of large rock and soil masses into smaller particles with decreasing average sizes and increasing frequencies. The vibration frequency generated by particles of varying sizes differs; as the rock and soil mass disintegrates, the expanding range of particle sizes broadens the frequency range of the predominant period. The fragmentation and disintegration of rock and soil consume energy, affecting particle size and leading to variations in the predominant period and amplitude of vibration acceleration.
5.2 The relationship between Fourier amplitude and clay content
Based on the predominant period of each experiment in Figure 7, the maximum amplitude values within the predominant period of each experiment were statistically analyzed, and an exponential function was used for fitting, as shown in Figure 10.
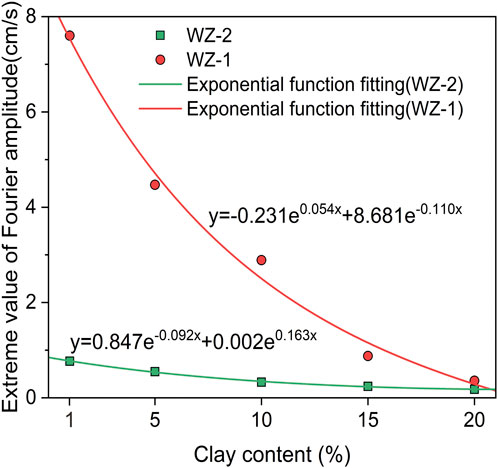
Figure 10. Correspondence between Fourier amplitude extremum and clay content during the predominant period of each experimental group.
Initially, the Fourier amplitude of vibration acceleration within the predominant period trends upward, with all extreme values exceeding 0.1 cm/s. Upon reaching a certain point within the circulation area, this trend becomes significantly pronounced, with extreme values surpassing 0.3 cm/s. The Fourier amplitudes from two instruments were fitted to a viscosity relationship graph using a power function, allowing direct calculation of particle viscosity content within the debris flow using the Fourier amplitude.
Figure 10 also reveals that the amplitude extremum decreases with increasing clay content. As the motion progresses, the disparity in Fourier amplitude extremum for debris flows with lower clay content increases. The higher the clay particle content in the soil, the greater the shear strength, leading to increased energy consumption during rock and soil fragmentation. This results in a reduced Fourier amplitude of vibration acceleration.
A link established between debris flow source clay content and vibration signal characteristics allows for the differentiation of debris flow movement states via dominant periods and the prediction of clay content from dominant period amplitudes. Experiments by Malet et al. (2005) indicated that increased clay content in debris flows correlates with reduced movement distances and significant effects on accumulation morphology. By correlating clay particle content with mobility and accumulation morphology and integrating vibration signal attributes of debris flow movement, predictions of clay content, movement distances, and accumulation patterns can be made. These predictions enhance risk assessment, risk level categorization, and the mitigation of casualties and property damage.
6 Conclusion
This experiment, using the Wangjiayuan debris flow as a case study, employs physical model experiments to replicate its initiation and movement processes, monitored and recorded with a micro accelerometer. The records indicate that the micro accelerometer clearly captures the initiation and transit times of the debris flow to the middle section of the flow zone. An increase in clay content correlates with an increasing trend in both the initial initiation time and the total experimental duration.
The five experimental datasets underwent a Fourier transform, yielding a frequency spectrum. From the spectrum, it can be observed that the dominant period of vibration acceleration during the initiation of debris flow is 15HZ-29HZ, and the dominant period of vibration acceleration when moving to the middle section of the flow zone is 36HZ-54HZ. As clay content increases, the range and mean of the predominant period exhibit a decreasing trend, while the frequency range and mean of the predominant period increase with debris flow motion progression. Post-initiation, the Fourier amplitude within the predominant period also trends upward, with lower clay content debris flows showing a more pronounced amplitude increase during movement. Consequently, increasing the clay particle content in the debris flow source area leads to greater energy consumption due to shear action during movement, resulting in a significant decrease in Fourier amplitude and enhanced stability of the rock and soil mass during the movement process.
Drawing from the findings presented, future experiments could incorporate a broader range of rock and soil types, yielding more extensive research outcomes through the analysis of substantial experimental data. The scope of disaster types examined in these experiments need not be confined to geological hazards like mudslides and landslides; advancements can also be made in related research areas. Progress in research predicated on ground vibration characteristics can establish a foundation for disaster monitoring, thereby safeguarding the wellbeing and assets of the populace.
Data availability statement
The raw data supporting the conclusions of this article will be made available by the authors, without undue reservation.
Author contributions
ZL: Conceptualization, Data curation, Formal Analysis, Investigation, Methodology, Project administration, Software, Supervision, Validation, Visualization, Writing–original draft, Writing–review and editing. ZH: Formal Analysis, Methodology, Visualization, Writing–review and editing, Data curation, Software. PL: Conceptualization, Funding acquisition, Resources, Supervision, Writing–review and editing. ZT: Data curation, Investigation, Methodology, Writing–review and editing. EJ: Data curation, Investigation, Methodology, Writing–review and editing. TL: Formal Analysis, Funding acquisition, Investigation, Resources, Supervision, Validation, Writing–review and editing.
Funding
The author(s) declare that financial support was received for the research, authorship, and/or publication of this article. This work was supported by the Natural Science Basic Research Program of Shaanxi (No. 2023-JC-YB-225), the Fundamental Research Funds for the Central Universities, CHD (No. 300102264503) and the National Key R&D Program of China (2021YFE0111900). Financial support is gratefully acknowledged.
Acknowledgments
The authors would like to express our sincere appreciation to the three reviewers for their valuable comments and suggestions. Thanks to Giulio Iovine and other editors for their hard work during the review process of this paper. We thank Mumtaz Haider, from Chang’an University, for editing the English text of a draft of this manuscript.
Conflict of interest
Author ZT was employed by PowerChina Northwest Engineering Corporation Limited.
The remaining authors declare that the research was conducted in the absence of any commercial or financial relationships that could be construed as a potential conflict of interest.
Generative AI statement
The author(s) declare that no Generative AI was used in the creation of this manuscript.
Publisher’s note
All claims expressed in this article are solely those of the authors and do not necessarily represent those of their affiliated organizations, or those of the publisher, the editors and the reviewers. Any product that may be evaluated in this article, or claim that may be made by its manufacturer, is not guaranteed or endorsed by the publisher.
References
Arattano, M. (1999). On the use of seismic detectors as monitoring and warning systems for debris flows. Nat. Hazards 20, 197–213. doi:10.1023/a:1008061916445
Belli, G., Walter, F., McArdell, B., Gheri, D., and Marchetti, E. (2022). Infrasonic and seismic analysis of debris-flow events at illgraben (Switzerland): relating signal features to flow parameters and to the seismo-acoustic source mechanism. J. Geophys. Res. Earth Surf. 127, e2021JF006576. doi:10.1029/2021JF006576
Bessason, B., Eiríksson, G., Thorarinsson, Ó., Thórarinsson, A., and Einarsson, S. (2007). Automatic detection of avalanches and debris flows by seismic methods. J. Glaciol. 53, 461–472. doi:10.3189/002214307783258468
Biescas, B., Dufour, F., Furdada, G., Khazaradze, G., and Suriñach, E. (2003). Frequency content evolution of snow avalanche seismic signals. Surv. Geophys. 24, 447–464. doi:10.1023/B:GEOP.0000006076.38174.31
Buckingham, E. (1914). On physically similar systems; illustrations of the use of dimensional equations. Phys. Rev. 4, 345–376. doi:10.1103/physrev.4.345
Chen, N., Gao, Y., Yang, C., and Hu, G. (2018). Effect of clay content to the strength of gravel soil in the source region of debris flow. J. Mt. Sci. 15, 2320–2334. doi:10.1007/s11629-018-4911-8
Chen, N.Sh., Zhou, W., Yang, Ch. L., Hu, G.Sh., Gao, Y.Ch., and Han, D. (2010). The processes and mechanism of failure and debris flow initiation for gravel soil with different clay content. Geomorphology 121, 222–230. doi:10.1016/j.geomorph.2010.04.017
Cina, A., Manzino, A. M., and Bendea, I. H. (2019). Improving GNSS landslide monitoring with the use of low-cost MEMS accelerometers. Appl. Sci. 5075, 5075. doi:10.3390/app9235075
Coviello, V., Arattano, M., Comiti, F., Macconi, P., and Marchi, L. (2019). Seismic characterization of debris flows: insights into energy radiation and implications for warning. J. Geophys. Res. Earth Surf. 124, 1440–1463. doi:10.1029/2018JF004683
Coviello, V., Arattano, M., and Turconi, L. (2015). Detecting torrential processes from a distance with a seismic monitoring network. Nat. Hazards 78, 2055–2080. doi:10.1007/s11069-015-1819-2
Cui, P. (1992). Studies on condition and mechanism of debris flow initiation by means of experiment. Chin. Sci. Bull. 37 (9), 759–763. doi:10.1360/sb1992-37-9-759
Cui, P., Chen, X., Waqng, Y., Hu, K., and Li, Y. (2005). Jiangjia Ravine debris flows in south-western China. Debris-Flow Hazards Relat., 565–594. doi:10.1007/3-540-27129-5_22
Cui, Y., Zhou, X., and Guo, C. (2017). Experimental study on the moving characteristics of fine grains in wide grading unconsolidated soil under heavy rainfall. J. Mt. Sci. 14, 417–431. doi:10.1007/s11629-016-4303-x
Dong, H., Fang, L., Tao, Z., Pang, L., Zhao, N., and Li, X. (2023). Geoacoustic monitoring technology of debris flow based on piezoelectric sensor. Arab. J. Geosci. 16, 2. doi:10.1007/s12517-022-11077-3
Faillettaz, J., Funk, M., Beutel, J., and Vieli, A. (2019). Towards early warning of gravitational slope failure with co-detection of microseismic activity: the case of an active rock glacier. Nat. Hazards Earth Syst. Sci. 19, 1399–1413. doi:10.5194/nhess-19-1399-2019
Fang, K., Jia, S., Tang, H., Zhou, R., Kong, Z., Fu, Y., et al. (2024). Arching effect in slopes under excavation: classification and features. Eng. Geol. 337, 107563. doi:10.1016/j.enggeo.2024.107563
Fang, K., Miao, M., Tang, H., Jia, S., Dong, A., An, P., et al. (2023a). Insights into the deformation and failure characteristic of a slope due to excavation through multi-field monitoring: a model test. Acta Geotech. 18, 1001–1024. doi:10.1007/s11440-022-01627-0
Fang, K., Tang, H., Li, C., Su, X., An, P., and Sun, S. (2023b). Centrifuge modelling of landslides and landslide hazard mitigation: a review. Geosci. Front. 14, 101493. doi:10.1016/j.gsf.2022.101493
Farin, M., Tsai, V. C., Lamb, M. P., and Allstadt, K. E. (2019). A physical model of the high-frequency seismic signal generated by debris flows. Earth Surf. Process. Landf. 44, 2529–2543. doi:10.1002/esp.4677
Federico, F., and Cesali, C. (2015). An energy-based approach to predict debris flow mobility and analyze empirical relationships. Can. Geotech. J. 52, 2113–2133. doi:10.1139/cgj-2015-0107
Guo, J., Cui, P., Qin, M., Wang, J., Li, Y., and Wang, C. (2022a). Response of ancient landslide stability to a debris flow: a multi-hazard chain in China. Bull. Eng. Geol. Environ. 81, 273. doi:10.1007/s10064-022-02745-5
Guo, J., Cui, Y., Xu, W., Shen, W., Li, T., and Yi, S. (2022b). A novel friction weakening-based dynamic model for landslide runout assessment along the Sichuan-Tibet Railway. Eng. Geol. 306, 106721. doi:10.1016/j.enggeo.2022.106721
Guo, J., Cui, Y., Xu, W., Yin, Y., Li, Y., and Jin, W. (2022c). Numerical investigation of the landslide-debris flow transformation process considering topographic and entrainment effects: a case study. Landslides 19, 773–788. doi:10.1007/s10346-021-01791-6
Guo, J., Wang, J., Li, Y., and Yi, S. (2021). Discussions on the transformation conditions of Wangcang landslide-induced debris flow. Landslides 18, 1833–1843. doi:10.1007/s10346-021-01650-4
Guo, Z., Huang, Q., Liu, Y., Wang, Q., and Chen, Y. (2023). Model experimental study on the failure mechanisms of a loess-bedrock fill slope induced by rainfall. Eng. Geol. 313, 106979. doi:10.1016/j.enggeo.2022.106979
He, K., Liu, B., Hu, X., Zhou, R., Xi, C., Ma, G., et al. (2022). Rapid characterization of landslide-debris flow chains of geologic hazards using multi-method investigation: case study of the tiejiangwan LDC. Rock Mech. Rock Eng. 55, 5183–5208. doi:10.1007/s00603-022-02905-9
Hu, M., Pan, H., Wei, H., Wang, R., and A, Y. (2013). Landslides and debris flows formation from gravelly soil surface erosion and particle losses in Jiangjia Ravine. J. Mt. Sci. 10, 987–995. doi:10.1007/s11629-012-2526-z
Hu, W., Scaringi, G., Xu, Q., and Huang, R. (2018). Acoustic emissions and microseismicity in granular slopes prior to failure and flow-like motion: the potential for early warning. Res. Lett. 45. doi:10.1029/2018GL079724
Hu, X., Zhang, L., Hu, K., Cui, L., Wang, L., Xia, Z., et al. (2022). Modelling the evolution of propagation and runout from a gravel–silty clay landslide to a debris flow in Shaziba, southwestern Hubei Province, China. Landslides 19, 2199–2212. doi:10.1007/s10346-022-01897-5
Huang, C., Yin, H., Chen, C., Yeh, C., and Wang, C. (2007). Ground vibrations produced by rock motions and debris flows. J. Geophys. Res. Earth Surf. 112, 2005JF000437. doi:10.1029/2005JF000437
Huang, C.-J., Chen, H.-Y., Chu, C.-R., Lin, C.-R., Yen, L.-C., Yin, H.-Y., et al. (2022). Low-frequency ground vibrations generated by debris flows detected by a lab-fabricated seismometer. Sensors 22, 9310–9334. doi:10.3390/s22239310
Huang, C.-J., Yeh, C.-H., Chen, C.-Y., and Chang, S.-T. (2008). Ground vibrations and airborne sounds generated by motion of rock in a river bed. Nat. Hazards Earth Syst. Sci. 8, 1139–1147. doi:10.5194/nhess-8-1139-2008
Hung, V., and Merkel, B. J. (2019). Estimating groundwater recharge for hanoi, vietnam. Sci. Total Environ. 651, 1047–1057. doi:10.1016/j.scitotenv.2018.09.225
Hungr, O., Leroueil, S., and Picarelli, L. (2014). The Varnes classification of landslide types, an update. Landslides 11, 167–194. doi:10.1007/s10346-013-0436-y
Hürlimann, M., Rickenmann, D., and Graf, C. (2003). Field and monitoring data of debris-flow events in the Swiss Alps. Can. Geotech. J. 40, 161–175. doi:10.1139/t02-087
Institute of Mountain Hazards and Environment, Chinese Academy of Sciences (2000). Debris flows in China. Beijing: The Commercial Press.
Iverson, R. M., Denlinger, R. P., LaHusen, R. G., and Logan, M. (2000). “Two-phase debris-flow across 3-D terrain: model predictions and experimental tests,” in Debris-flow hazards mitigation: mechanics, prediction, and assessment. Editor G. F. Wieczorek, and N. D. Naeser, 521–529.
Iverson, R. M., and LaHusen, R. G. (1989). Dynamic pore-pressure fluctuations in rapidly shearing granular materials. Science 246, 796–799. doi:10.1126/science.246.4931.796
Lacroix, P., and Helmstetter, A. (2011). Location of seismic signals associated with microearthquakes and rockfalls on the sechilienne landslide, French alps. Bull. Seismol. Soc. Am. 101, 341–353. doi:10.1785/0120100110
Lai, V. H., Tsai, V. C., Lamb, M. P., Ulizio, T. P., and Beer, A. R. (2018). The seismic signature of debris flows: flow mechanics and early warning at montecito, California. Geophys. Res. Lett. 45, 5528–5535. doi:10.1029/2018GL077683
Lavigne, F., Thouret, J.-C., Voight, B., Young, K., LaHusen, R., Marso, J., et al. (2000). Instrumental lahar monitoring at merapi volcano, central java, Indonesia. J. Volcanol. Geotherm. Res. 100, 457–478. doi:10.1016/S0377-0273(00)00151-7
Lee, K., Suk, J., Kim, H., and Jeong, S. (2021). Modeling of rainfall-induced landslides using a full-scale flume test. Landslides 18, 1153–1162. doi:10.1007/s10346-020-01563-8
Lei, Y., Cui, P., Zeng, C., and Guo, Y. (2018). An empirical mode decomposition-based signal process method for two-phase debris flow impact. Landslides 15, 297–307. doi:10.1007/s10346-017-0864-1
Li, K., Wang, Y., Cheng, Q., Lin, Q., Wu, Y., and Long, Y. (2022). Insight into granular flow dynamics relying on basal stress measurements: from experimental flume tests. J. Geophys. Res. Solid Earth 127, e2021JB022905. doi:10.1029/2021JB022905
Marchetti, E., Walter, F., Barfucci, G., Genco, R., Wenner, M., Ripepe, M., et al. (2019). Infrasound array analysis of debris flow activity and implication for early warning. J. Geophys. Res. Earth Surf. 124, 567–587. doi:10.1029/2018JF004785
Najafabadi, H. R., Goto, T. G., Martins, T. C., Tsuzuki, M. S. G., and Barari, A. (2024). Designing MEMS accelerometer for enhanced sensitivity and reduced cross-sensitivity in landslide monitoring. Measurement 226, 114092. doi:10.1016/j.measurement.2023.114092
Nishiguchi, Y., and Uchida, T. (2022). Long-Runout-landslide-induced debris flow: the role of fine sediment deposition processes in debris flow propagation. J. Geophys. Res. Earth Surf. 127, e2021JF006452. doi:10.1029/2021JF006452
Oke, M. O., Martins, O., Idowu, O. A., and Aiyelokun, O. (2015). Comparative analysis of ground-water recharge estimation value obtained using empirical methods in Ogun and Oshun river basins. Ife J. Sci. 17, 53–63. Available at: https://www.ajol.info/index.php/ijs/article/view/131790/121389
Otero, M. D., Guimarães, M. P. P., de Macedo, E. S., and Corsi, A. C. (2022). Use of low-cost accelerometers for landslides monitoring:results from a flume experiment. Soils Rocks 45, e2022078621. doi:10.28927/SR.2022.078621
Perez, F. L. (2001). Matrix granulometry of catastrophic debris flows (December 1999) in central coastal Venezuela. CATENA 45, 163–183. doi:10.1016/s0341-8162(01)00149-7
Pierson, T. C. (1981). Dominant particle support mechanisms in debris flows at Mt Thomas, New Zealand, and implications for flow mobility. Sedimentology 28, 49–60. doi:10.1111/j.1365-3091.1981.tb01662.x
Qi, X., Yu, B., and Ren, J. (2016). Experimental study on the formation of debris flow from landslide clastic deposition. Int. J. Georesources Environ. 2, 214–226. doi:10.15273/ijge.2016.04.020
Reid, M. E., Brien, D. L., LaHusen, R. G., and Roering, J. J. (2003). Debris-flow initiation from large, slow-moving landslides. Researchgate 1, 155–166.
Schimmel, A., Coviello, V., and Comiti, F. (2022). Debris flow velocity and volume estimations based on seismic data. Nat. Hazards Earth Syst. Sci. 22, 1955–1968. doi:10.5194/nhess-22-1955-2022
Schimmel, A., and Hübl, J. (2016). Automatic detection of debris flows and debris floods based on a combination of infrasound and seismic signals. Landslides 13, 1181–1196. doi:10.1007/s10346-015-0640-z
Schimmel, A., Hübl, J., McArdell, B. W., and Walter, F. (2018). Automatic identification of alpine mass movements by a combination of seismic and infrasound sensors. Sensors 1658, 1658. doi:10.3390/s18051658
Standardization Administration of the People's Republic of China. (2019). GB/T 50123-2019 Standard for geotechnical testing method,.
Suwa, H., Okano, K., and Kanno, T. (2009). Behavior of debris flows monitored on test slopes of Kamikamihorizawa Creek, Mount Yakedake, Japan. Int. J. Eros. Control Eng. 2, 33–45. doi:10.13101/ijece.2.33
Takahashi, T. (2014). Debris flow: mechanics, prediction, and countermeasures. 2nd edition. Boca Raton: CRC Press.
Tan, D.-Y., Yin, J.-H., Feng, W.-Q., Qin, J.-Q., and Zhu, Z.-H. (2020). New simple method for measuring impact force on a flexible barrier from rockfall and debris flow based on large-scale flume tests. Eng. Geol. 279, 105881. doi:10.1016/j.enggeo.2020.105881
Tu, R., Wang, R., Ge, M., Walter, T. R., Ramatschi, M., Milkereit, C., et al. (2013). Cost-effective monitoring of ground motion related to earthquakes, landslides, or volcanic activity by joint use of a single-frequency GPS and a MEMS accelerometer. Geophys. Res. Lett. 40, 3825–3829. doi:10.1002/grl.50653
Vouillamoz, N., Rothmund, S., and Joswig, M. (2018). Characterizing the complexity of microseismic signals at slow-moving clay-rich debris slides: the Super-Sauze (southeastern France) and Pechgraben (Upper Austria) case studies. Earth Surf. Dyn. 6 (6), 525–550. doi:10.5194/esurf-6-525-2018
Wang, J., Li, P., Gu, Q., Xu, Y., and Gu, T. (2019). Changes in tensile strength and microstructure of loess due to vibration. J. Asian Earth Sci. 169, 298–307. doi:10.1016/j.jseaes.2018.10.011
Wei, S.-C., and Liu, K.-F. (2020). Automatic debris flow detection using geophones. Landslides 17, 349–359. doi:10.1007/s10346-019-01258-9
Yang, Y., Chen, G., Li, Y., Meng, X., Chong, Y., Bian, S., et al. (2024). Characterization of stream, hyperconcentrated and debris flows from seismic signals: insights into sediment transport mechanisms and flow dynamics. J. Geophys. Res. Earth Surf. 129, e2023JF007527. doi:10.1029/2023JF007527
Yu, B., Ma, Y., and Qi, X. (2012). Experimental study on the influence of clay minerals on the yield stress of debris flows. J. Hydraul. Eng. 139, 364–373. doi:10.1061/(ASCE)HY.1943-7900.0000679
Zeng, Q., Zhu, S., Li, Z., Wu, A., Wang, M., Su, Y., et al. (2023). Research on real-time monitoring and warning technology for multi-parameter underground debris flow. Sustainability 15, 15006. doi:10.3390/su152015006
Keywords: debris flow, clay content, micro accelerometers, short-time fourier transform, predominant period
Citation: Li Z, Huang Z, Li P, Tian Z, Jia E and Li T (2025) Vibration signal characteristics of debris flow initiation and motion experiments by considering clay content. Front. Earth Sci. 13:1519353. doi: 10.3389/feart.2025.1519353
Received: 29 October 2024; Accepted: 06 January 2025;
Published: 29 January 2025.
Edited by:
Giulio Iovine, National Research Council (CNR), ItalyReviewed by:
Zhongqiong Zhang, Chinese Academy of Sciences (CAS), ChinaKun Fang, Hong Kong University of Science and Technology, Hong Kong SAR, China
Georg Nagl, University of Natural Resources and Life Sciences Vienna, Austria
Copyright © 2025 Li, Huang, Li, Tian, Jia and Li. This is an open-access article distributed under the terms of the Creative Commons Attribution License (CC BY). The use, distribution or reproduction in other forums is permitted, provided the original author(s) and the copyright owner(s) are credited and that the original publication in this journal is cited, in accordance with accepted academic practice. No use, distribution or reproduction is permitted which does not comply with these terms.
*Correspondence: Tonglu Li, ZGNkZ3gwOEBjaGQuZWR1LmNu