 Xudong Wang
 Zicheng Yang
 Xibao Liu2
 Chengyuan Yuan
94% of researchers rate our articles as excellent or good
Learn more about the work of our research integrity team to safeguard the quality of each article we publish.
Find out more
ORIGINAL RESEARCH article
Front. Earth Sci. , 21 February 2025
Sec. Sedimentology, Stratigraphy and Diagenesis
Volume 13 - 2025 | https://doi.org/10.3389/feart.2025.1506709
This article is part of the Research Topic Advances in Sequence Stratigraphy Interpretation and Their Implications View all articles
The D Oilfield in the Songliao Basin has entered a critical phase of hydrocarbon exploration targeting the Quantou Formation. However, challenges persist in achieving precise stratigraphic division, sedimentary cycle characterization, and microfacies prediction. This study aims to enhance stratigraphic resolution and prediction accuracy of sedimentary microfacies to address uncertainties in sand body distribution within dense well pattern areas. Integrated Pattern Recognition and Fuzzy Analysis (INPEFA) was applied to natural gamma logging data from 4,215 wells, combined with maximum entropy spectrum attribute analysis (MESA) for high-precision sequence interface identification. Multi-point geostatistical simulations were implemented using well data and INPEFA-derived sequence stratigraphic frameworks. High-order compatibility algorithms constrained the simulations, with iterative human-computer interaction refining sedimentary microfacies models for three sand groups. Three distinct sedimentary phases were resolved: (1) Sand Group III exhibits rapid water encroachment with narrow, strip-like sand bodies; (2) Sand Group II records gradual lacustrine regression, forming extensive sheet-like sands; (3) Sand Group I reaches maximum flooding conditions, displaying laterally continuous sand bodies with intensified fluvial dynamics. The method predicts sedimentary microfacies under INPEFA curve constraints, which makes sequence interface identification more intuitive and improves cycle division and correlation precision. This multi-point geostatistics-based prediction image accurately reproduces river channel distribution patterns, offering high predictability and presenting a novel approach to characterizing fine sand bodies. This integrated approach not only predicts sedimentary microfacies distribution in dense well pattern areas of the Songliao Basin, but also presents a novel solution to the challenging geological problem of accurately forecasting effective sand body distribution. Furthermore, it provides critical stratigraphic evidence for developing remaining oil potential strategies in the basin, while offering an innovative methodology for reservoir characterization in other mature exploration regions worldwide.
The Songliao Basin, a pivotal region for oil and gas exploration endeavors in China, is characterized by geological complexities that necessitated enhanced precision in exploration techniques (Feng and Graham, 2023). Recent research indicates that the D oilfield within this basin has entered a new phase of development (Shen et al., 2023), highlighting the need for refined stratigraphic delineation and detailed sedimentary microfacies description. The extensive study area, coupled with complex geological conditions and a dense well pattern, significantly limits the effectiveness of traditional manual sedimentary microfacies mapping. Although the manual method leverages the expertise and experience of geological personnel, it faces challenges such as a substantial workload, high subjectivity, and inconsistent quality assurance.
The introduction of the INPEFA curve through Maximum Entropy Spectral Attribute Analysis (MESA) technology signifies a substantial advancement in stratigraphic analysis. Unlike traditional methods, which are heavily reliant on seismic data and core samples, this novel approach utilizes natural gamma logging data, which is more accessible and circumvents the limitations imposed by core sampling lengths. The INPEFA curve, derived through MESA technology, provides a high-resolution stratigraphic analysis by identifying inflection points indicative of amplitude trend changes across the strata (Zhang et al., 2022). This method offers a novel perspective for identifying base-level cycle information across various orders, thereby aiding in the division and correlation of sand groups (Wang et al., 2023c). The novelty of this approach lies in its ability to provide detailed stratigraphic information in areas where conventional methods are constrained by data resolution and sampling limitations, thus opening new avenues for exploration in similarly complex geological settings.
Guardiano and Srivastava proposed multi-point geostatistics, in which data events were obtained by scanning training images of data samples to reflect corresponding geological patterns, and the occurrence frequency of different data events was approximated as the joint distribution probability of multiple points in space (Guardiano and Graham, 1993). This foundational work has been pivotal in developing methods to interpret complex geological patterns, which this study builds upon by integrating advanced statistical analyses to enhance sedimentary microfacies characterization. By integrating multi-point geostatistics, this study elucidates the heterogeneity of reservoir spaces by examining spatial correlations among multiple points (Wu and Li, 2005), allowing for a more objective and efficient characterization of sedimentary microfacies, reducing the subjectivity and workload associated with manual mapping. The integration of multi-point geostatistics with the INPEFA curve represents a significant methodological innovation, offering a robust framework for sedimentary microfacies analysis that can be adapted and applied to other regions with analogous geological challenges.
This paper aims to innovate sedimentary microfacies characterization by integrating the INPEFA curve with multi-point geostatistics, thereby offering a novel, objective approach that enhances prediction accuracy and reduces the subjectivity inherent in manual mapping techniques. On the basis of using the INPEFA curve to divide the sequence, the adoption of the high-order compatibility method and the statistical method of data occurrence repetition probability, as proposed by Pérez and Wang (Pérez et al., 2014; Wang et al., 2019), further enhances the accuracy and reliability of sedimentary microfacies prediction. By refining the training image and integrating multi-point geostatistical random simulation techniques, the study predicts sedimentary microfacies with greater precision. The broader implications of this work extend beyond the Songliao Basin, as the methodologies presented herein can serve as a template for researchers facing similar challenges in sedimentary basin analysis, providing a more systematic and data-driven approach to sedimentary microfacies characterization.
The Songliao Basin, situated in northeastern China (Figure 1A), exemplifies a large sedimentary basin that originated during the Mesozoic and Cenozoic eras (Zhang et al., 2023). Known for its abundant oil and gas reserves, the basin is a key region for hydrocarbon exploration and exploitation within China (Liu et al., 2023). The D oilfield, encompassing an area of approximately 800 km2, is positioned on the northwestern slope of the Fuxin uplift belt, at the boundary between the northern and southern sectors of the Songliao Basin (Figure 1B). It is characterized by a monoclinal structure that dips towards the northwest (Wang et al., 2023b; Li et al., 2024).
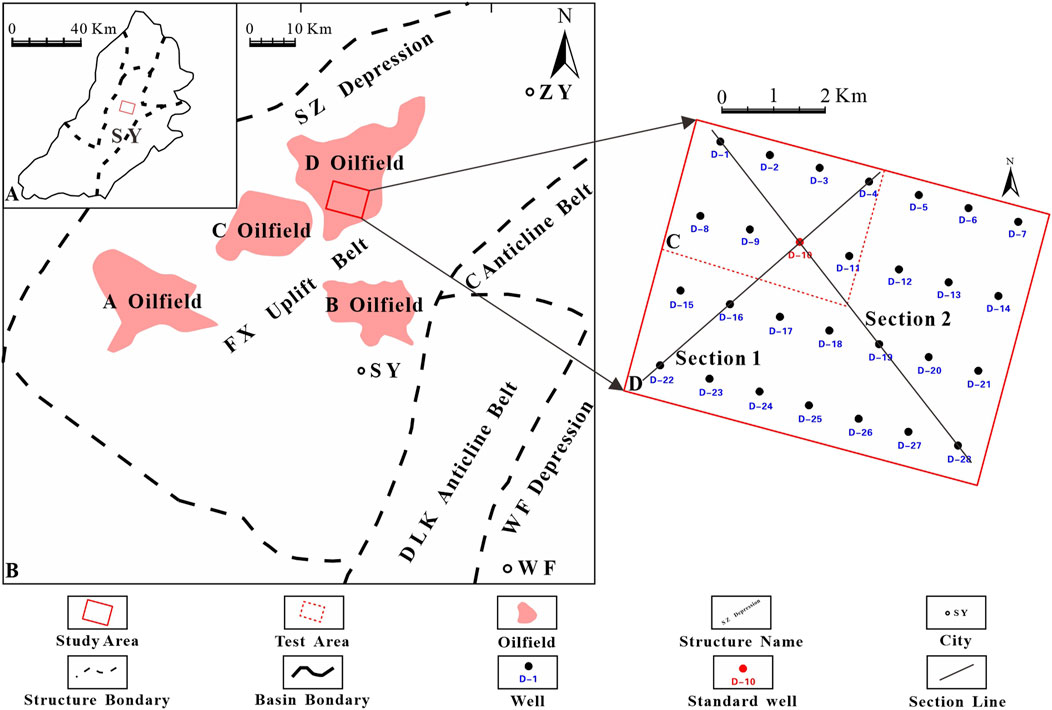
Figure 1. Tectonic units division and location maps of the study area in the central Songliao Basin (A) The position of the study area within Songliao Basin. (B) The position of the study area of D oilfield within Songliao Basin. (C) The location of the test area in the study area. (D) The whole Mapping of the Study area.
The study area, which spans approximately 38.664 km2 and is located to the south of the D oilfield (Figure 1B), includes 142 exploration wells and 4,073 production wells. For the purposes of this study, a selection of these wells is analyzed (Figure 1D). The test region, delineating an area of about 9.067 km2 in the northwest of the study area, contains 120 exploration wells and 1,356 production wells, with a similar selection process for inclusion in this study (Figure 1C). An analysis of drilling and testing data has identified the Quantou Formation as a significant stratigraphic target within the study area. Notably, the Well D-10, with an oil zone thickness of 9.8 m and a daily production rate of 9.26t (Wang, 2019b; Wang et al., 2024a), underscores the substantial exploration and development potential of the Quantou Formation (Li et al., 2019; Wang et al., 2024b).
The Integrated Prediction Error Filter Analysis (INPEFA) is a cutting-edge technique in logging geology that utilizes Maximum Entropy Spectrum Analysis (MESA) to examine logging curves in relation to depth. The essence of INPEFA lies in evaluating the discrepancies between the predicted values from MESA at specific depth intervals and the actual logging data, leading to the calculation of error filter analysis values. The combination of these discrepancies yields the INPEFA curve, which reveals the nuances of sedimentary cyclicity. This theoretical framework is based on the understanding that sedimentary sequences are influenced by paleoclimate fluctuations and a range of external and internal factors, such as eustatic sea level changes and sedimentary provenance (Liang et al., 2022; Wang et al., 2022a).
The INPEFA curve is notable for its ability to identify sequence boundaries that conventional logging curves might overlook, due to its clear depiction of sedimentary cyclicity (Wang et al., 2022b; Abbasi et al., 2024). The curve is characterized by two principal trends: ascending and dropping. An ascending trend typically correlates with an increase in shale and a rise in the A/S ratio, suggesting a rising base level that may correspond to a phase of enhanced precipitation or marine transgression. Conversely, a dropping trend is associated with an increase in sandstone and a reduction in mudstone, accompanied by a decrease in the A/S ratio, indicating a falling base level that signifies a phase of marine regression (Ye et al., 2018). The turning points of the INPEFA curve often suggest potential flooding surfaces or sequence boundaries. Generally, an upward positive trend in INPEFA values indicates that the GR curve value exceeds the predicted value during deposition, with gradually increasing mud content, suggesting a possible base level rise stage. A downward negative trend in INPEFA values indicates that the GR curve value is less than the predicted value during deposition, with gradually decreasing shale content, suggesting a possible base level decline stage (Figure 2).
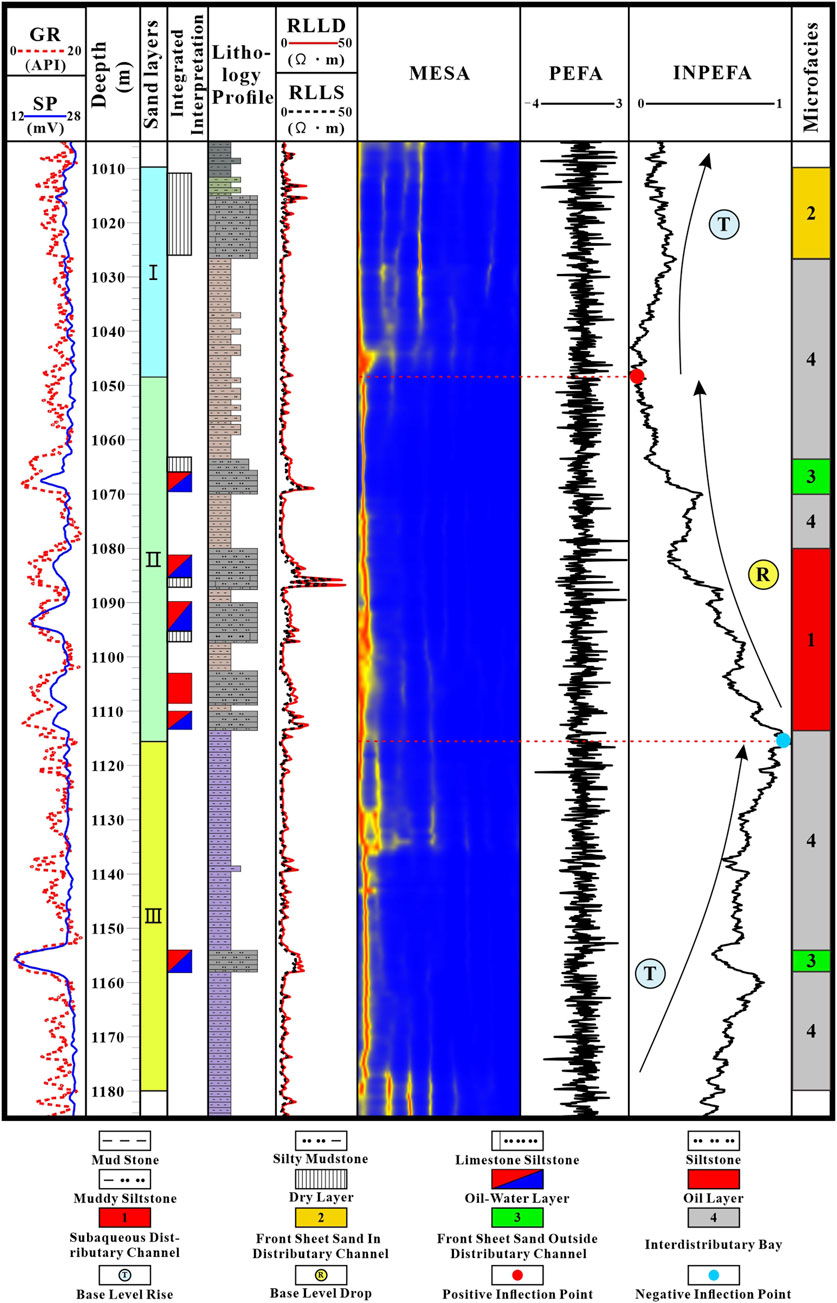
Figure 2. GR curve prediction error filtering analysis of Well D-10 in comprehensive analysis.
In 2019, Wang and colleagues expanded on the advanced high-order compatibility optimization approach outlined by Pérez by introducing an innovative statistical technique for assessing the probability of data occurrence recurrence (Pérez et al., 2014; Wang et al., 2019). This novel methodology is designed to measure the incidence of particular data occurrences within a training dataset, thereby elucidating the underlying distribution patterns (Morosov and Bratvold, 2021). The procedure begins with the application of a predefined template to scan the conditional dataset, thereby identifying a collection of n data occurrences, denoted as the set DE. Subsequently, for each training image, the frequency of occurrence for the ith data occurrence, DEi, is meticulously enumerated and recorded as Ri,j.
Utilizing this empirical data, the researchers computed additional distributional attributes of data occurrence across various training images. These included the variance in repetition probability, denoted as σj, and the rate of non-correspondence, labeled as UNFj. The metrics-repetition probability variance and non-matching rate-offer a more nuanced and precise set of evaluative benchmarks for refining training images. This approach enhances the optimization process by providing a deeper understanding of data occurrence dynamics (Curran and Atkinson, 1998; Bai and Tahmasebi, 2021; Yin et al., 2022).
In geostatistics, the repetition probability of a data occurrence FTi,j is defined as the ratio between the number of repetitions of a single data occurrence Ri,j and the sum of the number of repetitions of all data occurrences in the training image. This index is a crucial parameter for measuring the frequency of specific data occurrences within the training image, which aids in evaluating the reliability of the training image in simulating geological phenomena. Specifically, the calculation formula for the repetition probability of data occurrence FTi,j is as follows:
In this formula Equation 1, Ri,j denotes the number of repetitions of the ith data occurrence in the jth training image, and the denominator represents the sum of the number of repetitions of all data occurrences within the training image. Through this formula, we can quantify the frequency of each data occurrence in the training image, thereby providing more accurate input for sedimentary facies prediction.
The repetition probability variance, denoted as σj, is an important statistic that measures the dispersion of the repetition probability of data occurrences in the training image. This indicator reflects the distribution uniformity of different data occurrences within the training image. Specifically, the calculation of the repetition probability variance j involves the difference between the repetition probability FTi,j of each data occurrence and its average repetition probability
In this formula Equation 2, FTi,j is the repetition probability of the ith data occurrence in the jth training image,
In geostatistics, the optimization of training images not only depends on the repetition probability of data occurrence, but also involves the matching degree of data occurrence. To this end, the indicator value Di,j is introduced to mark whether the matching data occurrence is found in the training image. If the ith data occurrence is successfully matched in the jth training image, Di,j is recorded as 1; otherwise, marked as 0. Based on these indicator values, the proportion of unmatched data occurrence can be calculated, that is, the unmatched rate of data occurrence UNFj. The calculation formula is as follows:
In this formula Equation 3, n is the total number of data occurrences. The lower the value of the unmatched rate UNFj, the more data occurrences are matched with the actual geological model in the training image, which indicates that the geological model of the training image is more representative. Concurrently, the smaller the value of the repetition probability variance σj, the more stable the distribution of data occurrences in the training image, which further indicates that the training image is more consistent with the actual geological model.
The field of geostatistics encompasses a sophisticated method known as multi-point geostatistics, which is meticulously designed to identify patterns that correspond with actual geological data within a training image. The following sequence delineates the specific procedural steps for implementing this method.
1. Determination of the Search Template: Select an appropriate search template that corresponds to the sedimentary facies of the study area, and then proceed to identify the data occurrences.
2.Data occurrence Scanning: The training image is scanned for conditional data occurrence to detect fully congruent patterns (Chen et al., 2023). For each identified match, the count of the corresponding data occurrence, denoted as Ri,j, increments by one, continuing until the scanning of all data occurrences is complete.
3.Repetition Statistics Compilation: The total count of matches, denoted as Ri,j, which align perfectly with the conditional data occurrence, is recorded. This count serves as the foundation for calculating the repetition probability FTi,j of the data occurrence.
4.Repetition Probability Calculation: The repetition probability FTi,j for each data occurrence is derived from Ri,j, reflecting the prevalence of data occurrence within the training image.
5.Probability of Repetition Variance Calculation: Subsequently, the variance of the repetition probability, denoted as σj, is computed based on FTi,j. This metric assesses the variability in the frequency of data occurrences.
6. Unmatched Rate Computation: Concurrently, the proportion of data occurrences that do not match, known as the unmatched data occurrence rate UNFj, is calculated. This rate indicates the fraction of data occurrences in the training image that lack a match.
7. Training Image Optimization: Ultimately, the training image is refined and prioritized using the variance of the repetition probability σj and the unmatched rate UNFj. The selection is guided by the criterion of the closest alignment with the actual geological data.
Upon meticulous analysis of the INPEFA curve from the Quantou Formation within Well D-10, distinct cyclic patterns were discerned. The rising and dropping trends of the curve facilitated the stratigraphic delineation of the formation into three sand groups. The INPEFA curve of sand group Ⅲ displays a rising trend, indicative of a normal sedimentary cycle characterized by a progressive increase in base level, a bell-shaped log facies, and a gradual rise in shale content. The INPEFA curve of sand group Ⅱ displays a dropping trend, characteristic of an inverse cycle with a receding base level, a digitate log facies, and significant sandstone deposition. The INPEFA curve of sand group Ⅰ displays a rising trend, signifying a normal cycle with an elevated base level, a serrated box-shaped log facies, and escalating shale content (Figure 3).
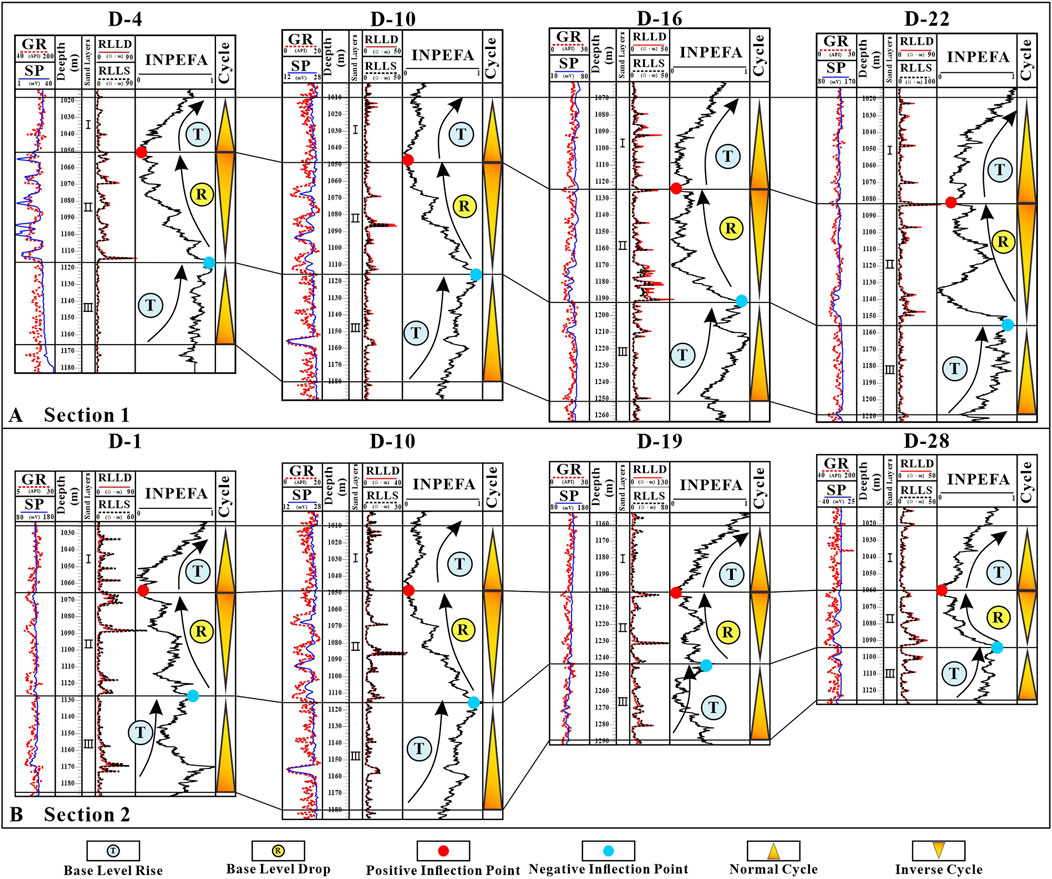
Figure 3. A comparative analysis of wells utilizing the GR curve prediction error filtering technique. (A) Section 1, depicted in Figure 1D, represents a profile aligned with the direction of the geological provenance; (B) Section 2, depicted in Figure 1D, represents a profile oriented perpendicular to the geological provenance.
In the field of high-resolution sequence stratigraphic correlation, the base-level cycle conversion surface is widely acknowledged as a critical boundary for stratigraphic segmentation (Yuan et al., 2018). Utilizing the results of high-frequency sequence delineation from individual wells, we utilized the cyclical data revealed by the INPEFA curve to compare high-frequency sequences among wells, thereby constructing a detailed isochronous stratigraphic framework. By conducting an INPEFA analysis on the GR curves from all wells within the study area and plotting the INPEFA framework sections both along and across to the provenance direction, we noted that the Quantou Formation is consistently distributed in the horizontal plane. Moreover, the base-level cycle characteristics, as revealed by the INPEFA analysis of GR curves, demon a high degree of comparability throughout the entire study area (Figure 3).
Initially, a comprehensive analysis of the sedimentary attributes within the deltaic facies of the study region was undertaken. This thorough examination facilitated the identification of the planar morphological characteristics of various microfacies, which form the basis for the development of training images. Subsequently, we utilized the extensive well pattern data, characteristic of the study area, to refine the breadth of subaqueous distributary channels. This data, replete with geological insights, significantly enhances the precision of our geological simulations.
Distributary channel in sedimentary contexts typically exhibit streamlined geometry and are orthogonal to the shoreline. These channels contain substantial sedimentary strata, with typical thicknesses exceeding 2 m. In contrast, the sediment thickness in narrow channels or their terminal portions is reduced, averaging approximately 1.5 m. The channel’s extension length is significantly influenced by the river’s strength, leading to substantial variations in the shape and scale of the subaqueous distributary channels. Subaqueous channels in north-south aligned areas tend to be more elongated, in contrast to sharply with those in east-west aligned channels, which are relatively truncated, leading to a more compact river system. Analysis of logging facies and lithological sections reveals that subaqueous distributary channels are primarily formed by the superposition of multi-layered, positively rhythmic sandstones. Logging curve responses delineate the sedimentary characteristics of these channels, often manifesting in archetypal patterns, such as bell-shaped or serrated patterns (Chen et al., 2022; Wang et al., 2023a).
The configuration and distribution of the front sheet sand in distributary channels are predominantly dictated by the inherent characteristics of these channels. The genesis of these sand bodies is directly associated with sedimentation processes occurring at the delta mouth bar and the distal bar. The delta mouth bar is a sedimentary formation precipitated by the river’s reduced flow velocity upon entering the lacustrine environment, while the distal bar is a sedimentary body formed by wave action at the river mouth where it enters the lake. Positioned at the delta front, these structures are subject to the interplay of lacustrine waters and wave processes, leading to their reconfiguration and re-sedimentation, ultimately yielding a thin, stratified sand body. The distinctive finger-shaped pattern observed in logging curve responses is indicative of the unique characteristics of the sedimentary environment and the specific depositional dynamics (Wu et al., 2019a).
The front sheet sand outside distributary channels, extensively dispersed within sedimentary contexts, is not confined to areas immediately adjacent to these channels. These sedimentary formations typically result from the overflow of water during periods of high discharge, transporting sediments across broader deltaic expanses. This sedimentation process is often triggered by natural phenomena, such as floods, which cause water to overflow the river’s banks, thereby extending the sedimentary reach to more distant locales (Wu et al., 2019b).
The formation of outer front sheet sand bodies is intricately linked to the sedimentary dynamics at the delta front. During flood events, the river’s discharge increases, enhancing the flow velocity and the capacity to entrain sediment. Upon reaching the delta’s edge, the water’s velocity decreases, causing the sediments to settle and coalesce into sheet-like sand bodies. The sedimentological attributes and the spatial distribution of these formations provide valuable insights into the characteristics of the delta’s sedimentary facies (Zhang et al., 2017).
The interdistributary bay, a key component of the deltaic sedimentary system, is typically situated between subaqueous distributary channels. The sedimentary attributes of this region are characterized by the thinning and eventual disappearance of sandstone, a phenomenon referred to as “pinch-out.” The interdistributary bay, predominantly composed of mudstone, silty mudstone, and argillaceous siltstone, exhibits a low, flat dentation-shaped logging response, which is indicative of the fine-grained nature of these sediments (Wu et al., 2019b; Wang et al., 2023a).
The genesis of this sedimentary pattern is intricately linked to the hydrodynamics within the distributary channels. In the interstitial spaces between these channels, the reduced flow velocity diminishes the sediment transport capacity, resulting in the accumulation of fine-grained sediments such as mudstone and silty mudstone. The stratified arrangement of these sediments imparts a distinctive signature on the logging curve, providing a critical basis for the identification and analysis of the sedimentary traits within the interdistributary bay (Wu et al., 2019b).
For a detailed elucidation of sedimentary microfacies characterization, we use Sand group II within the study area as a case study to illustrate the meticulous process based on multipoint geostatistical analysis. To accurately delineate the geological attributes of the Sand group II in the test area, we employed sophisticated digital tools to manually delineate the sedimentary microfacies. Initially, we collated geological data, including lithology, sedimentary structures, and paleocurrent directions. Subsequently, using digital tools, we meticulously delineated the distribution and morphology of diverse sedimentary microfacies, such as distributary channels, sheet sands, and interdistributary bays, each with distinct environmental implications.
This methodology necessitates profound scrutiny and comprehension of geological data to ensure that the resulting maps authentically reflect the geological conditions. Digital tools facilitate the precise demarcation of sedimentary microfacies boundaries, thereby improving the scientific rigor and applicability of the maps. Moreover, these tools enable multidimensional analysis and representation, such as differentiating microfacies through color coding and pattern variation, thereby augmenting the maps’ interpretability and informational value.
This study utilizes the Sand group II within the designated study area as a case study, employing a simulation methodology based on a hand-drawn sedimentary microfacies map. The essence of this approach lies in the fusion of geological reasoning with quantitative analysis to produce a sedimentary microfacies map that accurately reflects geological conditions.
1. Hand-drawing the sedimentary microfacies map for sand group II in the test area: Initially, comprehensive geological research is conducted to delineate the geometric parameters of Sand group II, including its orientation and configuration. This step is crucial for establishing the sedimentary microfacies plan, as it involves clarifying the spatial relationships and boundary conditions among various microfacies (Figure 4A).
2. Digital scanning: the hand-drawn sedimentary microfacies map of the test area is subjected to digital scanning. This involves the digital assignment of various sedimentary microfacies types and their boundaries, and then the digital scanning image of the sand group II can be obtained (Figure 4B).
3. Simulation and Iteration: Following the established order and using the data event repetition probability statistics method, based on the digital scanning image of sand group II, we gradually simulate the various types of sedimentary microfacies. This process is designed to generate the training image of the reservoir (Figure 4C). After several iterations, the training image is refined to be not only geometrically ideal, but also conforms to the classical law of facies sequence.
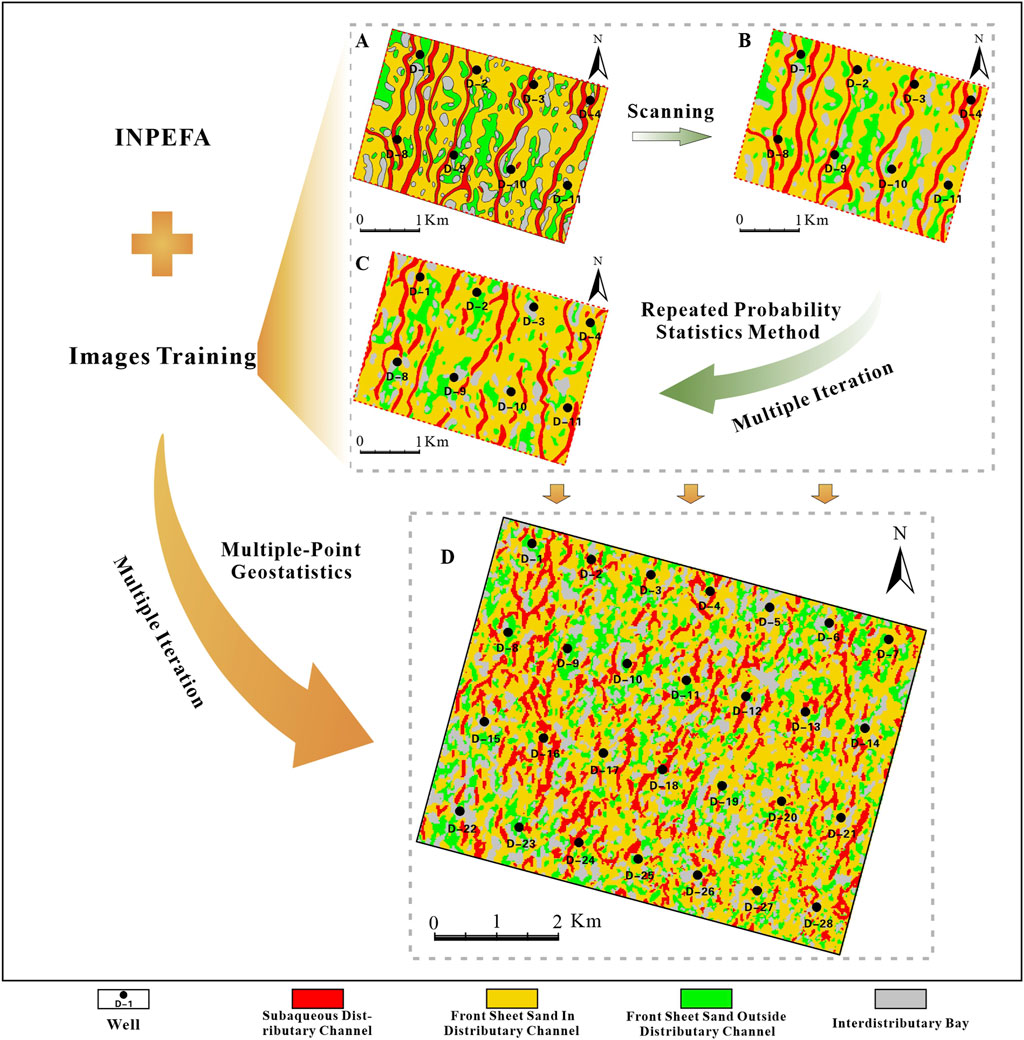
Figure 4. Predictive process of sedimentary microfacies for the sand group II (A) Hand-drawn sedimentary microfacies map of the sand group II test area; (B) Digitalized sedimentary microfacies map of the sand group II test area; (C) Iterative training images within the digital microfacies map of the sand group II test area; (D) Regional sedimentary microfacies prediction for the sand group II.
The spatial distribution of sedimentary microfacies across the study area is predicted using multi-point geostatistics for stochastic simulation. This methodology relies on the statistical analysis of the recurrence probabilities of data occurrences, as well as on phase data from individual wells and logging data. It utilizes a training image customized for the target simulation, thereby enabling a comprehensive simulation of the sedimentary microfacies in the study area.
Initially, data from the well logs of Sand group II and single-well measurements are integrated. During the simulation, this dataset serves as the foundation, ensuring that the outcomes accurately reflect geological phenomena. The geological pattern, derived from the test area training image of Sand group II, directs the stochastic simulation process, thereby ensuring the geological plausibility of the results. Furthermore, the dense well pattern is utilized as a constraint, and a statistical method predicated on the recurrence probabilities of data occurrences is employed to enhance the simulation’s precision. After several iterative refinements, a planar prediction map of the Sand group II sedimentary microfacies is produced (Figure 4D), which is consistent with the classical phase sequence law and exhibits an optimal geometric form.
Subsequently, the method used to generate the planar prediction map for the Sand group Ⅱ sedimentary microfacies can be applied to the Sand group I and Sand group Ⅲ within the study area. By incorporating well point data and logging data, this approach ensures a high degree of consistency between simulation results and actual geological conditions, yielding accurate prediction maps for Sand group I and Sand group Ⅲ (Figure 5).
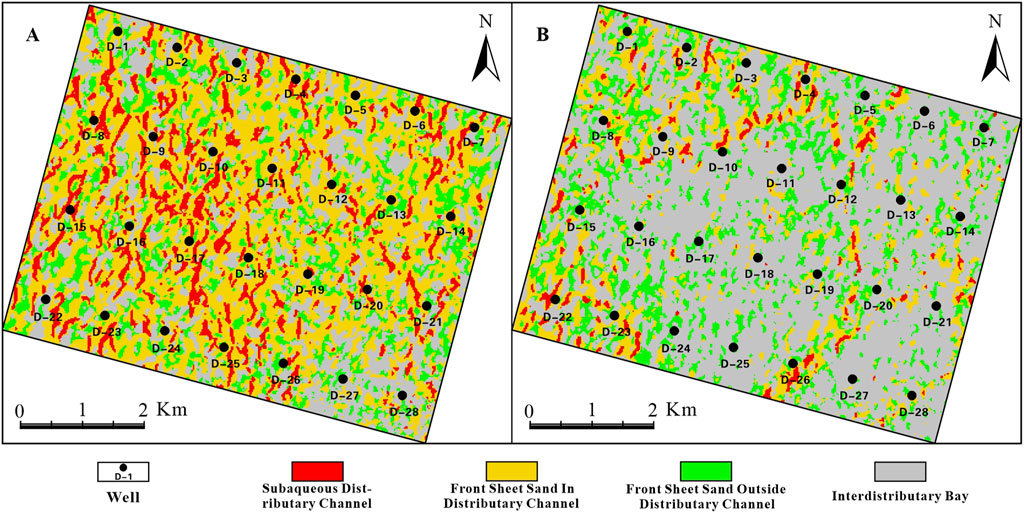
Figure 5. (A) Spatial forecasting map for sand group I sedimentary microfacies (B) Spatial forecasting map for sand group III sedimentary microfacies.
The simulation results closely correlate with actual geological information, ensuring the accuracy of the sedimentary microfacies reproduction (Figure 6). This simulation process not only captures the structural characteristics of the training image, but also accurately represents the spatial distribution of the training image across various microfacies scales. This indicates that the simulation method is adept at capturing the intricacies of geological phenomena.
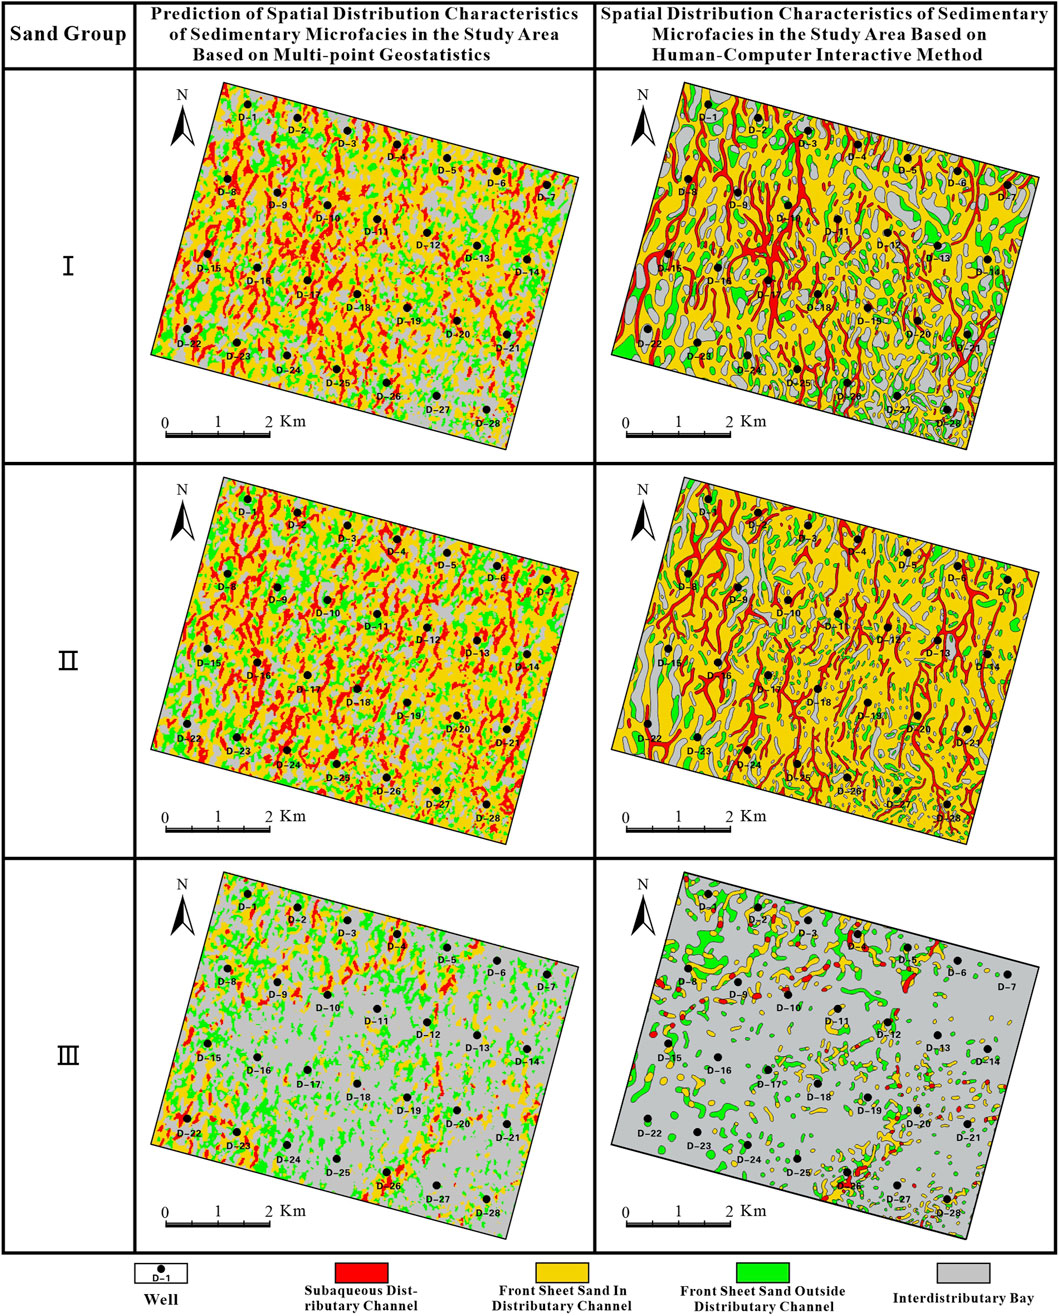
Figure 6. Comparison of multi-point geostatistical prediction results and human-computer interaction results of sedimentary microfacies of three sand groups in the study area.
Although the statistical method for data event repetition probability is crucial in the simulation, its inherent limitations often lead to non-smooth and discontinuous sedimentary microfacies simulation results. Such limitations can affect the geological interpretation and application of the simulation results. To overcome these issues, a human-computer interactive method is employed to refine the simulation outputs, aligning them more closely with geological principles. This enhancement results in a visually smoother and geologically more coherent map (Figure 6), ensuring the precision and geological plausibility of the final microfacies plan.
Multi-point geostatistics is an advanced spatial analysis technique that encounters significant challenges and constraints during implementation. Although our training dataset consists of high-precision, hand-drawn sedimentary microfacies maps, the creation and quality of these images is crucial. Obtaining high-quality images that accurately capture the spatial characteristics of geological entities is particularly challenging in areas where geological data is sparse or geological complexity is high.
Moreover, the manual drafting process can introduce subjective discrepancies, which may affect the accuracy of the training images. Consequently, if the training image does not accurately reflect the actual geological conditions, the reliability of the simulation outcomes could be compromised. Furthermore, the effectiveness of multi-point geostatistics in replicating the continuity of geological bodies is limited by both algorithmic constraints and the quality of the training images.
To enhance the precision of predicting the planar distribution traits of sedimentary microfacies, a substantial amount of high-quality foundational data is essential. Algorithmic constraints and iterative computations may impede the computational process.
Even with ample data, there remains an inherent uncertainty in the quantitative predictive accuracy of multi-point geostatistics, necessitating manual intervention to align the predictive outcomes with geological principles. Therefore, improving the application of multi-point geostatistics in predicting the planar distribution characteristics of sedimentary microfacies, with the goal of enhancing precision and efficiency, is representing a significant research avenue within this domain.
Current research has proposed three possible explanations for the fluctuations in INPEFA curves at different well locations within the same area: Yang suggested that local tectonic activities might be the cause for the fluctuations of INPEFA curves (Yang et al., 2018); Ahmed discovered that lithological differences, such as changes from carbonate rock to sandstone or mudstone, could contribute to the variances in INPEFA curves (Mayhoub et al., 2019; Kassem et al., 2022); Li argued that the insignificant record of lake level changes caused by water depth variations might not be obvious and could not be recognized by INPEFA curves (Li, 2019). However, considering the lithology of the Quantou Formation in the study area, which is predominantly sandstone and shale with no significant lithological differences, along with the inactive tectonic activities and the small, concentrated number of abnormal well locations in INPEFA curves, it is not possible to conclude that the abnormal INPEFA curve characteristics are due to the insignificant record of lake level changes. Therefore, none of the above factors can fully account for the abnormal fluctuations observed in the INPEFA curves.
A detailed layer-by-layer study was conducted on the Sand Group II. Utilizing the characteristics of GR, SP, RLLD, and RLLS curves, the Sand Group II was divided into four single layers (Figure 7). Analysis revealed that, with the exception of Well D-22, the 3rd and 2nd single layer of the Sand Group II at other well locations were mainly composed of sandstone, while Well D-22 was predominantly shale. The 1st single layer of the Sand Group II was generally dominated by shale across all wells.
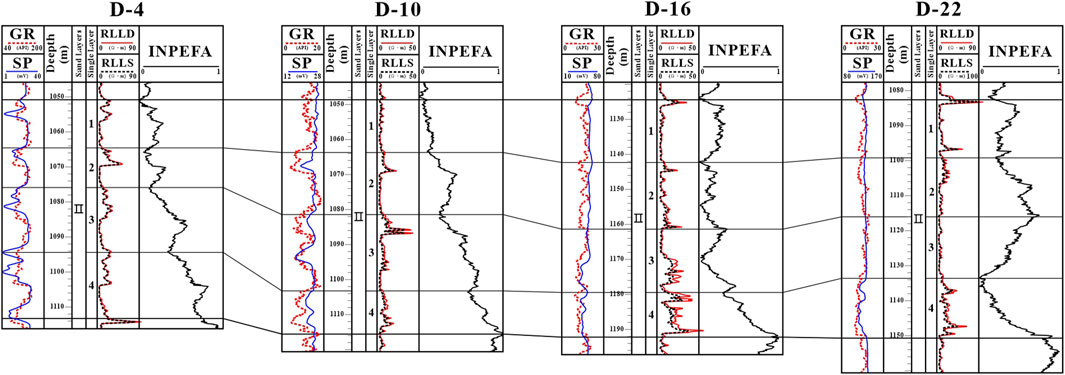
Figure 7. Substratification analysis of sand group Ⅱ in section.
Comparing the INPEFA curve characteristics of each single layer within the Sand Group II, it was observed that the abnormal INPEFA curve for Well D-22 began in the 3rd single layer, potentially due to the relatively low sandstone content and high shale content in that layer. Consequently, it is inferred that the abnormal fluctuations in INPEFA curves across the study area may be associated with a weakening in the supply of sedimentary material sources. Specifically, the sedimentary material sources supply near Well D-22 may have experienced a sudden weakening or disruption, leading to a decrease in sand supply and an increase in muddy supply, which in turn caused the observed fluctuations in INPEFA curves.
Our prediction results of sedimentary microfacies (Figure 4D) support this inference and indicate a weakening of the sedimentary material source near Well D-22. These findings further validate the accuracy of multi-point geostatistics in predicting the planar distribution of sedimentary microfacies.
The INPEFA curves reveal continuous changes in lake level between wells, and the lake-flooding surface, as a near-isochronous surface representing lake-level rise and fall, provides important indications of sedimentary environment change within the study area. By analyzing the INPEFA curves and well sections, we can gain insights into the sedimentary environment evolution during a specific time period. As shown in Figure 3, two INPEFA continuous well-section profiles reveal the sedimentary environment evolution during the deposition period of the Quantou Formation. Specifically, the INPEFA curve of the Quantou Formation Sand Group III exhibits a significant positive trend, indicating positive cyclic sedimentation; the INPEFA curve of the Quantou Formation Sand Group II exhibits a negative trend, indicating negative cyclic sedimentation; and the abrupt positive change in the INPEFA curve of the Quantou Formation Sand Group I points to positive cyclic sedimentation. The sedimentary characteristics of each sand group evolved as fllows (Figure 8):
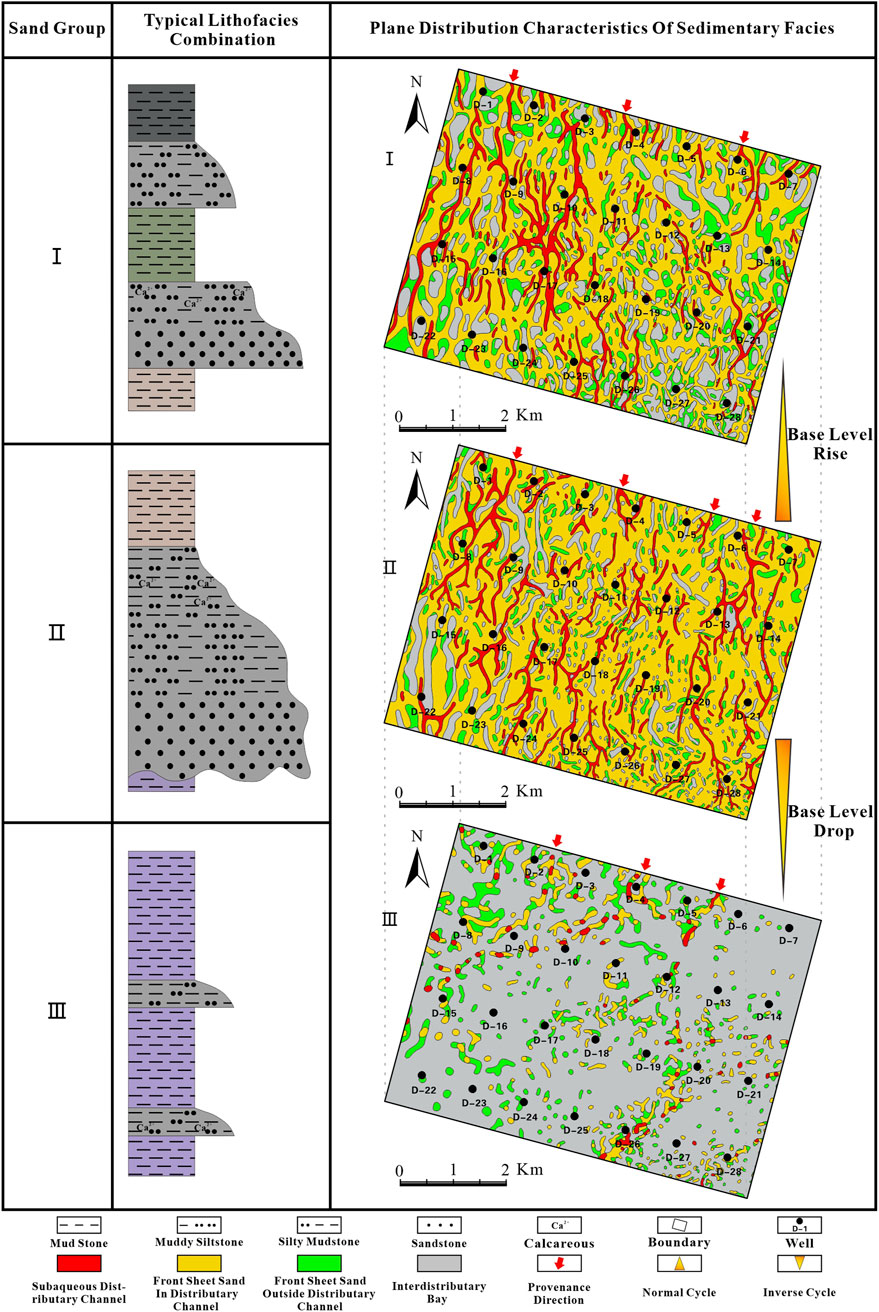
Figure 8. Vertical evolution diagram of sedimentary system of Quantou Formation in study area of oilfield D.
Sand group III is characterized by rapid water transgression, with sand bodies distributed in strips, and pinch-out well points showing a continuous distribution. The pronounced interbedded gray mudstone and sandstone is a notable feature. Additionally, the presence of common plant carbon debris in the sandstone provides important clues for identifying the rapid water transgression in sand group III.
Following the rapid water transgression of sand group III, Sand group II experiencs a gradual lacustrine regression, leading to decreased water depth. The energy of the river flow rate is not quickly dissipated by the lacustrine environment, leading to diffusion and the sedimentation of mud and sand, which form large areas of sheet sand. The scarcity of pinch-out well points and the presence of banded channel, particularly in the northern region of the study area, suggest significant river sand development. The bottom of the stratum consists of mudstone with horizontal bedding, which forms an abrupt contact with the overlying sandstone. The inclined bedding lamina in the sand-mud interbed can dip at angles up to 20°. Mudstone contains carbonaceous and sandy bands. These characteristics indicate that the water level of the lake gradually decreased during deposition, the water depth became shallower, the original underwater sedimentary environment gradually transformed into a terrestrial or swamp environment, and the energy of the sedimentary environment gradually increased.
Sand group I formation corresponds to the peak of lacustrine regression, characterized by the most extensive distribution of sand bodies and intensified river activity. The primary sands are distributed as large areas of sheet sands in narrow strips or localized braids, with few pinch-out wells, indicating river sedimentation during lacustrine regression. The thickness of the stratum ranges from 3 to 5 m, interbedded with gray massive mudstone and sandstone. Mud-coated sand masses at the base of sandstone suggest a relatively unconsolidated sedimentary environment for the sandstone.
The integration of INPEFA with multi-point geostatistics represents a significant methodological innovation in sedimentary microfacies prediction. This approach leverages the high-resolution stratigraphic analysis provided by the INPEFA curve, which is derived from natural gamma logging data, and combines it with the spatial correlation analysis of multi-point geostatistics. This novel combination overcomes the limitations of traditional methods, which often face challenges with data resolution and sampling constraints, thereby offering a more detailed and accurate depiction of sedimentary cycles and microfacies distribution.
Sand group Ⅲ is characterized by rapid water transgression and a distribution pattern of strip-like sand bodies. Sand group II exhibits a gradual lacustrine regression, resulting in extensive, sheet-like sand deposits. Sand group I, at the peak of lacustrine regression, shows the broadest distribution of sand bodies and intensified river activity.
The application of INPEFA curves for high-resolution stratigraphic analysis, along with multi-point geostatistics for sedimentary microfacies prediction, provides a systematic and data-driven approach to characterizing complex geological settings. This integrated approach reduces the subjectivity and workload associated with traditional manual mapping techniques. The results of this study show the potential of these methods to improve the accuracy and reliability of sedimentary microfacies prediction. Consequently, such enhancements are likely to increase the efficiency of exploration efforts in basins with similar geological characteristics.
The original contributions presented in the study are included in the article/supplementary material, further inquiries can be directed to the corresponding author.
XW: Conceptualization, Data curation, Formal Analysis, Investigation, Methodology, Project administration, Resources, Software, Supervision, Validation, Visualization, Writing–original draft, Writing–review and editing. ZY: Conceptualization, Data curation, Formal Analysis, Funding acquisition, Investigation, Methodology, Project administration, Resources, Software, Supervision, Validation, Visualization, Writing–review and editing, Writing–original draft. XL: Data curation, Resources, Writing–review and editing. CY: Conceptualization, Data curation, Formal Analysis, Investigation, Methodology, Project administration, Resources, Software, Supervision, Validation, Visualization, Writing–review and editing, Writing–original draft.
The author(s) declare that financial support was received for the research, authorship, and/or publication of this article. This study was financially supported by Scientific and technological research project of Heilongjiang Province of China (DQYT 2022-JS-757), Natural Science Foundation of Heilongjiang Province of China (Grant No. LH2021E014), the National Natural Science Foundation of China (Grant No. 51474070) and Northeast Geological S&T Innovation Center of China Geological Survey (No. QCJJ2023-31).
Author XL was employed by PetroChina Jilin Oilfield Company.
The remaining authors declare that the research was conducted in the absence of any commercial or financial relationships that could be construed as a potential conflict of interest.
The author(s) declare that no Generative AI was used in the creation of this manuscript.
All claims expressed in this article are solely those of the authors and do not necessarily represent those of their affiliated organizations, or those of the publisher, the editors and the reviewers. Any product that may be evaluated in this article, or claim that may be made by its manufacturer, is not guaranteed or endorsed by the publisher.
Abbasi, A., Kodkhodaie, A., Mahari, R., and Moussavi-Harami, R. (2024). Maximum entropy spectral analysis of gamma ray logs for cyclostratigraphic analysis of the Late Albian- Early Turonian Sarvak Formation in the Anaran exploration block, southwestern Zagros, Iran. Earth Sci. Inf. 17 (1), 1–20. doi:10.1007/s12145-023-01174-6
Bai, T., and Tahmasebi, P. (2021). Accelerating geostatistical modeling using geostatistics-informed machine Learning. Comput. Geosci. 146 (C), 104663. doi:10.1016/j.cageo.2020.104663
Chen, Q., Zhou, R., Liu, C., Huang, Q., Cui, Z., and Liu, G. (2023). pyMPSLib: a robust and scalable open-source Python library for multiple-point statistical simulation. Earth Sci. Inf. 16 (4), 3179–3190. doi:10.1007/s12145-023-01086-5
Chen, S., Pu, R. H., Li, H. Q., Qu, H. G., Ji, T. Y., Su, S. Y., et al. (2022). Distribution characteristics of delta reservoirs reshaped by bot-tom currents: a case study from the second member of the Yinggehai Formation in the DF1-1 gas field, Yinggehai Basin, South China Sea. Acta Oceanol. 41 (9), 86–106. doi:10.1007/s13131-022-1992-6
Curran, P. J., and Atkinson, P. M. (1998). Geostatistics and remote sensing. Prog. Phys. Geog. 22 (1), 61–78. doi:10.1191/030913398667999161
Feng, Z., and Graham, S. A. (2023). From foredeep to orogenic wedge-top: the Cretaceous Songliao retroforeland basin, China. Geosci. Front. 14 (3), 101527. doi:10.1016/j.gsf.2022.101527
Guardiano, F. B., and Srivastava, R. M. (1993). “Multivariate geostatistics: beyond bivariate moments,” in Geostatistics tróia '92. Quantitative geology and geostatistics. Editor A. Soares (Dordrecht.: Springer), 5, 133–144. doi:10.1007/978-94-011-1739-5_12
Kassem, A., Raafat, A., Radwan, A., El Nahas, S., Kędzierski, M., and Zakaria, A. (2022). Paleoenvironment, sequence stratigraphy and source rock potentiality of the Cenomanian-Turonian boundary sediments of Southern Tethys. Mar. Pet. Geol. 139, 105624. doi:10.1016/j.marpetgeo.2022.105624
Li, L., Bao, Z., Li, L., Li, Z., Ban, S., Li, Z., et al. (2024). The source and preservation of lacustrine shale organic matter: insights from the qingshankou Formation in the changling sag, southern Songliao Basin, China. Sediment. Geol. 466, 106649. doi:10.1016/j.sedgeo.2024.106649
Li, M., Chen, B., Ruan, J., Bao, Z., Zang, D., Zheng, J., et al. (2019). Spatial distribution patterns of single framework sand bodies of a shallow-water delta in the Cretaceous Quantou Formation of Xinmin Oilfield, Songliao Basin. Mar. Geol. Quat. Geol. 39 (4), 46–55. doi:10.16562/j.cnki.0256-1492.2019010601
Li, Y. (2019). High frequency Paleolake level change and its controlling factors of Qingshanjou Formation in Cretaceous Songliao Basin. Beijing: China University of Geoscience. [master's thesis].
Liang, Y., Ge, J., Zhao, X., Zhang, X., Li, S., and Nie, Z. (2022). High-resolution sequence division and geological significance of exploration of marine-continental transitional facies shale in the 2nd Member of Shanxi Formation, eastern margin of Ordos Basin. Nat. Gas. Geosci. 33 (3), 408–417. doi:10.11764/j.issn.1672-1926.2021.10.021
Liu, B., Liu, L., Fu, J., Lin, T., He, J., Liu, X., et al. (2023). The Songliao super basin in northeastern China. AAPG Bull. 107 (8), 1257–1297. doi:10.1306/02242321181
Mayhoub, A., Moustafa, A., Yousef, M., and Zalat, S. (2019). Cyclo-sequence stratigraphy of the Miocene syn-rift succession, Al Amir and Geyad fields, southwestern part of the Gulf of Suez rift. J. Afr. Earth Sci. 257, 103504. doi:10.1016/j.jafrearsci.2019.05.012
Morosov, A. L., and Bratvold, R. B. (2021). Probability elicitation using geostatistics in hydrocarbon exploration. Comput. Geosci. 25 (6), 2109–2130. doi:10.1007/s10596-021-10084-9
Pérez, C., Mariethoz, G., and Ortiz, J. M. (2014). Verifying the high-order consistency of training images with data for multiple-point geostatistics. Comput. Geosci. 70, 190–205. doi:10.1016/j.cageo.2014.06.001
Shen, H., Yang, L., Han, H., Wang, Y., Xing, J., Xue, S., et al. (2023). New fields, new types and resource potential of oil and gas exploration in southern Songliao Basin. Acta Pet. Sin. 44 (12), 2104–2121. doi:10.7263/syxb202312007
Wang, B., Qi, Y., Du, K., Sun, L., and Li, W. (2022a). Sequence subdivision and sand bodies prediction technology based on GR logging information: taking H4 Member of Upper Shihezi Formation in Linxing A area of Ordos Basin as an example. China Offshore Oil Gas 34 (4), 164–174. doi:10.11935/j.issn.1673-1506.04.015
Wang, D., Liu, H., Tang, S., Bai, J., Zhou, G., Li, Z., et al. (2023a). Sedimentary architecture and distribution of intra-platform shoal in sequence framework of Permian Changxing Formation in central Sichuan Basin, SW China. Pet. Explor. Dev. 50 (2), 388–403. doi:10.1016/S1876-3804(23)60395-7
Wang, F., Li, Z., and Zhang, D. (2024a). New research and practice progresses of CCUS-EOR technology in Jilin Oilfield. Nat. Gas. Ind. B 44 (4), 76–82. doi:10.3787/j.issn.1000-0976.2024.01.008
Wang, G., Ma, F., Hou, H., Jiang, G., Zhang, X., Yuan, R., et al. (2023b). Study of depression and layer controlled geothermal system in Songliao Basin. Acta Geosci. Sin. 44 (1), 21–32. doi:10.3975/cagsb.2022.121901
Wang, L., Yin, Y., Feng, W., Duan, T., Zhao, L., and Zhang, W. (2019). A training image optimization method in multiple-point geostatistics and its application in geological modeling. Pet. Explor. Dev. 46 (4), 739–745. doi:10.1016/s1876-3804(19)60231-4
Wang, R., Xie, J., Ran, A., Wang, S., Wang, J., Hu, X., et al. (2022b). Comparison of INPEFA technology and wavelet transform in sequence stratigraphic division of mixed reservoir: a case study of lower Es3 of KL oilfield in Laizhouwan Sag. J. Pet. Explor. Prod. Technol. 12 (12), 3213–3225. doi:10.1007/s13202-022-01523-z
Wang, X., Bai, X., Li, J., Jin, Z., Wang, G., Chen, F., et al. (2024b). Enrichment model and major controlling factors of below-source tight oil in Lower Cretaceous Fuyu reservoirs in northern Songliao Basin, NE China. Pet. Explor. Dev. 51 (2), 279–291. doi:10.1016/s1876-3804(24)60023-6
Wang, X., Bai, X., Lu, J., Jin, Z., Wang, G., Kuang, L., et al. (2023c). New fields, new types and resource potential of oil and gas exploration in northern Songliao Basin. Acta Pet. Sin. 44 (12), 2091–2103+2178. doi:10.7263/syxb202312006
Wang, Y. (2019b). Repetitive fracturing technology for old wells in CCL oilfield. Pet. Reserv. Eval. Dev. 9 (6), 61–64+71. doi:10.13809/j.cnki.cn32-1825/te.2019.06.011
Wu, Q., Chen, X., Zhao, H., Zhang, Y., and Cao, L. (2019a). Study on the hierarchy of A distributary-mouth bar type shallow-water delta reservoir. J. Southwest Pet. Univ. 41 (2), 53–63. doi:10.11885/j.issn.16745086.2018.11.16.10
Wu, S., and Li, W. (2005). Multi-point geostatistics-theory, application and prospect. J. Palaeogeogr. 1, 137–144.
Wu, S., Xu, Z., and Liu, Z. (2019b). Depositional architecture of fluvial-dominated shoal water delta. J. Palaeogeogr. 21 (2), 202–215. doi:10.7605/gdlxb.2019.02.012
Yang, D., Huang, Y., Guo, W., Huang, Q., Ren, Y., and Wang, C. (2018). Late Santonian-early Campanian lake-level fluctuations in the Songliao Basin, NE China and their relationship to coeval eustatic changes. Cretac. Res. 92, 138–149. doi:10.1016/j.cretres.2018.07.008
Ye, L., Zhu, X., Qin, Y., and Zhu, M. (2018). Depositional system of shallow water delta in rifted lacustrine basin. J. Earth Sci. Environ. 40 (2), 186–202.
Yin, Z., Zuo, C., MacKie, E. J., and Caers, J. (2022). Mapping high-resolution basal topography of West Antarctica from radar data using non-stationary multiple-point geostatistics (MPS-BedMappingV1). Geosci. Model Dev. 15 (4), 1477–1497. doi:10.5194/gmd-15-1477-2022
Yuan, R., Zhu, R., Qu, J., Wu, J., You, X., Sun, Y., et al. (2018). Utilizing integrated prediction error filter analysis (INPEFA) to divide base-level cycle of fan-deltas: a case study of the triassic baikouquan Formation in mabei slope area, mahu depression, junggar basin, China. Open Geosci. 10 (1), 79–86. doi:10.1515/geo-2018-0007
Zhang, H., Wang, X., Jia, C., Li, J., Meng, Q., Jiang, L., et al. (2023). Total petroleum system and hydrocarbon accumulation model in shallow and medium strata in northern Songliao Basin, NW China. Pet. Explor. Dev. 50 (4), 683–694. doi:10.11698/PED.20230054
Zhang, L., Bao, Z., Lin, Y., Chen, Y., Lin, X., Dou, L., et al. (2017). Genetic types and sedimentary model of sandbodies in a shallow-water delta: a case study of the first Member of Cretaceous Yaojia Formation in Qian'an area, south of Songliao Basin, NE China. Pet. Explor. Dev. 44 (5), 770–779. doi:10.1016/s1876-3804(17)30087-3
Zhang, P., Misch, D., Meng, Q., Sachsenhofer, R. F., Liu, Z., Jia, J., et al. (2022). Lateral changes of organic matter preservation in the lacustrine Qingshankou Formation (Cretaceous Songliao Basin, NE China): evidence for basin segmentation. Int. J. coal Geol. 254, 103984. doi:10.1016/j.coal.2022.103984
Keywords: muti-point geostatistics, INPEFA, stochastic simulation, Songliao Basin, sedimentary microfacies
Citation: Wang X, Yang Z, Liu X and Yuan C (2025) Sedimentary microfacies prediction based on multi-point geostatistics under the constraint of INPEFA curve. Front. Earth Sci. 13:1506709. doi: 10.3389/feart.2025.1506709
Received: 06 October 2024; Accepted: 04 February 2025;
Published: 21 February 2025.
Edited by:
Davide Gamboa, University of Aveiro, PortugalReviewed by:
Shaoke Feng, SINOPEC, Southwest Oil and Gas Branch, Chengdu, ChinaCopyright © 2025 Wang, Yang, Liu and Yuan. This is an open-access article distributed under the terms of the Creative Commons Attribution License (CC BY). The use, distribution or reproduction in other forums is permitted, provided the original author(s) and the copyright owner(s) are credited and that the original publication in this journal is cited, in accordance with accepted academic practice. No use, distribution or reproduction is permitted which does not comply with these terms.
*Correspondence: Zicheng Yang, emljaGVuZ3lhbmdAMTYzLmNvbQ==
Disclaimer: All claims expressed in this article are solely those of the authors and do not necessarily represent those of their affiliated organizations, or those of the publisher, the editors and the reviewers. Any product that may be evaluated in this article or claim that may be made by its manufacturer is not guaranteed or endorsed by the publisher.
Research integrity at Frontiers
Learn more about the work of our research integrity team to safeguard the quality of each article we publish.