 Heng Wang1
 Zhiming Wang
94% of researchers rate our articles as excellent or good
Learn more about the work of our research integrity team to safeguard the quality of each article we publish.
Find out more
ORIGINAL RESEARCH article
Front. Earth Sci. , 13 February 2025
Sec. Atmospheric Science
Volume 13 - 2025 | https://doi.org/10.3389/feart.2025.1458847
Introduction: Winter dust pollution in China’s northern open-pit coal mines is serious, and the prevention and control of winter dust pollution is one of the important problems in the construction of green mines in northern open-pit coal mines.
Methods: In this study, we collected dust concentration data, meteorological data, and production data from the experimental mine from 1 December 2018, to 28 February 2019. The characteristics of changes in meteorological factors, production intensity and dust concentration in open-pit coal mines during the cold period are introduced, and the correlation between these factors and dust concentration was analyzed using multivariate statistical analysis methods, dust concentration estimation model including near-surface meteorological factors, high-altitude meteorological factors, and production intensity was developed.
Results: The results show that the temperature inside the pit is lower the humidity is higher and the wind speed is smaller than outside the pit in winter; there is a long time inversion phenomenon inside the quarry, and there is less vertical convection in the atmosphere (between 8 a.m. and 12 a.m.). Humidity, noise and particulate mass concentration were significantly positively correlated (the lowest correlation coefficient is 0.480 and 0.369 for humidity and noise); wind speed, solar radiation and boundary layer height were significantly negatively correlated with particulate mass concentration (the lowest correlation coefficient is −0.555, −0.280 and −0.510 for wind speed, solar radiation and boundary layer height). The relative frequency of small particulate dust mass concentrations exceeding the national ambient air quality standard limits is greater in winter, and there is a good correlation between the mass concentrations of Total Suspended Particulates (TSP), Particulate Matter 10 (PM10) and Particulate Matter 2.5 (PM2.5). The accuracy of the particulate matter concentration estimation model constructed by considering the influence of multiple factors was significantly higher (R2 for each model rose by nearly 0.3) than that of the model constructed by considering only the near-surface meteorological factors.
Discussion: The research results can provide a reference for the establishment of a more accurate dust estimation model to help the mining sector to better dust prevention and control.
Open-pit coal mining, with its advantages of large production capacity, high resource recovery rate, and ease of modern management, has become the preferred method for regional coal resource extraction in China (Xie et al., 2019; Liu G. et al., 2023). Various stages of open-pit coal mining involve strong physical disturbances and destruction, leading to the generation of high concentrations of dust pollution (Huang, 2019; Wanjun and Qingxiang, 2018). The processes of open-pit coal mining involves drilling, blasting, excavation, transportation, crushing, and disposal (Ben-Awuah et al., 2016; Jumabayeva et al., 2023). In each production stage, under the influence of high-intensity destruction and disturbance, the dust at the mining site exhibits significant characteristics such as multiple sources, high dust generation, and unpredictable dispersion patterns and directions, making dust control difficult to achieve pinpoint capture and directional control (Gautam et al., 2016; Su et al., 2020).
Dust in open-pit coal mines mainly consists of small particles, predominantly PM10 and PM2.5, particles with aerodynamic diameters below 10 μm and 2.5 μm, respectively (Shekarian et al., 2021). These fine particles can remain suspended in the air for extended periods and readily binds to toxic substances, severely damaging the respiratory system and causing occupational diseases such as pneumoconiosis and silicosis (Li et al., 2021; Zazouli et al., 2021; Kamanzi et al., 2023). According to the “Statistical Bulletin on the Development of Health and Healthcare in China” released in 2019, a total of 15,898 cases of occupational pneumoconiosis were reported nationwide (Fan et al., 2020). Furthermore, large dust particles settle on the surfaces of mining equipment under the influence of gravity, accelerating equipment wear and shortening its lifespan (Zhang H. et al., 2021; Zou, 2021). Additionally, fine dust in open-pit coal mines can disperse into the surrounding area under the influence of natural forces and wind, carrying toxic substances that harm plant growth (Singh et al., 2021; Trechera et al., 2021; Shen et al., 2023). Currently, over 90% of the production capacity of open-pit coal mines in China comes from regions north of the 38th parallel, characterized by a cold and arid climate, making dust pollution more severe in these areas (Yuan et al., 2022).
High concentration pollution is jointly determined by high emission intensity and unfavorable meteorological factors (Liu et al., 2023b; Wu et al., 2021; Boente et al., 2022). In winter, the frequency of calm winds is high, atmospheric stability time is long, and low temperatures and high humidity lead to a significant temperature inversion effect (Du et al., 2022; Raj, 2015; Liu et al., 2023c), making dust pollution in open-pit coal mines particularly severe. Reduced visibility is a significant characteristic of winter dust pollution and a major factor affecting normal mining operations (Zhao et al., 2023; Zhao et al., 2024; Lu et al., 2021). Moreover, traditional large-scale water spraying for dust suppression is limited in its application during winter in extremely cold regions (Zhang Z. et al., 2021; Luo et al., 2021).
Several scholars have studied the characteristics of dust pollution and its factors in surface coal mines. Ma’s study showed that dust pollution is most serious in winter in open-cast coal mines (Li et al., 2017). Liu’s research has shown that dust concentrations in open pit mines are higher in March, November and throughout the winter months, lower in summer and autumn, and higher when humidity is higher and temperatures are lower (Ma et al., 2022). Wang’s study also showed that dust pollution from opencast coal mines is most severe in winter, followed by autumn, spring, and summer (Wang et al., 2022a). Luo’s research showed the ranking of factors affecting dust concentration at open-pit mine in winter is humidity > temperature > wind speed > temperature difference (inverse temperature intensity) (Wang et al., 2022b). The dust concentration prediction model can be developed from the factors influencing the dust concentration. A number of scholars have developed prediction models for dust concentration in surface coal mines using meteorological factors and dust concentration data, for example, Qi proposed a short-term prediction model for dust concentration based on a random forest model and hybrid particle swarm optimization (Qi et al., 2020). Liu used a particle swarm optimisation algorithm optimised gradient lifter for regression and classification analysis of dust concentration in surface mines (Liu et al., 2020). Zhang proposed a hybrid model based on long and short-term memory network and attention mechanism and applied it to the prediction of PM2.5 concentration in surface mines (Zhang et al., 2020). Luan proposed a prediction model for dust concentration in surface mines based on the integrated Random Forest and Markov chain (Luan et al., 2023).
This paper we collected dust concentration data, meteorological data, and production data from the experimental mine from 1 December 2018, to 28 February 2019, and analyses the characteristics of dust pollution and its influencing factors during the cold period in surface coal mines, and establishes a dust concentration estimation model. Different from other studies, this paper introduces satellite meteorological data and production intensity data, and the accuracy of the established estimation model is higher than that of the dust concentration estimation model that only includes near-surface monitoring meteorological data. The results of this study can provide some reference for the establishment of high-precision dust concentration estimation models.
The research location is the Haerwusu open-pit coal mine (hereinafter referred to as Haerwusu Mine), which is one of China’s five major open-pit coal mines. Haerwusu Mine is located approximately 13 km from Xuejiawan Town, the seat of Zhenggeer Banner, Ordos City, Inner Mongolia Autonomous Region. It is under the jurisdiction of Hadaigaole Township, Zhenggeer Banner, with specific geographical coordinates: E Longitude: 111°13′18″∼111°15′20″, N Latitude: 39°43′34″∼39°45′02″ as shown in Figure 1. The current mining area at Haerwusu Mine is the initial mining area, with a working line length of 2 km, a stripping working line length of 2–2.3 km, and a maximum relative depth of the mining face of approximately 200 m.
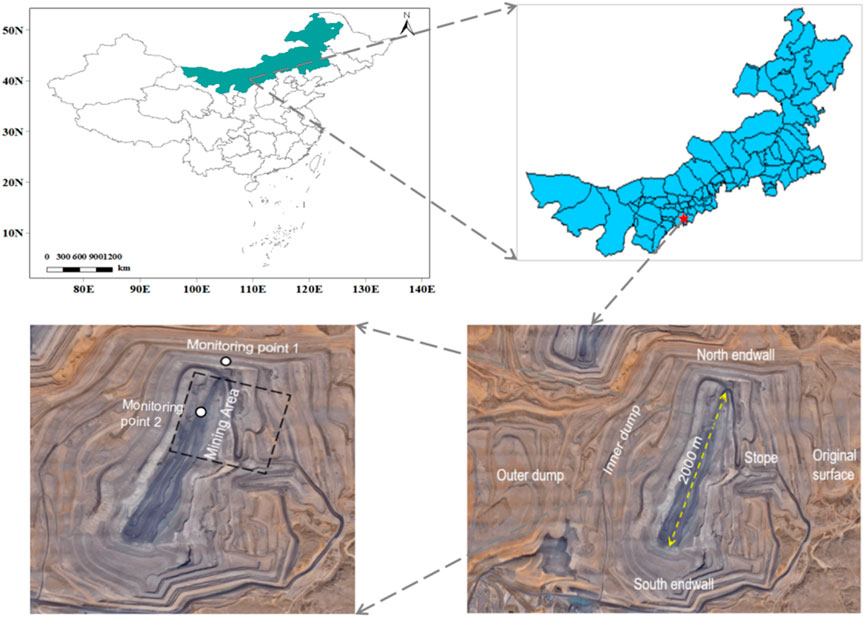
Figure 1. Location of Haerwusu open-pit coal mine.
Haerwusu Mine is located in a typical temperate continental climate zone. In recent years, the general climate is characterized by long and cold winters, hot and short summers, and drastic temperature changes in spring and autumn. The average annual temperature is 6.2°C–8.7°C, and the average annual wind speed is 1.9–3.4 m/s. The annual rainfall is low and concentrated, mostly in the 3 months of July, August and September, with an average of about 400 mm per year, and the evaporation is about 2,000 mm per year on average.
To understand the characteristics of winter dust pollution at Haerwusu Mine, two monitoring points were set up to monitor dust concentrations and meteorological factors inside and outside the mine pit. The locations of the monitoring points are shown in Figure 1, with monitoring point 1 set up at the 1,130 level of the northern end slope, and monitoring point 2 set up to reflect the pollution situation at the bottom of the pit due to the influence of Han Liubao’s land acquisition. The vertical distance between monitoring points 1 and 2 is approximately 200 m, and the horizontal distance is approximately 800 m.
Considering the actual terrain and climate conditions at Haerwusu Mine, the selected monitoring equipment should have moisture resistance, cold resistance, low-temperature resistance, and data storage and transmission capabilities. Currently, the instruments used for monitoring dust concentration mainly include dust detectors and dust sensors. Dust detectors can quickly measure the dust concentration in the environment using methods such as weighing and beta-ray detection, but they cannot continuously monitor dust concentrations online. Dust sensors, on the other hand, can achieve continuous online monitoring of dust concentrations, mainly using laser scattering methods.
Taking into account the equipment performance and the meteorological characteristics of Haerwusu open-pit coal mine, the RS-ZSYC-9S-G dust monitoring station, certified by the National Metrology Bureau, was chosen. This equipment is specifically designed for monitoring in construction projects. The equipment includes 1 air baffle box (temperature, humidity, PM2.5, PM10, TSP, etc.) for collection, 1 wind speed collection, 1 wind direction collection, 1 relay output, and 1 485 slave station output. The equipment can upload data to the monitoring software platform via GPRS. Specific technical parameters are shown in Table 1.
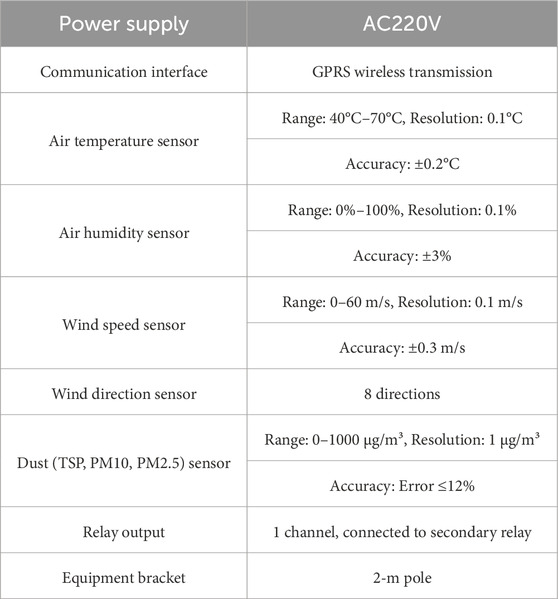
Table 1. Equipment technical parameters.
The equipment was installed on-site based on the location of the monitoring points. The monitoring equipment at monitoring point 2 is solar-powered, with a base made of a movable base that can be adjusted in position using a forklift. The monitoring equipment at monitoring point 1, located at the 1,130 level of the northern end slope, is powered by 220V AC power. The monitoring equipment uploads data to the cloud server in real time via the 4G network. To minimize systematic errors in the monitored values, the data collection frequency was set to 5 min and the monitoring data is relatively complete, assuming 30 days in a month, the total complete data should be 8,640 records. The monitoring period ranged from 1 December 2018, to 28 February 2019.
The mass concentrations of particulate matter (Total Suspended Particulates (TSP), Particulate Matter 10 (PM10) and Particulate Matter 2.5 (PM2.5)) and some meteorological factors (temperature, humidity, wind speed, and wind direction) in this paper were obtained from on-site measurement points, and the raw data from each measurement point during the valid monitoring period were exported to the cloud server.
The data for mixing layer height, solar radiation intensity, and hourly rainfall values in the paper were obtained from the HYSPLIT-4 (Hybrid Single Particle Lagrangian Integrated Trajectory Model) software developed by NOAA/ARL (National Oceanic and Atmospheric Administration U.S./Air Resources Laboratory) and calculated using the online website (http://ready.arl.noaa.gov/HYSPLIT.php).
During data collection, measurement errors and random errors may lead to anomalous values in the monitored data, i.e., values that significantly deviate from the majority of values in the observed sample. Various methods can be used to detect anomalous values, such as boxplot analysis, scatterplot analysis, and descriptive analysis. In this paper, the SPSS 25 (Statistical Product and Service Solutions) software’s descriptive statistics function was used to detect anomalous values. The SPSS provides a rule for identifying anomalous values as being greater than 3 standard deviations. After data analysis, a Z-score was added to the data list, and any Z-score below −3 or above 3 was considered an anomalous value. The anomalous values detected in this paper were replaced by the daily average values. Some data are missing due to factors such as long monitoring time, network problems and equipment failures. In this paper, mean estimation is used to fill in the missing data.
The magnitude of the inversion effect can be expressed as the intensity of the inversion. The intensity of the inversion is defined as the increase in air temperature per 100 m of altitude rise (°C/100 m), usually expressed as I, and is calculated by the Equation 1:
Where: - the temperature difference of the inverse temperature, °C;
- temperature at the bottom of the inversion layer, °C;
- temperature at the top of the inversion layer, °C.
Daily average temperatures for different locations in different months were calculated based on measured data, as shown in Figure 2. It can be observed that temperatures in Haerwusu Mine during winter are relatively low, with December being the lowest (average temperature −11.01°C and −12.0°C for point 1 and point 2), followed by January (average temperature −9.55°C and −10.36°C for point 1 and point 2) and February (average temperature −7.32°C and −6.62°C for point 1 and point 2). The temperature variations in different months roughly exhibit a sinusoidal pattern. The temperature at point 2 (altitude 930 m) is mostly lower than or equal to the temperature at point 1 (altitude 1130 m) throughout most of the time, indicating the presence of temperature inversions or isothermal layers at Haerwusu Mine for most of the time. The dissipation times of the temperature inversions vary by month but are generally concentrated between 8 a.m. and 12 a.m.
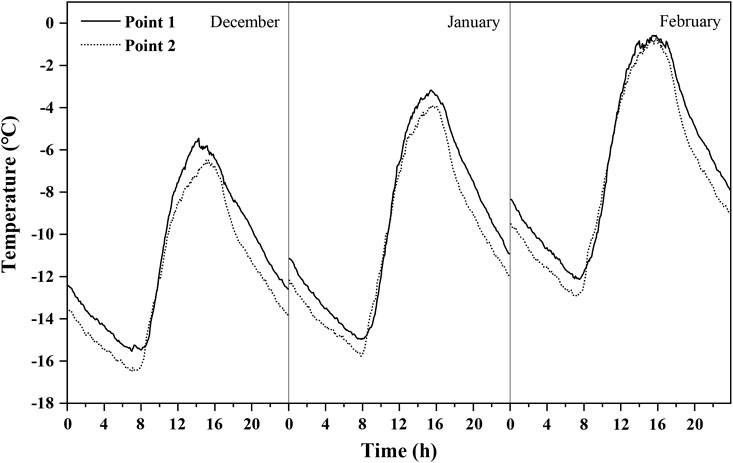
Figure 2. Characteristics of daily temperature changes in winter.
The probability distribution of the inversion intensity was calculated based on the given formula, as shown in Table 2. The table indicates that the inversion intensity inside and outside the pit is mainly concentrated between 0°C and 1°C/100 m, with peak inversion intensity being less than 2°C/100 m. When I < 0, it indicates the presence of convection in the vertical direction, suggesting relatively limited vertical air convection during the study period, especially in December. However, from December to February, the proportion of convection gradually increases, indicating that low temperatures are not conducive to vertical atmospheric convection and reduce the exchange of atmospheric gases between the pit and the external natural atmosphere.
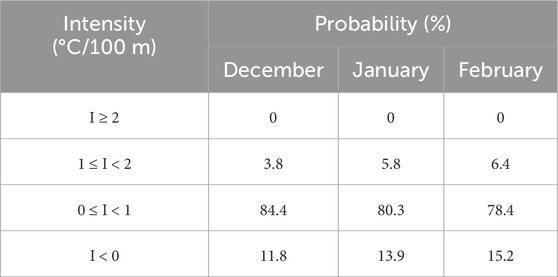
Table 2. Probability distribution of inversion intensity.
Daily average humidity for point 1 and point 2 in December, January and February was calculated based on measured data, as shown in Figure 3. It can be observed that the relative humidity exhibits a trend opposite to that of the temperature, in line with Liu’s and Luo’s research (Liu et al., 2023b; Luo et al., 2021). During the winter months, the daily variation in humidity at Point 1 generally ranged from 28.98% to 64.19% and at Point 2 from 30.18% to 66.74%. The relative humidity in December and January is closer, with peak humidity being lower than in February. The difference in humidity between the two points is not significant in December and January, but it is more pronounced in February, mainly occurring from sunset to the next day’s sunrise.
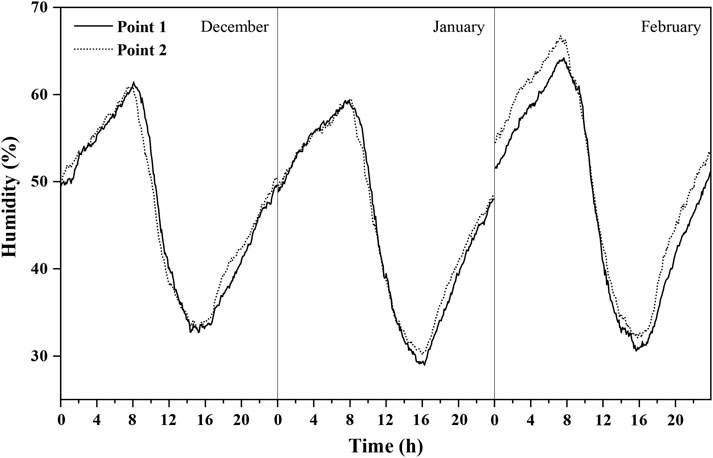
Figure 3. Characteristics of daily humidity changes in winter.
Higher humidity, combined with pollutant concentrations, determines the formation of fog and haze in open-pit mines, significantly reducing visibility inside the pit, which is an important factor affecting normal mining operations. Under high humidity conditions, when there is low wind speed, atmospheric stability, and near-surface temperature inversions, fog and haze are more likely to form (Liao et al., 2018), and these are typical natural characteristics inside open-pit mines, especially in winter. A relative humidity of 60% serves as a dividing line; above this level, it favors the hygroscopic growth of fine particulate matter, and increasing relative humidity also accelerates the conversion of gaseous precursors into particulate matter, leading to a rapid increase in particulate matter concentrations. Based on the characteristics of humidity variations, it can be inferred that before sunrise, humidity reaches its peak, which is near 60%, indicating potentially low visibility inside the pit. After sunrise, humidity sharply decreases to below 60%, suggesting a significant improvement in visibility inside the pit within a short period.
The diffusion of pollutants from the open-pit mine is significantly influenced by wind flow. Daily average wind speeds for different locations in different months were calculated based on measured data, as shown in Figure 4. It can be observed that the daily average wind speed in winter fluctuates between 0 and 3 m/s, and the trend of wind speed variation is similar at both measurement points. Before sunrise, wind speeds are mainly below 1 m/s, gradually decreasing, and then rapidly increasing after sunrise, peaking around noon. After noon, wind speeds begin to decrease until the next day’s sunrise, which is similar to the trend in temperature variations. Additionally, wind speeds inside the pit are generally lower than those outside the pit at corresponding times.
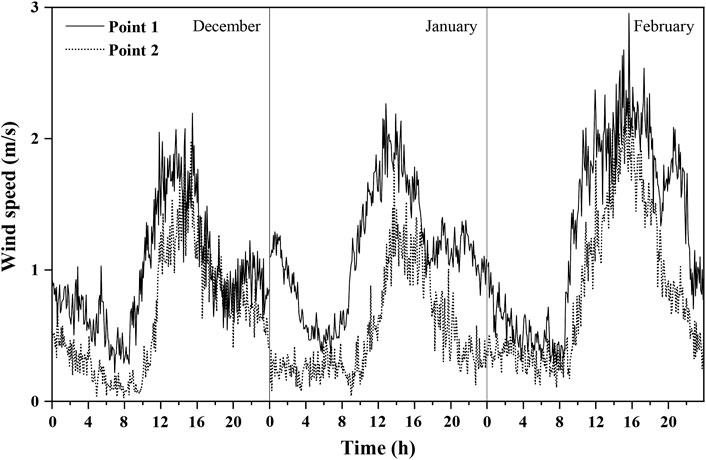
Figure 4. Characteristics of daily wind speed changes in winter.
Figure 5 presents the wind direction and wind speed diagrams and the wind direction dust concentration diagram at point 1 and point 2 in winter. As shown in Figures 5A, B, the frequency of calm winds is high in winter at Haerwusu (58.4% at point 1% and 41.0% at point 2). When there is wind, the predominant wind direction outside the pit is mainly from the northwest, followed by the west and north winds. Inside the pit, the predominant wind directions are from the northeast, east, south, and west, and there is a significant difference in wind direction between the two points, indicating that the topography of the open-pit mine significantly influences the flow of air passing through the pit bottom. As shown in Figure 5C, the dust concentration in the quarry was higher under conditions of southwest and west winds at point 1 and northeast and west winds at point 2, and there was an inverse relationship between the wind directions at points 1 and 2. This suggests that when the wind direction is southwest and west, the bottom of the pit may be attended by circulation, which prevents the dust from spreading outward and increases the pollution of the quarry.
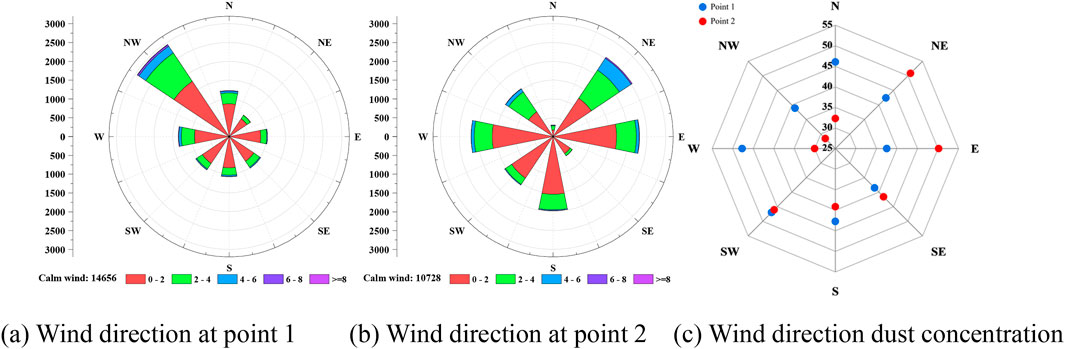
Figure 5. Wind direction and wind speed diagram and wind direction dust concentration diagram at different measuring points. (A) Wind direction at point 1 (B) Wind direction at point 2 (C) Wind direction dust concentration.
Particle concentration is not only influenced by near-surface meteorological factors but also by regional meteorological factors such as rainfall, solar radiation, and boundary layer height. Using HYSPLIT online software, hourly values of rainfall, solar radiation, and boundary layer height for the Haerwusu region were calculated, and the daily variation characteristics of regional meteorological factors were analyzed, as shown in Figure 6.
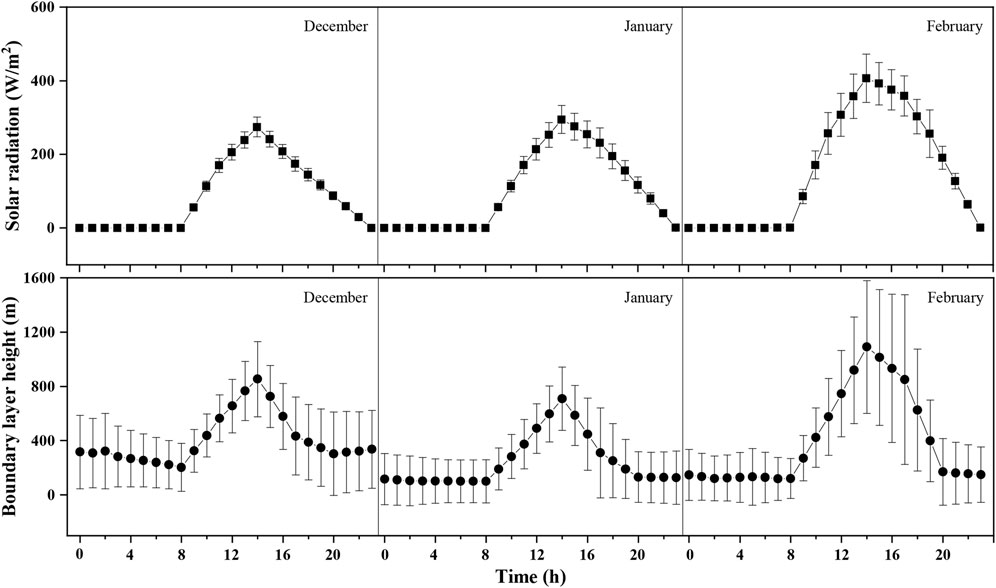
Figure 6. Characteristics of daily changes of solar radiation and boundary layer height.
Rainfall data indicate that there was no rainfall in Haerwusu in December and January, with very little rainfall occurring in February. Therefore, only the daily variation characteristics of solar radiation and boundary layer height are shown. The solar radiation characteristics in winter exhibit consistency across different months, with solar radiation values being 0 from 00:00 to 08:00, significantly increasing from 08:00 to 14:00, and gradually decreasing to 0 from 14:00 to 00:00. Additionally, the radiation values in February are higher than those in December and January. The boundary layer height characteristics in winter also show good consistency, with minimal differences and a slight decreasing trend from 00:00 to 08:00, a rapid increase from 08:00 to 14:00, a sharp decrease from 14:00 to 20:00, and a relatively stable level from 20:00 to 00:00. The trend in boundary layer height changes is similar to that of solar radiation changes, primarily due to the influence of daytime thermal uplift. Additionally, the boundary layer height in winter follows the order of January < December < February.
Figure 7 shows the characteristics of particulate matter variation at two measurement points during winter. It can be observed that the variation of particulate matter at both measurement points is mainly concentrated below 100 μg/m³. As the particle size decreases, the range of variation gradually diminishes. Over time, although the anomalous concentration values show inconsistent changes, the overall trend of particulate matter indicates a decrease, with the pollution level ranking as December > January > February. Comparing the specific changes in particulate matter at points 1 and 2, it is noted that the pollution level at point 1 is slightly higher than at point 2, possibly due to the proximity of point 1 to the dumping site. Point 1 is located at the northern end slope, with minimal operations, making its pollution level less significant. On the other hand, point 2 is situated at the pit bottom, the primary area for coal mining operations. Therefore, this chapter primarily analyzes the pollution variation characteristics of particulate matter at point 2.
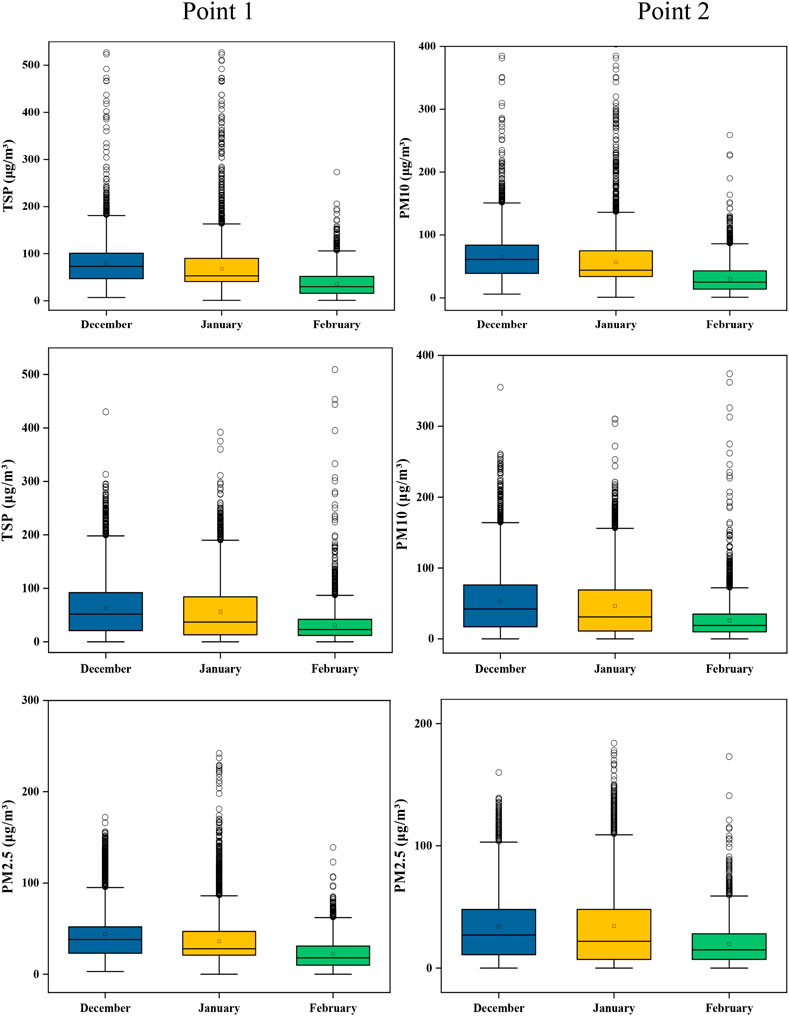
Figure 7. The change characteristics of the concentration of particulate matter in winter at the two measurement points.
The latest “Ambient Air Quality Standards” (GB3095-2012) in China clearly stipulate the first and second-level standards for the daily average concentration of particulate matter, as shown in Table 3. The actual measured results for TSP, PM10, and PM2.5 at point 2 (pit bottom) were statistically analyzed to obtain the daily average concentrations for each month, as shown in Figure 8.
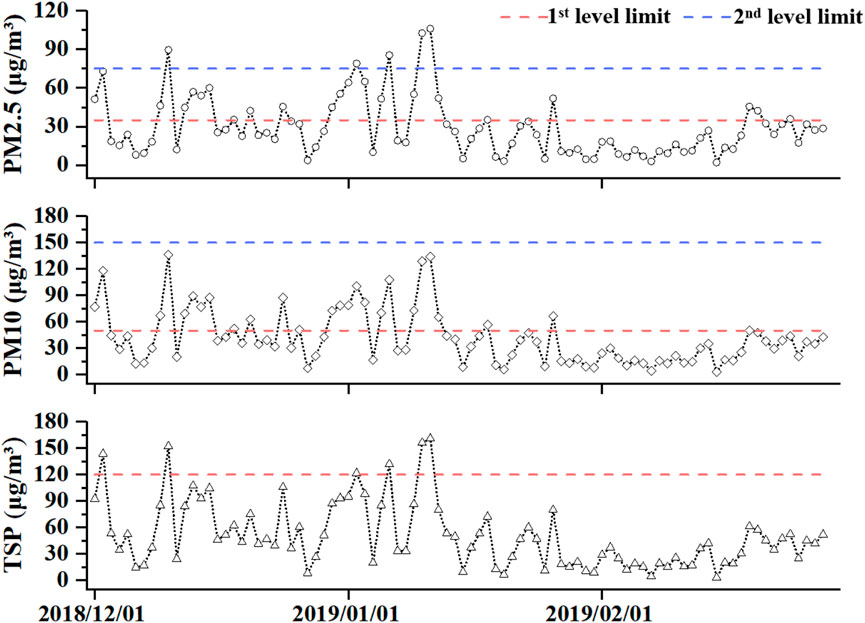
Figure 8. Changes of particulate matter.

Table 3. Limits of mass concentration of particulate matter.
From Figure 8, it is evident that the TSP mass concentration at the pit bottom in winter did not exceed the national second-level standard limit, but exceeded the national first-level standard limit for a cumulative total of 6 days, specifically 2 days in December and 4 days in January. The PM10 mass concentration did not exceed the national second-level standard limit, but exceeded the national first-level standard limit for a cumulative total of 25 days, specifically 13 days in December, 11 days in January, and 1 day in February. The PM2.5 mass concentration exceeded the national second-level standard limit for a cumulative total of 5 days, specifically 1 day in December and 4 days in January, and exceeded the national first-level standard limit for a cumulative total of 26 days, specifically 13 days in December, 11 days in January, and 1 day in February. It is evident that the pollution at the pit bottom is relatively severe during winter, especially in December and January, with the concentration of fine particulate matter exceeding the national standard limits being more pronounced. Additionally, the variation patterns of TSP, PM10, and PM2.5 show significant consistency.
Figure 9 illustrates the diurnal variation patterns of particulate matter mass concentration in winter, showing significant consistency in the daily variation characteristics of different particulate matter. The diurnal variation pattern of particulate matter exhibits an approximate unimodal distribution, with no significant differences in the trend of variation between different months, except for substantial concentration differences. Before sunrise, the atmosphere is in a stable state, and there is no exchange of air between the pit and the external atmosphere, making it difficult for particulate matter to diffuse out of the mine, leading to an increase in mass concentration until sunrise (around 9 a.m.). After sunrise, solar radiation intensifies, the atmospheric temperature at the pit bottom sharply rises, turbulence strengthens, and the mass concentration of particulate matter rapidly decreases until 4 p.m. After 4 p.m., the pit bottom is no longer under direct sunlight, turbulence within the pit diminishes, wind speed decreases, and relative humidity increases, causing the mass concentration of particulate matter to increase again until the next day’s sunrise (around 9 a.m.). Furthermore, around 7 p.m., there is a sudden change in the mass concentration of particulate matter, showing a short-term decrease or near-stable trend. The reasons for this include reduced mining activities after 7 p.m., leading to a decrease in overall pollutant emissions, and the descent of cold air along the slope towards the pit bottom after 7 p.m., bringing in some fresh air and reducing the concentration of pollutants at the pit bottom.
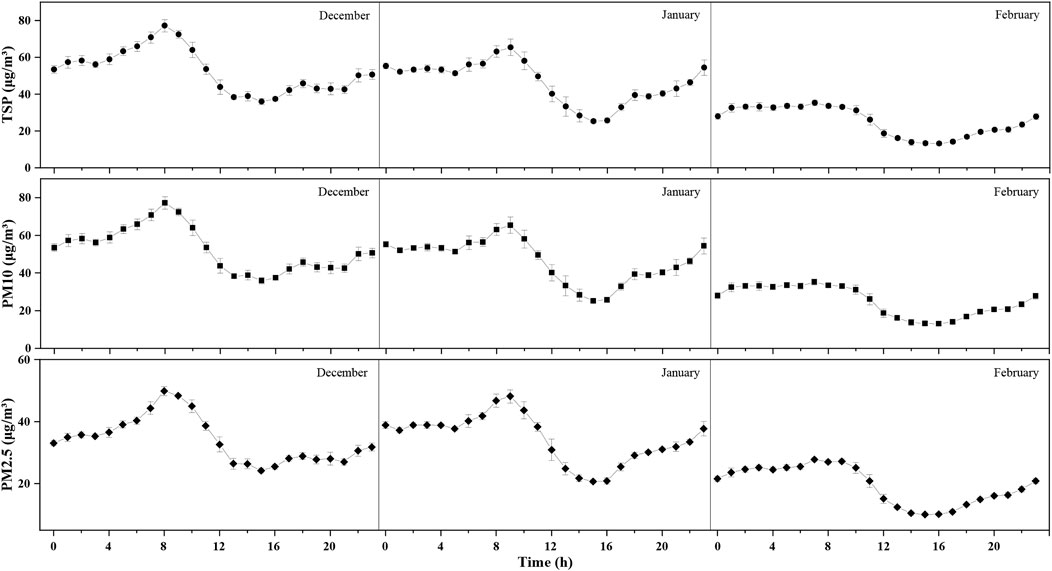
Figure 9. Daily variation characteristics of the mass concentration of particulate matter.
The analysis indicates that the mass concentration changes of TSP, PM10, and PM2.5 exhibit significant consistency, suggesting a strong correlation between them. Therefore, using the daily variation characteristic data of particulate matter concentration, a correlation analysis was conducted, and the results are shown in Table 4. It is evident that the correlation coefficients between the mass concentrations of particulate matter exceed 0.9, passing both-tailed tests, indicating a significant correlation between the mass concentrations of particulate matter, suggesting similar sources for the three types of particulate matter. To further quantify the relationship between the mass concentrations of particulate matter, regression analysis was performed.

Table 4. Particulate matter correlation.
The PM10 mass concentration was selected as the dependent variable and the TSP mass concentration as the independent variable, and the curve estimation analyses of the two were carried out using SPSS software, and the results of the analyses are shown in Table 5.

Table 5. Particulate matter regression analysis.
Regression analysis was conducted for the mass concentrations of PM10 and TSP, revealing that the power function yielded the best fit, with an R2 value of 0.985 and passing the significance test. The specific coefficients are presented in Table 6.
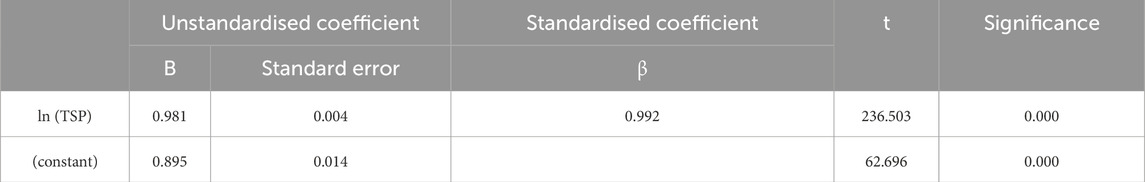
Table 6. Coefficients.
In summary, the regression equations for the mass concentrations of PM10 and TSP are shown as Equation 2:
Into a general form, as shown in Equation 3:
Similarly derived, regression analyses of PM2.5, TSP and PM2.5, PM10 revealed that still the power function fit best, 0.959 and 0.966, respectively.It can be obtained that the regression equations for the mass concentrations of PM2.5 and TSP are shown as Equation 4:
The regression equations for the mass concentrations of PM2.5 and PM10 are shown as Equation 5:
The final fitted functions obtained for the different particulate concentrations are shown in Figure 10.
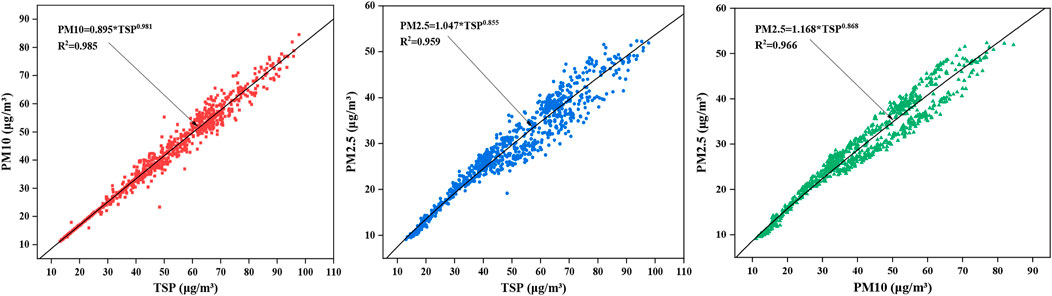
Figure 10. Fitting function of different particle concentrations.
In order to analyse the influence of meteorological factors on the dust concentration, the correlation between the daily average values of dust concentration and meteorological parameters at the bottom of the pit (point 2) in winter was carried out by Spearman’s rank correlation analysis, which can analyse the degree of covariance of random variables under linear correlation or non-linear correlation, and can reflect the real correlation of variables in a more objective way, and the results are shown in Table 7.
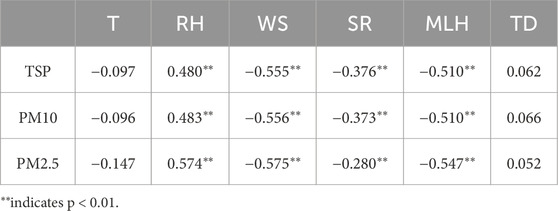
Table 7. Rank correlation coefficients between particulate matter concentrations and meteorological factors.
It can be seen that the concentration of particulate matter is significantly negatively correlated with wind speed, solar radiation and boundary layer height, and the correlation coefficients are in the order of wind speed > boundary layer height > solar radiation, which indicates that the concentration of particulate matter at the bottom of the pit in winter is greatly affected by wind speed, boundary layer height and solar radiation, and the concentration of particulate matter decreases with the increase of wind speed, boundary layer height and solar radiation; the concentration of particulate matter is significantly positively correlated with the relative humidity, that is, the concentration of particulate matter increases with the increase of humidity. That is, the particulate matter concentration gradually increases with the increase of humidity; the correlation coefficients of the particulate matter concentration with temperature and temperature difference are small, which indicates that the particulate matter concentration at the bottom of the pit in winter is less influenced by temperature and temperature difference. The correlation coefficients with temperature and temperature difference are small, indicating that the particulate matter concentration at the bottom of the pit is less affected by temperature and temperature difference in winter. In addition, the correlation coefficients of TSP concentration and PM10 concentration with meteorological factors are very close to each other, which indicates that PM10 is the main constituent of TSP.
The concentration of particulate matter at the bottom of the pit in winter shows a significant negative correlation with wind speed, boundary layer height and solar radiation, mainly because when the wind speed, boundary layer height and solar radiation are large, the atmospheric structure is unstable and the turbulence is intense, which is conducive to the dilution and diffusion of the pollutants; the concentration of particulate matter shows a significant positive correlation with the humidity, mainly because in winter, the relative humidity is low, and the water vapour content of air is not enough to make the particulate matter particle size increases and a large amount of precipitation, but instead, the haze phenomenon is formed, reducing solar radiation to the pit and aggravating particulate matter pollution.
In order to better reflect the relationship between meteorological factors and particulate matter mass concentration, further factor analysis can be performed by means of principal component analysis (PCA). Before factor analysis, KMO (Kaiser-Meyer-Olkin) sample measure and Bartlett’s sphere test are required, which is used to compare the simple correlation coefficient and partial correlation coefficient of the variables, and the closer the value is to 1, the more suitable the variables are for the factor analysis, and the statistic of Bartlett’s sphere test is obtained according to the rows and columns of correlation coefficient matrix. The Bartlett’s sphere test statistic is obtained based on the determinant of the matrix of correlation coefficients, and if it passes the test of significance it is suitable for factor analysis. In the factor analysis, the variables with significant multicollinearity were excluded, and nine variables, namely, temperature (T), relative humidity (RH), wind speed (WS), solar radiation (SR), boundary layer height (MLH), temperature difference (TD), TSP, PM10, and PM2.5, were selected for factor analysis. KMO and Bartlett’s sphere tests were first performed on the study data, and a KMO value of 0.692 and significance of 0 were obtained, which passed the Bartlett’s sphere test. It indicates that the correlation coefficient matrix is significantly different from the unit matrix and is suitable for factor analysis. Through factor analysis, three principal components were extracted, and the cumulative variance contribution rate was 74.641%, indicating that the information of the original variables was lost less, and the variance contribution rate of the three components changed after rotation, but the cumulative variance contribution rate did not change, i.e., it did not affect the commonality of the original variables, so the effect of the factor analysis was more desirable, as shown in Table 8.The common factor 1 includes TSP, PM10, PM2.5, MLH and WS, common factor 2 includes T and SR, and common factor 3 includes RH and TD, as shown in Figure 11. It can be seen that wind speed, boundary layer height and particulate mass concentration are most significantly correlated under the combined influence of multiple meteorological factors.
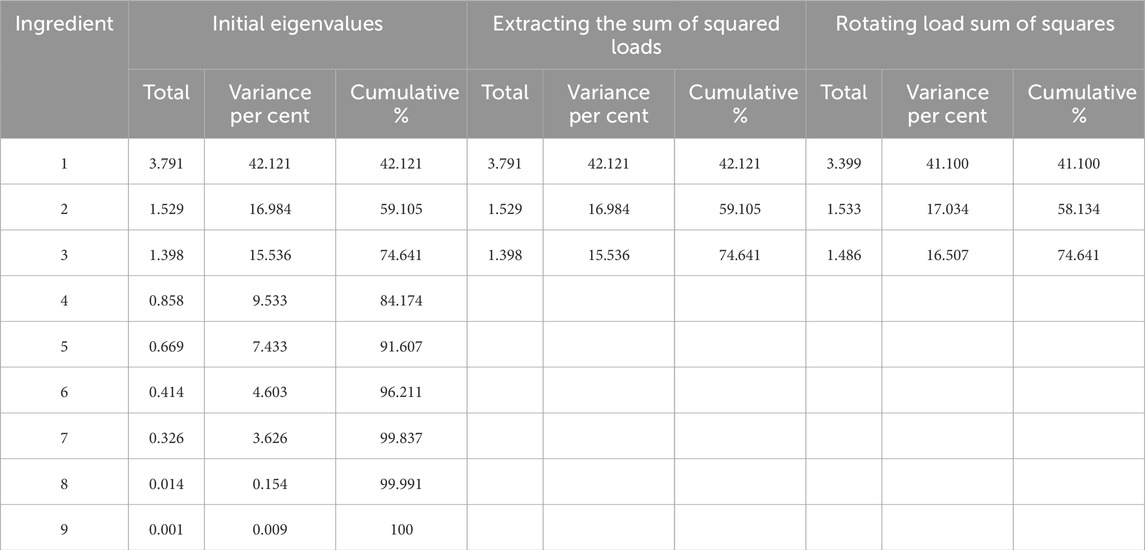
Table 8. Total variance explained.
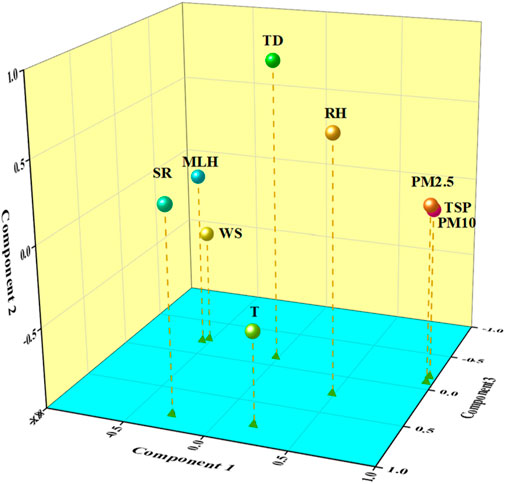
Figure 11. Rotating space components.
Coal production directly affects the intensity of dust generation at the pit bottom. Taking PM10 as an example, the relationship between the daily average mass concentration of particulate matter and daily coal production was analyzed. Based on the 30-day production data provided by the mine, it was plotted against the corresponding PM10 mass concentration, as shown in Figure 12. It is evident that the trend of PM10 concentration differs from the trend of coal production, indicating that dust concentration is also influenced by other factors.
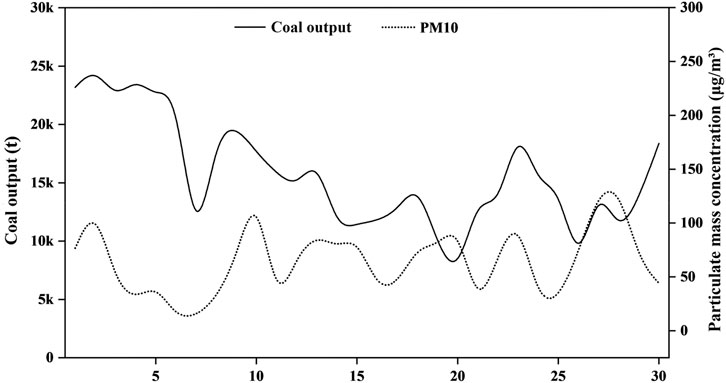
Figure 12. Relationship between PM10 and coal production.
Due to the limited coal production data and the fact that pit bottom pollution is determined by both dust generation intensity and meteorological conditions, it is necessary to introduce one or more variables that can represent the intensity of dust generation. During coal production, the operation of mining equipment generates a certain level of noise, with higher operational intensity resulting in greater noise at the pit bottom. Therefore, noise can be used to represent the dust generation intensity to a certain extent. Noise was processed into daily average values and rank correlation analysis with particulate matter concentration, and the results are shown in Table 9. It can be seen that noise and particulate matter concentration show significant positive correlation, i.e., the larger the noise, the higher the particulate matter concentration.
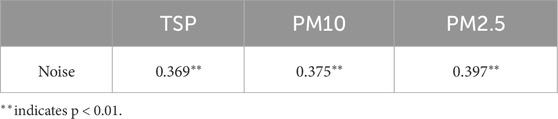
Table 9. Rank correlation coefficient of noise and particle concentration.
By using multiple monitored parameters, the estimated particle mass concentration can be established to reflect the atmospheric pollution at the pit bottom by establishing the relationship between meteorological parameters, production intensity, and pit bottom particle concentration. This study utilizes a multivariate stepwise regression analysis to construct a model for estimating particle mass concentration. The process involves removing variables with insignificant effects on the dependent variable and then introducing variables with significant effects one by one. This method effectively identifies meteorological factors significantly affecting particle mass concentration.
Using near-surface meteorological factors (temperature, humidity, wind speed, temperature difference) as independent variables to construct a regression model for particle mass concentration, the results are shown in Table 10. The results indicate that only humidity and wind speed among the near-surface meteorological factors significantly affect particle concentration. The constructed estimation model has a maximum R2 of 0.348, indicating a relatively poor model performance. This suggests that using only near-surface meteorological factors to establish the estimation model is not appropriate, and the influence of multiple meteorological factors on particle concentration should be considered.
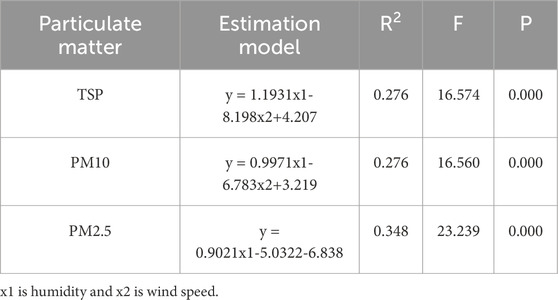
Table 10. Particulate matter concentration regression model (only including near-surface meteorological factors).
Using solar radiation intensity and atmospheric boundary layer height data obtained from HYSPLIT online calculations as regional meteorological factors for Haerwusu, and combining them with monitored near-surface meteorological factors as independent variables to construct a regression model for particle concentration including solar radiation and atmospheric boundary layer height, the results are shown in Table 11. It is evident that introducing solar radiation and atmospheric boundary layer height significantly improves the accuracy of the constructed particle concentration estimation model, especially with the regression model for PM2.5 reaching an R2 value of 0.524. This indicates that solar radiation and atmospheric boundary layer height significantly affect particle concentration, and these two meteorological factors should be considered when constructing the estimation model.
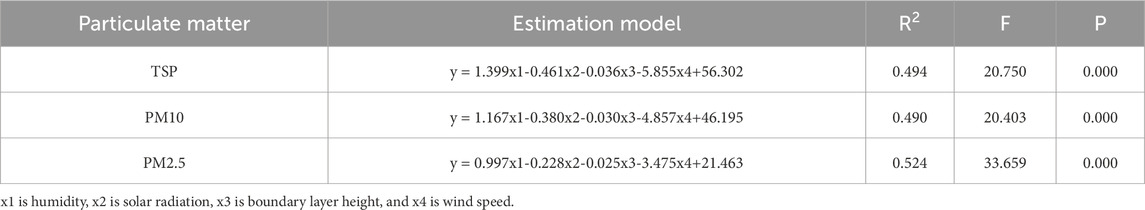
Table 11. Particulate matter concentration regression model (including solar radiation and boundary layer height).
The particle concentration in a region is not only related to meteorological factors but also influenced by emission intensity. Many current studies constructing particle estimation or prediction models often do not consider the influence of emission intensity, mainly due to the difficulty in quantitatively characterizing pollutant emission intensity. The daily production volume of an open-pit coal mine directly determines the emission intensity of pollutants. As the daily production volume of an open-pit coal mine can be quantitatively recorded, constructing a dust estimation model for an open-pit coal mine can introduce dust emission intensity. Due to the lack of some production data provided by the mine, this study uses noise as a substitute for emission intensity. Using noise and meteorological parameters as independent variables to construct a particle concentration estimation model, the results are shown in Table 12. It is evident that introducing noise significantly improves the accuracy of the constructed particle concentration estimation model, with the R2 value of the PM2.5 regression model reaching 0.603.
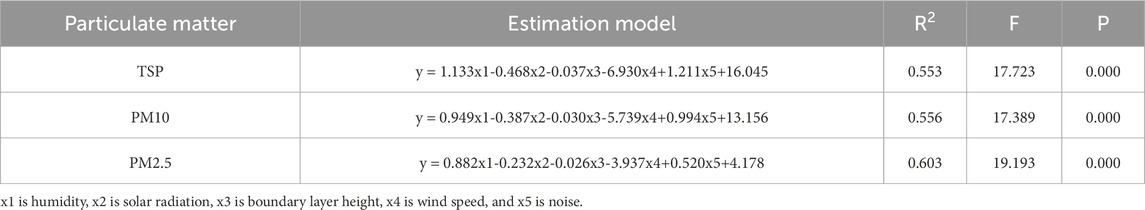
Table 12. Particulate matter concentration regression model (including noise).
The model constructed considering noise and multiple meteorological factors shows the best performance, indicating that particle concentration is influenced by multiple factors. Furthermore, the model results demonstrate that the accuracy of the estimation model for PM2.5 is higher than the corresponding models for TSP and PM10, once again indicating that small particle size particles are more significantly affected by meteorological factors.
This article introduces the characteristics of winter meteorological factors and dust concentration at the Haerwusu mine, and analyzes the correlation between these factors and particle mass concentration. It then explains the impact of production intensity on particle mass concentration and establishes a model for estimating particle mass concentration under the influence of multiple factors. The main conclusions are as follows:
(1) In winter, the temperature inside the pit is lower, humidity is higher, and wind speed is lower compared to outside the pit. There is a prolonged inversion phenomenon in the mining area, with minimal atmospheric vertical convection. From December to February of the following year, the duration of inversion inside the pit gradually decreases, while humidity, wind speed, solar radiation intensity, and boundary layer height gradually increase. And there is less vertical convection in the atmosphere between 8 a.m. and 12 a.m.
(2) Humidity and noise show a significant positive correlation with particle mass concentration (the lowest correlation coefficient is 0.480 and 0.369 for humidity and noise), while wind speed, solar radiation, and boundary layer height exhibit a significant negative correlation with particle mass concentration (the lowest correlation coefficient is −0.555, −0.280 and −0.510 for wind speed, solar radiation and boundary layer height). Factor analysis indicates that wind speed and atmospheric boundary layer height have the most significant impact on particle mass concentration.
(3) The average dust mass concentration in winter follows the order: December > January > February. The relative frequency of exceeding the national environmental air quality standard limit is higher for fine particle dust (PM10, PM2.5). The diurnal variation characteristics of particles exhibit an approximate unimodal distribution.
(4) There is a strong correlation between the mass concentrations of TSP, PM10, and PM2.5. Power functions provide the best fit for pairwise particle relationships, with the fitting formulas as follows: PM10 = 0.895 * TSP0.981, PM2.5 = 1.047 * TSP0.855, PM2.5 = 1.168 * PM100.868.
(5) The accuracy of the particle concentration estimation model constructed considering multiple factors significantly improves compared to the model constructed only considering near-surface meteorological factors (R2 for each model rose by nearly 0.3). Small particle size particles are more significantly affected by meteorological factors.
The original contributions presented in the study are included in the article/supplementary material, further inquiries can be directed to the corresponding author.
HW: Conceptualization, Investigation, Methodology, Software, Writing–original draft. ZW: Methodology, Software, Validation, Writing–review and editing. RW: Data curation, Investigation, Writing–review and editing.
The author(s) declare that financial support was received for the research, authorship, and/or publication of this article. This work was funded by the National Natural Science Foundation of China (no. 52374145) and the Fundamental Research Funds for the Central Universities (2021ZDPY0227).
The authors thank the Haerwusu open-pit coal mine for providing a research base for this paper.
The authors declare that the research was conducted in the absence of any commercial or financial relationships that could be construed as a potential conflict of interest.
All claims expressed in this article are solely those of the authors and do not necessarily represent those of their affiliated organizations, or those of the publisher, the editors and the reviewers. Any product that may be evaluated in this article, or claim that may be made by its manufacturer, is not guaranteed or endorsed by the publisher.
Ben-Awuah, E., Richter, O., Elkington, T., and Pourrahimian, Y. (2016). Strategic mining options optimization: open pit mining, underground mining or both. Int. J. Min. Sci. Technol. 26 (6), 1065–1071. doi:10.1016/j.ijmst.2016.09.015
Boente, C., Millán-Martínez, M., Sánchez de la Campa, A. M., Sánchez-Rodas, D., and de la Rosa, J. D. (2022). Physicochemical assessment of atmospheric particulate matter emissions during open-pit mining operations in a massive sulphide ore exploitation. Atmos. Pollut. Res. 13 (4), 101391. doi:10.1016/j.apr.2022.101391
Du, C., Wang, J., and Wang, Y. (2022). Study on environmental pollution caused by dumping operation in open pit mine under different factors. J. Wind Eng. Industrial Aerodynamics 226, 105044. doi:10.1016/j.jweia.2022.105044
Fan, Y., Xu, W., Wang, Y., Wang, Y., Yu, S., and Ye, Q. (2020). Association of occupational dust exposure with combined chronic obstructive pulmonary disease and pneumoconiosis: a cross-sectional study in China. BMJ open 10 (9), e038874. doi:10.1136/bmjopen-2020-038874
Gautam, S., Patra, A. K., Sahu, S. P., and Hitch, M. (2016). Particulate matter pollution in opencast coal mining areas: a threat to human health and environment. Int. J. Min. Reclam. Environ. 32 (2), 75–92. doi:10.1080/17480930.2016.1218110
Huang, Z. (2019). Numerical simulation of blasting dust pollution in open-pit mines. Appl. Ecol. & Environ. Res. 17 (5). doi:10.15666/aeer/1705_1031310333
Jumabayeva, G., Allanazarov, B., and Joldasbayeva, A. (2023). Stages of open pit mining. mining methods and their processes. Sci. innovation 2 (A1), 236–240.
Kamanzi, C., Becker, M., Jacobs, M., Konečný, P., Von Holdt, J., and Broadhurst, J. (2023). The impact of coal mine dust characteristics on pathways to respiratory harm: investigating the pneumoconiotic potency of coals. Environ. Geochem. Health 45 (10), 7363–7388. doi:10.1007/s10653-023-01583-y
Li, L., Zhang, R., Sun, J., He, Q., Kong, L., and Liu, X. (2021). Monitoring and prediction of dust concentration in an open-pit mine using a deep-learning algorithm. J. Environ. health Sci. Eng. 19, 401–414. doi:10.1007/s40201-021-00613-0
Li, X., Ma, Y., Wang, Y., Liu, N., and Hong, Y. (2017). Temporal and spatial analyses of particulate matter (PM10 and PM2. 5) and its relationship with meteorological parameters over an urban city in northeast China. Atmos. Res. 198, 185–193. doi:10.1016/j.atmosres.2017.08.023
Liao, T. T., Gui, K., Jiang, W. T., Wang, S., Wang, B., Zeng, Z., et al. (2018). Air stagnation and its impact on air quality during winter in Sichuan and Chongqing, southwestern China. Sci. Total Environ. 635, 576–585. doi:10.1016/j.scitotenv.2018.04.122
Liu, B., Guo, X., Lai, M., and Wang, Q. (2020). Air pollutant concentration forecasting using long short-term memory based on wavelet transform and information gain: a case study of beijing. Comput. Intell. Neurosci. 2020 (1), 1–12. doi:10.1155/2020/8834699
Liu, G., Guo, W., Chai, S., and Li, J. (2023a). Research on production capacity planning method of open-pit coal mine. Sci. Rep. 13 (1), 8676. doi:10.1038/s41598-023-35967-y
Liu, Z., Ao, Z., Zhou, W., Zhang, B., Niu, J., Wang, Z., et al. (2023c). Research on the physical and chemical characteristics of dust in open pit coal mine crushing stations and closed dust reduction methods. Sustainability 15 (16), 12202. doi:10.3390/su151612202
Liu, Z., Zhang, R., Ma, J., Zhang, W., and Li, L. (2023b). Analysis and prediction of the meteorological characteristics of dust concentrations in open-pit mines. Sustainability 15 (6), 4837. doi:10.3390/su15064837
Lu, X., Zhou, W., Qi, C., Luo, H., Zhang, D., and Pham, B. T. (2021). Prediction into the future: a novel intelligent approach for PM2. 5 forecasting in the ambient air of open-pit mining. Atmos. Pollut. Res. 12 (6), 101084. doi:10.1016/j.apr.2021.101084
Luan, B., Zhou, W., Jiskani, I. M., and Wang, Z. (2023). An improved machine learning approach for optimizing dust concentration estimation in open-pit mines. Int. J. Environ. Res. Public Health 20 (2), 1353. doi:10.3390/ijerph20021353
Luo, H., Zhou, W., Jiskani, I. M., and Wang, Z. (2021). Analyzing characteristics of particulate matter pollution in open-pit coal mines: implications for green mining. Energies 14 (9), 2680. doi:10.3390/en14092680
Ma, J., Zhang, R., Li, L., Liu, Z., Sun, J., Kong, L., et al. (2022). Analysis of the dust-concentration distribution law in an open-pit mine and its influencing factors. Acs Omega 7 (48), 43609–43620. doi:10.1021/acsomega.2c04439
Qi, C., Zhou, W., Lu, X., Luo, H., Pham, B. T., and Yaseen, Z. M. (2020). Particulate matter concentration from open-cut coal mines: a hybrid machine learning estimation. Environ. Pollut. 263, 114517. doi:10.1016/j.envpol.2020.114517
Raj, K. V. (2015). Three dimensional computational fluid dynamics models of pollutant transport in a deep open pit mine under Arctic air inversion and mitigation measures. United States: University of Alaska Fairbanks.
Shekarian, Y., Rahimi, E., Rezaee, M., Su, W. C., and Roghanchi, P. (2021). Respirable coal mine dust: a review of respiratory deposition, regulations, and characterization. Minerals 11 (7), 696. doi:10.3390/min11070696
Shen, Z., Ao, Z., Wang, Z., and Yang, Y. (2023). Study on crust-shaped dust suppressant in non-disturbance area of open-pit coal mine—a case study. Int. J. Environ. Res. Public Health 20 (2), 934. doi:10.3390/ijerph20020934
Singh, S., Pandey, B., Roy, L. B., Shekhar, S., and Singh, R. K. (2021). Tree responses to foliar dust deposition and gradient of air pollution around opencast coal mines of Jharia coalfield, India: gas exchange, antioxidative potential and tolerance level. Environ. Sci. Pollut. Res. 28, 8637–8651. doi:10.1007/s11356-020-11088-1
Su, X., Ding, R., and Zhuang, X. (2020). Characteristics of dust in coal mines in central North China and its research significance. Acs Omega 5 (16), 9233–9250. doi:10.1021/acsomega.0c00078
Trechera, P., Moreno, T., Córdoba, P., Moreno, N., Zhuang, X., Li, B., et al. (2021). Comprehensive evaluation of potential coal mine dust emissions in an open-pit coal mine in Northwest China. Int. J. Coal Geol. 235, 103677. doi:10.1016/j.coal.2021.103677
Wang, Z., Zhou, W., Jiskani, I. M., Ding, X., and Luo, H. (2022a). Dust pollution in cold region surface mines and its prevention and control. Environ. Pollut. 292, 118293. doi:10.1016/j.envpol.2021.118293
Wang, Z., Zhou, W., Jiskani, I. M., Luo, H., Ao, Z., and Mvula, E. M. (2022b). Annual dust pollution characteristics and its prevention and control for environmental protection in surface mines. Sci. Total Environ. 825, 153949. doi:10.1016/j.scitotenv.2022.153949
Wanjun, T., and Qingxiang, C. (2018). Dust distribution in open-pit mines based on monitoring data and fluent simulation. Environ. Monit. Assess. 190 (11), 632. doi:10.1007/s10661-018-7004-9
Wu, T., Yang, Z., Wang, A., Zhang, K., and Wang, B. (2021). A study on movement characteristics and distribution law of dust particles in open-pit coal mine. Sci. Rep. 11 (1), 14703. doi:10.1038/s41598-021-94131-6
Xie, H., Wu, L., and Zheng, D. (2019). Prediction on the energy consumption and coal demand of China in 2025. J. China Coal Soc. 44 (7), 1949–1960.
Yuan, M., Ouyang, J., Zheng, S., Tian, Y., Sun, R., Bao, R., et al. (2022). Research on ecological effect assessment method of ecological restoration of open-pit coal mines in alpine regions. Int. J. Environ. Res. Public Health 19 (13), 7682. doi:10.3390/ijerph19137682
Zazouli, M. A., Dehbandi, R., Mohammadyan, M., Aarabi, M., Dominguez, A. O., Kelly, F. J., et al. (2021). Physico-chemical properties and reactive oxygen species generation by respirable coal dust: implication for human health risk assessment. J. Hazard. Mater. 405, 124185. doi:10.1016/j.jhazmat.2020.124185
Zhang, H., Han, W., Xu, Y., and Wang, Z. (2021a). Analysis on the development status of coal mine dust disaster prevention technology in China. J. Healthc. Eng. 2021, 1–9. doi:10.1155/2021/5574579
Zhang, Y.-w., Yuan, H. w., Wu, H. l., Sun, X., and Dong, Y. c. (2020). Research on seasonal prediction of PM2. 5 based on PCA-BP neural network. Journal of Physics: conference Series. IOP Publ. 1486 (2), 022029. doi:10.1088/1742-6596/1486/2/022029
Zhang, Z., Zhou, Y., Zhao, N., Li, H., Tohniyaz, B., Mperejekumana, P., et al. (2021b). Clean heating during winter season in Northern China: a review. Renew. Sustain. Energy Rev. 149, 111339. doi:10.1016/j.rser.2021.111339
Zhao, X., Du, J., Bharti, B., Qiao, Y., Li, Y., Wu, H., et al. (2023). Research and industrial test of anti-freezing and dust suppression agent for truck roads in open-pit mines in inner Mongolia, China. Processes 11 (12), 3336. doi:10.3390/pr11123336
Zhao, X., Shen, Z., Bharti, B., Han, F., Feng, S., Du, J., et al. (2024). Research on chlorine salt antifreeze road dust suppressants for open-pit coal mines. Atmos. Pollut. Res. 15, 102161. doi:10.1016/j.apr.2024.102161
Keywords: open-pit coal mines, particulate matter, dust pollution, cold period, dust control
Citation: Wang H, Wang Z and Wang R (2025) Characteristics of dust pollution and its influencing factors during cold period of open-pit coal mines in northern China. Front. Earth Sci. 13:1458847. doi: 10.3389/feart.2025.1458847
Received: 03 July 2024; Accepted: 23 January 2025;
Published: 13 February 2025.
Edited by:
Wajid Ali, University of Peshawar, PakistanReviewed by:
Rosane Rodrigues Chaves, Federal University of Rio Grande do Norte, BrazilCopyright © 2025 Wang, Wang and Wang. This is an open-access article distributed under the terms of the Creative Commons Attribution License (CC BY). The use, distribution or reproduction in other forums is permitted, provided the original author(s) and the copyright owner(s) are credited and that the original publication in this journal is cited, in accordance with accepted academic practice. No use, distribution or reproduction is permitted which does not comply with these terms.
*Correspondence: Zhiming Wang, Y3VtdHptQGN1bXQuZWR1LmNu
Disclaimer: All claims expressed in this article are solely those of the authors and do not necessarily represent those of their affiliated organizations, or those of the publisher, the editors and the reviewers. Any product that may be evaluated in this article or claim that may be made by its manufacturer is not guaranteed or endorsed by the publisher.
Research integrity at Frontiers
Learn more about the work of our research integrity team to safeguard the quality of each article we publish.