 Ming Li
 Yongwang Cao
 Jianxin Song1
- 1Land Consolidation and Rehabilitation Center, MNR (Land Science and Technology Innovation Center, MNR), Beijing, China
- 2Institute of Economics, Guangzhou Academy of Social Sciences, Guangzhou, China
- 3School of Economics and Finance, South China University of Technology, Guangzhou, China
- 4Beijing Laboratory, National Gemstone Testing Center, Beijing, China
Introduction: Urban agglomerations (UAs) are core economic growth centres, and urban construction land is the main spatial carrier of economic growth. Urban expansion is a research hotspot, while previous studies have rarely compared the characters and determinants of urban expansion within and outside UAs.
Methods: Considering the case of China, based on the China Land Use/Cover Dataset (CLUD), this study use spatial statistics analysis and Theil index to compare the spatiotemporal characteristics of urban expansion within and outside UAs during 1990–2020. Economic models is used to detect difference of influencing factors of urban expansion within and outside UAs.
Results: As for spatiotemporal characteristics, urban expansion is mainly distributed within UAs, especially in UAs at high and upper-middle development levels. In 1991–2020, urban expansion within the UAs accounted for 77.58% of the total urban expansion, and urban expansion in UAs at high and upper-middle development levels accounted for 71.58% of urban expansion in UAs. The inequality of urban expansion between within and outside UAs decreases with fluctuation. The rate of urban expansion outside UAs gradually exceeded that within the UAs from 2011. As for driving factors, government factors have a stronger power to urban expansion than economic factors. Economic factors were more influential within UAs than outside agglomerations. Meanwhile, government forces played more important roles outside urban agglomerations than within agglomerations. The impact of economic factors increased with an upgrade of UA development level, whereas government factors’ impact on urban expansion decreased with upgrade of UA development level.
Discussion: The findings provide a scientific support for urban construction land management. The impact of territorial and spatial planning on urban expansion will be studied.
1 Introduction
When entering the late stage of industrialisation, urban agglomerations (UAs), as the most advanced land feature, have become important spatial clusters of regional economic development in the 21st century (Fang et al., 2015). UAs are generally composed of at least one mega city as the core and at least three large cities as constituent units. By relying on developed infrastructure networks, such as transportation and communication, these cities have formed urban clusters with compact spatial organisation and close economic connections, ultimately achieving high levels of integration, namely, UAs. UAs are the core economic growth pole in the future and also the main spatial platform to participate in international economic cooperation and competition. People are migrating to UAs (Cao et al., 2023) and the traditional provincial economy in China is gradually shifting towards UA economy (Lv and Wang, 2023). UAs, with strong economic gathering advantages, are leading high-quality development (Cao et al., 2024).
UAs are spatial clusters of highly concentrated production factors (Fang and Yu, 2017). Land resources, as an indispensable production factor, have a profound impact on economic development. Rapid urbanisation led to a rapid expansion of urban construction land (Zhang and Han, 2024). As the largest developing country, urbanisation rate of China increased from 10.64% in 1949 to 66.16% in 2023, resulting in a large-scale urban expansion in human history (Lu et al., 2019), especially after China’s reform and opening up in 1978. According to the Urban Construction Statistical Yearbook, urban construction land in China reached 43,743 km2 by the end of 2022, compared with only 6,720 km2 in 1981. UAs in China also experienced rapid development and become growth poles (Fang, 2019; Zhang et al., 2023).
Previous studies have analysed the spatial-temporal characters of urban expansion of UAs, such as the Central Plains UA (Wang et al., 2023), Yangtze River Delta UA (Chen and Deng, 2023) and Shandong Peninsula UA in China (Pan et al., 2023), and Raiganj in India (Basu et al., 2023). Most cities within UAs experienced rapid urban expansion. Urban sprawl in cities with lower economic levels in UAs is found to be more severe (Lv et al., 2024). There is an anisotropy toward expansion in the trajectory of urban expansion within urban expansion (Liu et al., 2024). The phenomenon that the rate of land urbanisation is faster than the rate of population urbanisation has also been found in Ethiopia (Talema and Nigusie, 2024) and India (Barman et al., 2024). As for influencing forces of urban expansion, government factors (Feng and Wang, 2022), economic factors (Chen and Deng, 2023), geographic factors (Yan et al., 2019) and others were comprehensively analysed. And this is systematic reviewed in Section 2.
In summary, previous studies on the urban expansion provide a rich theoretical and methodological foundation for the evolution of urban expansion and its influencing factors. UAs are the main spatial carrier of urbanisation (Fang, 2019). But most studies mainly focused on one city or a region, disregarding the differences of spatial-temporal characters and influencing factors within and outside UAs. Therefore, the contribution and aim of this study is to discover the differences of the spatiotemporal characteristics of evolution of urban expansion and the underlying mechanisms of influencing factors on urban expansion within and outside UAs. Taking China as a case study, the following contents are addressed: (1) Build a comprehensive conceptual model of urban expansion in mechanism China to lay a solid foundation for empirical research; (2) Explore spatiotemporal characteristics of urban expansion within and outside UAs by using land use data, the Theil index and spatial analysis method; (3) Uncover the difference of mechanisms driving urban expansion within and outside UAs and UA in different development levels through econometric methods. Because after establishment of socialist market economy in 1992, China entered a stage of rapid urbanization. The scale of urban construction land also grew fast (Schneider and Mertes, 2014, pp. 1978–2010). The study period is 1990–2020. The findings could provide references for the adjustment of urban construction land management policy for different regions.
2 Determinants of urban expansion in China
Some scholars are convinced that China’s urbanisation is influenced by the triple transformation process: economic globalisation, decentralisation and marketization (Gao et al., 2014). However, these aspects can be summarised as economic and government forces. A conceptual model of urban expansion in China is established based on economic development, government management and other influencing factors (Figure 1).
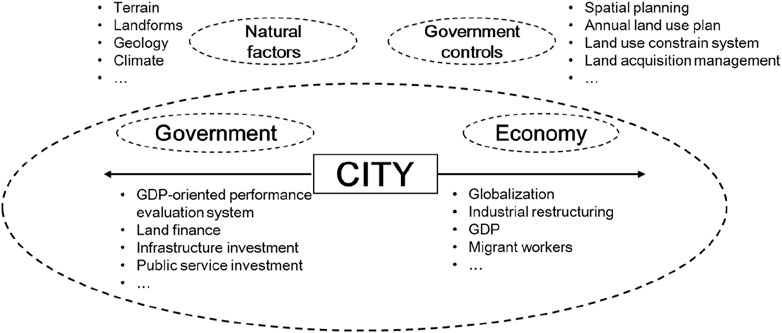
Figure 1. Conceptual model of urban expansion mechanism in China.
Globalisation and marketisation belong to economic forces. GDP growth stimulates urban expansion urban expansion through the rising demand for production, living and leisure spaces (Colsaet et al., 2018). Economic globalisation and socialist market economy led to rapid development of Chinese economy. Economic globalisation, especially foreign investment and export trade, enabled China to participate in global competition, which significantly increased the demand for urban construction land (Huang et al., 2015). Economic and technological development zones are important spatial clusters for foreign investment (He et al., 2014) and also an important form of urban expansion (Ding and Zhao, 2011). After the establishment of socialist market economic system, the flow of economic factors is no longer solely allocated by planned indicators. Capital allocation enables regions with initial comparative advantages to develop early. Industrialisation is the main driving force in the early urbanisation stage in China (Bai et al., 2014). The development of the secondary industry promotes the service industry, thereby attracting investment and talent. Without occupying a large amount of land resources, the service industry can also promote urban development and spatial transformation of cities (Lin, 2004). Population growth is one of the strongest factors explaining urban expansion worldwide (Colsaet et al., 2018). Population growth requires additional construction land for residence and public service facilities, thereby directly promoting urban expansion (Chen and Deng, 2023). With the relaxation of household registration, people are allowed to migrate freely according to job opportunities, payment and public services, amongst others (Liu et al., 2016). Therefore, population migration can be considered market-oriented behavior. During 1990–2010, about 359 million people migrated from rural to cities and towns in China (Li et al., 2018), resulting in rapid urban expansion. However, population growth is found to be uncorrelated with urban expansion in parts of developing western China (Li et al., 2019), and this phenomenon also occurs in Switzerland (Weilenmann et al., 2017).
Decentralisation belongs to government forces. The decentralisation of the Chinese political system is an important factor affecting urban expansion (Qun et al., 2015). GDP-oriented performance evaluation system leads local governments to attract enterprises with low-priced industrial land (Xu et al., 2016). Local fiscal revenue mainly relies on land transfer fees, leading local governments to continuously sell commercial, residential and other operational land to maintain government expenditure, which will be used in infrastructure renewal and construction. Infrastructure is part of urban expansion, as it consumes space (Shin et al., 2009). Transportation infrastructure can favor urban expansion. As transport facilities expand, remote locations become accessible (Schneider and Mertes, 2014). This situation can likewise promote the price of land leasing (Liu et al., 2005). For example, in 2004, the State Council of China approved the Long Term Railway Network Plan, and started to construct high-speed rail networks. The rate of urban expansion was found to be higher in areas surrounding high-speed rail stations than in other cities of the Yangtze River Delta UA. Moreover, the center of urban land of 75% cities was found to deviate towards the high-speed rail station (Wang et al., 2019). Besides, the government controls urban expansion by spatial planning, annual land use plan, land use constrain system and land acquisition management (Kuang et al., 2016).
Interactive relationships also exist between economic development and government management factors. GDP-oriented performance evaluation system makes local governments provide various preferential policies to attract enterprises and talents, which can promote local economic development (Li and Xiong, 2019). The government’s investment in public services will also attract talents (Zhou et al., 2021). The development of industries can increase tax revenues, and then provide additional fiscal expenditures. Additionally, economic development attracts talents by plentiful job opportunities and high payments. Agglomeration of population can also provide additional labour for industries, expand consumer demand and increase tax revenue.
Other factors, such as natural topography and geological conditions, often restrict urban expansion (Xu and Min, 2013). The path effect is also an important influencing factor of urban expansion (Li et al., 2013). Although these factors do not play a driving role in urban expansion, they can still explain the urban expansion phenomenon. These factors also need to be considered in the empirical model.
3 Materials and methods
3.1 Study area
A total of 19 UAs were selected according to the 13th Five-Year Plan (2016–2020) (Table 1; Figure 2) (Zhou et al., 2021). The boundaries of these UAs were defined according to their master plans. Prefecture-level cities are under the jurisdiction of provincial-level administrative regions and have jurisdiction over county-level administrative regions. Prefecture-level cities are usually the basic unit of implementation of many policies in China (Cao et al., 2023). Thus, this study analysed urban expansion at the prefecture-level city scale.
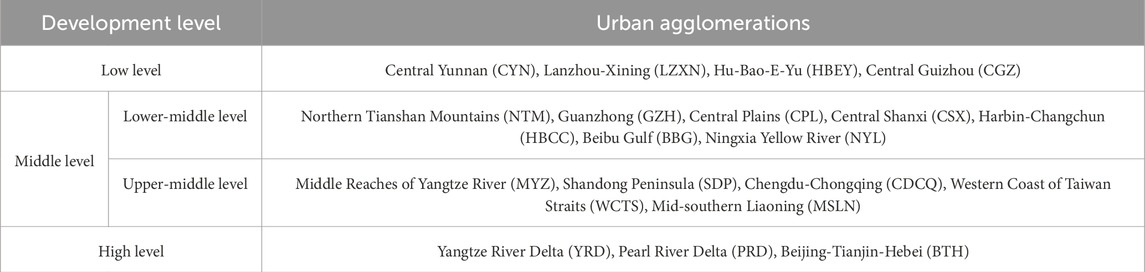
Table 1. Development level of UAs in China.
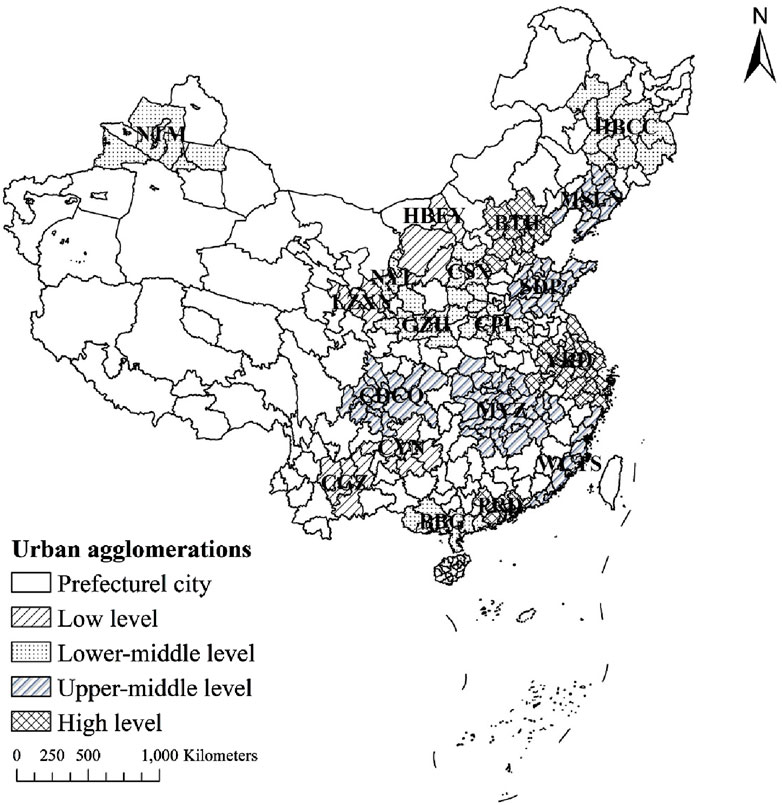
Figure 2. The study area and urban agglomerations.
Since 2006, China has identified UAs as the main spatial carrier for new type of urbanisation. National-level major infrastructure, such as high speed railway, is constructed in UAs firstly. During 1980 to 2016, the population and GDP in UAs continued to increase. The proportion of population within UAs in study area increased from 50.07% to 75.19%; that of urban population increased from 58.38% to 72%; that of workforce increased from 43.37% to 67.32%; that of GDP increased from 70.42% to 80.05%; that of fixed assets investment increased from 58.93% to 82.37%; that of utilized foreign capital increased from 47.62% to 91.23%; that of fiscal revenue increased from 79.14% to 91.19%; that of deposit in financial institutions increased from 58.76% to 83.59% (Fang, 2019). In 2020, the GDP of 19 UAs accounted for 85.13% of China’s GDP. The proportion of permanent population and registered population of UAs accounted for 75.89% and 71.55% of China’s total population (Cao et al., 2023). Various social and economic indicators in UAs are steadily improving, and the agglomeration effect is becoming stronger. UAs have become the strategic core area of national economic development in China (Zhang et al., 2023).
3.2 Data sources
Urban expansion data were extracted from the China Land Use/Cover Dataset (CLUD), which were likewise provided by the Resource and Environment Data Centre (REDC, http://www.resdc.cn/). The late 1980s (’1990’), 1995, 2000, 2005, 2010, 2015 and 2020 were selected. The CLUD dataset was produced by human–machine interactive interpretation of remote sensing images (Cui et al., 2024). The overall accuracy of the CLUD is over 90% (Li et al., 2019). In this study, urban centres and other types of built-up land, such as mining land, large factories and large transportation infrastructure located in suburbs, were classified as urban areas.
Socio-economic data were extracted from the China City Statistical Yearbook and China Statistical Yearbook for Regional Economy, and previous socioeconomic data were adjusted to the administrative division in 2020.
Administrative boundaries were also provided by the REDC and adjusted to 2020. Hong Kong, Macao and Taiwan were excluded from this study owing to lack of data.
3.3 Development level of UAs
The development levels of UAs were identified according to the index of development degree for UAs (IDDUA) (Zhang et al., 2018). IDDUA consists of 14 sub-indexes, covering economic development, city size, infrastructure conditions, urbanisation level and industrial superiority, amongst others (Zhou et al., 2021).
The development levels of UAs were grouped into four grades: high, upper-middle, lower-middle and low levels (Table 1). UAs at the high level include the Yangtze River Delta, Pearl River Delta and Beijing–Tianjin–Hebei UAs (Table 1). These UAs are mainly located in eastern coastal regions, with a total area of 4.49 × 10⁵ km2, accounting for only 4.47% of the research area and 15.04% of all UAs. UAs at the upper-middle level, with a total area of 9.42 × 10⁵ km2, account for only 9.96% of the research area and 31.57% of all UAs. UAs at the lower-middle level, with a total area of 1.08 × 10⁶ km2, account for 11.43% of the research area and 36.21% of all UAs. Lastly, UAs at the low development level, with a total area of 5.13 × 10⁵ km2 and mainly located in the inland midwest region, account for only 5.42% of the research area and 17.18% of all UAs.
3.4 Theil index
This study calculated the Theil indices to measure the inequality of urban expansion within and outside UAs. The value range of the Theil index is between 0 and 1. The closer the Theil index is to 1, the more unequal the distribution of urban expansion. The Theil index measures total, within-group and between-group inequalities (Zhou et al., 2024). Total inequality can be divided into inter- and intra-group inequalities. Thus, the total Theil index can be divided into inter- and between-group Theil indices:
where T is the overall Theil index, n is the total number of prefecture and upper-level cities, Pi is the scale of urban expansion of i city, P is the total urban expansion, TBG is the between-group Theil index, TWG is the within-group Theil index, Pw and Po are the scale of urban expansion within and outside UAs, respectively, and Nw and No are the number of prefecture and upper-level cities within and outside UAs, respectively.
3.5 Empirical models and variable specification
Urban expansion scale was selected as the dependent variable. To compare the coefficients of independent variables at different periods, the logarithm values of the independent and dependent variables were placed in the empirical models owing to the inconsistent measurement units of variables. The ordinary least squares (OLS) method is used to estimate coefficients.
Independent variables (Table 2) are selected according to the conceptual model of urban expansion in China (Figure 1). For the driving factors, in terms of economic development and globalisation, foreign investment (FC) was selected to represent the driving force of globalization (Chen et al., 2016). Given that FC is a cumulative process for urban expansion, and the cumulative investment amount during a period was used in this study. Value added of secondary industry (SND) (Wanfu et al., 2019) and value added of tertiary industry (TRY) (Colsaet et al., 2018) are economic development factors. Given that the dependent variable is urban expansion of a certain period, the change of value added of industries during a certain period was selected. Urban resident population (UPOP) (Li and Xiong, 2019) was selected, and the increment over a certain period was used. For government management, public fiscal expenditure (PFX) (Huang et al., 2015) and area of paved roads in cities (ROD) (Li et al., 2015) were adopted. PFX is often invested in infrastructure construction and the maintenance and improvement of public services (Li et al., 2019) to enhance the attractiveness of local industries and talents. Moreover, PFX can reflect competition amongst local governments. Given that the implementation of many government policies is shorter compared with such a long time series, factors of government policies were not considered. Owing to the late emergence of high-speed railways, intercity railways and airports in China, such transportation infrastructure were not selected as driving factors in econometric models in long-term studies from 1991 to 2020.
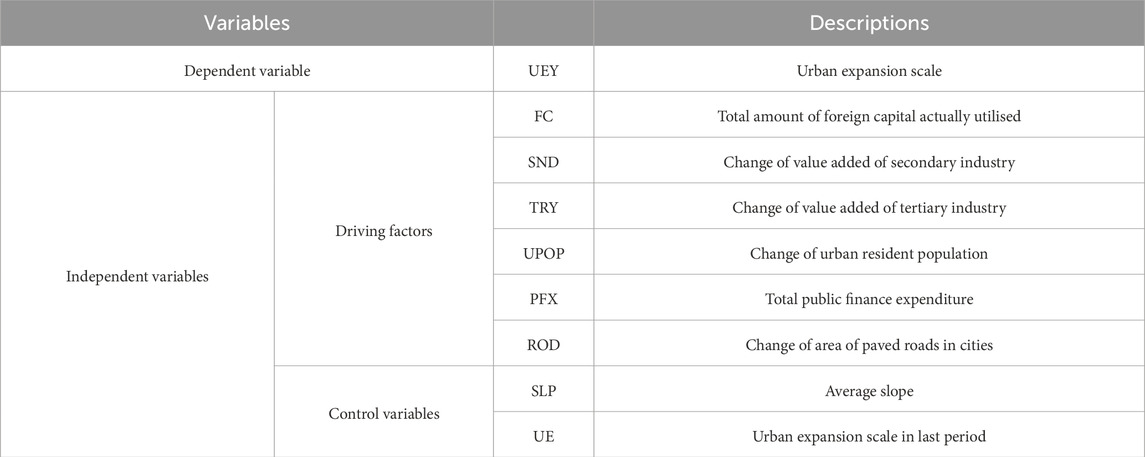
Table 2. Description of considered variables.
Natural factors and path dependent effects were selected as control variables. Natural factors selected the average slope (SLP) of the region (Li et al., 2018). The scale of urban expansion during last period (UE) was selected to represent the path dependence effect. The equation is defined as follows:
where UEY is the dependent variable;
Owing to adjustments of statistical indicators and administrative divisions, 224 prefecture and upper-level cities were selected to explore the determinants of urban expansion from 1991 to 2020. However, the urban expansion of these cities accounts for 77.28% of the total urban expansion. Thus, this empirical model can reveal the factors of urban expansion in China.
4 Spatiotemporal characteristics of urban expansion in China from the UA perspective
Urban expansion in China during 1991–2020 is depicted in Figure 3. Beijing-Tianjin-Hebei (BTH), Yangtze River Delta (YRD) and Pearl River Delta (PRD) UA are at high development level and the most developed region in Chia. Therefore, they are displayed individually. The area of 19 UAs is 2.99 × 10⁶ km2, accounting for only 31.55% of the study area. However, urban expansion in China is mainly distributed within UAs.
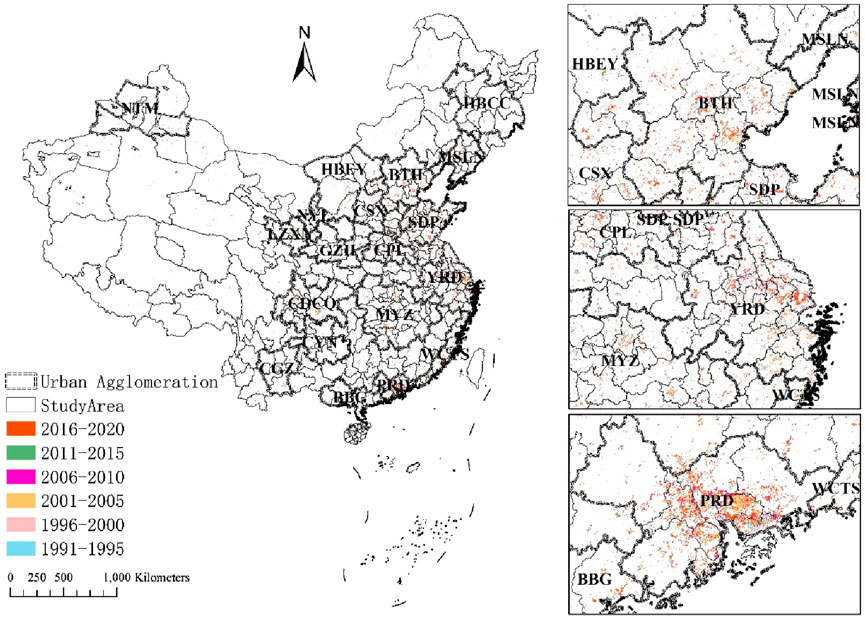
Figure 3. Urban expansion in China during 1991–2020.
4.1 Urban expansion is mainly distributed within UAs
China experienced massive urban expansion during rapid urbanisation era like other developing city, such as Kirkuk, Iraq (36.6% increase) (Jasim, 2025) and in Khulna, Bangladesh (over 100% increase) (Siddika and Sresto, 2025). However, the rate of urban expansion within UAs is higher than that of outside UAs (Table 3). From 1991 to 2020, urban expansion within UAs reached 70,006 km2, accounting for 77.58% of the total urban expansion. Urban expansion outside UAs reached 20,228 km2, accounting for only 22.48% of the total urban expansion. From 1991 to 2020, the average annual average urban expansion rate within UAs was 4.70%, higher than that outside UAs (4.47%). However, from 2011 to 2020, the average annual average urban expansion rate within UAs lagged behind that outside UAs.
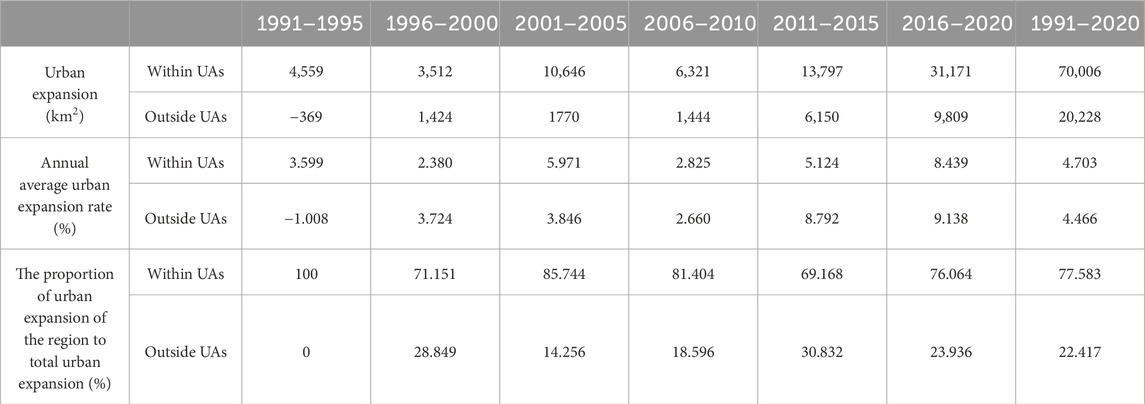
Table 3. Urban expansion within and outside UAs during 1991–2020.
4.2 Inequality of urban expansion between within and outside UAs keeps decreasing
The inequality of urban expansion between within and outside UAs shows a fluctuating decrease. Although there were fluctuations, the proportion of urban expansion outside UAs was 14.26% in 2001–2005 and increased to 23.94% in 2016–2020 (Table 3). The contribution rate of the between-group Theil index for the overall Theil index of urban expansion also shows a fluctuating decrease. The contribution rate decreased from 13.18% in 1991–1995 to 11.98% in 2016–2020 (Table 4).
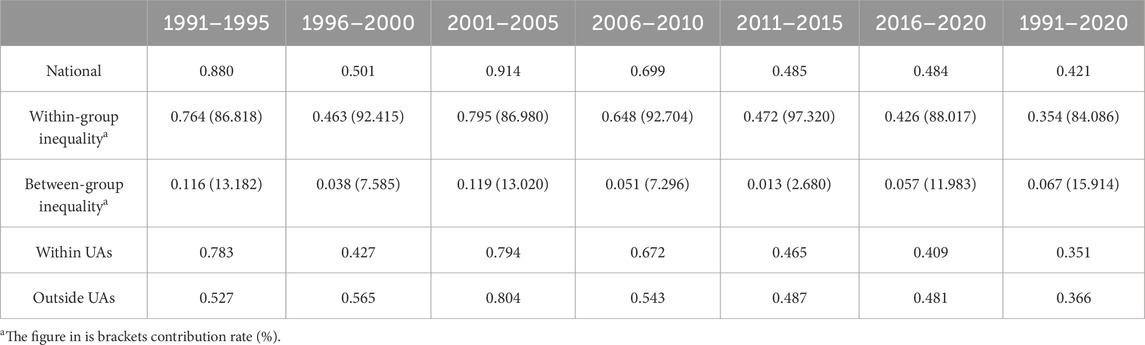
Table 4. The Theil index of urban expansion within and outside UAs during 1991–2020.
4.3 Urban expansion is mainly distributed in UAs at high and upper-middle development levels
Overall, the urban expansion scale increased with an upgrade of the UA development level. In 1991–2020, urban expansion in UAs at the high development level was 2.48 × 10⁴ km2 and that at the upper-middle level was 2.50 × 10⁴ km2, accounting for 35.68% and 35.90%, respectively, of all urban expansions in UAs. Meanwhile, urban expansion in UAs at the lower-middle level development level was 1.40 × 10⁴ km2 and that at the low level was 5,816 km2, accounting for 20.06% and 8.36%, respectively, of all urban expansions in UAs (Table 5).
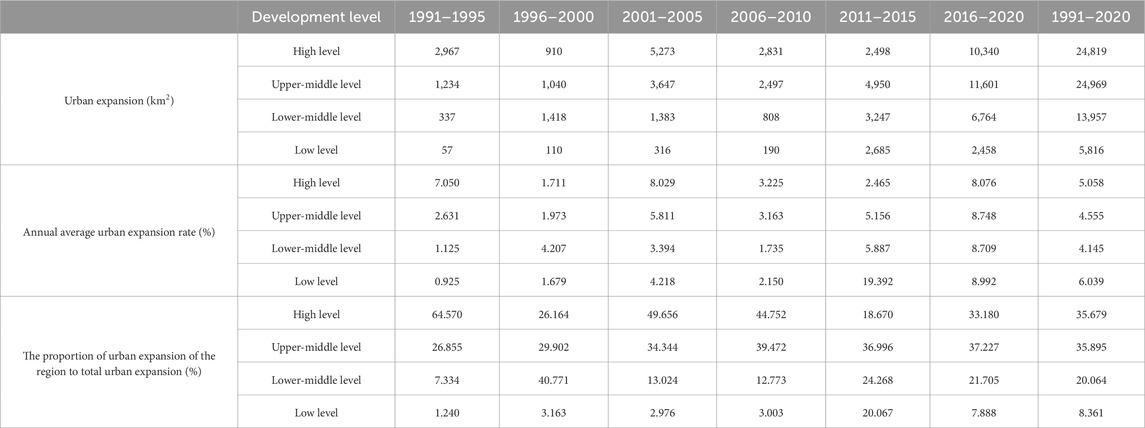
Table 5. Urban expansion in UA at different development level during 1991–2020.
The urban expansion rate increased with an upgrade of the UA development level. In 1991–2020, the urban expansion rate of UAs at the high development level was 5.06% and that at the upper- and lower-middle levels were 4.56% and 4.15%, respectively (Table 5).
5 Modelling determinants of urban expansion in China
In the pooled model, tolerance values of all variables were above 0.1, and variance inflation factors (VIFs) were below 10, indicating that the independent variables were not collinear (Table 6). All variables have a significant impact on urban expansion.

Table 6. Estimation results of econometric models.
5.1 Models within and outside UAs
Overall, government factors have a stronger power to urban expansion than economic factors. Economic factors were more influential within UAs than outside agglomerations. By contrast, government forces played more important roles outside UAs than within agglomerations. The adjusted R2 of the ‘economy’ model is higher than that of the ‘government’ model within and outside UAs (0.355 > 0.237, 0.364 > 0.304, Table 6). This result indicates that the explanatory power of the government factor model is stronger than that of the economic factors within and outside UAs.
FC did not significantly influence urban expansion outside UAs, but it had a significant impact on urban expansion within UAs (0.025, 0.146***). The impact of SND and TRY on urban expansion within UAs is greater than that outside of UAs (0.049*** > 0.036**, 0.060** > 0.041*). The impact of UPOP on urban expansion outside UAs is greater than that within UAs (0.101** > 0.023*). PFX and ROD have a more substantial impact on urban expansion outside UAs than that within UAs (0.460*** > 0.388***, 0.082** > 0.066**). SLP and UE are negatively correlated with urban expansion (Table 6).
5.2 Models with different development levels
Overall, the impact of economic factors on urban expansion increased with an upgrade of the UA development level, whereas social and government factors’ impact on urban expansion decreased with an upgrade of the UA development level.
The influence of FC increased with an upgrade of the UA development level. However, the impact of FC on the urban expansion of high-level UAs is smaller than that of upper-middle -level UAs (0.197*** < 0.126**). The impact of SND and TRY on urban expansion increased with an upgrade of the UA development level. However, the impact of UPOP, PFX and ROD on urban expansion increased with a decrease in the UA development level. Given that economic development level decreases with a decrease in urban development level, the capability of government regulatory increases with a decrease in urban development level. Overall, SLP and UE were negatively correlated with urban expansion (Table 6).
6 Discussion
6.1 Spatiotemporal characteristics of urban expansion from the perpective of UAs
In general, the rate of urban expansion within UAs is higher than that of outside UAs (Table 3). However, during 2011–2020, the expansion rate outside UAs exceed that within UAs, mainly owing to a series of regional balanced development strategies, such as the Western Development Strategy and Central Rise Strategy (Fang et al., 2016). The global economic crisis triggered by the United States subprime mortgage crisis also led to a slowdown in economic development in UAs, which are high external dependence (Ning et al., 2018), resulting in a slowdown in economic growth rate of cities within UAs. This also led to the decrease of the inequality of urban expansion between within and outside UAs (Table 4).
6.2 Determinants of urban expasion from the perpective of UAs
6.2.1 Comparison within and outside UAs
Economic factors are more influential within UAs and government forces play more important roles outside UAs.
FC is more influential within UAs (Table 6). From the national perspective, FC is mainly concentrated in the eastern China. From an urban–rural perspective, FC is mainly concentrated in urban areas. From the city perspective, various new towns and economic and technological development zones have become the main spatial clusters for FC in Chinese cities (Huang et al., 2017). For example, the China–Singapore Industrial Park in Suzhou and the China Singapore Knowledge City in Guangzhou are new towns jointly established by China and Singapore. China’s economic and technological development zones began to emerge in the 1980s, mainly distributed in coastal open cities. With China’s market-oriented economy gradually opening to the world, additional types of industries have entered the country, such as finance, productive services, research and development and consulting. Central business district (CBD) and bonded areas became new spatial clusters for FC, continuously stimulating urban expansion. These high-level economic and technological development zones, CBDs and bonded areas are mostly located in economic developed cities, which are usually located in UAs. Therefore, the impact of FC on urban expansion within UAs is greater than that outside of UAs.
SND and TRY are more influential within UAs (Table 6). SND requires a large amount of industrial land, leading to rapid urban expansion. In the early stage of industrialisation, traditional SND drives urban economic development and urban expansion. This situation is the main driving force for the early rapid economic development of many core cities of UAs, such as Shenyang, Wuhan, Tianjin, Changchun and Ha’erbin. In the later stage of industrialisation, the proportion of added value of TRY to GDP increases, and TRY gradually grows as the main driving force of urban development. However, TRY requires a solid foundation of economic growth. Therefore, TRY is mainly concentrated in developed UAs. A similar phenomenon is found in the Yangtze River Delta UA. Moderate and severe urban sprawl cities were mostly located in relatively underdeveloped western regions (Lv et al., 2024), indicating that economic development the driving force of economic development on urban expansion is relatively weak in developing regions.
The impact of UPOP was found to be greater outside UAs (Table 6). The scale of urban construction land in China is managed by quota based on UPOP size (Kuang, 2020). According to Code for classification of urban land use and planning standards of development land (GB 50137 -2011), the upper limit of per capita urban construction land in remote areas, ethnic minority cities, some mountainous cities, less-populated industrial and mining cities and scenic tourism cities, which are often located outside of UAs, is 150.0 m2, which is significantly higher than that of other types of cities. Moreover, the larger the planned population size of a city, the smaller the scale of urban expansion is allowed. The population sizes of cities within UAs are usually larger than those of cities outside the agglomerations (Zhou et al., 2021). Therefore, cities outside UAs usually have more urban expansion quota according to the growth UPOP. On the contrary, in some European developed countries, urban land grows even without population growth, such as Switzerland (Weilenmann et al., 2017), the eastern part of Germany (Nuissl and Rink, 2005), and the south of France (Olivier et al., 2014), which is urban sprawl. While in China, per capita urban construction land, as a control indicator, is used to avoid urban sprawl in developed region.
The impact of PFX on urban expansion outside urban agglomerations is greater than that within urban agglomerations (Table 6). PFX is generally used for infrastructure construction or improve public services. On the one hand, infrastructure construction directly stimulates urban construction. On the other hand, improvement of public services can attract migrant population, which indirectly stimulates urban expansion. Previous studies have found that PFX significantly promotes urban expansion in the northwest and northeast regions with lower levels of economic development and marketisation, whereas its impact in the southeast region with higher levels of economic development and marketisation is smaller (Wu et al., 2021). Moreover, the economic development level of cities within urban agglomerations is generally higher than that of cities outside urban agglomerations. Therefore, the impact of PFX on urban expansion outside urban agglomerations is greater.
ROD has a more substantial impact outside UAs (Table 6). Previous studies also found that ROD has a significant impact on urban expansion in north and western China but is negatively correlated in the southeastern coastal areas (Li et al., 2019). ROD improves accessibility (Li et al., 2015), which may lead to resource aggregation and resource diffusion in developing and developed regions, respectively.
SLP is negatively correlated with urban expansion, which is consistent with previous research findings (Li et al., 2018). UE is negatively correlated with urban expansion, which indicates the effective implement of balanced regional development policy. Studies in western countries found that historically dense cities tend to sprawl less, such as in Bulgaria (Slaev and Nikiforov, 2013) and United States (Paulsen, 2014). Differences of the results reflects the management of the Chinese government in city development.
6.2.2 Comparison of urban agglomerations with different development levels
Overall, the impact of economic factors increased with an upgrade of the UA development level, whereas social and government factors’ impact decreased. However, the impact of FC on the urban expansion of high-level UAs is smaller than that of upper-middle -level UAs (Table 6). Foreign investment in China was initially concentrated in labour-intensive industries (Zhou et al., 2021), and land use efficiency of these industries is relatively low. With economic development, labour cost in high-level UAs gradually increased. Therefore, foreign companies in labour-intensive industries move away from high-level UAs, whereas knowledge-intensive foreign companies stay in high-level UAs. The reason is that the latter relies on the quality rather than the quantity of labour forces. Moreover, land use efficiency of knowledge-intensive industries is high. Thus, FC’s impact on the urban expansion of UAs at upper-middle level is stronger than that of UAs at high level.
6.3 Policy implications, limitations and future work
This study’s findings point to policy implications for urban construction land management. Firstly, urban expansion is mainly distributed within UAs, especially in UAs at the high and upper-middle development levels. Therefore, these cities are key targets of urban construction land management. Secondly, differentiated management policies should be made within and outside UAs, and in UAs at different development levels. Economic factors were more influential within UAs than outside agglomerations, while government factors have a stronger power to urban expansion than economic factors. As for cities within high development level UAs or core cities, taking resource and environmental carrying capacity into consideration, the scale of urban construction land needs to be limited. Industries with high land use efficiency can be retained or introduced, while industries with high land use efficiency should transfer. As for cities outside UAs or within low development level UAs, the indicators for urban construction land can be appropriately increased. Preferential policies for population attraction and industry introduction should be made simultaneously to avoid urban sprawl.
There are some limitations to this study. Firstly, considering the limitations of accessibility and methods, some factors, which are driving factors but not influencing factors, were not included in the econometric model, such as urban planning, newly added urban construction land indicators and neighboring effects. Secondly, the development level of UAs may change during 1990–2020. In study, the development level of UAs in China was divided according to statistical data in 2020. A comprehensive study of evolution of UAs development in China is necessary.
After the establishment of the new national territorial and spatial planning system in 2020 in China, the quantity and location of urban expansion are strictly controlled according to territorial and spatial planning. Most urban construction land can only be distributed within urban growth boundaries. Therefore, future small-scale study can explore the impact of territorial and spatial planning on urban expansion. Moreover, as economic growth slows down after the COVID-19 epidemic, the scale of land transfer also decreases. Urban expansion rate in China slows down. Urban development shift from scale growth to quality improvement. Land use efficiency will become the research hotspot.
7 Conclusion
UAs are important organizational forms for countries to participate in global competition, and urban construction land is main spatial carrier. In China, UAs are the core economic growth centres, and rapid urbanisation led to rapid urban expansion. The contribution of this study is the comparison of spatiotemporal characteristics and determinants of urban expansion within and outside UAs during the period of rapid urbanization in China.
Using CLUD dataset and social-economic data, this research to compare the spatiotemporal characteristics of urban expansion and the determinants of urban expansion in China in 1991–2020 to conduct a systematic analysis from the perspective of UAs. The main findings are as follows: (1) Urban expansion is mainly distributed within UAs, especially in UAs at the high and upper-middle development levels. During 1991–2020, the annual rate of urban expansion within UAs (4.70%) is higher than that of outside UAs (4.47%). Urban expansion within UAs accounted for 77.58% of the total urban expansion. The higher the development level of UAs, the larger the scale of urban expansion in them. During 1991–2020, urban expansion in UAs at the high and upper-middle development levels accounted for 71.58% of urban expansion in UAs. (2) Theil index was used to indicate the inequality of urban expansion scale. The inequality between within and outside UAs decreases owing to the implementation of a series of regional balanced development strategies during the study period. The proportion of urban expansion outside UAs was 14.26% in 2001–2005, and it increased to 23.94% in 2016–2020. The rate of urban expansion outside UAs gradually exceeded that within UA from 2011. (3) Economic and government factors all have influence on urban expansion. Government factors have a stronger impact on urban expansion than economic factors. Economic factors were more influential within UAs than with outside agglomerations. By contrast, government forces played more important roles outside UAs than within agglomerations. The impact of economic factors on urban expansion increased with an upgrade of the UA development level, whereas government factors’ impact on urban expansion decreased with an upgrade of the UA development level. The findings provide a scientific support for urban construction land management, regulation of UA development and promoting high quality development.
Data availability statement
The original contributions presented in the study are included in the article/Supplementary Material, further inquiries can be directed to the corresponding author.
Author contributions
MiL: Writing–original draft, Writing–review and editing. YC: Funding acquisition, Writing–original draft, Writing–review and editing. JS: Formal Analysis, Funding acquisition, Validation, Writing–review and editing. HL: Writing–review and editing. MeL: Conceptualization, Formal Analysis, Funding acquisition, Validation, Writing–review and editing.
Funding
The author(s) declare that financial support was received for the research, authorship, and/or publication of this article. This research was funded by the Youth Project Fund of Guangzhou Academy of Social Sciences (24QN004), National Key Research and Development Program of China (2023YFC3007105 and 2022YFC3802805).
Conflict of interest
The authors declare that the research was conducted in the absence of any commercial or financial relationships that could be construed as a potential conflict of interest.
Generative AI statement
The author(s) declare that no Generative AI was used in the creation of this manuscript.
Publisher’s note
All claims expressed in this article are solely those of the authors and do not necessarily represent those of their affiliated organizations, or those of the publisher, the editors and the reviewers. Any product that may be evaluated in this article, or claim that may be made by its manufacturer, is not guaranteed or endorsed by the publisher.
References
Bai, X., Shi, P., and Liu, Y. (2014). Society: realizing China’s urban dream. Nature 509, 158–160. doi:10.1038/509158a
Barman, S., Roy, D., Chandra Sarkar, B., Almohamad, H., and Abdo, H. G. (2024). Assessment of urban growth in relation to urban sprawl using landscape metrics and Shannon’s entropy model in Jalpaiguri urban agglomeration, West Bengal, India. Geocarto Int. 39, 2306258. doi:10.1080/10106049.2024.2306258
Basu, T., Das, A., and Pereira, P. (2023). Exploring the drivers of urban expansion in a medium-class urban agglomeration in India using the remote sensing techniques and geographically weighted models. Geogr. Sustain. 4, 150–160. doi:10.1016/j.geosus.2023.03.002
Cao, Y., Liu, S., and Yang, Z. (2024). Identifying the spatial range of the Pearl River Delta urban agglomeration by fusing nighttime light data with weibo sign-in data. IJGI 13, 214. doi:10.3390/ijgi13060214
Cao, Y., Zhang, R., Zhang, D., and Zhou, C. (2023). Urban agglomerations in China: characteristics and influencing factors of population agglomeration. Chin. Geogr. Sci. 33, 719–735. doi:10.1007/s11769-023-1368-7
Chen, J., Gao, J., and Chen, W. (2016). Urban land expansion and the transitional mechanisms in Nanjing, China. Habitat Int. 53, 274–283. doi:10.1016/j.habitatint.2015.11.040
Chen, Y., and Deng, A. (2023). Evolution and influencing factors of urban built-up areas in the Yangtze River Delta urban agglomeration. IEEE Access 11, 133413–133427. doi:10.1109/ACCESS.2023.3336735
Colsaet, A., Laurans, Y., and Levrel, H. (2018). What drives land take and urban land expansion? A systematic review. Land Use Policy 79, 339–349. doi:10.1016/j.landusepol.2018.08.017
Cui, H., Chai, L., Li, H., Zhao, S., Li, X., and Liu, S. (2024). A spatiotemporal enhanced SMAP freeze/thaw product (1980–2020) over China and its preliminary analyses. Remote Sens. 16, 950. doi:10.3390/rs16060950
Ding, C., and Zhao, X. (2011). Assessment of urban spatial-growth patterns in China during rapid urbanization. Chin. Econ. 44, 46–71. doi:10.2753/CES1097-1475440104
Fang, C. (2019). The basic law of the formation and expansion in urban agglomerations. J. Geogr. Sci. 29, 1699–1712. doi:10.1007/s11442-019-1686-y
Fang, C., Ma, H., and Wang, J. (2015). A regional categorization for “new-type urbanization” in China. PLoS ONE 10, e0134253. doi:10.1371/journal.pone.0134253
Fang, C., and Yu, D. (2017). Urban agglomeration: an evolving concept of an emerging phenomenon. Landsc. Urban Plan. 162, 126–136. doi:10.1016/j.landurbplan.2017.02.014
Fang, L., Huimin, Y., Jiyuan, L., Xiangming, X., and Yuanwei, Q. (2016). Spatial pattern of land use intensity in China in 2000. Acta Geogr. Sin. 71, 1130–1143. doi:10.11821/dlxb201607004
Feng, R., and Wang, K. (2022). The direct and lag effects of administrative division adjustment on urban expansion patterns in Chinese mega-urban agglomerations. Land Use Policy 112, 105805. doi:10.1016/j.landusepol.2021.105805
Gao, J., Wei, Y. D., Chen, W., and Chen, J. (2014). Economic transition and urban land expansion in Provincial China. Habitat Int. 44, 461–473. doi:10.1016/j.habitatint.2014.09.002
He, C., Huang, Z., and Wang, R. (2014). Land use change and economic growth in urban China: a structural equation analysis. Urban Stud. 51, 2880–2898. doi:10.1177/0042098013513649
Huang, Z., He, C., and Zhu, S. (2017). Do China’s economic development zones improve land use efficiency? The effects of selection, factor accumulation and agglomeration. Landsc. Urban Plan. 162, 145–156. doi:10.1016/j.landurbplan.2017.02.008
Huang, Z., Wei, Y. D., He, C., and Li, H. (2015). Urban land expansion under economic transition in China: a multi-level modeling analysis. Habitat Int. 47, 69–82. doi:10.1016/j.habitatint.2015.01.007
Jasim, A. (2025). Assessing LULC dynamics in Kirkuk City Iraq using Landsat imagery and maximum likelihood classification. DYSONA Appl. Sci. 6. doi:10.30493/das.2024.478315
Kuang, W. (2020). 70 years of urban expansion across China: trajectory, pattern, and national policies. Sci. Bull. 65, 1970–1974. doi:10.1016/j.scib.2020.07.005
Kuang, W., Liu, J., Dong, J., Chi, W., and Zhang, C. (2016). The rapid and massive urban and industrial land expansions in China between 1990 and 2010: a CLUD-based analysis of their trajectories, patterns, and drivers. Landsc. Urban Plan. 145, 21–33. doi:10.1016/j.landurbplan.2015.10.001
Li, G., Sun, S., and Fang, C. (2018). The varying driving forces of urban expansion in China: insights from a spatial-temporal analysis. Landsc. Urban Plan. 174, 63–77. doi:10.1016/j.landurbplan.2018.03.004
Li, H., Wei, Y. D., Liao, F. H., and Huang, Z. (2015). Administrative hierarchy and urban land expansion in transitional China. Appl. Geogr. 56, 177–186. doi:10.1016/j.apgeog.2014.11.029
Li, M., Zhang, G., Liu, Y., Cao, Y., and Zhou, C. (2019). Determinants of urban expansion and spatial heterogeneity in China. IJERPH 16, 3706. doi:10.3390/ijerph16193706
Li, X., Zhou, W., and Ouyang, Z. (2013). Forty years of urban expansion in Beijing: what is the relative importance of physical, socioeconomic, and neighborhood factors? Appl. Geogr. 38, 1–10. doi:10.1016/j.apgeog.2012.11.004
Li, Y., and Xiong, W. (2019). A spatial panel data analysis of China’s urban land expansion, 2004–2014. Pap. Regional Sci. 98, 393–408. doi:10.1111/pirs.12340
Lin, G. C. S. (2004). Toward a post-socialist city? Economic tertiarization and urban reformation in the Guangzhou metropolis, China. Eurasian Geogr. Econ. 45, 18–44. doi:10.2747/1538-7216.45.1.18
Liu, F., Zhang, Z., Shi, L., Zhao, X., Xu, J., Yi, L., et al. (2016). Urban expansion in China and its spatial-temporal differences over the past four decades. J. Geogr. Sci. 26, 1477–1496. doi:10.1007/s11442-016-1339-3
Liu, J., Zhan, J., and Deng, X. (2005). Spatio-temporal patterns and driving forces of urban land expansion in China during the economic reform era. AMBIO A J. Hum. Environ. 34, 450–455. doi:10.1579/0044-7447-34.6.450
Liu, X., Li, Y., Zhang, S., and Niu, Q. (2024). Spatiotemporal patterns, driving mechanism, and multi-scenario simulation of urban expansion in Min Delta Region, China. Ecol. Indic. 158, 111312. doi:10.1016/j.ecolind.2023.111312
Lu, L., Guo, H., Corbane, C., and Li, Q. (2019). Urban sprawl in provincial capital cities in China: evidence from multi-temporal urban land products using Landsat data. Sci. Bull. 64, 955–957. doi:10.1016/j.scib.2019.04.036
Lv, T., Hu, H., Han, H., Zhang, X., Fan, H., and Yan, K. (2024). Towards sustainability: the spatiotemporal patterns and influence mechanism of urban sprawl intensity in the Yangtze River Delta urban agglomeration. Habitat Int. 148, 103089. doi:10.1016/j.habitatint.2024.103089
Lv, X., and Wang, L. (2023). Green urbanization efficiency of 18 urban agglomerations in China: evidence from spatial–temporal evolution. Front. Earth Sci. 10. doi:10.3389/feart.2022.1121333
Ning, J., Liu, J., Kuang, W., Xu, X., Zhang, S., Yan, C., et al. (2018). Spatiotemporal patterns and characteristics of land-use change in China during 2010–2015. J. Geogr. Sci. 28, 547–562. doi:10.1007/s11442-018-1490-0
Nuissl, H., and Rink, D. (2005). The ‘production’ of urban sprawl in eastern Germany as a phenomenon of post-socialist transformation. Cities 22, 123–134. doi:10.1016/j.cities.2005.01.002
Olivier, C., Laurence, D., and Claude, N. (2014). Determinants of local public policies for farmland preservation and urban expansion: a French illustration. Land Econ. 90, 411–433. doi:10.3368/le.90.3.411
Pan, F., Sun, Y., Jiang, N., Jian, Z., Mei, Y., and Liu, Q. (2023). Analysis of the coordination of built-up area expansion and population growth in the Shandong Peninsula urban agglomeration. Sustainability 15, 7763. doi:10.3390/su15107763
Paulsen, K. (2014). Geography, policy or market? New evidence on the measurement and causes of sprawl (and infill) in US metropolitan regions. Urban Stud. 51, 2629–2645. doi:10.1177/0042098013512874
Qun, W., Yongle, L., and Siqi, Y. (2015). The incentives of China’s urban land finance. Land Use Policy 42, 432–442. doi:10.1016/j.landusepol.2014.08.015
Schneider, A., and Mertes, C. M. (2014). Expansion and growth in Chinese cities,1978–2010. Environ. Res. Lett. 9, 024008. doi:10.1088/1748-9326/9/2/024008
Shin, Y. E., Vuchic, V. R., and Bruun, E. C. (2009). Land consumption impacts of a transportation system on a city: an analysis. Transp. Res. Rec. J. Transp. Res. Board 2110, 69–77. doi:10.3141/2110-09
Siddika, S., and Sresto, M. A. (2025). Assessing urban resilience of Khulna City in response to environmental and socioeconomic challenges. DYSONA - Appl. Sci. 6, 134–144. doi:10.30493/DAS.2024.481910
Slaev, A. D., and Nikiforov, I. (2013). Factors of urban sprawl in bulgaria. SPATUM Int. Rev. 29, 22–29. doi:10.2298/spat1329022s
Talema, A. H., and Nigusie, W. B. (2024). Spatio-temporal analysis of urban expansion using remote sensing data and GIS for the sustainable management of urban land: the case of Burayu, Ethiopia. MEQ 35, 1096–1117. doi:10.1108/MEQ-07-2023-0196
Wanfu, J., Chunshan, Z., Tao, L., and Guojun, Z. (2019). Exploring the factors affecting regional land development patterns at different developmental stages: evidence from 289 Chinese cities. Cities 91, 193–201. doi:10.1016/j.cities.2018.11.019
Wang, S., Wang, J., and Liu, X. (2019). How do urban spatial structures evolution in the high-speed rail era? Case study of Yangtze River Delta, China. Habitat Int. 93, 102051. doi:10.1016/j.habitatint.2019.102051
Wang, Z., Wang, L., Zhao, B., and Pei, Q. (2023). Analysis of spatiotemporal interaction characteristics and decoupling effects of urban expansion in the central Plains urban agglomeration. Land 12, 772. doi:10.3390/land12040772
Weilenmann, B., Seidl, I., and Schulz, T. (2017). The socio-economic determinants of urban sprawl between 1980 and 2010 in Switzerland. Landsc. Urban Plan. 157, 468–482. doi:10.1016/j.landurbplan.2016.08.002
Wu, R., Li, Z., and Wang, S. (2021). The varying driving forces of urban land expansion in China: insights from a spatial-temporal analysis. Sci. Total Environ. 766, 142591. doi:10.1016/j.scitotenv.2020.142591
Xu, M., He, C., Liu, Z., and Dou, Y. (2016). How did urban land expand in China between 1992 and 2015? A multi-scale landscape analysis. PLoS ONE 11, e0154839. doi:10.1371/journal.pone.0154839
Xu, X., and Min, X. (2013). Quantifying spatiotemporal patterns of urban expansion in China using remote sensing data. Cities 35, 104–113. doi:10.1016/j.cities.2013.05.002
Yan, Y., Ju, H., Zhang, S., and Jiang, W. (2019). Spatiotemporal patterns and driving forces of urban expansion in coastal areas: a study on urban agglomeration in the Pearl River Delta, China. Sustainability 12, 191. doi:10.3390/su12010191
Zhang, G., Huang, W., Zhou, C., and Cao, Y. (2018). Spatio-temporal characteristics of demographic distribution in China from the perspective of urban agglomeration. Acta Geogr. Sin. 73, 1513–1525. doi:10.11821/dlxb201808009
Zhang, L., Fang, C., Zhao, R., Zhu, C., and Guan, J. (2023). Spatial–temporal evolution and driving force analysis of eco-quality in urban agglomerations in China. Sci. Total Environ. 866, 161465. doi:10.1016/j.scitotenv.2023.161465
Zhang, X., and Han, H. (2024). Characteristics and factors influencing the expansion of urban construction land in China. Sci. Rep. 14, 16040. doi:10.1038/s41598-024-67015-8
Zhou, C., Li, M., Zhang, G., Chen, J., Zhang, R., and Cao, Y. (2021). Spatiotemporal characteristics and determinants of internal migrant population distribution in China from the perspective of urban agglomerations. PLoS ONE 16, e0246960. doi:10.1371/journal.pone.0246960
Keywords: urban expansion, urban agglomerations, spatiotemporal characteristics, influencing factors, China
Citation: Li M, Cao Y, Song J, Li H and Liang M (2025) Spatiotemporal characteristics and determinants of urban expansion in China: perspective of urban agglomerations. Front. Earth Sci. 12:1523020. doi: 10.3389/feart.2024.1523020
Received: 05 November 2024; Accepted: 31 December 2024;
Published: 23 January 2025.
Edited by:
Karoly Nemeth, Institute of Earth Physics and Space Science (EPSS), HungaryCopyright © 2025 Li, Cao, Song, Li and Liang. This is an open-access article distributed under the terms of the Creative Commons Attribution License (CC BY). The use, distribution or reproduction in other forums is permitted, provided the original author(s) and the copyright owner(s) are credited and that the original publication in this journal is cited, in accordance with accepted academic practice. No use, distribution or reproduction is permitted which does not comply with these terms.
*Correspondence: Mengyin Liang, bGlhbmdtZW5neWluQGxjcmMub3JnLmNu
†These authors have contributed equally to this work