- 1College of Safety Science and Engineering, Xi’an University of Science and Technology, Xi’an, China
- 2China Academy of Safety Science and Technology, Beijing, China
Landslide sensitivity prediction relies on multiple environmental factors, making it difficult to obtain accurate prediction results. In order to improve the prediction accuracy of regional landslide sensitivity, a landslide sensitivity spatial distribution prediction method based on integrated particle swarm optimization was studied in Lianhe Village, Jianfeng Town, Shizhong District, Leshan City, Sichuan Province. Based on the determination coefficient, the sensitivity of landslide influencing factors was analyzed, and the weights of the influencing factors were determined. A landslide sensitivity spatial distribution prediction model was established based on support vector machine. By introducing simulated annealing and mutation operations into the particle swarm algorithm, an integrated particle swarm algorithm was obtained to extract high weight features of landslide sensitivity space and generate landslide sensitivity prediction results. The experimental results show that the cumulative value (ACU) of this method for predicting landslide sensitivity is 0.91, which can accurately predict the spatial distribution of landslide sensitivity in the study area and has practical value.
1 Introduction
A landslide is a highly destructive geological disaster. It is sudden and unpredictable. Every time it occurs, there will be a huge loss of life and property. This has a far - reaching impact on the infrastructure of human society, residents' lives and the natural environment (Zhu et al., 2023). The weakness of geological structure provides a potential sliding surface for the formation of landslides. Topography and water system distribution directly affect the triggering conditions and movement path of landslides (Chen et al., 2023; Zhu et al., 2024). Meteorological conditions, especially extreme rainfall, earthquakes and other natural disasters, often become the direct cause of landslides. In addition, with the intensification of human activities, the erosion and instability of the earth’s surface have been further aggravated, making the risk of landslide disasters significantly increased (Zeng et al., 2023; Wei et al., 2024). In the vast territory of China, the distribution of landslide disasters shows obvious regional characteristics (Luo, 2023). Due to the limited ability to predict the impact of landslide disasters, early warning resources (such as monitoring instruments, warning information release platforms, etc.) often find it difficult to achieve comprehensive coverage and efficient utilization. In this situation, if there is a lack of spatial distribution prediction of landslide susceptibility, disaster response departments will not be able to identify high-susceptibility areas and focus on monitoring and warning them, resulting in an unreasonable allocation of warning resources and the inability to take effective preventive measures before disasters occur, such as reinforcing mountains and carrying out engineering treatment. Therefore, it is particularly important to carry out spatial distribution prediction of landslide susceptibility.
In recent years, many scholars have carried out research and have achieved some research results. Literature (He et al., 2023; Qiu et al., 2022) takes Weixin County, a mountainous area in Northeast Yunnan, as the research object. Firstly, a comprehensive evaluation index system is established, and then the factors are classified by using the woe model. Finally, the multi-scale support vector machine model is established, and the landslide susceptibility grade map is established by using Geographic Information System (GIS) technology. The selection of Support Vector Machine (SVM) model parameters has a great impact on the results, and the generalization ability of its model is not enough to achieve the ideal evaluation effect. Reference (Zou et al., 2023) proposed an evaluation method of landslide susceptibility in eastern Tibet Based on the frequency ratio and the Analytic Hierarchy Process (AHP) model. This method first selects the Digital Elevation Model (DEM) and its derived data (slope, aspect), faults, formation lithology, seismic points and other factors, then normalizes each factor, calculates the relative importance of each factor using the Factor Rating (FR) method, and finally calculates the weight of impact factors to build an evaluation model. The FR method used in this method can intuitively reflect the relationship between factors and landslide occurrence frequency. However, it ignores the complex non-linear relationship between factors and landslide occurrence, as well as the coupling between factors, which further exacerbates the complexity of the AHP model and leads to poor prediction accuracy. In literature (Yang et al., 2023; Wang et al., 2022), Yushe County is taken as the research area. Firstly, based on the GIS platform, five influencing factors of slope and slope height are selected as evaluation indexes through cluster analysis. Then, the information value of each factor is calculated using the Weighted Information Value (WIV) method. Finally, the weighted sum is obtained to evaluate the results of geological disaster susceptibility. Although the WIV method can effectively integrate multi-source information, its results are sensitive to weight allocation and do not fully consider the spatial correlation between factors, resulting in the need to improve its application prediction accuracy. In reference (Wang et al., 2023), a landslide hazard susceptibility evaluation method based on an information model is proposed. In this method, Chongqing, a city with serious landslide disasters, is taken as the research area. Firstly, based on the historical landslide data, 10 evaluation indexes, including slope and aspect, are selected. Then, the contribution of each factor to landslide occurrence is calculated using the information model. Finally, the contribution is ranked, and the landslide susceptibility distribution map of the research area is obtained. Although the information model can reflect the contribution of various factors to landslide occurrence, it may overlook some potential non-linear landslide influencing factors, which may affect the evaluation results and lead to poor prediction accuracy.
In view of the problem that the above method is affected by the landslide influencing factors and the prediction accuracy is insufficient, the prediction of landslide susceptibility spatial distribution based on integrated particle swarm optimization is carried out. Innovatively analyze and extract potential, non-linear landslide impact factors; analyze the spatial correlation between influencing factors based on the deterministic coefficient; complete the sensitivity analysis of landslide influencing factors; and reduce the impact of factor weight allocation on the prediction results. Considering the complex non-linear relationship between influencing factors and landslide occurrence, as well as the coupling between factors, simulated annealing and mutation operations are simultaneously introduced into the particle swarm algorithm to optimize the ensemble particle swarm algorithm and improve its generalization ability. Solve the effective spatial high factor weight characteristics of landslide susceptibility, simplify the prediction model, and obtain distribution prediction results.
2 Overview of the study area
2.1 Geological environment analysis
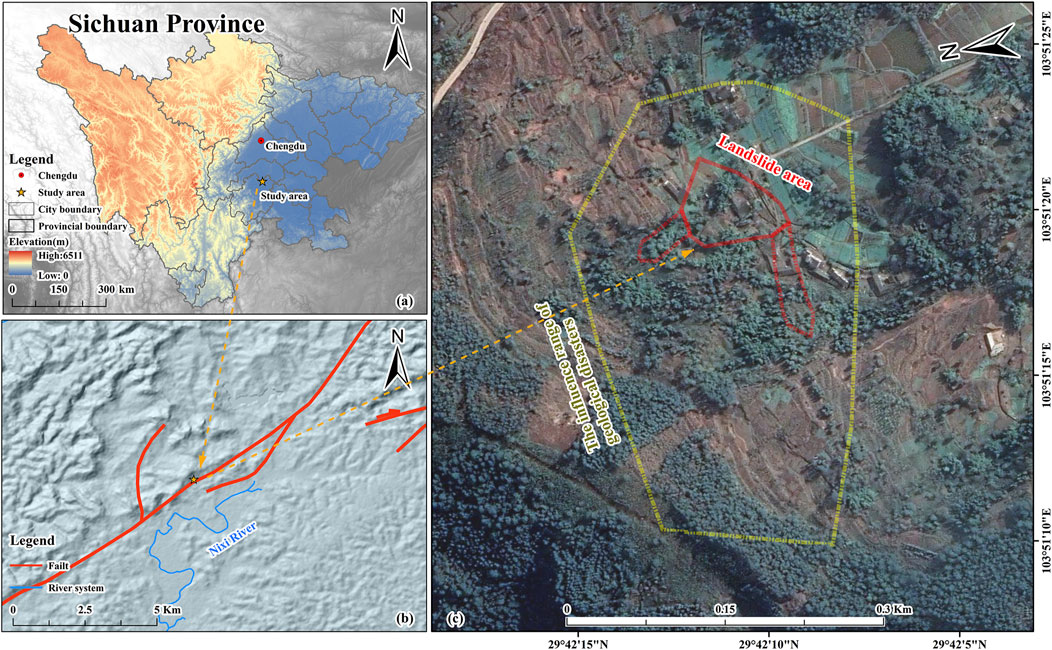
The study area is Lianhe village, Jianfeng Township, Shizhong District, Leshan City, Sichuan Province. The survey area is located in a deep-seated hilly area extending in a beaded shape from the Northeast, and location and general situation of the study area is shown in Figure 1.
As shown in Figure 1, the landslide is developed on the slope on the north side of the dome, with the direction of the slope in the West and North, a width of 80–130 m, and a slope of 10°–17°; The lower section is a steep slope with a length of 60–150 m and a slope of 30°–55°; The gentle slope area is a long and gentle slope, with a slope of 10°–20°. Most residential houses are located on this slope. The stratum above the hill scarp is the sandstone of the upper Cretaceous Jiaguan formation, locally intercalated with thin mudstone. The slope at the foot of the slope is composed of silty mudstone and argillaceous siltstone of the lower hill 3, members of the Penglaizhen formation of the upper Jurassic system. The Neogene Holocene collapse (residual) diluvium in this area is sporadically distributed. The present talvium in the landslide area is mainly composed of gravel. The geological structure of this area is adjacent to the Xinqiao fault of the NNE trending fault, which is located in the Northeast (hanging wall) of the fault. It is affected by the pull bending folds of the two walls and is about 350 m away from the fault. The rock occurrence in this area is 315°, ∠12, which is a monoclinic structure. Compressed by geological structure, the rock mass fissure is developed, mainly including two groups of 80°∠78° and 133°∠75°. The landslide area is a typical clockwise slope terrain. On this basis, follow-up research was carried out.
2.2 Analysis and extraction of landslide impact factors
The causes of landslides are complex and can be attributed to two categories of influencing factors: controlling factors and inducing and promoting factors. The controlling factor is the basic condition of landslide occurrence and plays a decisive role in the formation of landslides. The inducing and promoting factors further stimulate or accelerate the landslide process on the basis of the controlling factors (Duan et al., 2023).
2.2.1 Control factor analysis
1) Geomorphic factors: These factors jointly shape the topographic background of landslide occurrence, such as steep slope, unfavorable slope direction (such as towards the direction vulnerable to erosion) and complex topographic relief, increasing the risk of landslide.
2) Geological factors: Rock combinations of different lithologies have different resistance to landslides. The stability of slope structure directly affects the occurrence of landslides, while the fault distance reflects the potential impact of regional geological structure on landslides (Anand et al., 2023a).
3) Hydrological factors: Hydrological conditions are very important for triggering landslides, especially rainfall, which is one of the most common triggering factors for landslides.
2.2.2 Analysis of inducing and promoting factors
1) Surface coverage: The type, thickness and stability of surface vegetation, soil layer and other coverings have an important impact on landslides. The bare surface without vegetation coverage is more likely to be washed by rain, accelerating the landslide process (Chang et al., 2023).
2) Seismicity: The propagation and energy release of seismic waves in rock mass will cause damage to the structural integrity of rock mass, lead to slope instability and induce landslides.
3) Human activities, such as farming, deforestation, urban construction, and road construction, can have negative impacts on natural slopes, thereby increasing their landslide risk. In addition, unreasonable excavation, stacking and other behaviors are also direct causes of landslides (Fan et al., 2022).
In summary, this paper extracted 18 influencing factors, including elevation, slope gradient, slope orientation, slope length, terrain curvature, terrain undulation, engineering rock formation, slope structure, fault distance, water system distance, watershed area, flow path length, Landslide Susceptibility (LS) coefficient, Melton strength, terrain humidity index, rainfall, land use, and road distance for further research. The impact of these 18 influencing factors on landslide occurrence is as follows: Elevation factor: Elevation affects climate, vegetation, and indirectly affects landslide occurrence. Generally speaking, high-altitude areas may have lower temperatures, frequent freeze-thaw cycles, severe rock weathering, and an increase in the amount of loose material. Meanwhile, vegetation growth conditions in high-altitude areas are relatively poor, and the reinforcement effect of vegetation roots on soil is weak, making landslides prone to occur. Slope factor: Slope is one of the key factors affecting landslide occurrence (Melati et al., 2024). A steeper slope will subject the rock and soil mass to greater gravitational forces, increasing the sliding force and affecting the runoff velocity and infiltration of surface water. When the slope exceeds a certain limit, the stability of the rock and soil mass will significantly decrease, making it prone to landslides. Slope aspect factor: Slope aspect affects conditions such as light, temperature, precipitation, and vegetation growth. The sunny slope receives more solar radiation, with higher evaporation and relatively lower soil moisture content (Li et al., 2023). The vegetation type and coverage may differ from the shady slope. On shady slopes, the humidity may be high, and in some cases, excessive soil moisture can increase the risk of landslides. Slope length factor: When the slope length is long, the runoff distance of surface water on the slope increases, and the erosion and scouring ability of runoff is enhanced. It is easy to carry away loose materials on the slope, reduce the stability of the slope, and easily form gullies, which can lead to geological disasters such as landslides. Terrain curvature factor: Terrain curvature reflects the degree of curvature of the terrain. At the curvature of normal terrain (convex terrain), the rock and soil mass are easily subjected to tensile stress, leading to internal structural damage to the rock and soil mass. In areas with negative terrain curvature (concave terrain), it is easy to accumulate water, increase soil moisture content, reduce the shear strength of rock and soil mass, and increase the possibility of landslides. Terrain undulation factor: A large terrain undulation means a large height difference, and the gravity effect on the rock and soil mass varies greatly, which can easily lead to stress concentration. Meanwhile, areas with large terrain undulations are often accompanied by complex geological structures and different lithological combinations, increasing the potential risk of landslides. Engineering rock formation factor: Different engineering rock formations have different physical and mechanical properties, such as hardness, weathering resistance, permeability, etc. Weak rock formations (such as shale, mudstone, etc.) are prone to weathering, have low strength, and are prone to deformation and damage when subjected to external forces, leading to landslides. Slope structure factor: Slope structure includes the bedding structure of rock and soil, the development of joints and fissures, etc. If the bedding tendency of the rock and soil mass on the slope is consistent with the slope inclination, and the inclination angle is smaller than the slope inclination angle, this forward slope structure is more prone to sliding under the action of gravity (Di et al., 2023). The integrity of the rock and soil mass with developed joints and fissures is destroyed, and the shear strength is reduced. The rock and soil mass along the slope are prone to sliding along the bedding plane, causing landslides. Fault distance factor: The rock and soil mass near the fault is strongly affected by crustal movement, resulting in rock fragmentation, crack development, and damage to the integrity and stability of the rock and soil mass. The closer to the fault, the stronger the impact and the higher the risk of landslides. Water system distance factor: Areas close to water systems have higher groundwater levels and higher soil moisture content. Meanwhile, lateral erosion of the water system may weaken the support force at the foot of the slope, causing the rock and soil mass to lose balance and leading to landslides. Watershed area factor: A larger watershed area means more catchment areas, resulting in larger runoff during rainfall. A large amount of surface water runoff will increase the erosion and scouring ability of the slope, reducing the stability of the slope. Flow path length factor: When the flow path length is long, the energy accumulation of water flow in the slope or valley is greater, and the erosion and scouring ability is enhanced. Long flow paths may also lead to more slope material being transported, affecting the stability of the slope. Length Slope (LS) coefficient: the LS coefficient comprehensively considers the effects of slope length and slope gradient on soil erosion and landslides. It reflects the comprehensive effect of terrain on the erosion force of water flow and the stability of rock and soil mass. The larger the coefficient, the greater the potential impact of terrain on landslides. The LS coefficient is relatively high, making landslides more likely to occur under triggering factors such as rainfall. Melton intensity factor: Melton intensity is an indicator that measures the relationship between terrain humidity conditions and potential landslide risks. A higher Melton strength indicates a higher terrain humidity, which increases the likelihood of soil being supersaturated and reduces the shear strength of the rock and soil mass, thereby increasing the risk of landslides. Terrain moisture index factor: The terrain moisture index reflects the influence of terrain on soil moisture distribution. It comprehensively considers the relationship between terrain slope, slope orientation, slope length, and soil moisture. A higher terrain moisture index indicates a high soil moisture content, which reduces the shear strength of the rock and soil mass and makes it prone to landslides (Oyda et al., 2024). Rainfall factor: Rainfall is one of the main triggering factors for landslides. On the one hand, rainfall increases the weight of the rock and soil mass, and increases the sliding force. On the other hand, rainwater infiltration into the rock and soil mass will reduce its shear strength, making it easier for the rock and soil mass to slide. Land use factor: Different land use methods have varying impacts on landslides. For example, forest vegetation can improve the stability of soil and rock through root system stabilization, interception of rainfall, and other methods. Construction land (such as building construction, road construction, etc.) may damage the original terrain and soil structure, increasing the risk of landslides. Road distance factor: In areas close to the road, excavation, filling, and other engineering activities during road construction can alter the stress state and hydrological conditions of the rock and soil mass. The drainage system of the road may also affect the soil moisture content in the surrounding area. The closer to the road, the more obvious these effects are, and the higher the risk of landslides.
3 Sensitivity analysis of landslide influencing factors based on deterministic coefficients
After completing the extraction of landslide impact factors, the deterministic coefficient theory is introduced to conduct a sensitivity analysis of landslide impact factors. Sensitivity analysis of influencing factors helps determine which influencing factors are closely related to landslides (He et al., 2022; Ji et al., 2022). The formula for calculating the determination coefficient of landslide impact factors is as follows:
In the formula,
In the formula,
According to Equations 1–3, it can be seen that the maximum and minimum values of the coefficient of certainty for the landslide impact factor are 1 and −1, respectively. When the coefficient of certainty is greater than 0, it indicates a high degree of certainty that a landslide will occur in the area. When the coefficient of certainty is equal to 1, it indicates that a landslide will inevitably occur, with a probability of 100%; When the coefficient of certainty is less than 0, it indicates that the certainty of landslide occurrence is low, and the probability of landslide occurrence in the evaluation unit at the location is low; When the coefficient of certainty is equal to −1, it indicates that the unit is stable and will not experience landslides; When the coefficient of certainty is approximately equal to 0, it indicates that there is no correlation between the event occurrence and the evaluation unit, and it is impossible to determine whether it is prone to landslides (Zhou et al., 2022). The classification and grading information of the determination coefficient is shown in Table 1:
Next, calculate the determination coefficients of the influencing factors and combine the determination coefficients of different factors using the following formula to obtain the factor weights:
In the formula,
4 Construction of spatial distribution prediction model for landslide susceptibility
The geological structure, soil type, rock properties, and other factors vary significantly in different regions, and the availability and quality of landslide historical data, geological survey data, etc., directly affect prediction. The PSO (particle Swarm Optimization) algorithm is used to optimize the parameters of the SVM model. Introduce an insensitive loss function and set the parameters of the particle swarm reasonably, such as particle number, inertia weight, and acceleration coefficient. Find the optimal parameter combination, select and extract effective features, and predict the spatial distribution of landslide susceptibility.
4.1 Construction of prediction model based on sensitivity and SVM
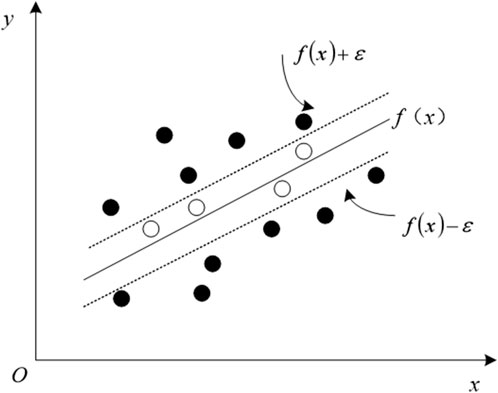
SVM is a supervised machine learning algorithm based on statistical learning theory. The occurrence of landslides is a complex geological process that is influenced by multiple factors. It is not easy to collect sufficient data points on landslide occurrence and non-occurrence comprehensively. SVM has good generalization ability in small sample situations. It separates samples of different categories by finding the optimal classification hyperplane rather than relying excessively on a large amount of sample data to fit the model like other algorithms. In addition, the susceptibility of landslides is influenced by numerous factors, which form a high-dimensional feature space. When constructing prediction models, it is necessary to consider the comprehensive impact of these factors simultaneously. SVM can effectively process high-dimensional data by mapping the original high-dimensional data to a higher dimensional feature space through kernel functions, and finding the optimal classification hyperplane in this high-dimensional space. There will be no “curse of dimensionality” due to the increase in data dimensions, thus accurately capturing the complex relationship between various factors and landslide susceptibility. Therefore, SVM is used to construct the prediction model. In the process of constructing a landslide susceptibility spatial distribution prediction model based on SVM, a core issue is to optimize the position of the hyperplane to ensure the maximization of the classification interval between different categories, namely, landslide points and non-landslide points, while minimizing the error of misclassification of training samples (Wang et al., 2022). This challenge requires finding the optimal balance between maximizing classification interval and minimizing classification error. To achieve this goal, an insensitive loss function is introduced, which defines an error tolerance range ε. When the difference between the predicted value f(x) and the observed value y is less than ε, the prediction is considered accurate, meaning no loss occurs at that point. The principle is shown in Figure 2.
From Figure 2, it is evident that support vector machines fit all sample points by finding a regression equation. Assuming dataset
In the formula,
In the formula,
4.2 Deep optimization solution of prediction model based on integrated particle swarm algorithm
Due to the lack of precise and unified methods for selecting the penalty coefficient
The integrated particle swarm algorithm is applied to solve the problem, and the specific process is as follows:
(1) Initialize particles and related parameters, set the particle swarm size to
(2) Calculate the fitness value of particles according to the Equation 7:
In the formula,
In the formula,
(3)
(4) A comparison was made between the fitness of particles and the optimality of the population. If the current value is better than
(5) Update the direction and step size of particle motion, generate a new population, and verify whether its velocity and position are outside the interval.
(6) Perform mutation operation. Assign a random number to the
(7) Continue
By combining SVM, a powerful classification algorithm, with regression tools and integrated particle swarm optimization algorithms, the spatial distribution characteristics of landslide susceptibility can be solved. By selecting the features that have the greatest impact on landslide susceptibility, such as slope, elevation, rainfall, etc., as landslide influencing factors, the spatial distribution of landslide susceptibility can be predicted. The overall flow chart of the predictions described above is shown in Figure 3.
5 Example validation and result analysis
5.1 Data sources
The dataset used in this study includes landslide hazard data, geological environment data, Landsat TM image data with a resolution of 30 m × 30 m, and river network road data in the study area. The specific data sources and types are shown in Table 2.
In the research area, a total of 148 landslide disaster points were identified and recorded. To evaluate the application effectiveness of the proposed method scientifically, the dataset was divided in a 7:3 ratio. Study the geographic information data of the research area, such as topography, geological structure, rainfall, vegetation coverage, soil type, etc., as influencing factors for landslide susceptibility prediction. 104 landslide points were selected as the training dataset, while the remaining 44 landslide points were used as the validation dataset. The processing method for the above data is as follows: clean the landslide point data, remove duplicate or erroneous records, and convert the coordinates uniformly to the UTM (Universal Transverse Mercator Projection) coordinate system. Digitize the geological map and encode geological information such as lithology according to classification standards to ensure consistency in data format. Perform radiometric calibration on Landsat Terrain Modeling (TM) image data, convert the original digital quantification value (DQ) value into radiance value, and then perform atmospheric correction to eliminate the influence of atmospheric scattering and absorption on the image, obtaining surface reflectance data. Register all data (landslide disaster data, geological environment data, Landsat TM image data, river network road data) to the same spatial reference frame UTM coordinate system to ensure spatial consistency of the data. The spatial resolution of different data is inconsistent, and bilinear interpolation is used to resample low resolution data to match high-resolution data in spatial resolution. Use clipping tools in ArcGIS to manipulate the boundary vector data of the study area as the clipping range.
The initial penalty parameter is 10, the kernel function is 0.1, 30 particles are set, the inertia weight is 0.7, and the learning factors are set to 2.05 and 2.05, respectively, which affect the speed at which particles learn from individual and global optima. Adopting a dynamic adjustment strategy, the initial value is set to 0.9 and gradually decreases as the number of iterations increases. The maximum number of iterations is 400.
Construct a grid with an
5.2 Prediction function verification
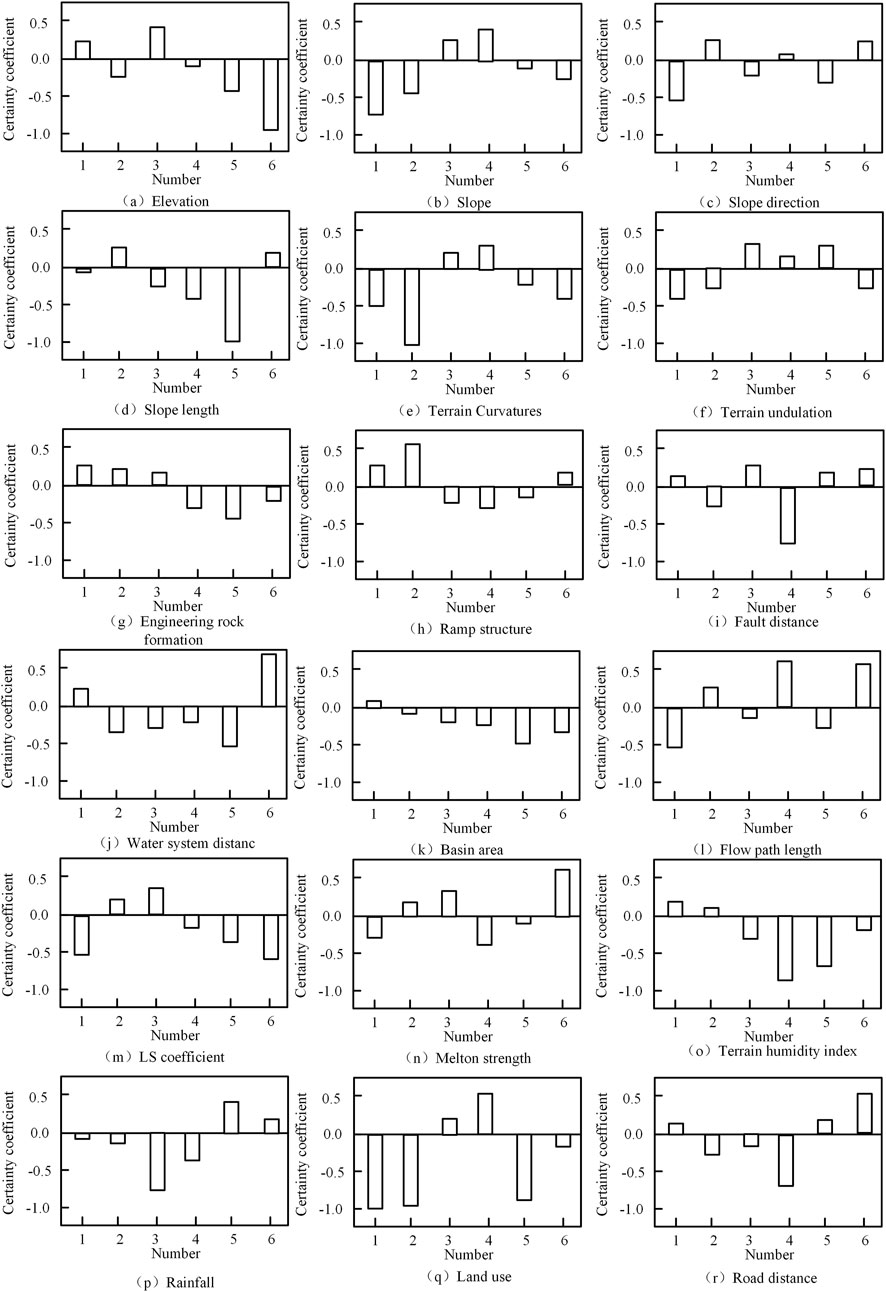
Simulate annealing operation on particles with a probability of 0.1 (e.g.,), accept a certain range of poor solutions to escape from local optima; Perform mutation operation on particles with a probability of 0.05 (e.g.,) The proposed method was applied to extract landslide influencing factors, and the determination coefficient of the influencing factors was calculated. The results are shown in Figure 4.
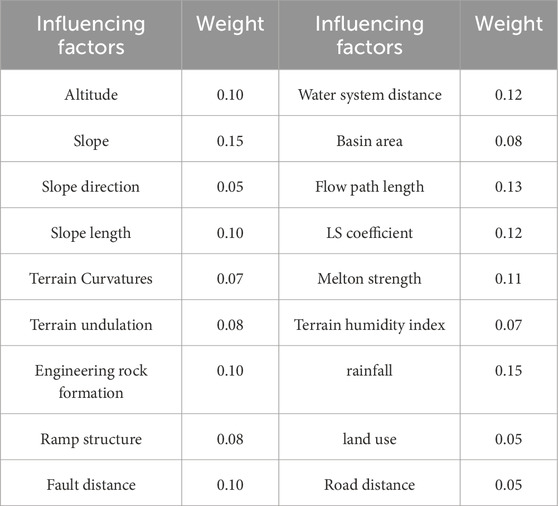
As shown in Figure 4, six samples of the 18 influence factors were greater than-1 and less than 0.5. Normalize the determination coefficients of each influencing factor in Figure 4, calculate the entropy and difference coefficients of each determination coefficient, and finally normalize the difference coefficients to obtain the weight values of each influencing factor as shown in Table 3.
The experiment conducted collinearity analysis on 18 influencing factors and calculated the Pearson correlation coefficients between each pair of influencing factors, such as slope and aspect, using the following Equation 10:
In the formula,
The Pearson correlation coefficient calculation results of the 18 influencing factors do not conform to values greater than 0.7 or less than −0.7, indicating that there is no linear correlation between all influencing factors. Therefore, 18 influencing factors were retained.
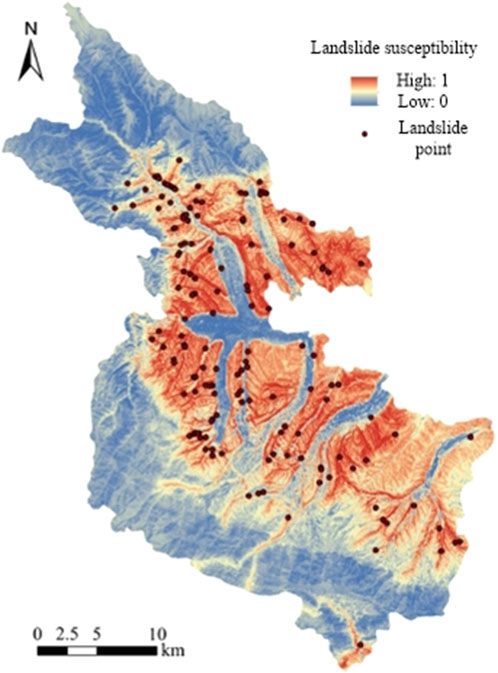
The spatial distribution prediction of landslide susceptibility was completed, and the results are shown in Figure 5.
From the analysis of Figure 5, it can be seen that the high and relatively high prone areas of landslide disasters in the study area are mainly concentrated on both sides of the valley and the low mountain and hilly areas adjacent to the town, with a total area of 907.45 km2, accounting for 33.61% of the total area of the study area. The terrain and landform conditions in this area are particularly complex, with crisscrossing gullies and significant river erosion, resulting in relatively sparse vegetation coverage and severe soil erosion problems. In addition, the risk of geological disasters is further exacerbated by the influence of rainfall factors. Research has shown that there are a total of 138 landslide hazards in the area, accounting for 93.24% of the total number of landslides in the region. The density of disaster points is 15 per 100 km2, making it a typical geological hazard-prone area. Landslide disasters are mainly distributed in the border areas between high mountains and low hills, with an area of 459.20 km2, accounting for 17.01% of the total area. Although the number of geological hazard points in this area is relatively small, with only 5 landslide hazard points investigated, accounting for 3.38% of the total number of landslides, the density of hazard points has also reached 1 per 100 km2, indicating that we still need to be vigilant about the occurrence of geological hazards.
The low landslide-prone areas and lower landslide-prone areas are widely distributed in the middle and high mountain areas above 3,000 m altitude and the towns and plain areas below 2,500 m altitude, with a total area of 1,178.66 km2, accounting for 49.39%. Among them, 5 landslide disaster points were found in the low-risk area, accounting for 3.38% of the total number of landslides, while no landslide disaster occurred in the low-risk area. Specifically, the mountainous area in the north and south of the river is a middle and high mountain area eroded by tectonic erosion. The area is mainly composed of old bedrock mountains, with good vegetation coverage and relatively superior geological environment conditions. However, due to the steep terrain, some rocks are damaged by geological structures, resulting in landslides and other geological disasters. Although the area is generally stable and the probability of geological disasters is low, its potential risk is still worth noting. The geomorphic type of town and farmland plain area is an erosion accumulation plain, and the stratum is mainly composed of Quaternary gravel pebbles and loess. Although the intensity of human activities is high, the threat to villagers' houses and farmland is low due to the flat terrain and relatively scattered geological disasters such as landslides. However, this does not mean that the risk of geological disasters in the region can be completely ignored, and monitoring and prevention still need to be strengthened.
In conclusion, the proposed method can be used to predict the spatial distribution of landslide susceptibility in the study area. Through the investigation and analysis of landslide disaster points in the study area, combined with multiple data such as topography, geological structure, meteorology and hydrology, different types of areas with high, high, medium, low and low landslide disasters can be identified. This spatial distribution prediction result is helpful in understanding the potential risk of landslide disasters, and the application effect is good.
5.3 Comparison performance verification
Taking the landslide prediction method based on WIV (Yang et al., 2023) and landslide prediction method based on information model (Wang et al., 2023) as the comparison method, the spatial distribution of landslide susceptibility in the study area is predicted with the proposed method. Thus, the comparison results are shown in Table 4 below.
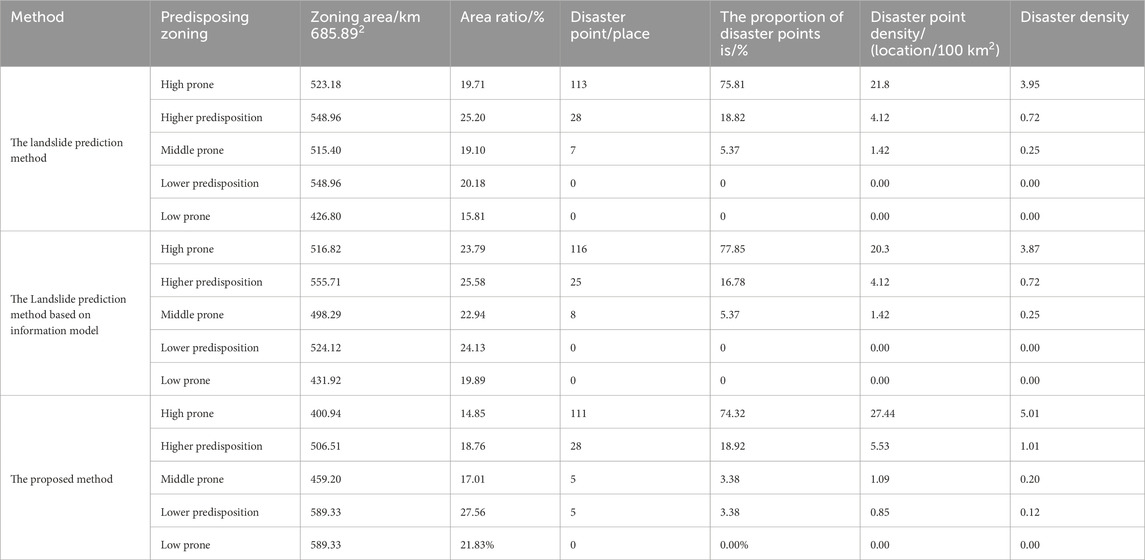
Table 4. Comparison of spatial distribution prediction results of landslide susceptibility by three methods.
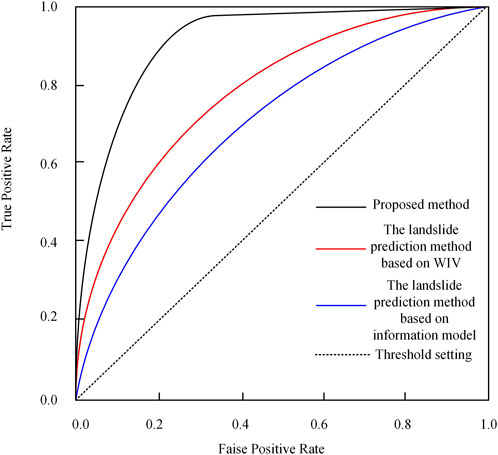
It can be seen from Table 4 above that the three methods can predict the spatial distribution of landslide susceptibility in the study area, and all have certain functionality. This time, the ROC curve is used to compare the prediction accuracy of the three methods. Using this method to detect the susceptibility map mainly means judging the area under the curve (AUC). If the AUC value is larger, the evaluation result is better. Thus, the comparison results are shown in Figure 6.
The AUC in the figure represents the region surrounded by the intersection of the two ends perpendicular to the dashed line. As shown in Figure 6 above, the AUC values of the landslide prediction method (Yang et al., 2023), the landslide prediction method based on information model (Wang et al., 2023) method and the proposed method are 0.74, 0.81 and 0.91, respectively. The test results show that the proposed method has higher accuracy and better application effect in the spatial prediction of landslide geological hazard susceptibility in the study area. This is because this paper considers the complex non-linear relationship between influencing factors and landslide occurrence, as well as the coupling between factors. Using a simulated annealing algorithm and mutation operation to optimize the generalization ability of the particle swarm algorithm avoids getting stuck in local optimal solutions and obtains higher prediction accuracy.
Due to the real-time requirement of landslide prediction, the prediction efficiency of the three methods was further tested based on the prediction accuracy. The prediction time of the three methods is shown in Table 5.
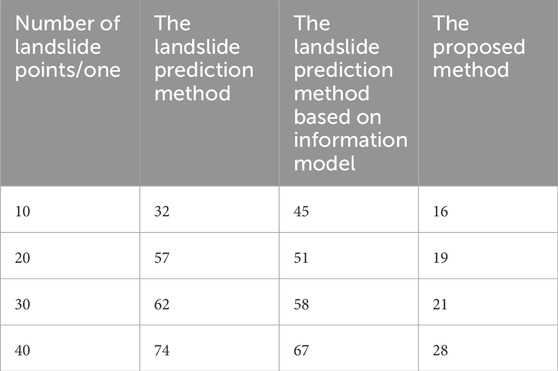
Table 5. Comparison of three methods for predicting the spatial distribution of landslide susceptibility over time/ms.
According to Table 5, for 40 landslide locations, the prediction time of our method is less than 28 ms, while the prediction time of other methods is higher than 60 ms, indicating that the prediction efficiency of our method is higher. This is because this paper uses an optimized particle swarm optimization algorithm to solve the landslide prediction model, reducing the complexity of the coupling model of influencing factors and thus reducing the prediction time.
6 Conclusion
1. In order to strengthen the scientific and effective management of regional landslide disaster risks, this paper takes Lianhe Village, Jianfeng Township, Shizhong District, Leshan City, Sichuan Province as the research object, and studies a landslide susceptibility spatial distribution prediction method based on integrated particle swarm optimization.
2. The innovative content of the paper is the introduction of simulated annealing and mutation operations to improve the traditional particle swarm algorithm, proposing an integrated particle swarm algorithm to more accurately quantify the contribution of various factors to landslide occurrence.
3. The focus of this study is to apply integrated particle swarm optimization algorithm to support vector machine parameter optimization, improve its ability to avoid local optima, and make accurate predictions.
4. After verification, this method has high prediction accuracy and efficiency. The application of integrated particle swarm optimization algorithm and support vector machine in predicting the spatial distribution of landslide sensitivity enriches the theoretical framework system of landslide disaster prediction and provides a new approach to improve landslide warning and prevention capabilities. In the future, while exploring more innovative technologies and methods, it is expected that this method can be promoted to more regions, continuously improving the ability to predict and prevent geological disasters, and contributing to the construction of a safer and more harmonious living environment.
Data availability statement
The original contributions presented in the study are included in the article/supplementary material, further inquiries can be directed to the corresponding author.
Author contributions
QZ: Conceptualization, Investigation, Methodology, Resources, Writing–original draft, Writing–review and editing.
Funding
The author(s) declare that no financial support was received for the research, authorship, and/or publication of this article.
Conflict of interest
The author declares that the research was conducted in the absence of any commercial or financial relationships that could be construed as a potential conflict of interest.
Generative AI statement
The author(s) declare that no Generative AI was used in the creation of this manuscript.
Publisher’s note
All claims expressed in this article are solely those of the authors and do not necessarily represent those of their affiliated organizations, or those of the publisher, the editors and the reviewers. Any product that may be evaluated in this article, or claim that may be made by its manufacturer, is not guaranteed or endorsed by the publisher.
References
Anand, N., Maheshwar, M., Jan, T., and Prasad, M. (2023). Landslide susceptibility prediction based on decision tree and feature selection methods. J. Indian Soc. Remote Sens. 51 (4), 771–786. doi:10.1007/s12524-022-01645-1
Bui, Q. D., Ha, H., Khuc, D. T., Nguyen, D. Q., Meding, J. V., Nguyen, L. P., et al. (2023). Landslide susceptibility prediction mapping with advanced ensemble models: son La province, Vietnam. Nat. Hazards 116 (2), 2283–2309. doi:10.1007/s11069-022-05764-3
Chang, Z., Huang, J., Huang, F., Bhuyan, K., Meena, S. R., and Catani, F. (2023). Uncertainty analysis of non-landslide sample selection in landslide susceptibility prediction using slope unit-based machine learning models. Gondwana Res. 000 (117), 307–320. doi:10.1016/j.gr.2023.02.007
Chen, M., Yang, X., and Zhou, J. (2023). Spatial distribution and failure mechanism of water-induced landslides in the reservoir areas of Southwest China. J. Rock Mech. Geotechnical Eng. 15 (2), 442–456. doi:10.1016/j.jrmge.2022.04.004
Wang, D., Yang, R.-h., Wang, X., Li, S.-d., Tan, J.-x., Zhang, S.-q., et al. (2023). Evaluation of deep learning algorithms for landslide susceptibility mapping in an alpine-gorge area: a case study in Jiuzhaigou County. J. Mt. Sci. 000 (2), 484–500. doi:10.1007/s11629-022-7326-5
Duan, G., Hu, J., Deng, L., and Fu, J. (2023). Landslide susceptibility prediction by gray wolf optimized support vector machine model under different factor states. J. Appl. Remote Sens. 17 (4), 1–21. doi:10.1117/1.jrs.17.044510
Fan, X., Fang, C., Dai, L., Wang, X., Luo, Y., Wei, T., et al. (2022). Near real-time prediction of spatial distribution probability of earthquake-induced landslides—taking the Luahan earthquake on June 1, 2022 as an example. J. Eng. Geol. 30 (3), 729–739. doi:10.13544/j.cnki.jeg.2022-0328
Guo, Z., Kang, B., Qi, S., Wu, B., and Wang, X. (2022). Susceptibility evaluation of shallow landslide in forestland considering vegetation factors: a case study of the mountainous area of Huaying City in eastern Sichuan. J. Catastrophology 37 (2), 182–189. doi:10.3969/i.issm.1000-811X.2022.02.029
He, S., Hu, M., Yang, Z., Abudikeymu, X., and Chen, K. (2022). Evaluation of landslide susceptibility based on the fuzzy frequency ratio and entropy index: a case study of Chongyi County. Nonferrous Metals Sci. Eng. 13 (4), 80–90. doi:10.13264/j.cnki.ysjskx.2022.04.010
He, W., Zhao, J., Lin, Y., Chen, G., Li, K., and Yao, W. (2023). Landslide susceptibility assessment in Weixin County based on evidence weight and support vector machine model. Sci. Technol. Eng. 23 (15), 6350–6360.
JiRi, W., Tian, H., and Han, J. (2022). Evaluation of the susceptibility of earthquake landslides based on different machine learning algorithms—taking Ludian earthquake as an example. J. Kunming Univ. Sci. Technol. Nat. Sci. Ed. 47 (2), 47–56. doi:10.16112/j.cnki.53-1223/n.2022.02.132
Li, M., Qiu, Y., Xiong, H., and Zhang, Z. (2023). Evaluation of landslide susceptibility based on VW-AHP-IV model: a case of Pengyang County, Ningxia, China. Environ. earth Sci. 82 (4), 108–108.20. doi:10.1007/s12665-023-10787-5
Luo, X. (2023). Landslide susceptibility comparative analysis of Zhangzha earthquake region in Jiuzhaigou. Geospatial Inf. 21 (6), 103–107.
Melati, D. N., Umbara, R. P., Astisiasari, A., Wisyanto, W., Trisnafiah, S., Trinugroho, T., et al. (2024). A comparative evaluation of landslide susceptibility mapping using machine learning-based methods in Bogor area of Indonesia. Environ. earth Sci. 83 (3), 86–86.27. doi:10.1007/s12665-023-11402-3
Nirbhav, , Malik, A., Maheshwar, , Prasad, M., Saini, A., and Long, N. T. (2023). A comparative study of different machine learning models for landslide susceptibility prediction: a case study of Kullu-to-Rohtang pass transport corridor, India. Environ. Earth Sci. 82 (7). doi:10.1007/s12665-023-10846-x
Oyda, Y., Jothimani, M., and Regasa, H. (2024). Assessing landslide susceptibility in Lake Abya catchment, Rift Valley, Ethiopia: a GIS-based frequency ratio analysis. J. Degraded Min. Lands Manag. 11 (3), 5885–5895. doi:10.15243/jdmlm.2024.113.5885
Qiu, H., Zhu, Y., Zhou, W., Sun, H., He, J., and Liu, Z. (2022). Influence of DEM resolution on landslide simulation performance based on the Scoops3D model. Geomatics, Nat. Hazards Risk 13 (1), 1663–1681. doi:10.1080/19475705.2022.2097451
Wang, J., Wang, Y., Li, Y., Wei, S., Li, C., Wang, Y., et al. (2023). Assessment of landslide susceptibility based on information model: a case study of Chongqing City. Sci. Soil Water Conservation 21 (6), 53–62. doi:10.16843/j.sswc.2023.06.006
Wang, L., Qiu, H., Zhou, W., Zhu, Y., Liu, Z., Ma, S., et al. (2022). The post-failure spatiotemporal deformation of certain translational landslides may follow the pre-failure pattern. Remote Sens. 14, 2333. doi:10.3390/rs14102333
Wang, S., Zhuang, J., Zheng, J., Mou, J., Wang, Y., and Fu, Y. (2022). Landslide susceptibility evaluation based on deep learning along kangding-litang section of CZ railway. J. Eng. Geol. 30 (3), 908–919. doi:10.13544/j.cnki.jeg.2021-0115
Wei, Y., Qiu, H., Liu, Z., Huangfu, W., Zhu, Y., Liu, Y., et al. (2024). Refined and dynamic susceptibility assessment of landslides using InSAR and machine learning models. Geosci. Front. 15, 101890. doi:10.1016/j.gsf.2024.101890
Xiong, X., Wang, C., Bai, Y., Tie, Y., Gao, Y., and Li, G. (2022). Comparison of landslide susceptibility assessment based on multiple hybrid models at county level: a case study for Puge County, Sichuan Province. Chin. J. Geol. Hazard Control 33 (4), 114–124. doi:10.16031/j.cnki.issn.1003-8035.202202052
Yang, R., Yu, C., and Wang, Y. (2023). Geological hazard susceptibility evaluation based on weighted information and GIS methods: a case study of Yushe County. Min. Res. Dev. 43 (2), 163–170.
Yang, X. Q., and Zhu, Y. Q. (2021). Research on intelligent classification simulation of low occupancy big data in cloud computing. Comput. Simul. 38 (6), 301–305.
Zeng, T., Wu, L., Jin, B., Yin, K., Chen, Y., and Chen, H. (2023). Landslide dynamic susceptibility mapping based on stacking ensemble strategy and SBAS-InSAR. Chin. J. Rock Mech. Eng. 42 (9), 2266–2282. doi:10.13722/j.cnki.jrme.2022.1089
Zhang, W., He, Y., Wang, L., Liu, S., and Meng, X. (2023). Landslide Susceptibility mapping using random forest and extreme gradient boosting: a case study of Fengjie, Chongqing. Geol. J. 58 (6), 2372–2387. doi:10.1002/gj.4683
Zhou, Y., Chang, M., Sun, W., and Wu, B. (2022). Susceptibility evaluation of Hokkaido earthquake coseismic landslides based on improved weights of evidence method. Geogr. Geo-Information Sci. 38 (1), 138–144. doi:10.3969/j.issn.1672-0504.2022.01.020
Zhu, Y., Huang, H., Yin, K., Guo, Z., Guo, F., and Lai, P. (2023). Evaluation of landslide susceptibility based on landslide failure mode analysis: a case study of the left bank of Xietan River in the first section of Three Gorges Reservoir. Chin. J. Geol. Hazard Control 34 (2), 156–166. doi:10.16031/i.cnki.issn.1003-8035.202112035
Zhu, Y., Qiu, H., Liu, Z., Ye, B., Tang, B., Li, Y., et al. (2024). Rainfall and water level fluctuations dominated the landslide deformation at Baihetan Reservoir, China. J. Hydrology 642, 131871. doi:10.1016/j.jhydrol.2024.131871
Keywords: integrated particle swarm optimization, support vector machine, landslide susceptibility, space distribution, application value
Citation: Zhang Q (2024) Spatial distribution prediction of landslide susceptibility based on integrated particle swarm optimization. Front. Earth Sci. 12:1516615. doi: 10.3389/feart.2024.1516615
Received: 24 October 2024; Accepted: 21 November 2024;
Published: 10 December 2024.
Edited by:
Haijun Qiu, Northwest University, ChinaReviewed by:
Na He, Henan Polytechnic University, ChinaSijiang Wei, Henan Polytechnic University, China
Huajun Meng, Chinese Academy of Geological Sciences, China
Copyright © 2024 Zhang. This is an open-access article distributed under the terms of the Creative Commons Attribution License (CC BY). The use, distribution or reproduction in other forums is permitted, provided the original author(s) and the copyright owner(s) are credited and that the original publication in this journal is cited, in accordance with accepted academic practice. No use, distribution or reproduction is permitted which does not comply with these terms.
*Correspondence: Qing Zhang, emhhbmdxaW5nMTIzeGlhbkAxNjMuY29t
 Qing Zhang