- State Key Laboratory of Marine Geology, Tongji University, Shanghai, China
The geophysical inversion problem is inherently underdetermined. Constrained inversion, by incorporating prior information, can effectively reduce the ambiguity in inversion results. A key research challenge lies in establishing a reasonable coupling mechanism between the prior information and the inversion model. Traditional cross-gradient coupling methods often exhibit weak coupling effects in regions with small model gradients. In this paper, we introduce a new coupling method called “minimum cross-gradient support” (MCGS), which enhances the balance between model gradient magnitude and the influence of gradient direction by applying a minimum support function to the cross-gradient. We evaluated the coupling effects of MCGS in comparison with two others coupling methods: normalized cross-gradient (NCG) and joint minimum gradient support (JMGS), the latter of which also employs the minimum support function. Theoretical models demonstrate that MCGS retains the advantage of reduced dependence on strictly accurate prior information, enhances constraint effectiveness in weak gradient regions, and the strength of constraints can be flexibly adjusted through focusing factors. To verify the effectiveness of MCGS, we conducted two synthetic experiments: a double-blocks model and a nappe structure model, applied to magnetotelluric (MT) constrained inversion. The results showed that MCGS constrained inversion achieved better performance than both non-constrained inversion and cross-gradient constrained inversion, with lower residual cross-gradient values and higher model recovery accuracy compared to the true model. Finally, we applied the proposed MCGS coupling to real data sets from the Junggar Basin. The inversion results revealed the resistivity structure of the sedimentary layer and imaged possible residual Carboniferous sediments beneath the Permian, as well as the distribution of the Paleozoic basement. These results provide valuable evidence supporting the subduction tectonic evolution model of the region.
1 Introduction
The inherent non-uniqueness of inversion is a fundamental issue in geophysical research. Joint inversion stands out as a crucial approach to mitigate this non-uniqueness. The complexity of Earth’s internal structures and the diversity of geological targets make geophysics more intricate and challenging. Thus, relying solely on the results of a single geophysical method for subsurface interpretation inevitably leads to limitations and must be supplemented by other methods for cross-validation. Combining seismic and non-seismic methods to integrated interpret the subsurface structures from different perspectives can supply more accurate explanation of geological targets. (Gallardo et al., 2012; Takougang Takam et al., 2015; Moorkamp et al., 2016).
Different geophysical methods have different sensitivities, and there might be complementarity among them. Seismic tomography provides high-resolution velocity structures of the subsurface, but it faces challenges such as uneven ray coverage. For instance, first-arrival seismic rays provide limited information beneath high-velocity targets, and constructing velocity-depth models can be subjective. (Rawlinson et al., 2010). The MT method is less affected by a high resistivity shield layer (Huang et al., 2023) but shows lower resolution. By combining these different geophysical methods properly, it is possible to obtain a more reliable subsurface structure, thereby overcoming the limitations and non uniqueness of single methods to some extent.
Joint inversion is the process of combining multiple geophysical observed data and establishing the appropriate coupling relationships on the petrophysical relationships or geometric parameters of geological targets which are reflected by different geophysical methods. It aims to invert and obtain models that are fitting with various observed geophysical data. The mainstream coupling approaches in joint inversion can be categorized into two types: coupling based on petrophysical relationships and structural geometric similarities of geological targets (Lelièvre et al., 2012).
Joint inversion approaches based on petrophysical relationships utilizes theoretical or empirical relationships between different physical properties, such as velocity, density, resistivity, etc., which can be established based on compositional structure, porosity, saturation, and other physical properties (Heincke et al., 2006; Colombo and De Stefano, 2007; Heincke et al., 2017). For example, the Gardner relationship between density and velocity (Savino et al., 1980) is commonly used. By leveraging these intrinsic empirical relationships, one geophysical model can be converted into geophysical model in other physical properties, enabling the joint inversion of different methods. However, due to the effects of various parameters such as temperature and pressure on the rock properties of geological targets, it is challenging to accurately describe the physical property relationships of subsurface medium using empirical relationships. As a result, joint inversion based on petrophysical relationships tends to have significant uncertainties. There are also related studies that realize the physical property relations converge to the given priori physical property distribution centers by fuzzy c-mean clustering methods (Lelièvre et al., 2012; Carter-McAuslan et al., 2015; Sun and Li, 2016). However, such constraints often require a priori determination of the number of clusters and cluster centers, limiting their general applicability.
The coupling mechanism based on structural geometric similarities has been a hot topic in joint inversion research (Zhang and Morgan, 1997; Haber and Oldenburg, 1997; Gallardo and Meju, 2003; Molodtsov et al., 2011; Haber and Holtzman, 2013). Molodtsov et al. (2013) presented a 2-D joint inversion method based on parameters’ gradient dot product constraints with seismic traveltimes and MT data, this method needs a priori information of the two physical properties related to the specified inversed region, which limits its widespread application, Shi et al. (2018) improved the gradient dot product constraint and developed square cosine similarity coupling, which avoids the need for prior property directions. However, its mathematical properties are poor and can easily break down the inversion process. Joint total variation (JTV) (Haber and Holtzman, 2013) can be defined as L1,2 norm of the gradient of the model, JTV coupling can make the gradient direction between two models tend to be consistent, but its practicality diminishes in cases with complex background gradient variations. Cross-gradient constraints (Gallardo and Meju, 2003) have been widely used due to their ability to avoid priori assumptions about relationships on physical properties (Gallardo, 2007; Hu et al., 2009; Fregoso and Gallardo, 2009; Doetsch et al., 2010; Gallardo and Meju, 2011; Peng et al., 2013; Moorkamp et al., 2016; Gao and Zhang, 2018; Gross, 2019; Tavakoli et al., 2021; Franz et al., 2021).
Constraint inversion is a common manifestation of joint inversion, which is based on one method can provide the high accuracy of prior constraint information for other methods. The most common constraint inversion is to use the layer information determined by seismic migration profiles to constrain MT inversion. As seismic migration results mainly focus on characterizing underground physical property interfaces, it is more reasonable to use structural geometric similarities constraints rather than petrophysical relationships when introducing seismic migration results to constrain MT inversion. Therefore, the cross-gradient constraint has become an important way to couple seismic migration results with MT inversion as the cross- gradient constraint does not affect the free inversion of MT in areas without interface constraint information.
However, traditional cross-gradient coupling has the disadvantage of weak constraint effects. When the variations in physical properties between two models are in the same or opposite direction, or one or both of the models remains unchanged, the cross-gradient function disappears. In these cases, the magnitude of the variations has no effect on the value of the cross-gradient. Only when both properties change but in different directions, the cross-gradient value is nonzero. If one of the models undergoes small changes, which means the small value of its gradient. The cross-gradient values between the two models become small, resulting cross-gradient constraint a relatively weak structural coupling (Moorkamp et al., 2011).
The core issue causing weak cross-gradient constraint capability is its lack of adaptability in regions with weak data response and gradient change. To overcome the disadvantages of the traditional cross-gradient coupling, in this paper we develop an enhanced cross-gradient coupling that balances the gradient values and direction of property variations in the cross-gradient more effectively. It achieves this by employing the minimum support function (Portniaguine and Zhdanov, 1999) on the cross-gradient coupling. The mathematical properties of the minimum support functional can highlight the cross-gradient values when they are small. For some excessively large cross gradient values, the minimum support functional can be used to suppress them to a certain extent. Therefore, it can better balance the strength changes of the cross-gradient values. Finally, by minimizing the objective function, the cross-gradient distribution in the model space tends to be minimized, achieving similar inversion model construction.
In the second section, we first illustrate the principle of MCGS coupling through numerical experiment and compare it with other coupling methods in similar mathematical forms, In the fourth section, we conducted two block and nappe structure model experiments through the developed constrained inversion algorithm. In the fifth section, we applied MCGS constrained inversion to MT data in the Junggar Basin.
2 Theory
2.1 Basic theory
Cross-gradient constraint (Gallardo and Meju, 2003) is the most widely used coupling form in joint inversion (Equation 1).
The cross-gradient constraint term
When the geological targets exhibit strong structural similarity between different physical properties but face weak changes in the model (i.e., in regions where the gradients are small), a stronger constraint is needed to achieve results with higher structural similarity. To address some of the potential weaknesses of the cross-gradient term, the normalized cross-gradient (NCG) was designed to enhance constraint strength (Equation 2) (Haber and Modersitzki, 2006).
However, compared to the cross-gradient term, the derivatives of the normalized cross-gradient (NCG) term provide less obvious insight into its regularization behavior, and the NCG term often behaves as a concave operator numerically. This behavior may pose challenges in solving the joint inversion problem numerically (Crestel et al., 2018). The NCG coupling entirely removes the effect of the gradient value on the cross-gradient term; even if one of the gradients remains very small, it will still incur a penalty. Increasing the cross-gradient magnitudes without considering the gradient values may disrupt the coupling in joint inversion.
Finding an appropriate mathematical form to strengthen the cross-gradient operator in regions where the gradients are weak is crucial. Last and Kubik (1983) applied the minimum support function to regularization in geophysical inversion to obtain focused inverted results. This function can transform the values of the independent variable to a range between 0 and 1, thereby increasing the values of small variables after being supported. This process results in a more compact distribution of the independent variable, balancing it between 0 and 1. Molodtsov and Troyan (2017) and Zhdanov et al. (2021) proposed a joint minimum gradient support (JMGS) based on the minimum gradient support (Equation 3).
The effect of JMGS is to highlight the sharp boundaries of gradient changes in homogeneous targets. However, its application to problems in complex subsurface environments can be challenging. By combining the properties of the minimum support function and the cross-gradient, we propose a MCGS constraint (Equation 4).
We introduce the support of
Through Equation 5, it is obvious that
Thus, the integral
MCGS coupling minimizes the total area with nonzero departures from the cross-gradient. Consequently, a dispersed and smoothed distribution of the cross-gradient, where all values are not equal to zero, results in a large penalty function. In contrast, a well-focused distribution with a small departure yields a smaller penalty function. This approach also prevents MCGS from imposing excessive penalties on all regions with inconsistent gradient directions across the entire space, similar to the NCG coupling.
2.2 Theoretical model test
To better illustrate the mathematical mechanisms, we designed a set of theoretical models and compared them with various joint inversion coupling methods. Model 1 (Figure 1A) represents a gradient background that varies along the y-axis, with values decreasing from 3 to 1 following a quadratic function, simulating a gradually decreasing gradient with depth. Model 2 (Figure 1B) represents a radially varying circular target, where values change uniformly from 9 at the center to 1 at the outer boundary, simulating gradient variations in different directions. We then calculated the cross-gradient values for these two models (Figure 1C).

Figure 1. Theoretical model test. (A) Longitudinal variation gradient model. (B) Radial variation gradient model. (C) Cross-gradient value of (A, B).
It is evident that as the depth increases, the gradient value gradually decreases. When the gradient direction of the two models remains significant, the cross-gradient value is very small, indicating that the constraint effect of the cross-gradient on regions with weak gradient values is limited. We calculated the NCG and JMGS coupling results between Model 1 and Model 2. The NCG result (Figure 2A) shows that the penalized region exhibits a lack of influence from the gradient value, leading to a uniform distribution in space. This approach partially addresses the issue of weak constraint capabilities of the cross-gradient in regions with low gradients; however, it may disrupt the joint inversion process. The JMGS method also demonstrates effectiveness in weak gradient regions (Figures 2B, C), but it penalizes areas outside the target in Model 2. This additional penalty for non-homologous regions is undesirable.
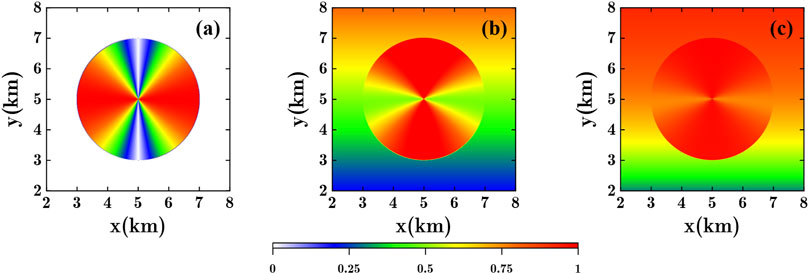
Figure 2. Theoretical model test. (A) NCG coupling result (B) JMGS coupling result (
We also calculated the MCGS results for these two models with focusing parameters
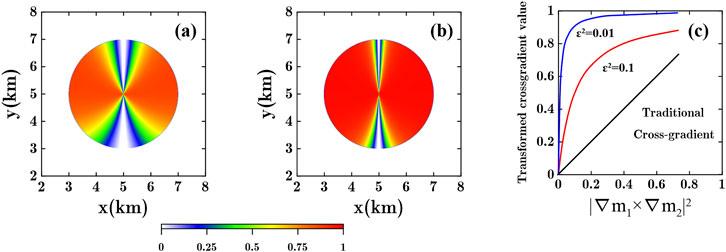
Figure 3. Theoretical model test. (A) MCGS coupling result (
By comparing the results of the various coupling methods mentioned above, it is evident that the MCGS coupling mechanism possesses significant characteristics and advantages in balancing the effects of gradient values in the cross-gradient. MCGS demonstrates a similar ability to NCG coupling in enhancing the cross-gradient constraint in regions with weak physical property changes. Unlike the non-convex operator NCG, the operator MCGS can better ensure the stability of the inversion process.
3 Inversion algorithm
The MT forward modeling is based on finite-element method (FEM) (Wannamaker, 1987), and uses reciprocity to calculate the Jacobian matrix (De Lugao and Wannamaker 1996), the inversion code we use is OCCAM2DMT (Constable et al., 1987; deGroot-Hedlin and Constable, 1990).
deGroot-Hedlin and Constable (1990) established an inversion objective function based on smooth model constraints within the OCCAM method (Equation 7)
4 Synthetic model tests
To provide a more intuitive demonstration of the mechanism and effectiveness of MCGS coupling, we designed two synthetic experiments in this section. The double-block model is used to illustrate the rationale behind the construction of MCGS coupling, by comparing the constrained inversion results from different constraint models with those from traditional cross-gradient coupling. The single anomaly model is employed to demonstrate the effectiveness of this method in joint inversion, again in comparison to traditional cross-gradient constraints. Additionally, we designed a complex nappe structure model, where a high-resistivity layer located at 7 km serves as the imaging target. The purpose of this model is to show that MCGS provides a stronger constraint effect than traditional cross-gradients in regions with weak MT sensitivity and low model variation values.
We set an error-fitting threshold as the iteration stopping criterion for MT inversion. The iterations will stop when the error-fitting threshold is met or when the maximum number of iterations is reached. The root mean square (RMS) error formula for MT inversion is defined as Equation 9:
We measure the structural similarity between the inversion results and the true models using residual cross-gradients (RCG). A smaller RCG value indicates a higher structural similarity between the two models. Additionally, we use the model recovery degree (RD) (Zhang et al., 2012) to evaluate the inversion results (Equation 10).
4.1 Double-block test
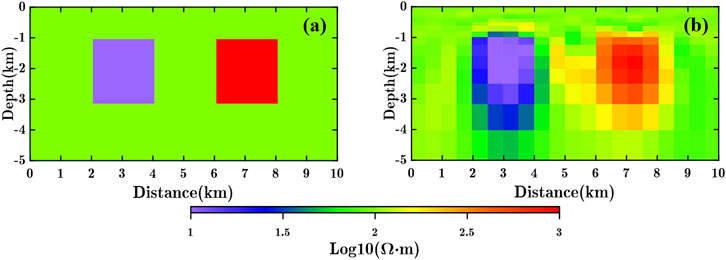
The double-block model consists of a 1,000 Ω·m high-resistivity target and a 10 Ω·m high-conductivity target within a uniform background of 100 Ω·m (Figure 4A). The grid for MT inversion was discretized into 37 × 48 cells in the model region, while the cells outside the model region are extended to satisfy the boundary conditions of MT modeling (Wannamaker et al., 1987). We placed 21 observation stations on the surface, spaced equally at 0.5 km intervals. The data used for the inversions include both TE and TM modes, with 24 frequencies ranging from 1×10⁻²∼1×10² Hz. The apparent resistivity and impedance phase synthetic data were both contaminated with 2% Gaussian random noise. The MT inversion started with an infinite half-space of 100 Ω·m, and the free inversion result is presented in Figure 4B.
We first used the weak gradient-contrast model (which represents weak gradient difference between the constraint information between high resistivity and low resistivity blocks) as the constraint model for inversion (Figure 6A). We performed cross-gradient and MCGS coupling constrained inversion with
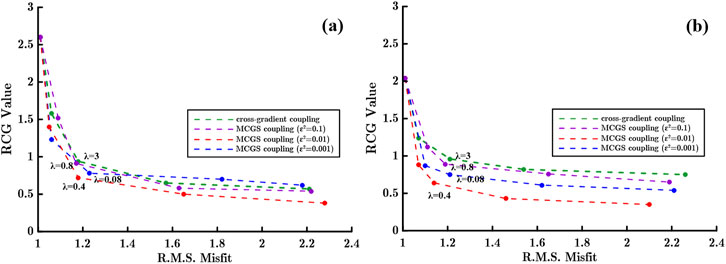
Figure 5. L-curves for λ determination. (A) L-curve in true model constrained inversion. (B) L-curve in adjusted model constrained inversion.
Finally, we determined
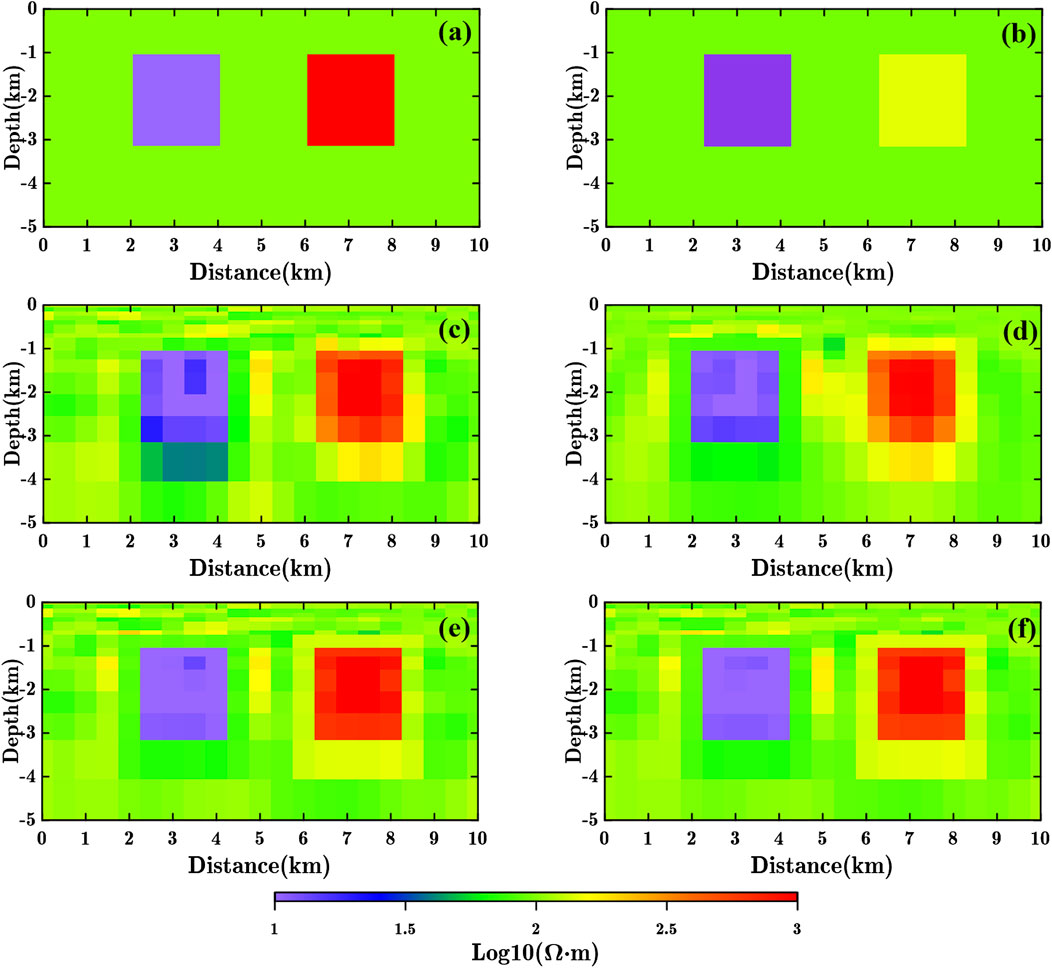
Figure 6. Double-block model constrained inversion results. (A) Constraint model (true model). (B) Constraint model (adjusted model). (C) Cross-gradient constrained inversion result using true model constraint. (D) Cross-gradient constrained inversion result using adjusted model constraint. (E) MCGS (
One of the advantages of MCGS coupling is its ability to better balance the uneven cross-gradient values between strong and weak gradient values. To better demonstrate this advantage, we designed the strong gradient-contrast model constraint test (which represents strong gradient difference between the constraint information between high resistivity and low resistivity blocks), we adjusted the model used for constraints, setting the low resistivity block physical property value to 3 Ω·m (approximately 0.5 in base 10 logarithm resistivity), the high resistivity block physical property value to 200 Ω·m (approximately 2.3 in base 10 logarithm resistivity), while maintaining the background resistivity at 100 Ω·m (Figure 6B). Since OCCAM inversion employs base 10 logarithm resistivity values, the cross-gradient value of the low resistivity block is approximately five times that of the high resistivity block relative to the background resistivity of 100 Ω·m. This adjustment aims to simulate the numerical imbalance between the cross-gradient values caused by strong gradient-contrast prior constraint information, a situation commonly encountered in field studies.
The parameter selection method for constrained inversion aligns with the previous section (Figure 5B). The cross-gradient and MCGS constrained inversion results are presented in Figure 11, where the RD of the cross-gradient constrained inversion result is 0.18. From the cross-gradient constrained inversion results (Figure 6D), it is evident that the constraint effect of the low resistivity model has significantly improved. Compared to using a 10 Ω·m real model for constraint, the constrained inversion result utilizing a 3 Ω·m model is closer to the actual model. However, in contrast to using a 100 Ω·m real model for constraint, the high resistivity model exhibits poorer constraint effectiveness, as the adjusted constraint model results in a significant numerical difference in the cross-gradient values between high and low resistivity blocks.
The MCGS constrained inversion result (Figure 6F) demonstrates that focusing on the imbalanced cross-gradient can better address the numerical discrepancies caused by variations in physical properties. The RD of the MCGS constrained inversion is 0.13, which is comparable to the RD obtained using a real model for MCGS constrained inversion. MCGS coupling can yield results similar to those achieved with weak gradient-contrast constraint information in situations where the constraint information has strong gradient-contrast.
4.2 Nappe structure model
Improving the constraint effect on regions with weak physical property variations is another significant advantage of MCGS coupling. In this section, we designed two deep nappe structure model tests to illustrate this point. The two overlay construction models we designed correspond to two target layers with different physical properties located at a depth of about 8 km. Figure 7A depicts the low resistivity target layer, while Figure 8A depicts the high resistivity target layer, resistivity values of all layers in both models are consistent except for the target layer. We placed 37 observation stations on the surface, equally spaced at 0.5 km intervals, The data used for the inversions were collected in both TE and TM modes, encompassing 40 frequencies over a range of 5.5 × 10⁻⁴ ∼ 3.2 × 10² Hz, the apparent resistivity and impedance phase data both contaminated with 2% gaussian random noise.
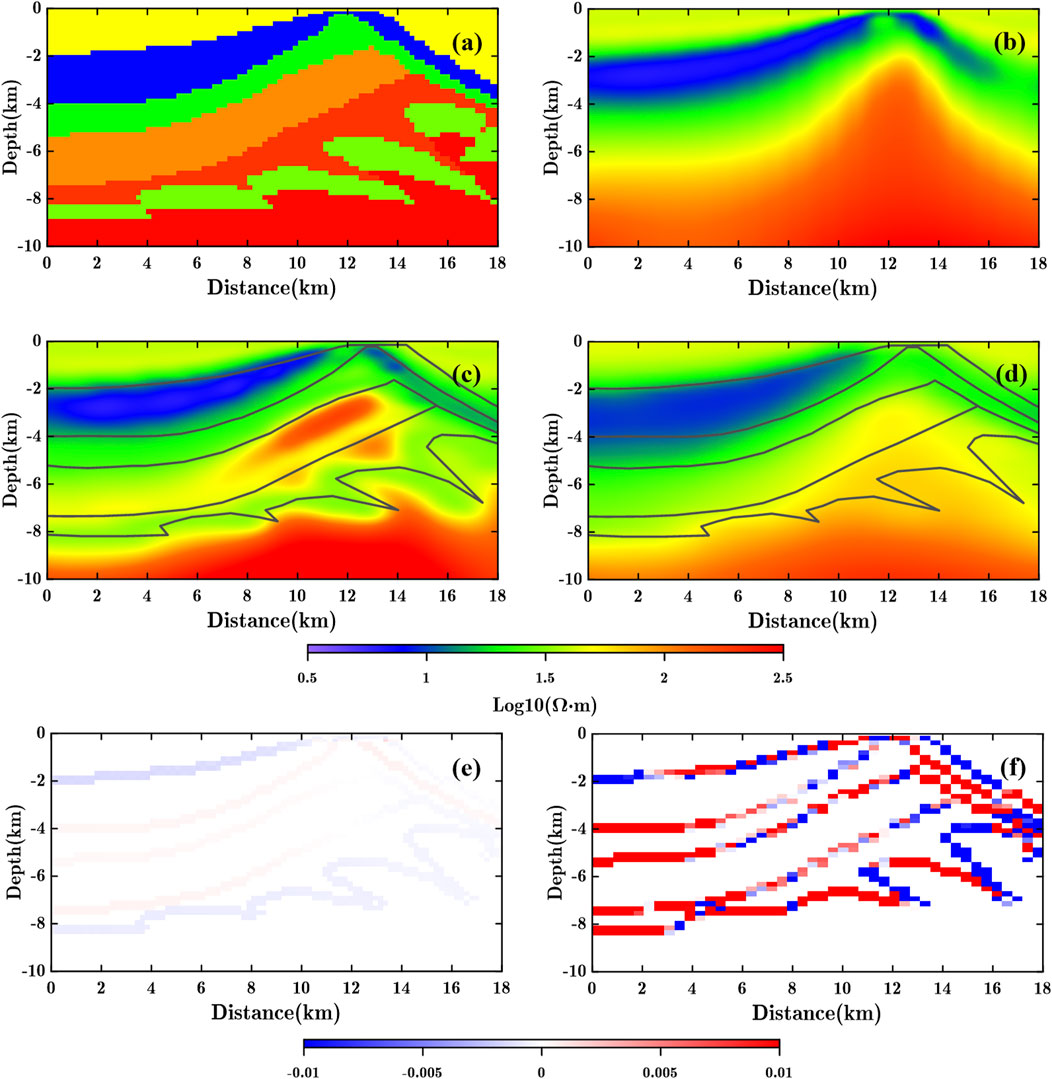
Figure 7. Low resistivity target layer nappe structure model test. (A) True model. (B) Free inversion result. (C) MCGS (
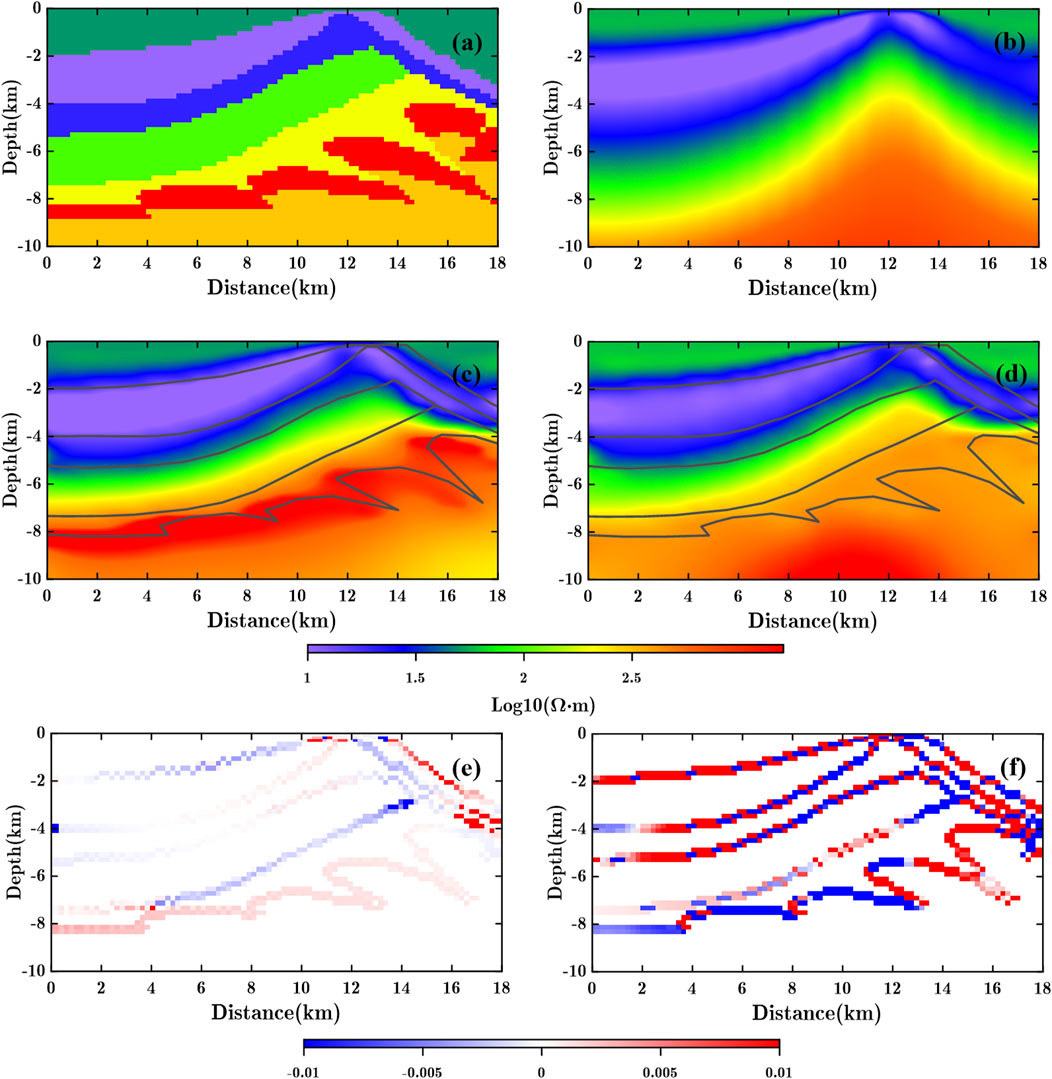
Figure 8. High resistivity target layer nappe structure model test. (A) True model. (B) Free inversion result. (C) MCGS (
The identification of deep target bodies has always been a challenging aspect of MT inversion. Deep target bodies exhibit weak responses to data, limited model correction, and subtle variations in physical properties during the inversion process, which restricts the ability to characterize these deep targets.
The free inversion results for low the resistivity (Figure 7B) and high resistivity (Figure 8B) target layer models, after 13 and 12 iterations respectively. Neither inversion result successfully characterizes the target layer, and the resolution at the depth of the target layer is insufficient, thus, constrained inversion using prior information is necessary for accurate characterization. We utilize the region above the target layer as known prior information for the constrained inversion, while the area below the top of the target layer lacks constrained information (indicated by the grey solid lines in Figures 7, 8).
We select
5 Field applications
5.1 Research background
The Junggar Basin and its surrounding areas are located in northern Xinjiang, situated between the Tarim Plate, the Kazakhstan Plate, and the Siberian Plate, and belong to the ancient Asian Ocean tectonic domain. The Junggar Basin is also a significant oil-bearing region in western China, preserving important records of tectonic movement and rich oil and gas resources, making it a key area of study. Based on the structural characteristics of the Permian system within the basin and subsequent structural modifications, the Junggar Basin is divided into six primary structural units: the Western Uplift (WU), the Eastern Uplift (EU), the Luliang Uplift (LU), the North Tianshan Thrust Belt (NTTB), the Central Depression (CD), and the Wulungu Depression (WD) (Figure 9). The Junggar Basin has undergone several evolutionary stages, including the formation of its basement before the Carboniferous, the transitional development during the Carboniferous-Permian, the development of the Mesozoic-Paleogene inland lake basin, and the intense compression during the Neogene-Quaternary periods (He et al., 1994). From the late Paleozoic to the early Mesozoic, the Junggar Basin was once a marine environment where sedimentary layers were formed. With the collision of the Indian Plate and the Eurasian Plate, the sea area was gradually compressed into land. Under the influence of tectonic activity, the basin’s crust was uplifted, forming mountains and plateaus. A major tectonic transformation occurred in the late Tertiary, establishing the current basement structural morphology of the Junggar Basin.
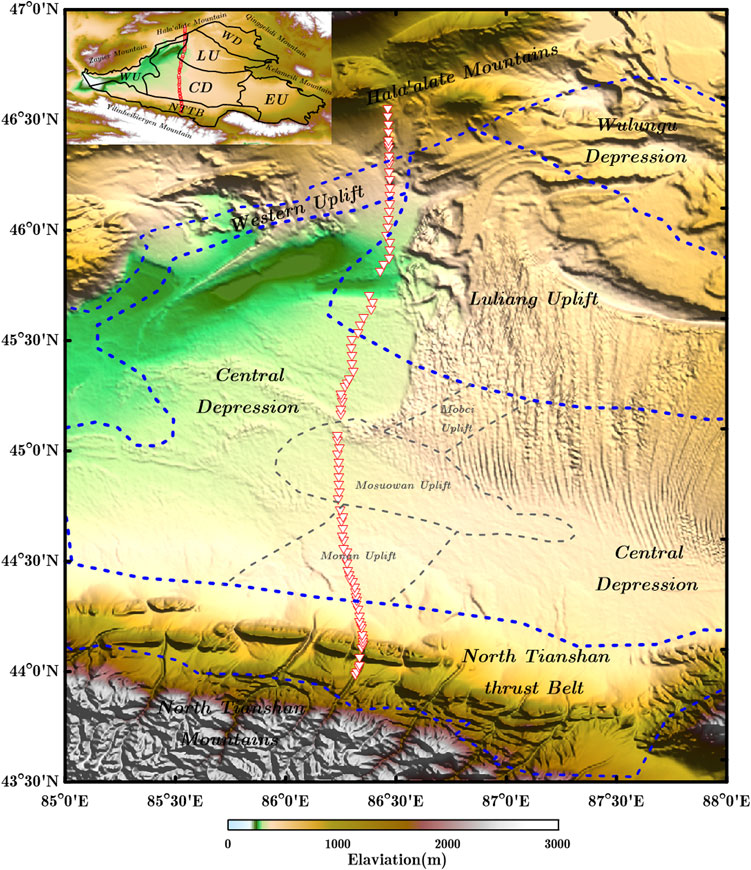
Figure 9. Topographic map of the Junggar basin. Red triangles indicate the location of MT observation stations, blue dash lines indicate the boundary of first-order structural unit, grey dash lines indicate the boundary of second-order structural unit.
Over the past 20 years, significant progress has been made in studying the deep electrical structures of the Junggar Basin. The Xinjiang Petroleum Administration conducted MT soundings in the central part of the basin, completing three large-scale MT profiles across the entire area. In the late 1990s, the Geological Survey of the Petroleum Geophysical Exploration Bureau acquired six MT profiles. Luo et al. (2020) used MT sounding to infer the distribution characteristics of the Carboniferous in the Urumqi Depression in the northern Junggar Basin. They divided the Junggar Basin’s subsurface to a depth of over 30 km into three distinct electrical layers: the sedimentary overburden, the Hercynian basement, and the Precambrian crystalline basement (also referred to as the Neoarchean to Mesoproterozoic basement).
5.2 Data processing
The data we used comes from the “xj9201”MT survey line collected by Tongji University, located in the central Junggar Basin. The survey line runs from south to north, passing through the NTTB, CD, and LU, with a length of 292 km. The red triangles in Figure 9 represent the locations of MT measurement points, with a total of 87 observation stations and 40 frequencies ranging from 5.5 × 10⁻⁴ to 3.2 × 10² Hz.
We present the apparent resistivity and impedance phase profiles along the survey line (Figure 10). Due to limitations in data collection, data below 2 × 10−³ Hz are incomplete; therefore, we primarily used data at frequencies higher than 2 × 10−³ Hz. The apparent resistivity profile (Figures 10A, C) shows an increasing trend in resistivity values from south to north along the survey line, with values also increasing gradually with depth. The shallow sections of these profiles are predominantly conductive, while the main anomalies in the deeper sections are characterized by high resistivity. To mitigate the influence of distorted currents, we applied GB decomposition (Groom and Bailey, 1989) to the collected impedance data. The inversion results presented in this section are based on joint TM and TE mode inversion, with an error floor set at 5% and an initial model of a uniform half-space of 10 Ω·m throughout the inversion process. The stopping criteria for the iterations are consistent with those used in the previous model tests.
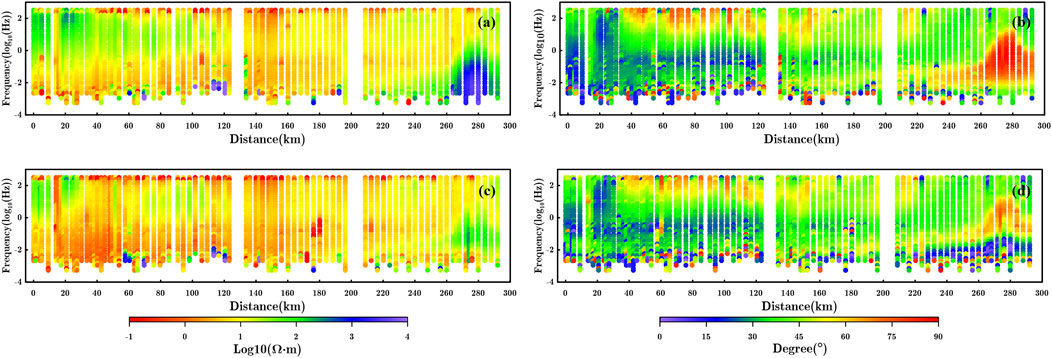
Figure 10. Observation data. (A) TE mode apparent resistivity. (B) TE mode impedance phase. (C) TM mode apparent resistivity. (D) TM mode impedance phase.
The geological model used for the constrained inversion is shown in Figure 11. It includes constraints from six sedimentary strata, ranging from the Neogene to the Permian, with different colors representing different stratigraphic ages. There are no constraints below the Permian sedimentary layers, so we only present geological profiles with a depth of less than 15 km. Electrical property statistics for each stratigraphic age are also provided in Figure 11. The physical properties of the constraint model we use are derived from the statistical data of the formation velocity in the region. We assign the statistic formation velocity to each formation for constrained inversion. Although we did not use actual resistivity values for the constraints, we demonstrated in previous model tests that MCGS constraints are far less sensitive to the strength of gradient values in constraint information compared to traditional cross-gradient constraints.

Figure 11. Priori constraint model. Grey dash lines represent the boundary of the geological stratum, the table shows the statistical data of resistivity values in different geological stratum; Q-Quaternary; N-Neogene; E-Paleogene; K-Cretaceous; J-Jurassic; T-Triassic; P-Permian.
5.3 Inversion
The result of the free inversion (Figure 12B) show a reduction in the error from 14.81 to 2.84 after 9 iterations. We marked the Permian constraint interface with a black dashed line in the inversion results, indicating that the free inversion accurately reflects the positions of the sedimentary layers and the high-resistivity crystalline basement beneath. Additionally, the deep electrical structures exhibit distinct horizontal block-like characteristics. While the free inversion effectively portrays the geoelectric model of the area, it fails to accurately capture the resistivity differences between different layers within the sedimentary strata, and inaccuracies in the shallow resistivity structures may also influence the morphology of the deeper electrical structures. Therefore, we applied the prior sedimentary layer model shown in Figure 11 for constrained inversion. The coupling weights for MCGS and cross-gradient were set to 1 and 10, respectively, with a focusing factor of 0.01. The parameter selection was based on a trade-off between residual cross-gradient values and data fitting, consistent with the approach used in the model tests.
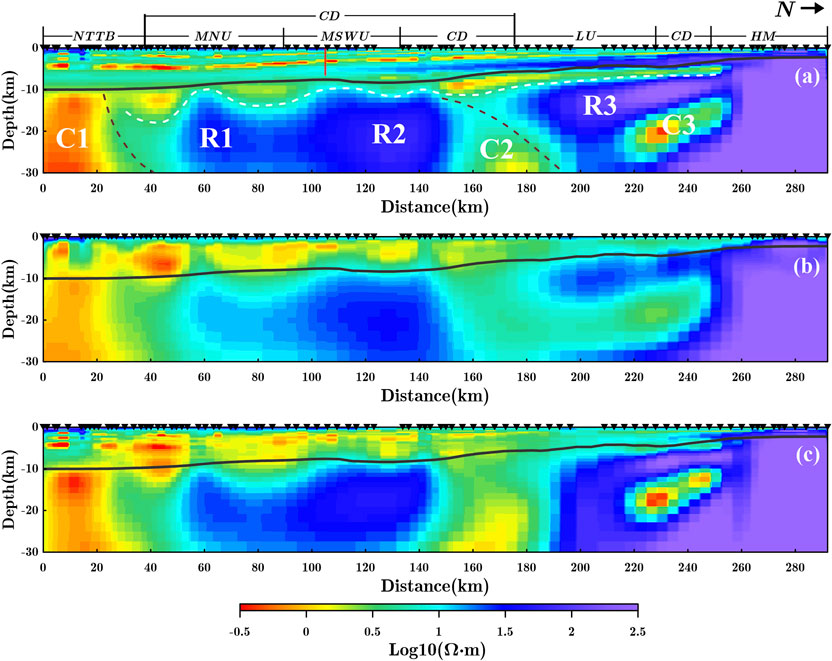
Figure 12. Inversion result of survey line “xj9201”. (A) MCGS (
The results of the MCGS and cross-gradient coupling constraints are shown in Figures 12A, C. The cross-gradient constrained inversion reduced the data misfit from 14.81 to 2.79 after 14 iterations, while the MCGS constrained inversion reduced the misfit from 14.81 to 2.65 after 16 iterations. The applicability of cross-gradient coupling is limited in real-world datasets with uneven gradient distributions and complex variation directions of properties, leading to weak constraint capabilities and an inability to accurately depict the electrical structures of sedimentary layers from different ages (Figure 12C). In contrast, the MCGS constrained inversion result (Figure 12A) shows that MCGS coupling effectively incorporates constraint information into the inversion, clearly illustrating the electrical structure distribution of sedimentary layers of varying ages. Compared to free inversion and cross-gradient constraints, MCGS constrained inversion exhibits a superior ability to accurately characterize the electrical structures of sedimentary layers through stratigraphic constraint information.
Additionally, when we compared the inversion results with actual logging data (Figure 13), the MCGS constrained inversion result showed better agreement with the logging data, accurately depicting the layered electrical structure within the sedimentary layers. In contrast, the free inversion result failed to characterize these typical layered structures. Thus, the interpretations in the following chapters are all based on the MCGS constrained inversion result (Figure 12A).
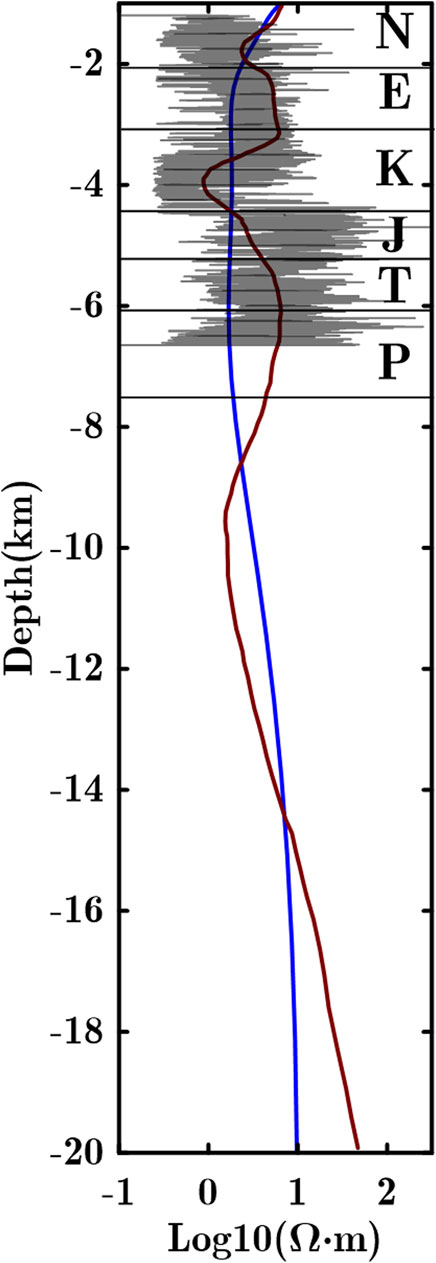
Figure 13. Comparison between logging curve and inversion results. Grey solid line-logging curve; Red solid line-MCGS constrained inversion result; Blue solid line-free inversion result.
5.4 Interpretation
When performing MCGS constrained inversion, there is no constraint applied between the Neogene and Quaternary sedimentary layers. However, from the inversion result profile, a distinct stratified distribution emerges, with high resistivity at the top and low resistivity at the bottom within the Neogene and overlying strata. The shallower Quaternary sediments and deeper Neogene sediments correspond to the high resistivity and high conductivity layers above the first constraint interface (Neogene), which aligns with the resistivity property statistics in Figure 11. At the southern end of the survey line, the resistivity of the Paleogene strata is higher than that of the Neogene strata. As the Paleogene and Neogene strata thin toward the north, the resistivity of the Paleogene strata decreases and becomes similar to that of the Neogene. Below the Paleogene, the Cretaceous strata present a clear set of high conductivity layers, with physical properties ranging from 0 to 10 Ω·m, as shown in Figure 11. On the inversion result profile (Figure 12C), this high conductivity characteristic of the Cretaceous strata is clearly visible, distinguishing it from the Paleogene and Jurassic strata.
The boundary between the Jurassic, Triassic, and Permian strata is less distinct in the southern part of the survey line. The resistivity values of the Jurassic and Triassic strata are slightly higher than those of the Permian, but in the northern part of the survey line, the Permian strata show an increase in resistivity, exceeding that of the Jurassic and Triassic. The MCGS constrained inversion effectively distinguishes the Permian from the strata below. Beneath the Permian and above the high-resistivity crystalline basement, there exists a discontinuous layer (marked on the Figure 12A by white dash line). This layer is neither part of the Permian nor the crystalline basement, and we speculate that it could be a remnant of the Carboniferous strata. Due to its deep burial and proximity to the high-resistivity basement, it is challenging to characterize this layer on seismic migration profiles. It is evident that the lateral depth of these strata, located above the high-resistivity basement beneath the Permian, varies significantly, and their resistivity distribution exhibits lateral block-like characteristics. This suggests that the Carboniferous strata experienced intense tectonic activity, leading to their discontinuous distribution. Furthermore, there is a notable difference in resistivity between the potential Carboniferous remnants in the LU area and the overlying Permian strata. This difference could be attributed to the development of regional unconformities between the Carboniferous and Permian in the LU and northern regions, resulting in the strong erosion of Upper Carboniferous and some Lower Carboniferous strata, as suggested by He et al. (2013).
Through the application of MCGS coupling, we achieved a more precise characterization of the electrical structure of the sedimentary layers in this section. The improved accuracy of shallow electrical structures contributes to a better understanding of the deep electrical structures. These deep structures reflect the geological evolution of basement formation in the Junggar Basin prior to the Carboniferous period. The inversion result highlight two ocean-continent subduction zones. The three conductors, C1, C2, and C3, represent the subduction remnants of the South Junggar Ocean (SJO) and the Karamaili Ocean (KO), respectively. Due to the large amounts of fluid released during oceanic crust subduction, C1, C2, and C3 exhibit high conductivity characteristics. During the Carboniferous period, the hinterland of the Junggar Basin mainly consisted of the Mosuowan juvenile crust, which was distributed within the Paleo-Asian Ocean (He et al., 2013). The SJO subducted toward the continental crust, forming the resistor volcanic island arc R1, and the fluids released from subduction led to the formation of the C1 conductor. The resistor R2 corresponds to the Mosuowan juvenile crust. The conductors C2 and C3, located beneath the continental ridge uplift, may represent the residual oceanic crust of the KO, which closed during the Carboniferous. The resistor R3 further suggests the juvenile continental crust that was subducted northward by the KO.
6 Conclusion
In this paper, to address the issue of the weak constraint effect of cross-gradient coupling in regions with weak gradients, we developed a new constraind inversion coupling method based on MCGS coupling, which applies a minimum support function to enhance traditional cross-gradient coupling. In theoretical model tests, we compared it with NCG coupling (Haber and Modersitzki, 2006), which reduces the influence of gradient values on cross-gradient coupling but is limited by its non-convexity. We also compared JMGS coupling (Molodtsov and Troyan, 2017), which, like MCGS, uses a minimum support function. JMGS can also support weak gradients, but its applicability to constrained inversion in complex geological settings is limited, making it more suitable for cases with more comprehensive prior information and high gradient orientation consistency. In contrast, MCGS has broader applications.
To verify the effectiveness of MCGS coupling, we conducted two synthetic model experiments. First, we applied it to a double-block model, and the results demonstrated that MCGS coupling enhances structural similarity between the inversion results and the true model, partially overcoming the limitations of cross-gradient coupling as a weak structural constraint. It also proves that MCGS can maintain good constraint effects even with strong gradient contrast in prior information. Next, we designed two complex nappe models, corresponding to high resistivity and low resistivity target layers at depth, to verify the advantages of MCGS in addressing insufficient deep resolution and weak response areas in the observation data compared to traditional cross-gradient coupling. In both models, MCGS coupling allowed for the clear characterization of deep target layers, while cross-gradient constrained inversion failed to reveal the electrical structure of these layers.
Finally, we applied MCGS coupling to MT field data from the Junggar Basin, utilizing prior stratigraphic information for constrained inversion. The traditional cross-gradient inversion results exhibited a weak constraint effect, while the MCGS-constrained inversion results clearly depicted the geoelectric structure among the prior stratigraphic layers and it had good correspondence with logging data. Compared to free inversion and traditional cross-gradient coupling, MCGS coupling significantly improved the characterization of shallow electrical structures and provided more accurate depictions of deep electrical structures, offering new geophysical evidence for the development of an evolutionary model for the Junggar Basin.
Data availability statement
All the data and inversion codes used in this paper is available by contacting the corresponding author, the OCCAM2DMT code is available at https://marineemlab.ucsd.edu/Projects/Occam/2DMT/index.html.
Author contributions
ZH: Conceptualization, Formal Analysis, Investigation, Methodology, Software, Writing–original draft. PY: Conceptualization, Data curation, Formal Analysis, Funding acquisition, Investigation, Methodology, Project administration, Resources, Supervision, Validation, Visualization, Writing–review and editing. CZ: Conceptualization, Formal Analysis, Funding acquisition, Investigation, Supervision, Validation, Visualization, Writing–review and editing. LZ: Funding acquisition, Methodology, Software, Supervision, Writing–review and editing. HS: Investigation, Resources, Software, Validation, Writing–review and editing.
Funding
The author(s) declare that financial support was received for the research, authorship, and/or publication of this article. We express our sincere gratitude to General Program of National Natural Science Foundation of China (under Grant No. 42474105), the Geological Joint Fund of National Natural Science Foundation of China (Key Fund Project, under Grant No. U2344203), General Program of National Natural Science Foundation of China (under Grant No. 42074079), Major Project of China National Petroleum Corporation (under Grant No. 2023ZZ05-05), The Jiangsu Province Carbon Peak Carbon Neutral Technology Innovation Project in China (under Grant No.BE2022034-3).
Conflict of interest
The authors declare that the research was conducted in the absence of any commercial or financial relationships that could be construed as a potential conflict of interest.
Generative AI statement
The author(s) declare that no Generative AI was used in the creation of this manuscript.
Publisher’s note
All claims expressed in this article are solely those of the authors and do not necessarily represent those of their affiliated organizations, or those of the publisher, the editors and the reviewers. Any product that may be evaluated in this article, or claim that may be made by its manufacturer, is not guaranteed or endorsed by the publisher.
References
Carter-McAuslan, A., Lelièvre, P. G., and Farquharson, C. G. (2015). A study of fuzzy c-means coupling for joint inversion, using seismic tomography and gravity data test scenarios. Geophysics 80 (1), W1–W15. doi:10.1190/geo2014-0056.1
Colombo, D., and De Stefano, M. (2007). Geophysical modeling via simultaneous joint inversion of seismic, gravity, and electromagnetic data: application to prestack depth imaging. Lead. Edge 26 (3), 326–331. doi:10.1190/1.2715057
Constable, S. C., Parker, R. L., and Constable, C. G. (1987). Occam’s inversion: a practical algorithm for generating smooth models from electromagnetic sounding data. Geophysics 52 (3), 289–300. doi:10.1190/1.1442303
Crestel, B., Stadler, G., and Ghattas, O. (2018). A comparative study of structural similarity and regularization for joint inverse problems governed by PDEs. Inverse Probl. 35 (2), 024003. doi:10.1088/1361-6420/aaf129
deGroot-Hedlin, C., and Constable, S. (1990). Occam’s inversion to generate smooth, two-dimensional models from magnetotelluric data. Geophysics 55 (12), 1613–1624. doi:10.1190/1.1442813
de Lugao, P. P., and Wannamaker, P. E. (1996). Calculating the two-dimensional magnetotelluric Jacobian in finite elements using reciprocity. Geophys. J. Int. 127 (3), 806–810. doi:10.1111/j.1365-246x.1996.tb04060.x
Doetsch, J., Linde, N., Coscia, I., Greenhalgh, S. A., and Green, A. G. (2010). Zonation for 3D aquifer characterization based on joint inversions of multimethod crosshole geophysical data. Geophysics 75 (6), G53–G64. doi:10.1190/1.3496476
Franz, G., Moorkamp, M., Jegen, M., Berndt, C., and Rabbel, W. (2021). Comparison of different coupling methods for joint inversion of geophysical data: a case study for the Namibian continental margin. J. Geophys. Res. Solid Earth 126 (12), e2021JB022092. doi:10.1029/2021jb022092
Fregoso, E., and Gallardo, L. A. (2009). Cross-gradients joint 3D inversion with applications to gravity and magnetic data. Geophysics 74 (4), L31–L42. doi:10.1190/1.3119263
Gallardo, L. A. (2007). Multiple cross-gradient joint inversion for geospectral imaging. Geophys. Res. Lett. 34 (19). doi:10.1029/2007gl030409
Gallardo, L. A., Fontes, S. L., Meju, M. A., Buonora, M. P., and De Lugao, P. P. (2012). Robust geophysical integration through structure-coupled joint inversion and multispectral fusion of seismic reflection, magnetotelluric, magnetic, and gravity images: example from Santos Basin, offshore Brazil. Geophysics 77 (5), B237–B251. doi:10.1190/geo2011-0394.1
Gallardo, L. A., and Meju, M. A. (2003). Characterization of heterogeneous near-surface materials by joint 2D inversion of dc resistivity and seismic data. Geophys. Res. Lett. 30 (13). doi:10.1029/2003gl017370
Gallardo, L. A., and Meju, M. A. (2011). Structure-coupled multiphysics imaging in geophysical sciences. Rev. Geophys. 49 (1). doi:10.1029/2010rg000330
Gao, J., and Zhang, H. (2018). An efficient sequential strategy for realizing cross-gradient joint inversion: method and its application to 2-D cross borehole seismic traveltime and DC resistivity tomography. Geophys. J. Int. 213 (2), 1044–1055. doi:10.1093/gji/ggy026
Groom, R. W., and Bailey, R. C. (1989). Decomposition of magnetotelluric impedance tensors in the presence of local three-dimensional galvanic distortion. J. Geophys. Res.: Solid Earth 94 (B2), 1913–1925.
Gross, L. (2019). Weighted cross-gradient function for joint inversion with the application to regional 3-D gravity and magnetic anomalies. Geophys. J. Int. 217 (3), 2035–2046. doi:10.1093/gji/ggz134
Haber, E., and Holtzman Gazit, M. (2013). Model fusion and joint inversion. Surv. Geophys. 34, 675–695. doi:10.1007/s10712-013-9232-4
Haber, E., and Modersitzki, J. (2006). “Intensity gradient based registration and fusion of multi-modal images,” in Medical Image Computing and Computer-Assisted Intervention–MICCAI 2006: 9th International Conference, Copenhagen, Denmark, October 1-6, 2006. Proceedings, Part II (Berlin Heidelberg: Springer), 726–733.
Haber, E., and Oldenburg, D. (1997). Joint inversion: a structural approach. Inverse probl. 13 (1), 63–77. doi:10.1088/0266-5611/13/1/006
He, D. F., Li, D., Fan, C., and Yang, X. F. (2013). Geochronology, geochemistry and tectonostratigraphy of carboniferous strata of the deepest well moshen-1 in the Junggar Basin, northwest China: insights into the continental growth of central asia. Gondwana Res. 24 (2), 560–577. doi:10.1016/j.gr.2012.10.015
He, G. Q., Liu, D. C., Li, M. S., Tang, Y. L., and Zhou, R. H. (1994). Paleozoic crustal evolutions and mineralization. Hong Kong: Xinjiang People’s Publishing House, Urumqi and Culture and Education Press of Hong Kong. 437.
Heincke, B., Jegen, M., and Hobbs, R. (2006). “Joint inversion of MT, gravity and seismic data applied to sub-basalt imaging,” in SEG technical Program expanded abstracts 2006 (Society of Exploration Geophysicists), 784–789.
Heincke, B., Jegen, M., Moorkamp, M., Hobbs, R. W., and Chen, J. (2017). An adaptive coupling strategy for joint inversions that use petrophysical information as constraints. J. Appl. Geophys. 136, 279–297. doi:10.1016/j.jappgeo.2016.10.028
Hu, W., Abubakar, A., and Habashy, T. M. (2009). Joint electromagnetic and seismic inversion using structural constraints. Geophysics 74 (6), R99–R109. doi:10.1190/1.3246586
Huang, Y., Moorkamp, M., Gao, J., and Zhang, H. (2023). Seismogenic structure of the 2014 M6.5 Ludian earthquake from three-dimensional joint inversion of magnetotelluric data and seismic arrival times. J. Geophys. Res. Solid Earth 128, e2022JB026151. doi:10.1029/2022jb026151
Last, B. J., and Kubik, K. (1983). Compact gravity inversion. Geophysics 48 (6), 713–721. doi:10.1190/1.1441501
Lelièvre, P. G., Farquharson, C. G., and Hurich, C. A. (2012). Joint inversion of seismic traveltimes and gravity data on unstructured grids with application to mineral exploration. Geophysics 77 (1), K1–K15. doi:10.1190/geo2011-0154.1
Luo, W., Zhifang, H. U., Guilin, L. I., Xiaopeng, YANG, Lanfang, H. E., Yang, Y., et al. (2022). Carboniferous strata and their oil and gas prospects from Wulungu depression to the north uplift in the Junggar Basin based on magnetotelluric technology. Geol. CHINA 49 (5), 1591–1604. doi:10.12029/gc20220515
Molodtsov, D., Kashtan, B., and Roslov, Y. (2011). “Joint inversion of seismic and magnetotelluric data with structural constraint based on dot product of image gradients,” in SEG International Exposition and Annual Meeting. SEG-2011. (SEG).
Molodtsov, D., and Troyan, V. (2017). “Multiphysics joint inversion through joint sparsity regularization,” in SEG International Exposition and Annual Meeting. SEG-2011. (SEG).
Molodtsov, D. M., Troyan, V. N., Roslov, Y. V., and Zerilli, A. (2013). Joint inversion of seismic traveltimes and magnetotelluric data with a directed structural constraint. Geophys. Prospect. 61, 1218–1228. doi:10.1111/1365-2478.12060
Moorkamp, M., Heincke, B., Jegen, M., Hobbs, R. W., and Roberts, A. W. (2016). Joint inversion in hydrocarbon exploration. Integr. imaging earth Theory Appl., 167–189. doi:10.1002/9781118929063.ch9
Moorkamp, M., Heincke, B., Jegen, M., Roberts, A. W., and Hobbs, R. W. (2011). A framework for 3-D joint inversion of MT, gravity and seismic refraction data. Geophys. J. Int. 184 (1), 477–493. doi:10.1111/j.1365-246x.2010.04856.x
Peng, M., Tan, H.-D., Jiang, M., Qian, H., and Tan, J.-Y. (2013). Three-dimensional joint inversion of magnetotelluric and seismic travel time data with cross-gradient constraints. Chin. J. Geophys. 56 (8), 2728–2738. doi:10.6038/cjg20130821
Portniaguine, O., and Zhdanov, M. S. (1999). Focusing geophysical inversion images. Geophysics 64 (3), 874–887. doi:10.1190/1.1444596
Rawlinson, N., Pozgay, S., and Fishwick, S. (2010). Seismic tomography: a window into deep Earth. Phys. Earth Planet. Interiors 178 (3-4), 101–135. doi:10.1016/j.pepi.2009.10.002
Savino, J. M., Rodi, W. L., and Masso, J. F. (1980). Simultaneous inversion of multiple geophysical data sets for earth structure. Present. A. T. 50th Ann. Internat. Mtg., Soc. Explor. Geophys.
Shi, B., Yu, P., Zhao, C., Zhang, L., and Yang, H. (2018). Linear correlation constrained joint inversion using squared cosine similarity of regional residual model vectors. Geophys. J. Int. 215 (2), 1291–1307. doi:10.1093/gji/ggy336
Sun, J., and Li, Y. (2016). Joint inversion of multiple geophysical data using guided fuzzy c-means clustering. Geophysics 81 (3), ID37–ID57. doi:10.1190/geo2015-0457.1
Takougang Takam, E. M., Harris, B., Kepic, A., and Le, C. V. (2015). Cooperative joint inversion of 3D seismic and magnetotelluric data: with application in a mineral province. Geophysics 80 (4), R175–R187. doi:10.1190/geo2014-0252.1
Tavakoli, M., Kalateh, A. N., Rezaie, M., Gross, L., and Fedi, M. (2021). Sequential joint inversion of gravity and magnetic data via the cross-gradient constraint. Geophys. Prospect. 69 (7), 1542–1559. doi:10.1111/1365-2478.13120
Wannamaker, P. E., Stodt, J. A., and Rijo, L. (1987). A stable finite element solution for two-dimensional magnetotelluric modelling. Geophys. J. Int. 88 (1), 277–296. doi:10.1111/j.1365-246x.1987.tb01380.x
Zhang, J., and Morgan, F. D. (1997). “Joint seismic and electrical tomography,” in Symposium on the Application of Geophysics to Engineering and Environmental Problems Proceedings (Environmental & Engineering Geophysical Society), 391–396. doi:10.4133/1.2922412
Zhang, L., Koyama, T., Utada, H., Yu, P., and Wang, J. (2012). A regularized three-dimensional magnetotelluric inversion with a minimum gradient support constraint. Geophys. J. Int. 189 (1), 296–316. doi:10.1111/j.1365-246x.2012.05379.x
Keywords: constrained inversion, minimum cross-gradient support, magnetotelluric, Junggar basin, nappe structure
Citation: Huang Z, Yu P, Zhao C, Zhang L and Song H (2024) Enhancing electrical structure in magnetotelluric inversion by the constraint of minimum cross-gradient support coupling. Front. Earth Sci. 12:1506399. doi: 10.3389/feart.2024.1506399
Received: 05 October 2024; Accepted: 11 November 2024;
Published: 03 December 2024.
Edited by:
Bo Yang, Zhejiang University, ChinaCopyright © 2024 Huang, Yu, Zhao, Zhang and Song. This is an open-access article distributed under the terms of the Creative Commons Attribution License (CC BY). The use, distribution or reproduction in other forums is permitted, provided the original author(s) and the copyright owner(s) are credited and that the original publication in this journal is cited, in accordance with accepted academic practice. No use, distribution or reproduction is permitted which does not comply with these terms.
*Correspondence: Peng Yu, eXVwZW5nQHRvbmdqaS5lZHUuY24=
 Zuwei Huang
 Peng Yu
 Chongjin Zhao
 Luolei Zhang
 Han Song