- 1Key Laboratory of Mountain Surface Process and Hazards, Institute of Mountain Hazards and Environment, Chinese Academy of Sciences, Chengdu, China
- 2University of Chinese Academy Sciences, Beijing, China
- 3China-Pakistan Joint Research Center on Earth Sciences, CAS-HEC, Islamabad, Pakistan
- 4School of Civil Engineering, Xijing University, Xi’an, China
The Qinghai-Tibet Plateau (QTP) has undergone substantial warming, resulting in extensive permafrost degradation and a pronounced increase in landslide frequency. However, the causal link between climate warming and permafrost landslide occurrences remains poorly understood. A comprehensive inventory of permafrost landslides along the Qinghai-Tibet Engineering Corridor (QTEC) from 2016 to 2022 was compiled through remote sensing and field verification, along with an analysis of landslide triggering factors based on data from 5 weather stations, 4 active layer thickness observation sites, and 3 precipitation stations. From 2000 to 2020, the mean annual air temperature (MAAT) showed an increase of 0.5°C per decade, while precipitation remained relatively stable. A notable peak occurred in 2016, with MAAT and mean annual surface ground temperature rising sharply by 0.59°C and 0.41°C, respectively, from the previous year. In the same year, active layer thickness across observation sites increased by an average of 18.5 cm, exceeding the average thickening rate. This substantial deepening of the active layer suggests that a portion of the underlying permafrost, potentially ice-rich near the permafrost table, thawed during the warm season. Laboratory experiments further reveal a three-stage reduction in soil strength as temperatures approach 0°C, with the most pronounced decline at −1°C. Interpretation of landslide data shows that landslide frequency in 2016 significantly increased, reaching approximately 1.3 times the historical total. This suggests that a thawed interlayer forming at the active layer-permafrost interface plays a dominant role in landslide initiation. The thawed layer acts as a weak zone, enabling the downward movement of the overlying active layer and contributing to slope instability. These findings provide robust evidence linking temperature rise to permafrost-related landslides, offering new insights into the mechanisms of temperature-induced slope instability in high-altitude regions.
1 Introduction
Permafrost, defined as ground (soil or rock, including ice and organic material) that remains at or below 0°C for at least two consecutive years, is significantly influenced by climate warming (Dobinski, 2011; Hu et al., 2022). The Qinghai-Tibet Plateau (QTP), encompassing 1.06 × 10⁶ km2 of permafrost, represents the largest permafrost region in low-latitude areas and commonly referred to as the “Third Pole” and the “Asian Water Tower” (Yao et al., 2012; Zhang et al., 2022; Zou et al., 2017). The warming rate in the QTP, surpassing the Northern Hemisphere average (Kuang and Jiao, 2016), causes permafrost degradation characterized by elevated ground temperatures, deepening active layers, and a reduction in area, which subsequently results in surface subsidence, slope instability, accelerated rock glaciers movement, and significant alterations in hydrological processes (Krautblatter et al., 2013; Etzelmüller et al., 2020; Haberkorn et al., 2021; Marcer et al., 2021). In recent years, there has been a significant increase in both the frequency and spatial extent of landslides in the permafrost region of the QTP, particularly along the Qinghai-Tibet Engineering Corridor (QTEC) (Luo et al., 2019; Niu et al., 2015; Xia et al., 2022). The types of landslides associated with permafrost include active layer detachment (ALD), retrogressive thaw slump (RTS), retrogressive thaw flow, soil slope deformation, soil creep, and solifluction (Couture and Cruden, 2010; Hungr et al., 2013; Mao et al., 2024). ALD and RTS are the two most common types of landslides on the Qinghai-Tibet Plateau (Swanson, 2021).ALD predominantly occurs in warm season when the thawing of surface soils induces sliding of the active layer over the underlying permafrost (Lewkowicz and Harris, 2005). This phenomenon is typically characterized by shallow sliding, with the slip plane located between the active layer and permafrost interface. RTS is initiated by the exposure of subsurface ice due to natural or anthropogenic factors, resulting in seasonal thawing that causes the overlying mass to collapse. This cyclical process of ice exposure and subsequent collapse drives the progressive retreat of the headwall (Lacelle et al., 2015; Lewkowicz and Way, 2019).
Variations in precipitation intensity and frequency are critical triggers for landslides (Handwerger et al., 2022; Kirschbaum et al., 2020), with higher temperatures exacerbating soil moisture evaporation and altering its structure (Andresen et al., 2020; Fatichi et al., 2020), thereby increasing landslide susceptibility (Marino et al., 2020; Nefros et al., 2023). Human activities, such as urbanization, deforestation, and infrastructure development, further disrupt natural hydrological cycles, intensify soil erosion, and destabilize slopes, heightening landslide risk (Nanehkaran et al., 2022; Quevedo et al., 2023). Integrated models combining climate data, topography, and soil characteristics provide a comprehensive assessment of landslide risks and mechanisms (Cemiloglu et al., 2023; Mao et al., 2024; Nanehkaran et al., 2023b). Studies across diverse regions show considerable disparities in landslide sensitivity to climate change: in mountainous areas, increased landslides are linked to snowmelt and precipitation changes (Liu et al., 2021), while extreme rainfall events drive landslides in tropical regions (Amarasinghe et al., 2024; Nanehkaran et al., 2023a). Although global research has illuminated the relationship between landslides and climate change, the response of landslide mechanisms to rising temperatures and changing precipitation on the QTP remains understudied. Research on the plateau has primarily focused on creep characteristics, morphological features, and landslide spatiotemporal distribution (Mu et al., 2020; Sun et al., 2017). Advanced remote sensing and Geographic Information Systems (GIS) have facilitated large-scale monitoring of landslide dynamics. For instance, Xia et al. (2022) compiled an inventory of 875 landslides along the QTEC, mapping their spatial distribution but without detailed temporal analysis. The temporal landslide evolution in the Beiluhe region revealed significant increases in landslide scale and frequency in recent years (Luo et al., 2019; Yang et al., 2023), linking this trend to rising temperatures (Luo et al., 2019). However, the causal mechanisms through which temperature elevations trigger landslides in permafrost of QTP remain unclear and require further exploration.
The objective of this study is to investigate the causal relationship between rising temperatures and permafrost landslides along the QTEC. We first analyzed meteorological and geothermal data from multiple stations to assess changes in air temperature, ground temperature, and active layer thickness over the past decade. Subsequently, we compiled a detailed landslide frequency inventory from 2016 to 2022 by visually interpreting multi-temporal satellite images. We quantified the changes in the number of landslides during this period and performed a comparative analysis of the correlations between variations in air temperature, ground temperature, and the observed increase in landslide occurrences.
2 Study area/data/test method
2.1 Study area
The study area is located in the permafrost region of the Qinghai-Tibet Plateau (QTP) (Ran et al., 2012). It extends from Xidatan in the north to Naqu in the south, covering a length of approximately 550 km and an area of 8 × 10⁴ km2. Since 1950, the region has experienced significant warming (Li et al., 2023), resulting in permafrost degradation and a reduction in vegetation cover and species (Jin et al., 2020). These changes have contributed to increasing slope instability in the area (Jin et al., 2008; Wu et al., 2012).
2.2 Data
The study area, primarily characterized by alpine meadows and alpine steppe, exhibits pronounced differences in color and texture in landslide-affected regions compared to the surrounding undisturbed landforms. Additionally, the progressive expansion traits of permafrost-related landslides can be distinctly identified through the analysis of multi-temporal high-resolution satellite imagery. The high-resolution images used are Planet images (https://www.planet.com/) of every July from 2016 to 2022 with a resolution of 3 m, which completely cover the study area. July was chosen as it is the ground surface of the study area was completely free of snow cover compared to May and June. Despite being time-consuming compared to automated identification, manual detection offers high accuracy and enables the addition of attributes during the identification process. In addition to assessing the whole study area, a typical landslide-prone sub-area was chosen for detailed spatiotemporal assessment (Figure 1). In addition to delineating landslide boundaries, a critical component of image interpretation involves categorizing landslide types. Landslides identified for the first time in a given image, when compared to the preceding temporal image, are classified as new landslides. Active landslides are those that show expansion and an increase in area relative to the most recent image (2022). It is noteworthy that for the earliest available image, such as the 2016 dataset for the entire study area, no prior image exists for comparative analysis. Consequently, landslides identified in this initial image are designated as pre-existing landslides without further classification. These pre-existing landslides serve as a foundational dataset for tracking and analyzing landslide occurrences and expansion in subsequent time periods.
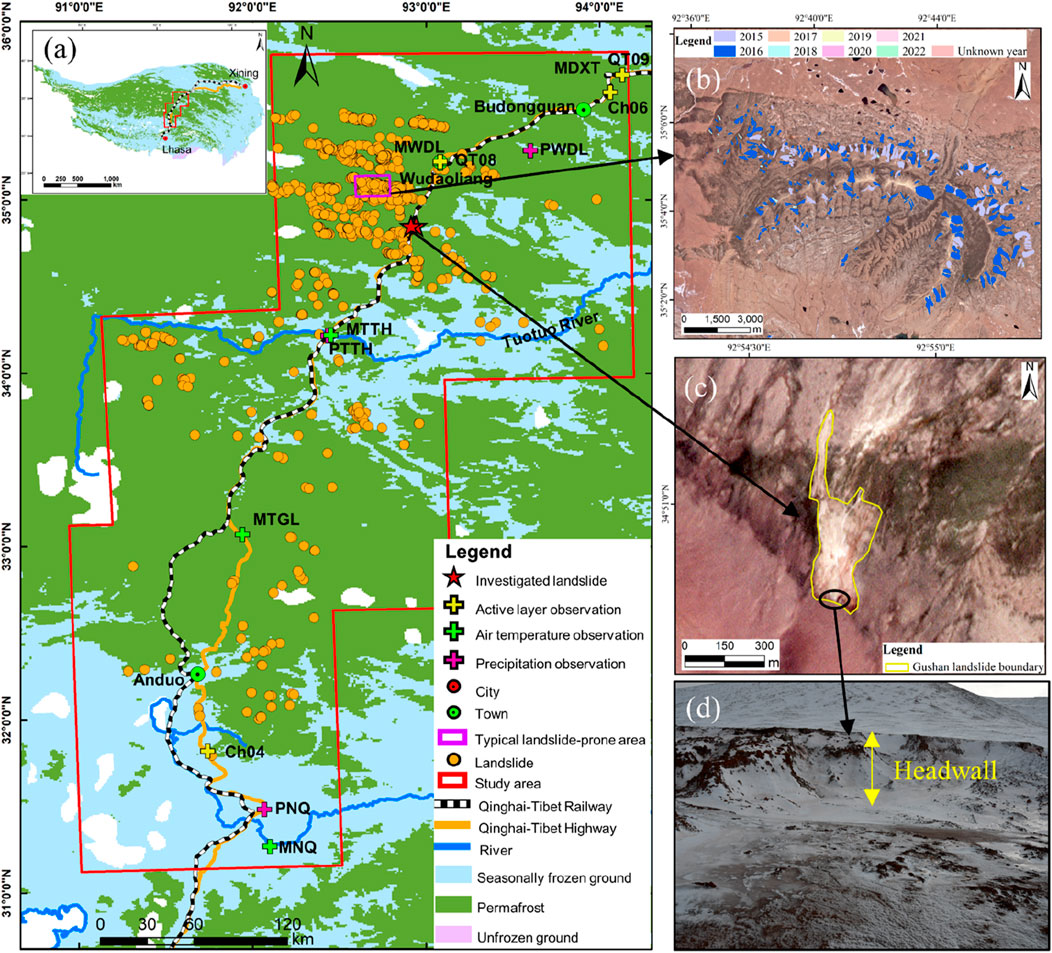
Figure 1. (A) Study area location, permafrost monitoring network, and landslide distribution. The permafrost monitoring network includes 4 automatic temperature stations, 3 precipitation stations, and 5 active layer observation stations along the QTEC in natural settings. A total of 1,298 landslides are distributed on both sides of the QTEC. (B) Landslide distribution in the typical landslide-prone area, with different colors indicating various initial failure years. (C) Satellite image of a representative Gushan landslide in July 2022. (D) Field photograph of the Gushan landslide in October 2023.
To ensure the accuracy of the landslide inventory, field surveys were conducted in the study area in April and October 2023. Due to the largely uninhabited nature and limited accessibility of the region, surveys were restricted to a 3-km corridor on either side of the QTEC. On-site verification successfully confirmed all 5 landslides previously identified in satellite imagery. For instance, the Gushan landslide (Figures 1C, D) was initially identified in satellite imagery and subsequently confirmed through field verification. An unmanned aerial vehicle (UAV) was utilized to capture high-resolution aerial photographs of representative landslides, which were then processed to generate a digital orthophoto map (DOM) and a digital surface model (DSM) of these landslides. A comparative analysis of landslide areas derived from UAV and satellite imagery for selected landslides indicated that the area discrepancy between the two sources was less than 5%. This variance could be attributed to differences in the resolution of the imagery sources, or it may reflect ongoing landslide expansion between 2022 and 2023.
The air temperature and ground temperature data were provided by the National Tibetan Plateau Data Center (https://data.tpdc.ac.cn/). The meteorological stations indices include daily air temperature, precipitation, humidity, wind speed gradient observation, and radiation balance. However, it is important to note that certain data points may be missing due to variations in the construction time of each station or other factors. The daily ground temperature of the active layer observations was measured at different depths below the permafrost table from the ground surface between 2002 and 2018. The precipitation data was obtained from the China Meteorological Data Service Centre (http://www.cma.gov.cn/). There are 3 precipitation stations evenly distributed in the northern, middle, and southern parts along the QTEC.
2.3 Test method
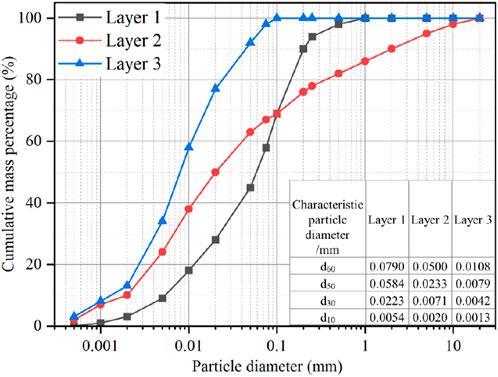
To investigate the geological characteristics of the active layer, we excavated a 2-m-deep observation trench at the headwall of the Zilrama landslide (Figure 2A). To obtain undisturbed soil samples, the trench was positioned to avoid areas with pronounced fissures at the headwall and maintained a minimum distance of 0.5 m from any cracks. As shown in Figure 2B, the active layer, excluding the top organic-rich layer, was divided into three distinct sub-layers. Soil samples from each sub-layer were carefully collected using a ring cutter for laboratory testing of soil physical properties (Figure 2C). Additionally, approximately 50 kg of soil from each layer was gathered to prepare artificial samples for mechanical properties testing. Table 1 presents the physical properties of the soil layers, measured through a variety of tests, including sieving, Malvern particle size analysis, moisture content, specific gravity, and liquid and plastic limit tests. Figure 3 shows the grain size distribution curves. The results indicate that the active layer soil in permafrost landslide areas predominantly comprises fine-grained material, with particle size decreasing closer to the permafrost table. Field observations revealed substantial pore ice within the frozen soil of the active layer, while moisture content tests confirmed saturation of the soil in this layer (Figures 2D, E).
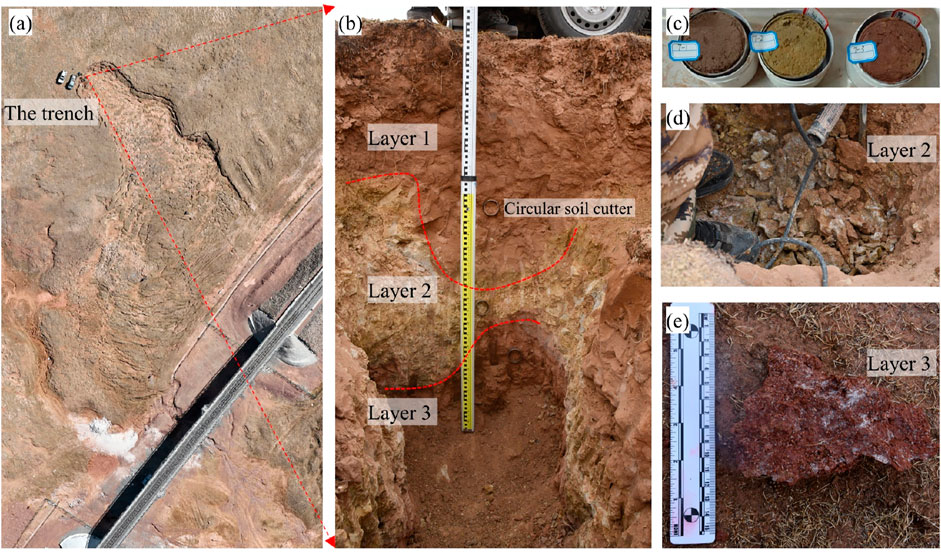
Figure 2. (A) DOM of the Zilrama landslide and the specific location of the trench. (B) Geological characteristics of the active layer. (C) Ring cutter samples from various layers. (D) and (E) Pore ice within active layer soil.
The landslide headwall height is approximately 2 m; hence, soil from the third layer was selected for low-temperature triaxial testing to evaluate the mechanical properties. Testing was conducted using a thermo-mechanical triaxial compression apparatus (UL200/60 SH) manufactured by Wille, Germany, with a maximum axial load capacity of 60 kN, confining pressure up to 4 MPa, and temperature control from −30°C to 60°C with 0.1°C precision (Figure 4). Sample dimensions were 70 mm in diameter and 140 mm in height. To ensure sample consistency, particle size was restricted to below one-tenth of the sample diameter. Particles exceeding 10 mm, comprising 1% of the sample mass, were excluded without impacting the mechanical analysis. Before preparation, soil samples were dried at 105°C for 24 h. The target dry density was set to 1.7 g/cm³, matching field values, with a 10% moisture content achieved by combining 916 g of soil particles with 91.6 g of water. The mixture was sealed and allowed to equilibrate for 24 h (Figure 5A). To ensure uniformity, the mixture was divided into 28 mm segments and compacted in 5 layers, with each layer compacted to a designated height and the surface leveled before adding the next layer. Once prepared (Figure 5B), the specimen was wrapped in a latex membrane and mounted onto the triaxial apparatus (Figure 5C). Saturation was achieved through back-pressure saturation, with gradual increases in confining and back pressure over 6 h to prevent soil structural damage. A pore water pressure coefficient (B-value) exceeding 0.95 indicated full saturation (Figure 5D). The temperature control system then lowered the coolant to the target level, maintaining it for 6 h to ensure thermal equilibrium within the sample. An unconsolidated undrained (UU) shear test was conducted to assess temperature effects on soil strength under shallow landslide conditions. The confining pressure was set to 50 kPa, and the temperature maintained between −6°C and 0°C. Loading was applied at a constant strain rate of 0.7 mm/min, ceasing at 20% axial strain. After testing, the failure characteristics were documented, and the sample was weighed, oven-dried, and reweighed to determine post-saturation moisture content.
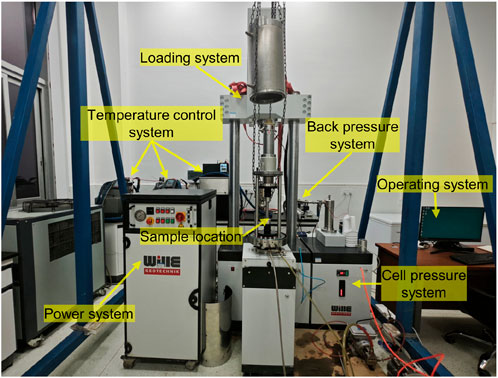
Figure 4. Low-temperature triaxial shear testing apparatus, including loading system, back-pressure system, temperature control system, cell pressure system, and temperature control system.
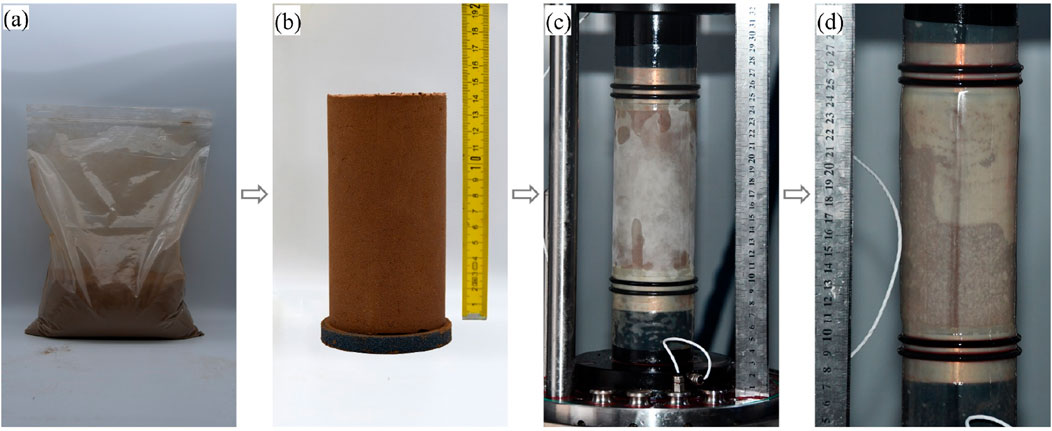
Figure 5. Specimen preparation procedure. (A) Oven-dried soil particles, (B) Soil sample, (C) and (D) Sample before and after saturation.
3 Results
3.1 Changes in hydrothermal disaster-prone environments
The air temperature in the permafrost region of the central QTP has consistently risen from 2000 to 2020, as indicated by all meteorological stations (Figure 6A). On average, the temperature has been increasing at a rate of 0.5°C per decade. Among these stations, the NQ station, located at the lowest altitude of 4452 m above sea level, has experienced the fastest increase rate at an annual average rate of 0.7°C per decade (Table 2). On the other hand, the TGL station, situated at the highest altitude of 5,044 m above sea level, has observed the slowest increase rate, with an annual average rising rate of 0.3°C per decade. The annual change patterns are highly consistent across all meteorological stations. It is evident that the MAAT in 2016 was considerably higher compared to the historical average (Figure 6A). During 2010–2020, The MAAT reached its peak value in 2016, followed by a downward trend then. The MAAT from the four meteorological stations in 2016 increased by 0.59°C compared to 2015, surpassing the average rising rate observed in recent decades. This alignment with global climate change is in line with the fact that 2016 was recorded as the hottest year in some regions of the planet, partly due to a powerful El Niño (Witze, 2023). On the other side, the data from two northern and central stations along the QTEC indicate that the rainfall in 2016 was even lower than the average annual precipitation (Figure 6B). Interestingly, although the rainfall at the southern precipitation monitoring station in the study area increased significantly in 2016 compared to 2015, there were no significant occurrences of landslides in the southern study area. Furthermore, the precipitation at the northern station in the study area showed a significant increase after 2016, while the precipitation at the central and southern stations remained relatively stable after that year.
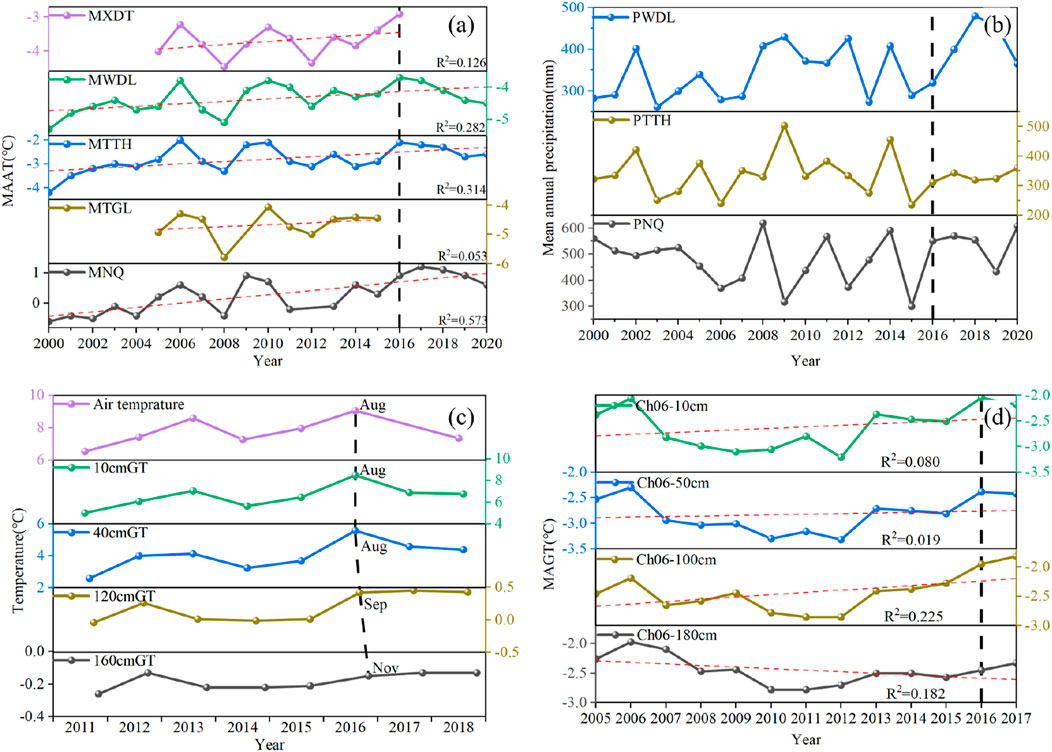
Figure 6. (A) The mean annual air temperature (MAAT) from five meteorological stations located along the QTEC from 2000 to 2020. (B) The mean annual precipitation of 3 precipitation monitoring stations along the QTEC from 2000 to 2020. (C) The month with the highest mean monthly air temperature and ground temperature at various depths of the station (QT09). (D) The mean annual ground temperature (MAGT) from different depths at the Ch06 active layer observation site.
The thermal state of permafrost is primarily controlled by climate, with influences from land surface characteristics such as vegetation, snow cover, soil physical properties, and geological conditions including organic-layer thickness and ground ice content (Smith et al., 2022). When these surface and subsurface conditions remain stable over a short period of time, the thermal state of shallow permafrost is mainly determined by air temperature. During 2011–2018, the maximum mean monthly air temperature and the maximum mean monthly ground temperature exhibit an identical varying pattern (Figure 6C). Annually, the highest air temperature is observed in August, which corresponds to the peak ground temperature in the shallower layers. However, in the deeper layers, the maximum mean monthly ground temperature has a delayed response to air temperature, which emerged until October or November. This indicates that air temperature is the primary factor influencing the thermal state of permafrost in permafrost regions. The temperature of the near-surface ground closely follows the annual cycle of air temperature, while the temperature variation decreases with depth.
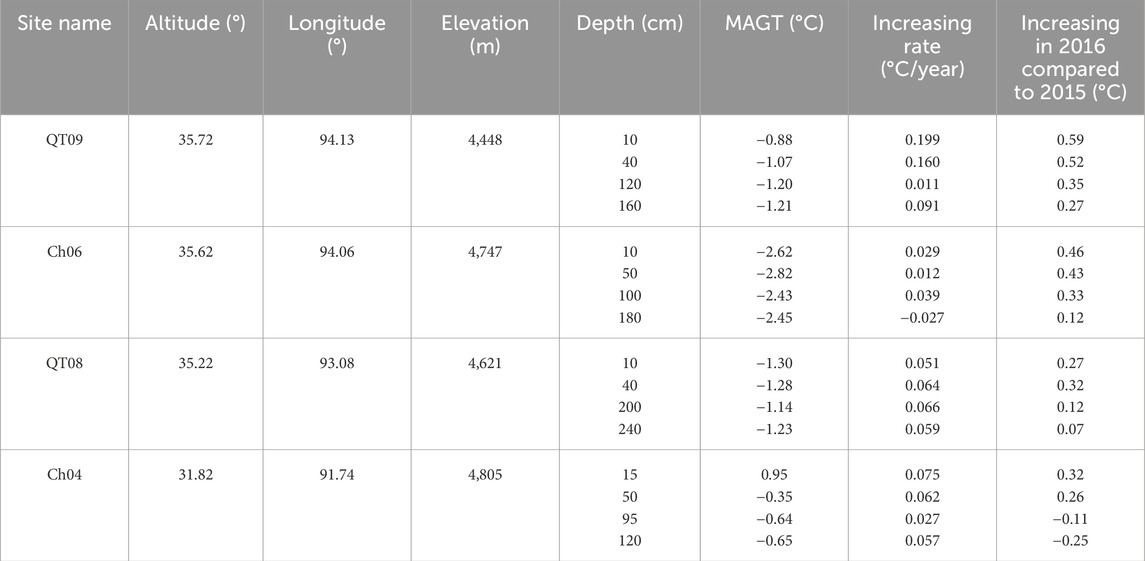
The range of temperature at different depths in various observations varies greatly. However, the mean annual ground temperature (MAGT) consistently showed an upward trend, except for the deep ground of CH06 (Figure 6D). On average, the surface ground (10 cm or 15 cm below the surface) at all observations experienced a rising rate of 0.87°C per decade, which is higher than the rate of air temperature increase. The fastest rate of surface ground temperature rise was observed at QT09, with a rate of 2°C per decade. On the other hand, the average rate of temperature increase near the permafrost table across all observations was 0.40°C per decade, which is lower than that of the surface ground. The highest rate of increase near the permafrost table was still observed at the QT09 site, with a rate of 0.9°C per decade. This can be attributed to the fact that QT09 is located at the edge of the continuous permafrost region. Table 3 presents the average rate of increase at different depths for each observation, as well as the magnitude of temperature rise in 2016 compared to 2015. Similar to the air temperature, the mean annual surface ground temperature in 2016 rose sharply by 0.41°C per year compared to 2015, which was significantly higher than the average rate of surface temperature increase.
3.2 Strength decreasing response to the different temperature zones
The stress-strain curve is a widely used method for assessing soil deformation and strength. In the permafrost region of the Qinghai-Tibet Plateau, the failure behavior of saturated clay undergoes significant changes with temperature under low confining pressure. At soil temperatures of −3°C or lower, the soil exhibits pronounced brittle failure. On the other hand, at temperatures higher than −2°C, the soil shows significant plastic damage (Figure 7A). When the soil temperature is approximately −2°C, the transition from brittle to plastic failure occurs. In the case of plastic failure, the deformation increases with the applied stress. Therefore, the deviator stress corresponding to a strain of 20% is considered the strength or failure stress of the sample. At soil temperatures below −1.6°C, the soil strength exceeds 2 MPa and increases as the temperature decreases. However, when the soil temperature is slightly higher than −1.6°C but still below −1.0°C, the strength rapidly decreases to less than 500 kPa. As the soil temperature continues to rise to 0°C, the strength experiences a slight decrease to 200 kPa (Figure 7B).
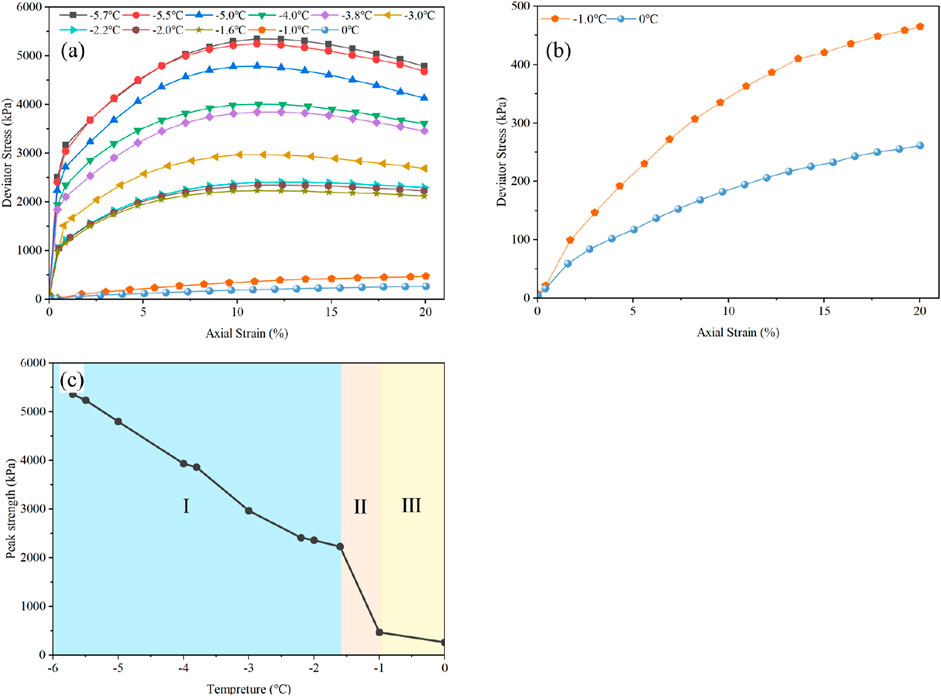
Figure 7. (A) The stress-strain curve of saturated soil at various temperatures under a confining pressure of 50 kPa. (B) The stress-strain curve at −1°C and 0°C. (C) Peak strength of soil under different negative temperatures.
The Figure 7C illustrates the variation of soil strength in the negative temperature range under low confining pressure, which can be divided into three zones. In the first zone, as the temperature rises, the strength gradually decreases. The second zone is characterized by a sharp decrease in strength as the temperature continues to increase. In the third zone, as the temperature approaches 0°C, the strength decreases at a slower rate. Typically, 0°C is considered the standard for defining frozen soil from a thermal state (Dobinski, 2011). However, from the viewpoint of frozen soil physics and mechanics, the definition of freezing temperature Tf should be lower than 0°C. For clay in the permafrost region of the Qinghai-Tibet Plateau, a standard of −1°C should be set. At this temperature, the failure mode is already similar to that at normal temperature, and the strength also decreases significantly, leading to a sharp decline in slope stability. This change in macroscopic physical and mechanical properties is attributed to the reduction in pore ice or the increase in unfrozen water content during the soil thawing process.
3.3 Active-layer thickness increased as climate warming
The active layer is a ground layer in permafrost regions that undergoes annual thawing and freezing, with its thickness (ALT) being an essential characteristic of permafrost environments (Dobiński, 2020). The freeze-thaw index is an important parameter associated with permafrost. It serves as a significant indicator for assessing the current state and long-term fluctuations of permafrost, as well as the spatial and temporal variations in active layer thickness (Riseborough, 2003; Smith et al., 2009). Thawing index refers to the cumulative value of positive temperature over time (Wu et al., 2015). ALT can be determined by applying a modified version of the Stefan solution that incorporates the thawing index (Nelson and Outcalt, 1987; Nixon and McRoberts, 1973).
where
It is worth noting that the thawing index of surface ground may vary across different active layer observations. The average value of the thawing index at QT09 is 601.02°C·d, while at QT05 it is as high as 1,494.89°C·d. Although there is significant variation in the specific values of all the observations, the rising and falling trends of the thawing index in different years are generally consistent. The thawing index of the surface ground (TISG) in all active layer observations exhibited an upward trend. The index experienced a substantial increase and nearly reached its highest point in 2016, after which it began to decline in the following years (Figure 8A). Consequently, there was a significant deepening of the active layer thickness in 2016, nearly reaching the maximum value observed in recent years.
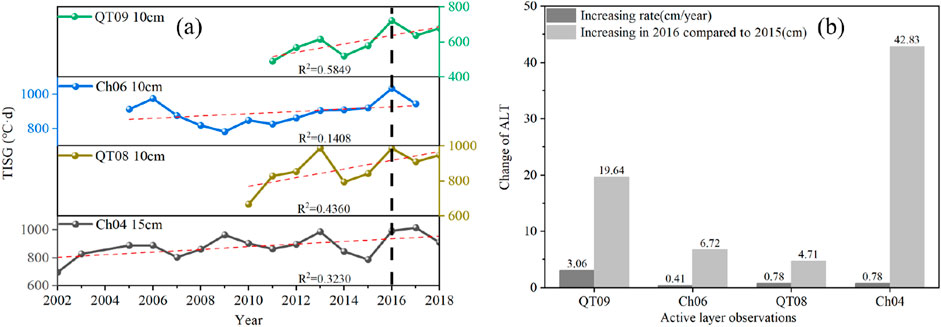
Figure 8. (A) The thawing index of surface ground at different active layer observations along the QTEC. (B) The changing of active layer thickness at four stations along the QTEC.
ALT is also estimated by using linear interpolation of ground temperatures above and below 0°C, calculated from semimonthly temperature data obtained through daily ground temperature measurements (Frauenfeld et al., 2004; Wu and Zhang, 2010b). ALT along the QTEC has shown a significant upward trend in the past 10 years. The average thickness of the active layer, based on all observations, is 197 cm. The maximum thickness of 309.5 cm was recorded at QT05, while the minimum thickness of 113.7 cm was observed at Ch04. The average rate of increase in the active layer thickness at the four stations was 1.5 cm/year, with slight variations among the different stations. In 2016, there was a significant increase in the thickness of the active layer at each station, which can be attributed to a considerable rise in temperature along the QTEC during that year. In comparison to 2015, the thickness of the active layer at all stations increased by an average of 18.5 cm in 2016, surpassing the average rate of increase (Figure 8B). Notably, Ch04 experienced an increase of 42.83 cm in 2016, reaching the highest value observed in recent decades. Interestingly, measurements from the Circumpolar Active Layer Monitoring network in 2016 indicated that the ALT at all Arctic sites was either at or close to the maximum level recorded in the past 18–21 years (Zhao et al., 2020).
3.4 Landslide frequency increasing
The K3035W landslide (Figure 9A) occurred in late September 2010 (Niu et al., 2015). The QT03 observation, located 20 km away from the landslide, indicated that the active layer thickness (ALT) reached its highest value in 2010 (Figure 9B), with the deepest thawing occurring in late September (Figure 9C). A Google Earth image from October, 2010, clearly shows intact wheel ruts behind and on the sliding area of the landslide (Figure 9A), providing evidence that the landslide moved as a whole. This type of landslide is known as active-layer-detachment and is caused by the thawing of materials near the permafrost table. Active-layer-detachment typically occurs during late summer when the active layer reaches its greatest depth. The headwall of the landslide continued to retreat from 2011 to 2013 (Niu et al., 2015). Following the active-layer-detachment, the failure progressed into a retrogressive thaw slump due to the thawing of ice-rich permafrost or the exposure of ground ice.
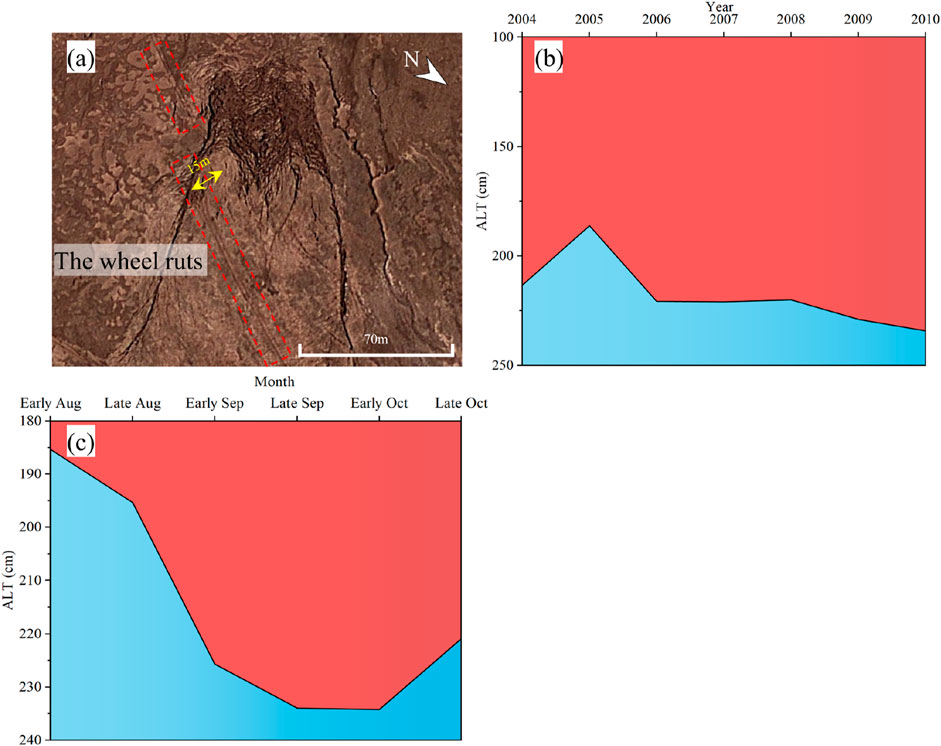
Figure 9. (A) Satellite image of the landslide K3035W on October 2010 (acquired from Google Earth). (B) Annual changes in active layer thickness at the QT03 from 2004 to 2010. (C) Monthly change of active layer thickness at the QT03 in 2010.
The failures mainly initiated or expanded during the thawing season between August and November (Luo et al., 2022), so we collected satellite images of every July in the study area. Figure 10A illustrates that a single landslide took place in July 2016, suggesting that the landslide occurred prior to 2016. In July 2017, 6 landslides transpired within the same region, indicating that 5 new landslides emerged between August and October of the preceding warm season in 2016 (Figure 10B). The combined area of these 6 landslides in July 2017 amounted to 266,141 m2. Over the subsequent years, the landslides continued to expand, resulting in an area of 430,189 m2 by July 2022 (Figures 10C, D). This signifies a 61.6% increase in landslide area over the course of 5 years. Just like the K3035W, the typical landslides initially failed in the form of overall active layer detachment, and then the landslides continued to expand backward in the form of retrogressive thaw slump in the next few years.
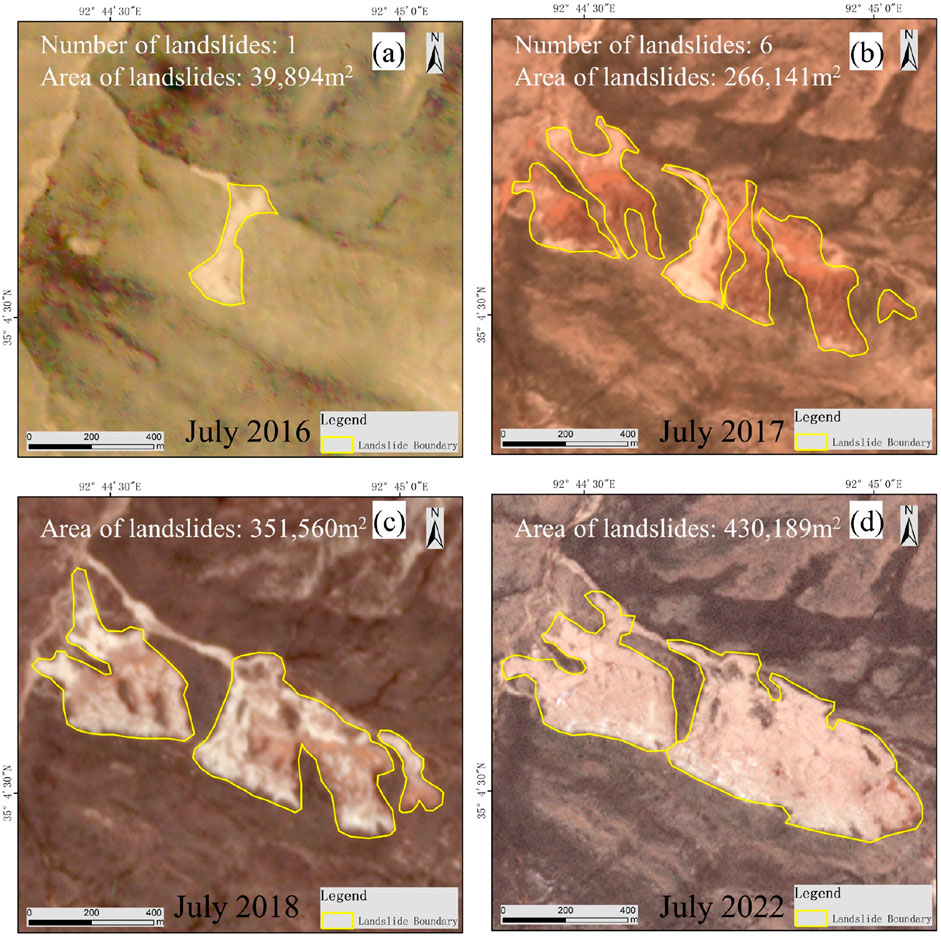
Figure 10. The evolution process of landslides in a typical area. (A) A typical landslide initiated before 2016 (B) Five typical landslides occurred in 2016 (C) and (D) The landslides continued to expand in the following years.
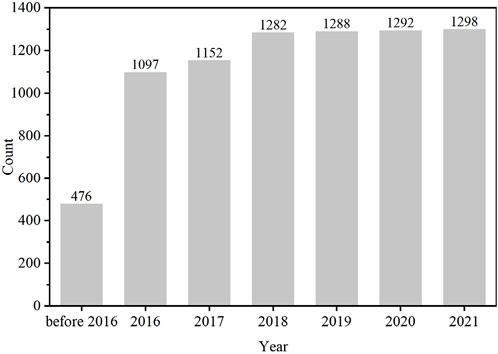
The initiation of failures was concentrated in a specific year and month, rather than occurring steadily. Our inventory includes 1,298 landslides along the QTEC. Statistical analysis revealed that there were only 428 failures before 2016. However, in 2016, 621 new failures emerged, constituting 56.6% of the total number of landslides. In 2017 and 2018, only 55 and 130 failures formed, respectively. From 2019 to 2021, there were only 16 new landslides (Figure 11).
4 Discussion
Permafrost is formed due to a long-term negative heat exchange between the ground and the atmosphere, with the concentrated reflection of this process being the permafrost surface. The air temperature along the QTEC has shown a significant increase over the past decade. The MAAT in 2016 reached nearly its highest value from 2010 to 2020. The trend of surface ground temperature change closely aligns with the air temperature, suggesting that the near-surface air temperature is the primary factor influencing the surface ground temperature. As the atmospheric temperature rises, it inevitably leads to an increase in the temperature of the surface soil. The surface temperature of permafrost along the QTEC has risen significantly in the past decade, with a slightly higher rate of increase compared to the air temperature. Similarly, the increase in mean annual ground temperature (MAGT) in 2016, compared to 2015, was much higher than the average rate of increase. The temperature near the active layer and the permafrost also exhibited a rising trend, although the rate of increase was slightly lower than that of the surface ground. Therefore, the observed changes in permafrost thermal conditions are generally consistent with the increasing air temperature. Data from active layer observations along the QTEC also show that the thickness of the active layer has been on the rising over the last decade and increased significantly in 2016. The above phenomenon are concrete manifestations of permafrost degradation. As permafrost undergoes gradual degradation, substantial alterations in soil moisture and thermal conditions significantly influence vegetation growth and distribution. In the study area, over 70% of landslides occur within alpine meadow regions, with alpine meadows comprising 72.4% of areas exhibiting a significant decreasing trend in vegetation (Jin et al., 2020). The root systems of alpine meadows play a crucial role in stabilizing the soil, enhancing its cohesion and structural integrity. However, as the area of these meadows diminishes, the stabilizing function of the roots weakens, resulting in a loosening of soil particles and an increased susceptibility to landslides. Furthermore, the vegetation within these meadows demonstrates effective water regulation capabilities, facilitating the absorption of precipitation and the reduction of surface runoff. The ongoing degradation of permafrost contributes to the decline of alpine meadows, thereby diminishing their water regulation capacity and leading to increased surface water accumulation and saturation in the upper soil layers. This accumulation ultimately results in a reduction of the soil’s shear strength. Additionally, the absence of vegetation cover exposes the soil to direct solar radiation, accelerating permafrost melting and inducing frequent cycles of expansion and contraction that compromise soil stability. Collectively, these factors engender an unstable soil water-thermal cycle, further undermining the soil’s resistance to sliding.
The significant deepening of the active layer thickness beyond the historical average indicates a change in soil temperature near the permafrost table, transitioning from permanently negative to positive during the warm season. Typically, the soil’s freezing temperature (Tf) is below 0°C. Therefore, a more accurate understanding of soil freezing and thawing should be based on Tf. As the temperature rises, the active layer and permafrost start to move downwards, causing the original permafrost to melt and form a thawed interlayer. Although the deepened portion of the active layer may not entirely align with the thawed interlayer, the deepening of the active layer implies the melting of some perennial frozen soil near the permafrost table in the warm season.
The K3035W landslide occurred in September 2010. It is important to note that observations of the active layer 20 km away from the landslide site indicated that the ground temperature and active layer thickness reached their highest levels in 2010. Additionally, the active layer thickness significantly increased compared to 2009, and in late September, the depth of the thawing ground reached its maximum. This suggests that in late September 2010, the perennial frozen soil on the permafrost table thawed, forming a thawed interlayer, which was the main factor contributing to the landslide. Initially, the landslide involved the detachment of the active layer, followed by continuous collapse and retreat of the headwall, resulting in a retrogressive thaw slump. In 2016, the air temperature along the QTEC experienced a sharp rise, reaching a historical high. However, there was no significant increase in rainfall during that year. In the northern and central regions where landslides were predominantly located, the rainfall in 2016 was even lower than the average annual precipitation. Between 2008 and 2018, no earthquakes exceeding magnitude 4 were recorded in the study area (https://www.usgs.gov/programs/earthquake-hazards). Moreover, remote sensing analysis indicated that 99.8% of identified landslides were located at least 1 km away from areas of human activity and rivers. Notably, the thickness of the active layer in 2016 increased significantly compared to 2015, resulting in the formation of a thicker thawed interlayer. Among the 1,298 landslides in the synthesis dataset, nearly half occurred in 2016, reinforcing the hypothesis that the development of a thawed interlayer at the active layer permafrost interface, driven by rising temperatures, is the primary cause of landslides. Extreme temperatures serve as the direct triggering factors for landslides in permafrost region. Nevertheless, this study does not explore the potential trends of landslides in permafrost area under future climate change scenarios. To address this limitation, future research should incorporate numerical analysis or physical modeling techniques to validate the findings of this study and evaluate how projected climate changes may affect landslide occurrences in permafrost region. (Fang et al., 2023).
Rising temperatures and the consequent deepening of the active layer increase the likelihood of slope destabilization, posing potential risks to the structural integrity of infrastructure along the QTEC. As the active layer thickens and the thawing index escalates, substantial ground deformation may occur, diminishing the soil’s load-bearing capacity and potentially compromising foundational stability. Given these risks, future infrastructure planning along the QTEC should integrate designs that are resilient to permafrost degradation. Key measures include reinforcing foundations, implementing monitoring systems for early detection of ground instability, and considering alternative construction materials and techniques that account for dynamic freeze-thaw cycles. Long-term, continuous monitoring, alongside proactive mitigation strategies, will be essential for adapting to the evolving permafrost landscape in this region.
5 Conclusion
This study systematically investigates the temporal relationship between rising air temperatures and landslide occurrences in permafrost regions.
1) Highest recorded value of air temperature in 2016: Over the past several decades, the permafrost areas along the QTEC have experienced a steady rise in air temperature, with the mean annual air temperature (MAAT) in 2016 approaching its highest recorded value. In contrast, annual precipitation has remained relatively stable, and in 2016, rainfall was even below the mean annual levels in the northern and central regions where landslides are predominantly concentrated. Air temperature emerges as the most critical factor influencing the thermal state of the surface ground. Both ground temperature and active layer thickness (ALT) have shown significant upward trends, with the ALT at each monitoring station increasing by an average of 18.5 cm in 2016 compared to 2015.
2) Concentration of landslides in 2016: Analysis of the landslide dataset along the Qinghai-Tibet Engineering Corridor (QTEC) reveals that nearly 50% of the landslides occurred in 2016 and the landslide frequency in 2016 significantly increased, reaching approximately 1.3 times the historical total.
3) Climate warming as the primary inducing factor: The significant increases in temperature and the concentrated occurrence of landslides in 2016 indicate that climate warming is the principal factor inducing landslides in permafrost regions.
The findings of this study provide robust empirical evidence linking climate warming to increased landslide activity in permafrost regions. They offer valuable insights into the mechanisms and processes by which rising temperatures and permafrost thaw contribute to slope instability. However, this research does not extensively explore the physical mechanisms underlying temperature-induced slope instability. Future studies should focus on investigating these physical processes and assessing the impact of landslide events on permafrost degradation. Such research would provide a scientific foundation for the prediction and prevention of landslides in permafrost regions.
Data availability statement
Publicly available datasets were analyzed in this study. This data can be found here: https://data.tpdc.ac.cn/zh-hans/data/789e838e-16ac-4539-bb7e-906217305a1d.
Author contributions
TW: Conceptualization, Formal Analysis, Investigation, Resources, Writing–original draft, Writing–review and editing. JW: Conceptualization, Writing–original draft, Writing–review and editing. MX: Conceptualization, Methodology, Writing–original draft, Writing–review and editing. PF: Software, Writing–original draft, Writing–review and editing.
Funding
The author(s) declare that financial support was received for the research, authorship, and/or publication of this article. Supported by National Natural Science Foundation of China (Grant no. 42101088 and U20A20112), the Second Tibetan Plateau Scientific Expedition and Research Program (STEP) (Grant No. 2019QZKK0906), Key S&D Program of Tibet Autonomous Region (Grant no. XZ202201ZY0011G) and the Science and Technology Research Program of Institute of Mountain Hazards and Environment, Chinese Academy of Sciences (No. IMHE-ZDRW-09).
Conflict of interest
The authors declare that the research was conducted in the absence of any commercial or financial relationships that could be construed as a potential conflict of interest.
Generative AI statement
The author(s) declare that no Generative AI was used in the creation of this manuscript.
Publisher’s note
All claims expressed in this article are solely those of the authors and do not necessarily represent those of their affiliated organizations, or those of the publisher, the editors and the reviewers. Any product that may be evaluated in this article, or claim that may be made by its manufacturer, is not guaranteed or endorsed by the publisher.
References
Amarasinghe, M. P., Kulathilaka, S. A. S., Robert, D. J., Zhou, A., and Jayathissa, H. A. G. (2024). Risk assessment and management of rainfall-induced landslides in tropical regions: a review. Nat. Hazards 120, 2179–2231. doi:10.1007/s11069-023-06277-3
Andresen, C. G., Lawrence, D., Wilson, C. J., McGuire, A. D., Koven, C., Schaefer, K., et al. (2020). Soil moisture and hydrology projections of the permafrost region a model intercomparison. Cryosphere 14, 445–459. doi:10.5194/tc-14-445-2020
Cemiloglu, A., Zhu, L., Mohammednour, A. B., Azarafza, M., and Nanehkaran, Y. A.Landslide Susceptibility Assessment for Maragheh County (2023). Landslide susceptibility assessment for maragheh county, Iran, using the logistic regression algorithm. Land 12, 1397. doi:10.3390/land12071397
Couture, R., and Cruden, D. (2010). “More comprehensive characterization of landslides in permafrost,” in Proceedings 63 rd Canadian geotechnical conference. Calgary, 855–861.
Dobinski, W. (2011). Permafrost. Earth-Science Rev. 108, 158–169. doi:10.1016/j.earscirev.2011.06.007
Dobiński, W. (2020). Permafrost active layer. Earth-Science Rev. 208, 103301. doi:10.1016/j.earscirev.2020.103301
Etzelmüller, B., Guglielmin, M., Hauck, C., Hilbich, C., Hoelzle, M., Isaksen, K., et al. (2020). Twenty years of European mountain permafrost dynamics—the PACE legacy. Environ. Res. Lett. 15. doi:10.1088/1748-9326/abae9d
Fang, K., Tang, H. M., Li, C. D., Su, X. X., An, P. J., and Sun, S. X. (2023). Centrifuge modelling of landslides and landslide hazard mitigation: a review. Geosci. Front. 14, 101493. doi:10.1016/j.gsf.2022.101493
Fatichi, S., Or, D., Walko, R., Vereecken, H., Young, M. H., Ghezzehei, T. A., et al. (2020). Soil structure is an important omission in Earth System Models. Nat. Commun. 11, 522. doi:10.1038/s41467-020-14411-z
Frauenfeld, O. W., Zhang, T., Barry, R. G., and Gilichinsky, D. (2004). Interdecadal changes in seasonal freeze and thaw depths in Russia. J. Geophys. Res. Atmos. 109. doi:10.1029/2003JD004245
Haberkorn, A., Kenner, R., Noetzli, J., and Phillips, M. (2021). Changes in ground temperature and dynamics in mountain permafrost in the Swiss Alps. Front. Earth Sci. 9, 626686.
Handwerger, A. L., Fielding, E. J., Sangha, S. S., and Bekaert, D. P. S. (2022). Landslide sensitivity and response to precipitation changes in wet and dry climates. Geophys. Res. Lett. 49, e2022GL099499. doi:10.1029/2022gl099499
Hu, G., Zhao, L., Wu, T., Wu, X., Park, H., Li, R., et al. (2022). Continued warming of the permafrost regions over the northern Hemisphere under future climate change. Earth’s Future 10, 0. doi:10.1029/2022ef002835
Hungr, O., Leroueil, S., and Picarelli, L. (2013). The Varnes classification of landslide types, an update. Landslides 11, 167–194. doi:10.1007/s10346-013-0436-y
Jin, H. J., Yu, Q. H., Wang, S. L., and Lu, L. Z. (2008). Changes in permafrost environments along the Qinghai-Tibet engineering corridor induced by anthropogenic activities and climate warming. Cold Regions Sci. Technol. 53, 317–333. doi:10.1016/j.coldregions.2007.07.005
Jin, X. Y., Jin, H. J., Wu, X. D., Luo, D. L., Yu, S., Li, X. Y., et al. (2020). Permafrost degradation leads to biomass and species richness decreases on the northeastern Qinghai-Tibet Plateau. Plants-Basel 9, 1453. doi:10.3390/plants9111453
Kirschbaum, D., Kapnick, S. B., Stanley, T., and Pascale, S. (2020). Changes in extreme precipitation and landslides over high mountain asia. Geophys. Res. Lett. 47, 9. doi:10.1029/2019gl085347
Krautblatter, M., Funk, D., and Günzel, F. K. (2013). Why permafrost rocks become unstable: a rock–ice-mechanical model in time and space. Earth Surf. Processes Landforms 38, 876–887. doi:10.1029/2019gl085347
Kuang, X. X., and Jiao, J. J. (2016). Review on climate change on the Tibetan Plateau during the last half century. J. Geophy. Res. Atmos. 121, 3979–4007. doi:10.1002/2015jd024728
Lacelle, D., Brooker, A., Fraser, R. H., and Kokelj, S. V. (2015). Distribution and growth of thaw slumps in the Richardson Mountains–Peel Plateau region, northwestern Canada. Geomorphology 235, 40–51. doi:10.1016/j.geomorph.2015.01.024
Lewkowicz, A. G., and Harris, C. (2005). Morphology and geotechnique of active-layer detachment failures in discontinuous and continuous permafrost, northern Canada. Geomorphology 69, 275–297. doi:10.1016/j.geomorph.2005.01.011
Lewkowicz, A. G., and Way, R. G. (2019). Extremes of summer climate trigger thousands of thermokarst landslides in a High Arctic environment. Nat. Commun. 10, 1329. doi:10.1038/s41467-019-09314-7
Li, R. W., Zhang, M. Y., Andreeva, V., Pei, W. S., Zhou, Y. Q., Misailov, I., et al. (2023). Impact of climate warming on permafrost changes in the Qinghai-Tibet Plateau. Cold Regions Sci. Technol. 205, 103692. doi:10.1016/j.coldregions.2022.103692
Liu, J., Wu, Y. M., and Gao, X. (2021). Increase in occurrence of large glacier-related landslides in the high mountains of Asia. Sci. Rep. 11, 1635. doi:10.1038/s41598-021-81212-9
Luo, J., Niu, F., Lin, Z., Liu, M., and Yin, G. (2019). Recent acceleration of thaw slumping in permafrost terrain of Qinghai-Tibet Plateau: an example from the Beiluhe Region. Geomorphology 341, 79–85. doi:10.1016/j.geomorph.2019.05.020
Luo, J., Niu, F., Lin, Z., Liu, M., Yin, G., and Gao, Y. (2022). The characteristics and patterns of retrogressive thaw slumps developed in permafrost region of the Qinghai-Tibet Plateau. J. Glaciol. Geocryol. 44, 96–105.
Mao, Y., Li, Y., Teng, F., Sabonchi, A. K. S., Azarafza, M., and Zhang, M. (2024). Utilizing hybrid machine learning and soft computing techniques for landslide susceptibility mapping in a drainage basin. Water 16, 380. doi:10.3390/w16030380
Marcer, M., Cicoira, A., Cusicanqui, D., Bodin, X., Echelard, T., Obregon, R., et al. (2021). Rock glaciers throughout the French Alps accelerated and destabilised since 1990 as air temperatures increased. Commun. Earth Environ. 2, 1–11.
Marino, P., Peres, D. J., Cancelliere, A., Greco, R., and Bogaard, T. A. (2020). Soil moisture information can improve shallow landslide forecasting using the hydrometeorological threshold approach. Landslides 17, 2041–2054. doi:10.1007/s10346-020-01420-8
Mu, C., Shang, J., Zhang, T., Fan, C., Wang, S., Peng, X., et al. (2020). Acceleration of thaw slump during 1997–2017 in the Qilian Mountains of the northern Qinghai-Tibetan plateau. Landslides 17, 1051–1062. doi:10.1007/s10346-020-01344-3
Nanehkaran, Y. A., Chen, B., Cemiloglu, A., Chen, J., Anwar, S., Azarafza, M., et al. (2023a). Riverside landslide susceptibility overview: leveraging artificial neural networks and machine learning in accordance with the united nations (UN) sustainable development goals. Water 15, 2707. doi:10.3390/w15152707
Nanehkaran, Y. A., Licai, Z., Chen, J., Azarafza, M., and Yimin, M. (2022). Application of artificial neural networks and geographic information system to provide hazard susceptibility maps for rockfall failures. Environ. Earth Sci. 81, 475. doi:10.1007/s12665-022-10603-6
Nanehkaran, Y. A., Licai, Z., Chengyong, J., Chen, J., Anwar, S., Azarafza, M., et al. (2023b). Comparative analysis for slope stability by using machine learning methods. Appl. Sci. 13, 1555. doi:10.3390/app13031555
Nefros, C., Tsagkas, D. S., Kitsara, G., Loupasakis, C., and Giannakopoulos, C. (2023). Landslide susceptibility mapping under the climate change impact in the chania regional unit, west crete, Greece. Land 12, 154. doi:10.3390/land12010154
Nelson, F. E., and Outcalt, S. I. (1987). A computational method for prediction and regionalization of permafrost. Arct. Alp. Res. 19, 279–288. doi:10.2307/1551363
Niu, F., Luo, J., Lin, Z., Fang, J., and Liu, M. (2015). Thaw-induced slope failures and stability analyses in permafrost regions of the Qinghai-Tibet Plateau, China. Landslides 13, 55–65. doi:10.1007/s10346-014-0545-2
Nixon, J., and McRoberts, E. C. (1973). A study of some factors affecting the thawing of frozen soils. Can. Geotechnical J. 10, 439–452. doi:10.1139/t73-037
Quevedo, R. P., Velastegui-Montoya, A., Montalván-Burbano, N., Morante-Carballo, F., Korup, O., and Rennó, C. D. (2023). Land use and land cover as a conditioning factor in landslide susceptibility: a literature review. Landslides 20, 967–982. doi:10.1007/s10346-022-02020-4
Ran, Y., Li, X., Cheng, G., Zhang, T., Wu, Q., Jin, H., et al. (2012). Distribution of permafrost in China: an overview of existing permafrost maps. Permafr. Periglac. Process. 23, 322–333. doi:10.1002/ppp.1756
Riseborough, D. W. (2003). “Thawing and freezing indices in the active layer,” in 8th international conference on permafrost. A a. Zurich, Switzerland: Balkema Publishers, 953–958.
Smith, S. L., Wolfe, S. A., Riseborough, D. W., and Nixon, F. M. (2009). Active-layer characteristics and summer climatic indices, mackenzie valley, northwest territories, Canada. Permafr. Periglac. Process. 20, 201–220. doi:10.1002/ppp.651
Smith, S. L., O’Neill, H. B., Isaksen, K., Noetzli, J., and Romanovsky, V. E. (2022). The changing thermal state of permafrost. Nat. Rev. Earth Environ. 3, 10–23. doi:10.1038/s43017-021-00240-1
Sun, Z., Wang, Y., Sun, Y., Niu, F., and GuoyuLi, G. Z. (2017). Creep characteristics and process analyses of a thaw slump in the permafrost region of the Qinghai-Tibet Plateau, China. Geomorphology 293, 1–10. doi:10.1016/j.geomorph.2017.04.045
Swanson, D. K. (2021). Permafrost thaw-related slope failures in Alaska’s Arctic National Parks, c. 1980–2019. Permafr. Periglac. Process. 32, 392–406. doi:10.1002/ppp.2098
Wu, Q., Hou, Y., Yun, H., and Liu, Y. (2015). Changes in active-layer thickness and near-surface permafrost between 2002 and 2012 in alpine ecosystems, Qinghai–Xizang (Tibet) Plateau, China. Glob. Planet. Change 124, 149–155. doi:10.1016/j.gloplacha.2014.09.002
Wu, Q., and Zhang, T. (2010b). Changes in active layer thickness over the Qinghai-Tibetan Plateau from 1995 to 2007. J. Geophys. Res. Atmos. 115. doi:10.1029/2009JD012974
Wu, Q., Zhang, T., and Liu, Y. (2012). Thermal state of the active layer and permafrost along the Qinghai-Xizang (Tibet) Railway from 2006 to 2010. Cryosphere 6, 607–612. doi:10.5194/tc-6-607-2012
Xia, Z., Huang, L., Fan, C., Jia, S., Lin, Z., Liu, L., et al. (2022). Retrogressive thaw slumps along the Qinghai–Tibet Engineering Corridor: a comprehensive inventory and their distribution characteristics. Earth Syst. Sci. Data 14, 3875–3887. doi:10.5194/essd-14-3875-2022
Yang, D., Qiu, H., Ye, B., Liu, Y., Zhang, J., and Zhu, Y. (2023). Distribution and recurrence of warming-induced retrogressive thaw slumps on the central Qinghai-Tibet Plateau. J. Geophys. Res. Earth Surf. 128. doi:10.1029/2022jf007047
Yao, T., Thompson, L. G., Mosbrugger, V., Zhang, F., Ma, Y., Luo, T., et al. (2012). Third pole environment (TPE). Environ. Dev. 3, 52–64. doi:10.1016/j.envdev.2012.04.002
Zhang, F., Zeng, C., Zhang, Q., and Yao, T. (2022). Securing water quality of the asian water tower. Nat. Rev. Earth and Environ. 3, 611–612. doi:10.1038/s43017-022-00347-z
Zhao, L., Zou, D., Hu, G., Du, E., Pang, Q., Xiao, Y., et al. (2020). Changing climate and the permafrost environment on the Qinghai–Tibet (Xizang) plateau. Permafr. Periglac. Process. 31, 396–405. doi:10.1002/ppp.2056
Keywords: climate warming, permafrost degradation, landslides, Qinghai-Tibet Engineering corridor, Qinghai-Tibet plateau
Citation: Wei T, Wang J, Xie M and Feng P (2024) Formation mechanism of climate warming-induced landslides in permafrost along the Qinghai-Tibet Engineering corridor. Front. Earth Sci. 12:1503980. doi: 10.3389/feart.2024.1503980
Received: 30 September 2024; Accepted: 19 November 2024;
Published: 13 December 2024.
Edited by:
Wen Nie, Jiangxi University of Science and Technology, ChinaReviewed by:
Mohammad Azarafza, University of Tabriz, IranKun Fang, Hong Kong University of Science and Technology, Hong Kong SAR, China
Copyright © 2024 Wei, Wang, Xie and Feng. This is an open-access article distributed under the terms of the Creative Commons Attribution License (CC BY). The use, distribution or reproduction in other forums is permitted, provided the original author(s) and the copyright owner(s) are credited and that the original publication in this journal is cited, in accordance with accepted academic practice. No use, distribution or reproduction is permitted which does not comply with these terms.
*Correspondence: Jiao Wang, d2FuZ2ppYW9AaW1kZS5hYy5jbg==
 Tao Wei1,2
 Jiao Wang
