- Production Engineer Branch, Sinopec Petroleum Exploration and Production Research Institute, Beijing, China
Understanding the reorientation mechanism of near-wellbore hydraulic fractures is very important for optimizing parameters in field fracturing treatments. In this study, a fully 2D coupled seepage–stress model based on the extended finite element method (XFEM) model is applied to investigate the fracture trajectory and reorientation. The numerical model considering pore pressure is verified by a true triaxial laboratory experiment. The results show that the fracture is generally initiated from perforation and rotates to the direction of maximum horizontal stress with different curving distances. The fracture trajectory and reorientation distance can be influenced by the rock mechanics and fracturing application parameters, including elasticity modulus, Poisson’s ratio, tensile strength, perforation angle, horizontal stress difference, and injection rate. More exact behavior of fracture propagation can be described according to the parametric study. The results provided in this paper can be clearer in the prediction of the fracture trajectory and fracturing design in the near-wellbore region.
1 Introduction
Hydraulic fractures were demonstrated to propagate in a non-planar manner in the near-wellbore region based on hydraulic fracture experiments and field micro-seismic experiments. However, the main purpose of hydraulic fracturing treatment is to provide an ideal fracture with minimum tortuosity (Feng and Gray, 2018). Diversion of hydraulic fractures is responsible for the complex morphology of fractures, which appear seriously near the wellbore (Abdollahipour et al., 2015; Luo et al., 2021; Wang et al., 2024; Salah et al., 2022; Zhu et al., 2014). These problems of complicated fracture trajectories may lead to a tremendous waste of fracturing fluid because of a higher net pressure required to support the extension of hydraulic fractures (Chen et al., 2010; Abdelaziz and Grasselli, 2024). Nevertheless, the diversion mechanism plays an important role in the success of hydraulic fracturing treatment, which is influenced by the geological factors and field operation factors. Therefore, understanding the diversion mechanism of hydraulic fractures is vital for optimizing hydraulic fracturing designs.
Hydraulic fracture is always initiated from perforation locations and wellbore flaws rather than the preferred fracture plane direction, which is the maximum in situ stress direction (Smax). The diversion after the initiation may lead to serious curve fracture propagation and aggravate fracture complexity, which can determine the final success of the hydraulic fracturing treatment. Simultaneously, severe fracture tortuosity caused by the fracture reorientation may result in a huge change in the fracture morphology, such as the fracture width and fracture length. Therefore, several experimental studies have researched the reorientation mechanism of hydraulic fractures in the near-wellbore region (Abass et al., 1995; Reza Pirhooshyaran and Nikkhah, 2021; Ahmad et al., 2021). These studies ascertained that fractures initiated from perforations and flaws and were eventually reoriented in the direction of maximum horizontal stress for the ideally planar fracture. The influence of several factors such as perforation parameters and the injection rate was also investigated in these experiments. Although experimental treatments are a vital method to understand the mechanisms and propagation behaviors in hydraulic fracturing, the expensive model and time consumption become a hindrance in the application of field hydraulic fracturing (Liu et al., 2018; Yushi et al., 2015; Zhou et al., 2010). Furthermore, the scale effect and simple experimental conditions may lead to a large deviation from the field parameters, especially in unconditional reservoirs. These limitations strongly restrict the application of experimental studies; hence, numerical and analytical methods are the preferable options for engineers and researchers.
Cherny proposed a two-dimensional model to simulate the fracture propagation with a pre-existing curvilinear fracture trajectory. The model coupled and solved one-dimensional equations of a power-law fluid flow within the fracture and two-dimensional equations of linear elasticity for the rock mass. Although the influence of fluid rheology and perforation misalignment angle on the width was investigated, the limitation of the prescribed curvilinear fracture path leads to an unreal propagation fracture path compared with the field application. An extended finite element method (XFEM) model was developed to simulate the fracture reorientation and propagation near the wellbore from a set of perforations. In these models, some parameters such as perforation angles, perforation length, stress anisotropy, and elastic properties were investigated to determine the influence of the fracture trajectory. However, the sensitive analysis of these parameters and reorientation mechanisms was not conducted in these models (Sepehri et al., 2015). Gordeliy et al. presented a 2D fluid-coupled model based on the longitudinal fractures propagated along the direction of maximum horizontal stress from the wellbore. The fluid pressure and fracture opening were solved by XFEM not only considering the rock deformation but also the viscosity-dominated regime in their model. However, their model ignores the pore elasticity of the rock mass, which is the key parameter in real reservoirs (Gordeliy et al., 2016). An XFEM model fully coupled with fluid flow and geo-mechanics stress was presented by Feng and Gray (2018) to investigate the hydraulic fracture growth near the wellbore. The model can capture the fracture reorientation morphology with the consideration of pore elasticity properties. However, fewer reorientation mechanisms are given in these numerical examples except the local stress and fluid flow. Therefore, a more available model that can not only consider the arbitrary reorientation and full seepage–stress coupling but also capture the fracture geometry is needed for the accurate description of fracture orientation (Feng and Gray, 2018).
In this work, we develop an XFEM that fully couples the seepage and stress to study the near-wellbore fracture reorientation mechanism. The model maintains the advantage of the XFEM to model arbitrary reorientation without pre-existing flaws, simultaneously considering the pore elasticity of the formation. Some sensitive parameters (e.g., elasticity modulus, Poisson’s ratio, perforation angle, horizontal stress difference, tensile strength, and injection rate) are simulated in this model. In the following section, the XFEM is first introduced. Then, the accuracy of the numerical examples is verified. Finally, the sensitive analysis of geometric and application factors is conducted to investigate the mechanism of fracture orientation in the near-wellbore region. The results provide the key parameters that affect the reorientation of the hydraulic fracture and present a precise mechanism in hydraulic fracturing design with more preference on the fracture plane.
2 Modeling approach
The XFEM is a finite element method (FEM)-based crack simulation method that prevents the element from re-meshing while modeling the fracture simulation, which aims to improve the crack-tip solutions (Belytschko and Black, 1999; Moës et al., 1999). Compared to other FEM-based methods, the XFEM allows arbitrary fracture growth by adopting the enriching displacement degrees of freedom, so more realistic fracture morphology can be attained using this numerical method (Haddad and Sepehrnoori, 2015a; Liu et al., 2015; Liu et al., 2016). For the special hydraulic fracturing model that couples the seepage and stress, additional pore pressure nodes are introduced into the elements for modeling the pore elasticity material. The disadvantage of this method is that it requires a large amount of computation, and sometimes, convergence cannot be guaranteed. This section briefly summarizes the main idea of this method.
2.1 Extended finite element method
The XFEM is applied to model arbitrary discontinuities and the discontinuity in a displacement filed along the crack path without the requirement of re-meshing. The displacement field u is approximated to discrete the equilibrium equation by the special enriched functions with additional node degrees of freedom (Daux et al., 2004; Salimzadeh and Khalili, 2015; Shi et al., 2017; Somnath and Vaibhav, 2024; Marzok and Waisman, 2024). In the XFEM, the displacement u vector can be approximated as Equation 1:
where Sall is the set of all ordinary nodes; Sfrac and Stip are the set of Heaviside enrichment nodes and the set of fracture-tip enrichment nodes, respectively; uI is node degrees of freedom in a regular finite element; aI and blI represent the enrichment nodal degrees of freedom for the fracture and crack tip, respectively; NIu is the standard finite shape function of node I; H(x) is the enrichment shape jump functions; and Fl is the singular displacement field around the fracture tip.
The jump function H can be written as Equation 2:
and x is the signed distance function vector, which determines the crack side. The values H(x)=1 or −1 represent the opposite sides on the crack wall.
The asymptotic crack-tip function Fl(x) is used to calculate the field displacement around the crack tip. This function based on the asymptotic features can be given by Equation 3:
where r and θ are the polar coordinates at the crack tip with its origin coordinate system.
2.2 The cohesive law
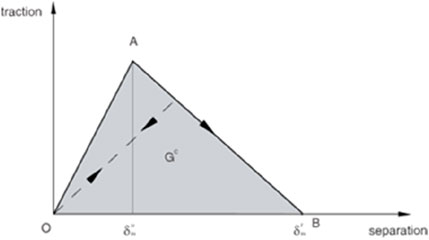
The cohesive zone method (CZM) is a general method for modeling the fracture initiation and propagation by using the traction–separation relation (Carrier and Granet, 2012; Chen, 2012; Guo et al., 2015; Nguyen et al., 2017; Dandi et al., 2023). The cohesive zone (shown in Figure 1) can describe the fracture initial loading, the initial damage, and the evolution damage at the failure fracture surface.
Damage initiation refers to the stiffness degradation of the cohesive zone in an enriched element. The process begins when the initial stress or strain conforms to special crack initiation criteria we chose. The maximum principle stress criterion is adopted in this simulation (Equation 4):
where σ0max is the maximum allowable principal stress. The symbol⟨⟩represents the Macaulay bracket used to indicate that pure compressive stress cannot initiate the damage. It assumes that damage will be initiated when the stress ratio f reaches the value of 1, which means that the stress magnitude is bigger than the maximum allowable principal stress of the objective.
Once crack initiation occurs, the fracture energy law can be used to evaluate the fracture evolution in the whole process. The Benzeggagh–Kenane (BK law) fracture criterion is introduced in our model as the most acceptable criterion in modeling fracture propagation. The BK law can be described as Equation 5:
where G represents the energy release rate and the superscript c expresses the critical energy release rate. The subscripts n, s, and t denote normal and two shear directions, and η is a constant for the corresponding material property. In this criterion, the energy release rate of the two shear directions should be equal.
The relationship between damage and stress (normal and shear) in the traction–separation law can be represented as Equations 6–8:
where tn, ts, and tt are the stress components in traction separation behavior without damage. Here, the indexes n, s, and t represent the direction of normal stress and the two shear stresses, respectively. D is the damage variable that represents the average overall damage. In particular, no damage occurs (D=0) at the beginning of the simulation, and the cohesive element also satisfies the condition without damage under pure compressive stress. In addition, the complete degradation of the cohesive element at all integration points occurs when D=1, which means zero load-carrying capacity for these elements.
The evolution of the damage variable, D, is expressed in Equation 9:
where
2.3 Fluid flow within the fracture
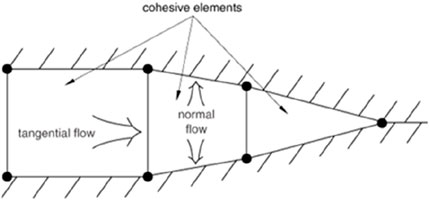
The flow patterns in the pore cohesive model are shown in Figure 2, in which the tangential flow and normal flow are both taken into consideration. The continuity flow is assumed to be incompressible Newtown fluid, with the normal flow permeating into the porous medium, as well as the tangential flow across the gap opening. The pore pressure on the fracture surface can be simulated by introducing the pore pressure node in the enrichment elements. This allows the fully coupled seepage–stress hydraulic fracturing to be modeled.
The tangential flow formulated from the Poiseuille law can be described by Equation 10:
where q is the fluid volume through the fracture, w is the fracture width, μ is the viscosity of the fracturing fluid,
The normal flow representing the fluid leak-off can be described as Equation 11:
where
As a two-dimensional fluid structure coupling model, all vertical displacements of the grid are constrained. Meanwhile, node displacement at the edge of the model is constrained to prevent the overall deviation of the model. Other related boundary conditions are combined with practice and determined in the following section.
3 Model verification
In this section, we verify the capabilities of our model in simulating the hydraulic fracture reorientation near the wellbore region. In order to make our numerical model more accurate, a certain number of experiment specimens with a perforation angle of 45° are applied to investigate the reorientation mechanism, even though several laboratory experiments have been reported (Reza Pirhooshyaran and Nikkhah, 2021; Ahmad et al., 2021; Liu et al., 2018).
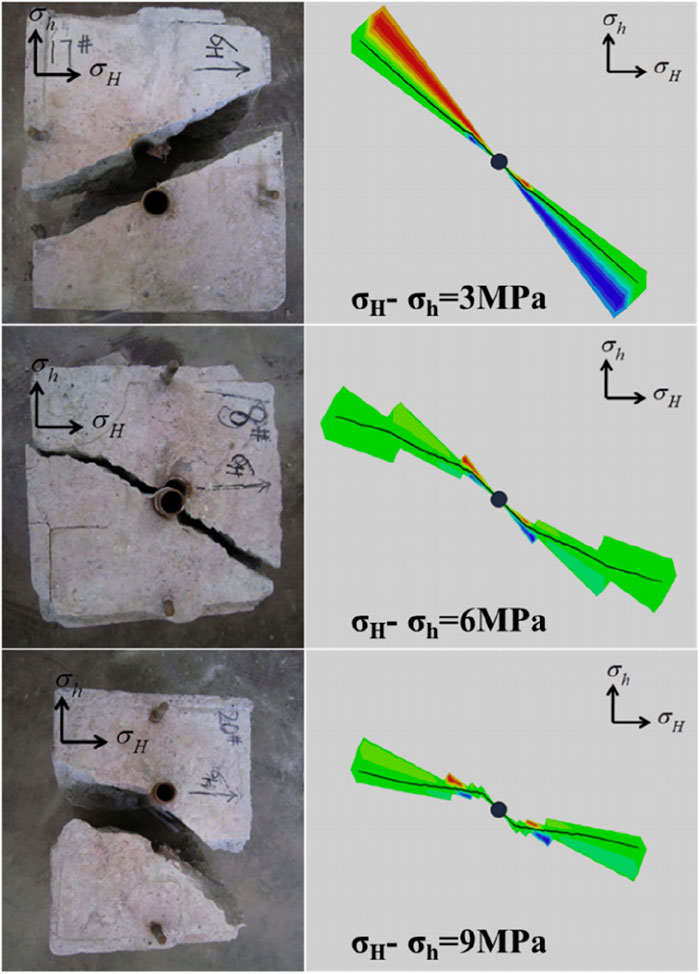
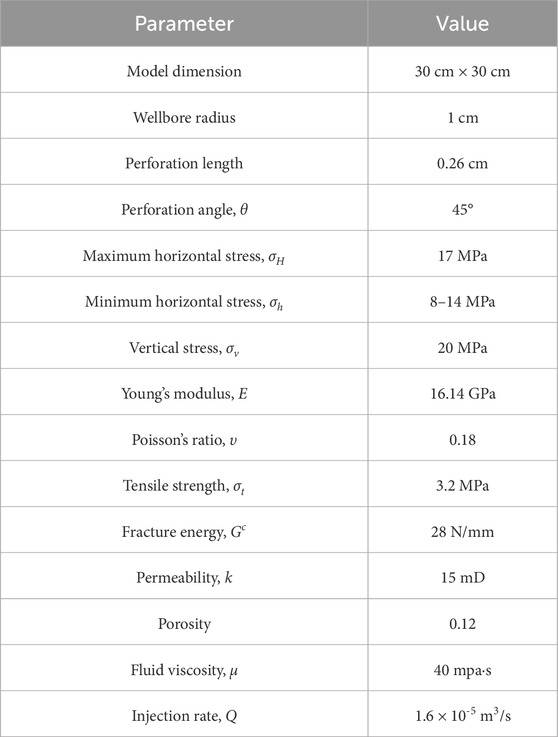
The laboratory experiment specimens used in our model were all three-dimensional blocks with a size of 30 cm × 30 cm × 30 cm. A true triaxial experiment system was used to realize the stress loading of in situ three direction. The perforation length and wellbore radium were 0.26 cm and 1 cm, respectively. The fluid viscosity and injection rate can be obtained at 40 mpa·s and 1.6 × 10⁻⁵ m3/s. A particular perforation angle of 45 was considered in this experiment. For the numerical model, a 2D plain strain pore pressure model with a perforation angle 45° was used to capture the fracture reorientation behavior in the near-wellbore region. As shown in Figure 3, the maximum horizontal stress (σH) and minimum horizontal stress (σh) were applied in the direction of the x-axis and y-axis, respectively. The vertical stress was applied perpendicular to the plane. The normal displacement degree of freedom at the outer boundaries of the wellbore is restricted in this numerical model. Table 1 shows all the relatively comparable input data between laboratory and numerical experiments, including material properties, treatment parameters, and boundary conditions.
The hydraulic fracture initiates from the perforation location and reorients with the injection of fracturing fluid. Both laboratory and numerical results show a curving fracture that finally diverts in the direction of maximum horizontal stress. As shown in Figure 3, the numerical result shows good agreement with that of the laboratory experiment, including the fracture orientation and morphology. Therefore, the fully coupled XFEM model is a valid tool for the description of hydraulic fracture reorientation and explains the mechanism of reorientation in detail. The total duration of injection is 8.4 s.
4 Results and discussion
The fully coupled seepage–stress XFEM model described above provides a way of predicting the fracture reorientation after the fracture initiates from the near-wellbore perforation and flaw. The main advantage of this model is that arbitrary fracture trajectories can be modeled without prescribing a fracture path, and simultaneously, pore elasticity and seepage behavior are also taken into consideration. Compared to the laboratory experiment, the initial pore pressure and pore pressure boundary are considered, which are more close to the real reservoir conditions. In this section, two symmetrical fractures are modeled to investigate the mechanism of fracture reorientation in the near-wellbore region. Several sensitive parameters including geology and treatment data are modeled to capture the fracture trajectory and morphology.
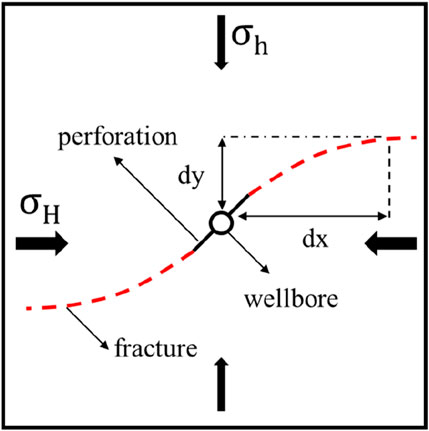
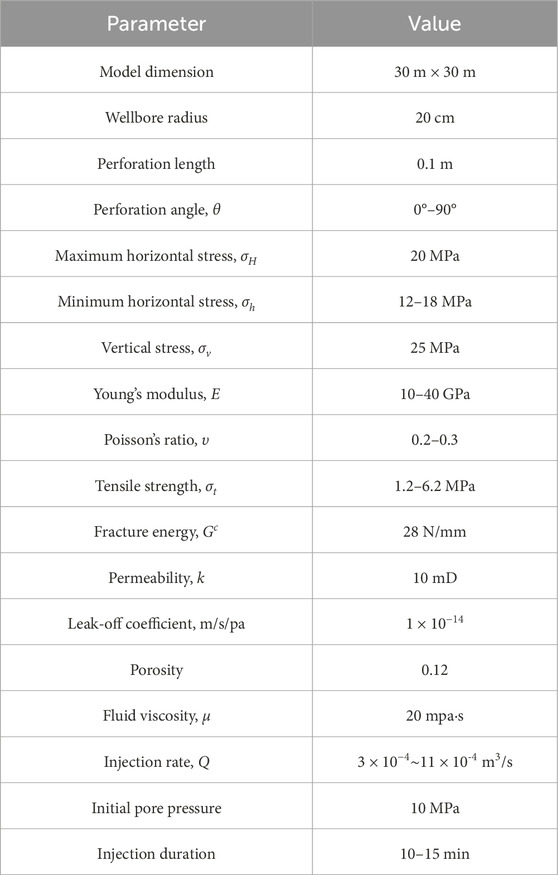
The complex process of multiple coupling and stress concentration leads to a complicated mechanism of reorientation in hydraulic fracturing near the wellbore. The evaluation manner of reorientation seems difficult in many complicated fracture trajectories. Several researchers have adopted the reorientation angle to evaluate the fracture arbitrary propagation; however, the reorientation angle changes in the whole fracturing treatment. Therefore, two special reorientation distance values dx and dy are introduced to describe the reorientation of hydraulic fracture. As shown in Figure 4, dx and dy are the horizontal distance and vertical distance between the root of perforation and the location where hydraulic fracture reorients in the direction of maximum horizontal stress, respectively. Table 2 presents the parameters needed in our work, including a 2D 30 m × 30-m block that can prevent the boundary effect at this dimension. Moreover, several simulation schemes are implemented to do the parametric sensitive analysis in the following section.
4.1 Effect of the perforation angle
To investigate the effect of the perforation angle on the near-wellbore fracture propagation, the simulation models of different angles θ=15°, 30°, 45°, 60°, 75°, and 90° are presented in this section. The sensitive parameters remain constant, i.e., elasticity modulus E=10 GPa, Poisson’s ratio υ=0.2, horizontal stress difference ▽σ=2 MPa, tensile strength σt=1.2 Mpa, and fluid injection rate Q=0.0005 m3/s. Meanwhile, the other parameters for reservoirs and fracturing treatment are identical to those given in Table 2. Figure 5 shows the complicated trajectory of hydraulic fracture with different perforation angles. It can be seen that sharper fracturing reorientation happens when the perforation angle is low, especially when the value is less than 60°. In this situation, the fracture initiates from the perforation and sharply reorients in the direction of maximum horizontal stress with relatively low propagation pressure in the fracture, while a long-curving distance fracture can be captured when the perforation angle exceeds 60°. The largest fracture propagation pressure occurs at θ=90°, which attains a high value of 33.53 MPa, as shown in Figure 5F. This is because the severe reorientation may lead to an excessive curve of the fracture morphology, which needs more fracturing fluid and higher injection pressure to maintain the propagation of fracture. Figure 6A shows the relation between the perforation angle and reorientation angle of horizontal distance dx and vertical distance dy. A larger perforation angle can result in more reorientation of the hydraulic fracture, which represents a longer reorientation distance in the vertical and horizontal directions. The largest value of reorientation dx=12.21 m and dy=7.24 m can be achieved at the perforation angle θ=90°. However, the sharpest change in the reorientation distance occurs when the angle increases from θ=60° to θ=75°, corresponding to the distance change from dx=2.83 m to dx=11.83 m and dy=1.21 m to dy=6.64 m. In order to obtain easier fracture propagation and proppant placement, a lower curving distance of fracture is needed in the filed application. Therefore, a lower perforation angle adjusted to be less than 60° should be adopted to obtain a plane fracture according to our simulation model.
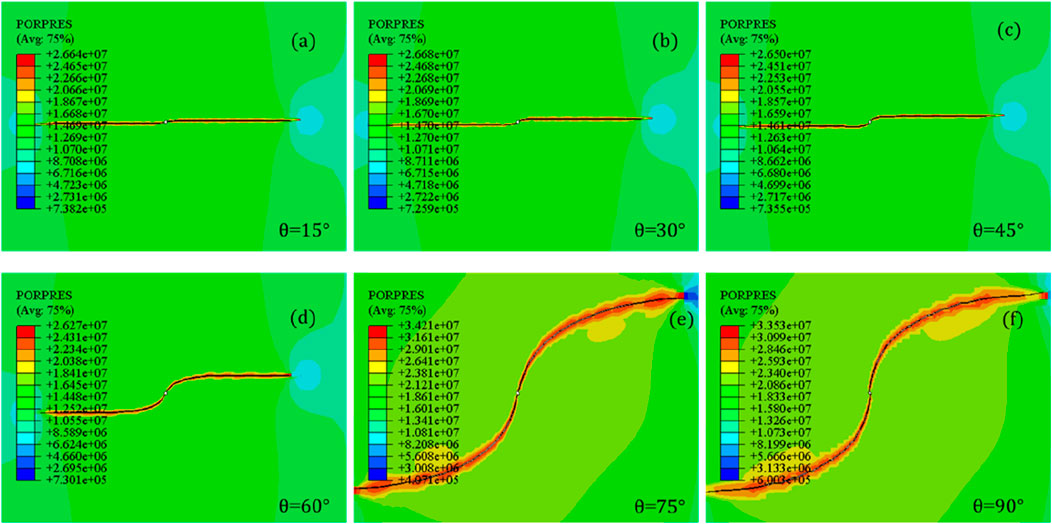
Figure 5. Reorientation trajectory of hydraulic fracturing at different perforation angles [(A). Perforation angle 15°; (B). Perforation angle 30°; (C). Perforation angle 45°; (D). Perforation angle 60°; (E). Perforation angle 75°; (F). Perforation angle 90°].
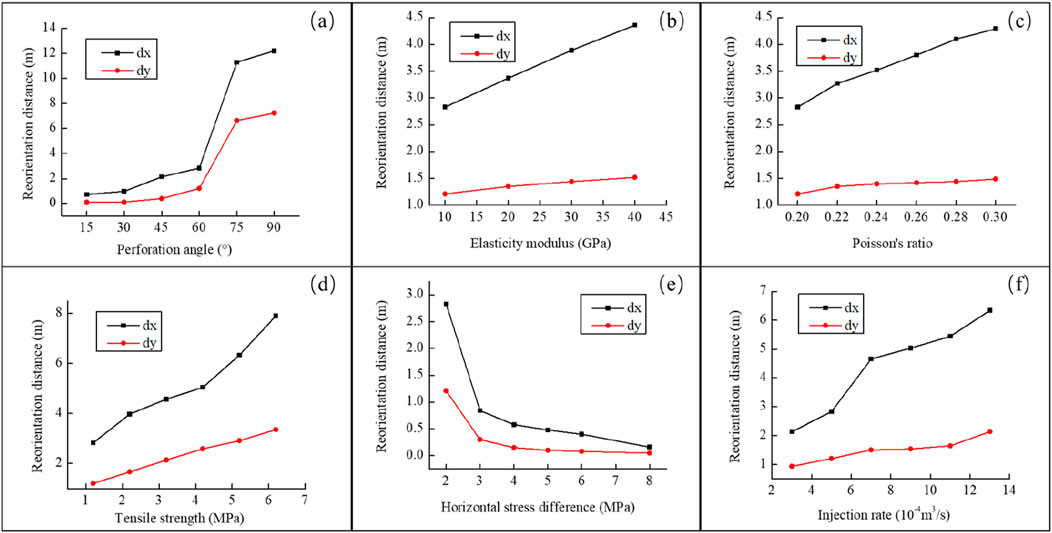
Figure 6. Horizontal and vertical reorientation distance of the reorientation fracture under different parameters [(A). Perforation angle; (B). Elasticity modulus; (C). Poisson’s ratio; (D). Tensile strength; (E). Horizontal stress difference; (F). Injection rate].
4.2 Effect of elasticity modulus
The elasticity modulus is an important property affecting the fracture propagation in hydraulic fracturing treatment. In all four cases, the perforation angle has the same value of θ = 60° and the fluid injection rate remains constant at 5 × 10⁻⁴ m3/s. Then, tensile strength, Poisson’s ratio, and horizontal stress difference are fixed at 1.2 MPa, 0.2, MPa and 2 MPa, respectively. The other parameters are given in Table 2. As expected, the fracture initiates from the perforation and rotates to the direction of maximum horizontal stress with different values of elasticity modulus. However, a larger elasticity modulus results in a larger curving distance and more reorientation before the fracture rotates to the direction of maximum horizontal stress. Meanwhile, a larger elasticity modulus can also lead to a higher fracture propagation pressure, which can make the fracture grow longer and narrower in the same injection condition. The maximum propagation pressure and fracture length among all the four cases reach up to 36.88 MPa and 13.4 m, respectively. Nevertheless, the fracture width decreases to the lowest value of 6 mm in all four scenarios. Figure 6B shows the transformation law of reorientation distance with different elasticity moduli. The larger elasticity modulus exhibits longer reorientation distance in both the vertical and horizontal directions, but the distance scope changes less when the elasticity modulus increases from 10 GPa to 40 GPa. For example, the vertical reorientation distance only changes from 1.21 m to 1.52 m, and the horizontal reorientation distance changes from 2.83 m to 4.36 m. Therefore, the elasticity modulus can influence the morphology of fracture with a higher elasticity modulus, resulting in a long curving distance and more reorientation for hydraulic fracture. In addition, a larger elasticity modulus contributes to generating a longer and narrower fracture in the same injection condition. Partly in the same injection condition, the hydraulic fracture can penetrate deep into the reservoir with a large elasticity modulus when the fracture finally returns to the direction perpendicular to the minimum horizontal stress.
4.3 Effect of Poisson’s ratio
The effect of different Poisson’s ratios υ = 0.20, 0.22, 0.24, 0.26, 0.28, and 0.30 on the propagation trajectories of hydraulic fracture is studied in this section. The fluid injection has the same value of 0.0005 × 10⁻⁴ m3/s, and the elasticity modulus remains constant at 10 GPa. Furthermore, tensile strength, horizontal stress difference, and perforation angle are 1.2 MPa, 2 MPa, and 60°, respectively. The other simulation parameters are listed in Table 2. The fracture tends to initiate in the direction of the original perforation and finally turns to the direction of maximum horizontal stress. A larger value of Poisson’s ratio can lead to a larger propagation pressure in the fracture, increasing from 22.91 MPa to 24.49 MPa in the all six models. Second, the change in fracture morphology can be hardly observed in the different schemes of different Poisson’s ratios. It is obvious that the change in Poisson’s ratio can influence the propagation condition and fracture morphology with limited scope. Figure 6C shows the relation between the reorientation distance and Poisson’s ratio. Both vertical and horizontal reorientation distances increase as Poisson’s ratio increases; yet the values of the distance change less. In particular, the vertical reorientation distance only increases from 1.42 m to 1.45 m, increasing by only 0.03 m. It can be seen that the reorientation and trajectory of hydraulic fracture are generally slightly influenced by the change in Poisson’s ratio.
4.4 Effect of tensile strength
Tensile strength should be a key crack parameter of rock mass in the hydraulic fracturing treatment. To analyze the reorientation mechanism of fracture, the effect of different tensile strengths σt = 1.2 MPa, 2.2 MPa, 3.2 MPa, 4.2 MPa, 5.2 MPa, and 6.2 MPa is discussed in this section. The other five sensitive parameters should be kept constant, i.e., elasticity modulus E = 10 GPa, perforation angle θ=60°, Poisson’s ration υ=0.2, horizontal stress difference ▽σ = 2 MPa, and injection rate Q = 5 × 10⁻⁴ m3/s. Other parameters, including fracturing treatment and rock mechanics, are consistent with those given in Table 2. The fracture trajectory and behavior of hydraulic reorientation can be significantly influenced by transforming the tensile strength. A long curving distance and complicate trajectory can be captured in the larger-tensile strength scheme. It is worth noting that more reorientation occurs in the propagation of hydraulic fracture with the increase in tensile strength. Simultaneously, a great increase in propagation pressure within the fracture can be observed when the tensile strength increases, for instance, the propagation pressure can reach up to approximately 33.83 MPa when σt = 6.2 MPa. Furthermore, the geometry of fracture, including the fracture length and width, also changes with the increase in tensile strength. The maximum fracture opening attains an extremely large value of 1.77 cm when tensile strength is 6.2 MPa, while a low fracture width of 1.07 cm is obtained when tensile strength is 1.2 MPa. The vertical and horizontal reorientation distances are influenced by tensile strength, as shown in Figure 6D. Both vertical and horizontal reorientation distances increase with the increase in tensile strength; in particular, the horizontal reorientation distance increases more than the vertical reorientation distance. Therefore, a long curving distance is associated with a larger tensile strength, which can cause more serious reorientation and complicated trajectory of fracture propagation.
4.5 Effect of horizontal stress difference
Horizontal stress difference controls the main mechanism of fracture reorientation, as proven by several researchers (Zou et al., 2018). The perforation angle and injection rate are fixed at θ = 60° and Q = 5 × 10⁻⁴ m3/s, respectively. Reservoir parameters including elasticity modulus, Poisson’s ratio, and tensile strength have the same values of E = 10 GPa, υ = 0.2, and σt = 1.2 MPa, respectively. Other parameters are consistent with those given in Table 2. The fracture trajectory with increasing horizontal stress is significantly different in all six simulation cases. A lower horizontal stress difference can result in a more complicated trajectory. Lower propagation pressure within the fracture causes the increase in horizontal stress difference, which will result in quick reorientation of the initiated fracture. In particular, the trajectory of the hydraulic fracture shows a sharp reorientation after initiating from the perforation when the horizontal stress difference exceeds 8 MPa. Figure 6E shows the revolution of the reorientation distance with the increase in horizontal stress difference. The horizontal reorientation distance shows a more obvious decrease than the vertical reorientation distance. The vertical reorientation stress changes from 0.05 m to 1.21 m, which can hardly be ignored. Therefore, without sufficient knowledge about the direction of in situ stress, a larger stress difference may cause a timely reorientation of the near-wellbore fracture, for which less reorientation and simple fracture trajectory will be obtained to benefit for the fracture propagation and proppant placement.
4.6 Effect of the injection rate
The fluid injection rate is an important factor that influences the propagation behavior of the hydraulic fracture. In this case, different trajectories of hydraulic fracture for different injection rates (Q = 3 × 10⁻⁴ m3/s, 5 × 10⁻⁴ m3/s, 7 × 10⁻⁴ m3/s, 9 × 10⁻⁴ m3/s, 1.1 × 10⁻³ m3/s, and 1.3 × 10⁻³ m3/s) with a perforation angle θ=60° are established. The reservoir parameters have the same values in all six cases, i.e., elasticity modulus E = 10 GPa, Poisson’s ratio υ = 0.2, tensile strength σt = 1.2 MPa, and horizontal stress difference ▽σ = 2 MPa. Other parameters are consistent with those presented in Table 2. It can be concluded that a larger propagation pressure within the fracture should be provided for extension with the increase in the injection rate. Furthermore, a higher injection rate creates a wider fracture along the direction of the perforation angle after the fracture initiates. It should also be noted that a more complicated fracture trajectory that takes up more fracturing time in reorienting to the direction of maximum horizontal stress is formed because of the large injection rate. The reorientation distance increases with the increase in the injection rate, as shown in Figure 6F. The larger horizontal reorientation distance dx can be observed when the injection rate increases to Q = 1.3 × 10⁻³ m-3/s compared with the vertical reorientation distance dy. Second, the vertical reorientation distance dy changes in a relatively less range, just increasing from 0.94 m to 6.34 m with the increase in the injection rate in all six cases. Therefore, a larger curving distance can be achieved at a higher injection rate, which needs more fluid volume to extend a longer reorientation fracture. This is because the larger reorientation fracture along the perforation angle is more likely to be generated because of the large propagation pressure within the fracture, which is provided by the high injection rate. For a longer and preferred fracture plane, a lower injection rate is recommended for easier reorientation at the beginning of the fracturing; however, a larger injection rate should be adopted to generate a longer and wider fracture after the initiated fracture finally rotates to the direction of maximum horizontal stress.
The above research conclusions have a reference value for perforation schemes in practical engineering applications. The degree of distortion of fractures under different geological conditions can be foreseen to a certain extent, which is beneficial for the utilization of remaining oil.
5 Conclusion
A fully coupled seepage–stress model based on XFEM was developed to predict the arbitrary propagation path in the near-wellbore region. Pore pressure and pore elasticity were also considered in this model, according to the pore pressure cohesive zone method. The sensitive parameters including rock mechanics and fracturing treatment are adopted to do extensive research for explaining the fracture reorientation mechanism in detail. Then, a true triaxial laboratory experiment was applied to verify the accuracy of the numerical simulation. The results show that the fracture trajectory and behavior of reorientation are influenced by the reservoir and fracturing treatment parameters, including elasticity, Poisson’s ratio, tensile strength, horizontal stress difference, perforation angle, and injection rate. Fracture growth always initiates from the perforation angle and then rotates to the direction of maximum horizontal stress. However, larger values of rock mechanics parameters including elasticity, Poisson’s ratio, and tensile strength can cause more reorientation and a longer curving distance of the hydraulic fracture. Meanwhile, larger propagation pressure within the fracture may occur, which can reduce the length of fracture under the same injection condition. A larger horizontal stress difference may lead to a smaller fracture curvature; in particular, a sharp reorientation happens when stress difference exceeds 8 Mpa. For the parameters of the injection rate, high injection rates cause longer propagation along the original perforation angle, which leads to a longer reorientation distance. Simultaneously, higher propagation pressure within the fracture can be observed in a larger injection rate, which also generates a wider fracture. A smaller perforation angle can result in less reorientation of the fracture, which is more likely to be parallel to the direction of maximum horizontal stress. These simulation results can be used to optimize the fracturing treatment parameters from a near-wellbore region.
6 Recommendations
The results of the numerical simulation can be further used for engineering design guidance such as perforation optimization. However, there is currently insufficient research on micro-level perforation, and it is recommended to continue optimizing the model in the future.
Data availability statement
The original contributions presented in the study are included in the article/Supplementary Material; further inquiries can be directed to the corresponding author.
Author contributions
XL: writing–original draft and writing–review and editing.
Funding
The author(s) declare that financial support was received for the research, authorship, and/or publication of this article. This work was supported by the National Science Foundation of China (U22B6003) and the Science Foundation of SINOPEC (P23207, P24197, YTBXD-FCZY-2024-1-06-005).
Conflict of interest
Author XL was employed by Sinopec Petroleum Exploration and Production Research Institute.
Generative AI statement
The author(s) declare that no generative AI was used in the creation of this manuscript.
Publisher’s note
All claims expressed in this article are solely those of the authors and do not necessarily represent those of their affiliated organizations, or those of the publisher, the editors, and the reviewers. Any product that may be evaluated in this article, or claim that may be made by its manufacturer, is not guaranteed or endorsed by the publisher.
References
Abass, H. H., Brumley, J. L., and Venditto, J. J. (1995). “Oriented perforations - a rock mechanics view,” in SPE Annual Technical Conference and Exhibition, USA, 6 – 8 October 2025.
Abdelaziz, A., and Grasselli, G. (2024). Crack opening and slippage signatures during stimulation of bedded montney rock under laboratory true-triaxial hydraulic fracturing experiments. Rock Mech. Rock Eng. 57, 9827–9845. doi:10.1007/s00603-024-04048-5
Abdollahipour, A., Fatehi Marji, M., Yarahmadi Bafghi, A., and Gholamnejad, J. (2015). Simulating the propagation of hydraulic fractures from a circular wellbore using the Displacement Discontinuity Method. Int. J. Rock Mech. Min. Sci. 80, 281–291. doi:10.1016/j.ijrmms.2015.10.004
Ahmad, F., Babaeian amini, A., Marabi, Y., Rafati Zavaragh, S., and Majnouni-Toutakhane, A. 2021. Effect of curing temperature on the mechanical strength of alkali activated laterite geopolymeric samples, 11(1B): 38–51.
Belytschko, T., and Black, T. (1999). Elastic crack growth in finite elements with minimal remeshing. Int. J. Numer. Methods Eng. 45 (5), 601–620. doi:10.1002/(sici)1097-0207(19990620)45:5<601::aid-nme598>3.0.co;2-s
Carrier, B., and Granet, S. (2012). Numerical modeling of hydraulic fracture problem in permeable medium using cohesive zone model. Eng. Fract. Mech. 79, 312–328. doi:10.1016/j.engfracmech.2011.11.012
Chen, M., Jiang, H., Zhang, G. Q., and Jin, Y. (2010). The experimental investigation of fracture propagation behavior and fracture geometry in hydraulic fracturing through oriented perforations. Petroleum Sci. Technol. 28 (13), 1297–1306. doi:10.1080/10916466.2010.483435
Chen, Z. (2012). Finite element modelling of viscosity-dominated hydraulic fractures. J. Petroleum Sci. and Eng. 88-89 (2), 136–144. doi:10.1016/j.petrol.2011.12.021
Dandi, A., Ali, K. M. S., Moaz, D., Ali, A., Ibrahim, A. F., and Ruud, W. (2023). Correction to: probabilistic estimation of hydraulic fracture half-lengths: validating the Gaussian pressure-transient method with the traditional rate transient analysis-method (Wolfcamp case study). J. Petroleum Explor. Prod. Technol. 13 (12), 2491–2497.
Daux, C., Moës, N., Dolbow, J., Sukumar, N., and Belytschko, T. (2004). Arbitrary branched and intersecting cracks with the extended finite element method. Int. J. Numer. Methods Eng. 48 (12), 1741–1760.
Feng, Y., and Gray, K. E. (2018). Modeling of curving hydraulic fracture propagation from a wellbore in a poroelastic medium. J. Nat. Gas Sci. Eng. 53, 83–93. doi:10.1016/j.jngse.2018.02.020
Gordeliy, E., Abbas, S., and Prioul, R. (2016). Modeling of near-wellbore fracture reorientation using a fluid-coupled 2D XFEM algorithm. U.s. Rock Mechanics/geomechanics Symp.
Guo, J., Zhao, X., Zhu, H., Zhang, X., and Pan, R. (2015). Numerical simulation of interaction of hydraulic fracture and natural fracture based on the cohesive zone finite element method. J. Nat. Gas Sci. Eng. 25, 180–188. doi:10.1016/j.jngse.2015.05.008
Haddad, M., and Sepehrnoori, K. (2015a). Simulation of hydraulic fracturing in quasi-brittle shale formations using characterized cohesive layer: stimulation controlling factors. J. Unconv. Oil Gas Resour. 9, 65–83. doi:10.1016/j.juogr.2014.10.001
Liu, C., Liu, H., Zhang, Y., Deng, D., and Wu, H. (2015). Optimal spacing of staged fracturing in horizontal shale-gas well. J. Petroleum Sci. Eng. 132, 86–93. doi:10.1016/j.petrol.2015.05.011
Liu, C., Wang, X., Deng, D., Zhang, Y., Zhang, Y., Wu, H., et al. (2016). Optimal spacing of sequential and simultaneous fracturing in horizontal well. J. Nat. Gas Sci. Eng. 29, 329–336. doi:10.1016/j.jngse.2016.01.024
Liu, X., Qu, Z., Guo, T., Tian, Q., Lv, W., Xie, Z., et al. (2018). An innovative technology of directional propagation of hydraulic fracture guided by radial holes in fossil hydrogen energy development. Int. J. Hydrogen Energy 44 (2019), 5286–5302. doi:10.1016/j.ijhydene.2018.07.189
Luo, W., Liao, R., Wang, J., Wang, H., Liu, Z., and Cheng, Y. (2021). Flow simulation for a horizontal well with slotted screen and ICD completions based on the wellbore–annulus–transient seepage reservoirmodel. J. Eng. Res. 10 (4B), 303–330.
Marzok, A., and Waisman, H. (2024). Globally enriched XFEM/GFEM approach for cracked beams. Thin-Walled Struct. 203, 112224. doi:10.1016/j.tws.2024.112224
Moës, N., Dolbow, J., and Belytschko, T. (1999). A finite element method for crack growth without remeshing. Int. J. Numer. Methods Eng. 46 (1), 131–150. doi:10.1002/(sici)1097-0207(19990910)46:1<131::aid-nme726>3.3.co;2-a
Nguyen, V. P., Lian, H., Rabczuk, T., and Bordas, S. (2017). Modelling hydraulic fractures in porous media using flow cohesive interface elements. Eng. Geol. 225, 68–82. doi:10.1016/j.enggeo.2017.04.010
Reza Pirhooshyaran, M., and Nikkhah, M. (2021). Hydraulic fracture patterns in fractured rock mass using coupled hydromechanical modeling in the bonded particle model. Model. Earth Syst. Environ. 8 (2), 2277–2290. doi:10.1007/s40808-021-01218-0
Salah, A., Laila, A., Al-Bazzaz, W., Alsayegh, S., Alajaj, H., and Flori, R. (2022). Are natural fractures in sandstone reservoir: water wet – mixed wet – or oil wet? J. Eng. Res. 11 (1B), 374–387.
Salimzadeh, S., and Khalili, N. (2015). A three-phase XFEM model for hydraulic fracturing with cohesive crack propagation. Comput. Geotechnics 69, 82–92. doi:10.1016/j.compgeo.2015.05.001
Sepehri, J., Soliman, M. Y., and Morse, S. M. (2015). “Application of extended finite ElementMethod to simulate hydraulic fracture propagation from OrientedPerforations,” in SPE Hydraulic Fracturing Technology Conference, USA, 4–6 February 2025.
Shi, F., Wang, X., Liu, C., Liu, H., and Wu, H. (2017). An XFEM-based method with reduction technique for modeling hydraulic fracture propagation in formations containing frictional natural fractures. Eng. Fract. Mech. 173, 64–90. doi:10.1016/j.engfracmech.2017.01.025
Somnath, B., and Vaibhav, S. (2024). Extended finite element simulation of axial semi elliptical surface crack in Bi-material pipe. Adv. Sci. Technol. 155, 93–98. doi:10.4028/p-gsm8db
Wang, Y.-W., Dai, Z.-X., Wang, G.-S., Chen, Li, Xia, Y.-Z., and Zhou, Y.-H. (2024). A hybrid physics-informed data-driven neural network for CO2 storage in depleted shale reservoirs. Petroleum Sci. 21 (1), 286–301. doi:10.1016/j.petsci.2023.08.032
Yushi, Z., Shicheng, Z., Tong, Z., Xiang, Z., and Tiankui, G. (2015). Experimental investigation into hydraulic fracture network propagation in gas shales using CT scanning technology. Rock Mech. Rock Eng. 49 (1), 33–45. doi:10.1007/s00603-015-0720-3
Zhou, J., Jin, Y., and Chen, M. (2010). Experimental investigation of hydraulic fracturing in random naturally fractured blocks. Int. J. Rock Mech. and Min. Sci. 47 (7), 1193–1199. doi:10.1016/j.ijrmms.2010.07.005
Zhu, H., Guo, J., Zhao, X., Lu, Q., Luo, B., and Feng, Y. C. (2014). Hydraulic fracture initiation pressure of anisotropic shale gas reservoirs. Geomechanics Eng. 7 (4), 403–430. doi:10.12989/gae.2014.7.4.403
Keywords: reorientation mechanism, seepage–stress, fracture trajectory, extended finite element method, parametric study, reorientation distance
Citation: Li X (2024) Fracture reorientation mechanism during hydraulic fracturing based on XFEM simulation. Front. Earth Sci. 12:1503934. doi: 10.3389/feart.2024.1503934
Received: 30 September 2024; Accepted: 06 November 2024;
Published: 21 November 2024.
Edited by:
Cunqi Jia, The University of Texas at Austin, United StatesReviewed by:
Yanwei Wang, China University of Geosciences, ChinaJianxiong Li, Xichang College, China
Copyright © 2024 Li. This is an open-access article distributed under the terms of the Creative Commons Attribution License (CC BY). The use, distribution or reproduction in other forums is permitted, provided the original author(s) and the copyright owner(s) are credited and that the original publication in this journal is cited, in accordance with accepted academic practice. No use, distribution or reproduction is permitted which does not comply with these terms.
*Correspondence: Xiaolong Li, bGl4bDIwMTguc3lreUBzaW5vcGVjLmNvbQ==
 Xiaolong Li