- 1Anhui Jiangnan Chemical Industry Limited Liability Company, Anhui Jiangnan Blasting Engineering Co., Ltd., Xuanchen, Anhui, China
- 2School of Mining, China University of Mining and Technology, Xuzhou, Jiangsu, China
Controlling surrounding rock stability in deep soft rock tunnels solely by increasing the support strength is challenging. The key areas where the surrounding rock of a roadway is prone to “instability” should be treated with comprehensive measures, such as drilling to relieve pressure, grouting of the surrounding rock, floor trenching technology, and secondary support, to achieve overall stability of the roadway surrounding rock. In this paper, based on a typical straight wall semi-circular arch roadway project in the Huaibei mining area of Anhui Province, mechanical parameters, such as cohesion, internal friction angle, Poisson’s ratio, and elastic modulus of the surrounding rock, were measured. Displacement stress distribution in surrounding roadway rock were simulated and analyzed using FLAC 3D, and the key parts of the surrounding rock prone to instability under the original roadway support conditions were determined. A suitable arrangement and parameters of the borehole pressure relief in the side roadway, floor grouting, floor trenching, and floor bolt secondary support were selected. Engineering measurements indicated that the engineering techniques were successful. It provided a significant reference for the comprehensive management and treatment of the surrounding rock stability in deep soft rock roadway on a global scale.
1 Introduction
Coal mining and other forms of mining have ventured the deep strata in many countries around the world, such as China, the United States, Russia, Germany, Australia, South Africa, etc. (Hu et al., 2011; Hebblewhite and Galvin, 2017). Due to the deep buried depth of roadway, large stress in original rock and poor properties of surrounding rock, it presents typical “soft rock” characteristics, and maintenance of the stability of the rock surrounding the deep roadways is challenging (Zhang, 2022; Ma et al., 2022; Wu et al., 2024; Wang et al., 2022). A large number of scholars and engineering technicians globally have conducted extensive research (Alejano and Alonso, 2005; Salehnia et al., 2017). Nevertheless, the stability of deep roadways is predominantly regulated by a single support approach. For instance, enhancing the support strength or implementing grouting to modify the characteristics of the surrounding rock mass. Meanwhile, the non-uniform distribution of the stability of the surrounding rock within the roadway has been overlooked. The entire cross-section of the roadway adopts identical support forms and parameters, thereby rendering it arduous to uphold the stability of the roadway. (Staniek, 2012; Prusek and Masny, 2015; Shreedharan and Kulatilake, 2016; Arora and Gutierrez, 2021; Sakhno and Sakhno, 2023). Surrounding rock stability in deep tunnels is determined primarily by the range and degree of looseness and fragmentation and the stability of typical parts; the key parts prone to instability in the surrounding rock can be determined by analyzing the thickness of the loose zone, surface displacement, and surface displacement gradient of the surrounding rock (Kang et al., 2018; Wu et al., 2022; Li et al., 2022; Shi et al., 2024), which could facilitate the proposal of appropriate strategies (Liu, 2019; Zuo et al., 2021; Gao, 2021). The stressed environment, rock mass properties, and support methods of the roadway are the key factors affecting its stability. (Ortlepp and Stacey, 1994; Lou, 2017; Bai and Hou, 2006; Liu et al., 2007; Yang and Zhang, 2021; Xiang et al., 2021; Wu et al., 2022; Xie J et al., 2023; Wang P et al., 2023). In the case of deep high-stress tunnels with poor rock stability, selecting suitable drilling pressure relief arrangements and parameters can reduce the rock maximum principal stress within a certain range around the tunnel and transfer the maximum principal stress to further areas, which reduces the looseness and fragmentation of the surrounding rock, controls the stability of the surrounding rock, and extends roadway service period (Shang et al., 2022; Chen et al., 2022; Yue et al., 2022; Mogi, 1967; Xie S. R. et al., 2023; Shi et al., 2023; Xie J. et al., 2023; Wang X. Q. et al., 2023). There is a wide range of engineering applications that analyze the looseness and fragmentation of the surrounding rock in different parts of the roadway and can be used to select multiple schemes, such as support, grouting, pressure relief, trenching, and secondary support to control surrounding rock stability (Li et al., 2020; Qiang et al., 2020; Cui et al., 2022; Yang et al., 2023; Wu et al., 2020; Zhao, 2024; Kang et al., 2024).
In this study, considering a typical deep vertical wall semi-circular arch roadway in the Huaibei mining area as the engineering background, the key parts of the surrounding rock prone to instability were determined using FLAC 3D software (ITASCA International, Minneapolis, MN, United States) simulation. Based on the original roadway, suitable arrangements and parameters were selected for the drilling relief on roadway side, floor grouting, floor trenching, and secondary support of the floor bolt to ensure roadway floor stability.
2 Engineering and rock mechanical property parameters
2.1 Engineering
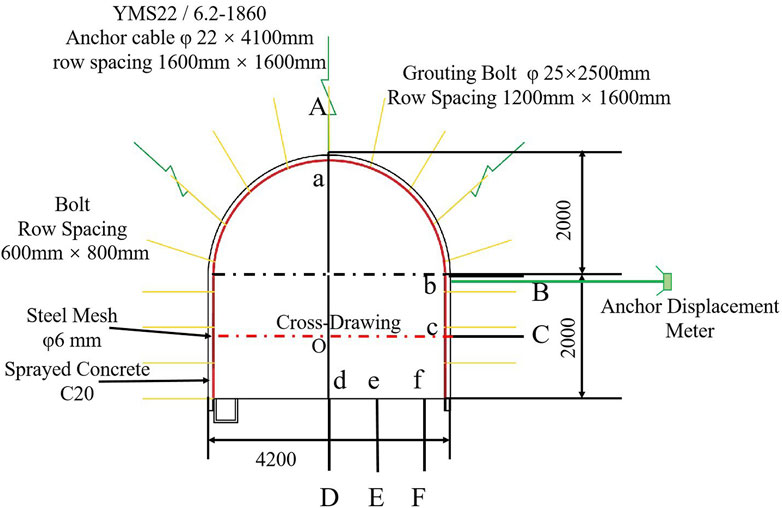
Zhu Xian zhuang Coal Mine is located 13 km east of Suzhou City, Anhui Province. The mine area is 26.3 square kilometers, and the surface is plain. The roadway is the three-level water sump auxiliary roadway, surrounded by three-level uphill and transportation uphill. The roadway design is located at a depth of 20–53 m at the bottom of Coal Seam 10. The buried depth of the roadway is about 700 m. The rock type of the surrounding rock of the roadway side, the direct roof and the direct floor is mainly mudstone, with a thickness of about 16 m. The mud stone layer is expected to strike 127°–152°, dip 37°–62°, and incline 10°–20°. The original roadway is supported by bolts (cables), and the cross-section and support of the roadway are illustrated in Figure 1.
2.2 Surrounding rock mechanical properties
Core drilling was performed on representative parts of the rock surrounding the roadway. The core sample was processed into a standard specimen with a diameter of d = 50.0 mm and a height of h = 100.0 mm. The TAW2000 rock triaxial shear composite testing machine was used to carry out the compressive test on the standard specimen. The longitudinal strain and transverse strain of the standard specimen with different compressive stress were measured, and the elastic modulus E and Poisson‘s ratio λ of the rock were obtained. Shear test was carried out to measure the shear strength of surrounding rock under different axial pressures, and the cohesion c and internal friction angle φ were obtained.
After roadway excavation, the cohesion c and internal friction angle
In the formula:
The dilatancy angle
The shear strain of the surrounding rock can be expressed as follows:
In the formula:
The maximum principal plastic strain and minimum principal plastic strain at different unloading positions after the peak rock strength were measured by MTS press loading. The relationships among the post-peak strength cohesion c, internal friction angle
In the formula,
3 Numerical simulation of displacement stress distribution in surrounding roadway rock
3.1 Numerical simulation model
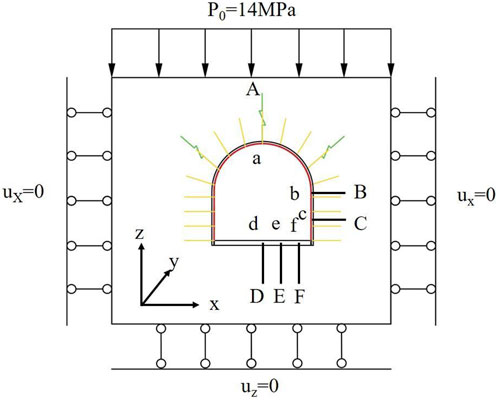
FLAC 3D software was used to numerically simulate the stress–displacement distribution of the surrounding rock. According to the buried depth of the roadway, the roadway section and support shown in Figure 1, the numerical calculation model was established according to the general situation of Section 2.1. The calculation model is shown in Figure 2, and the parts of the roadway rock surrounding are shown in Figure 2 as aA, bB, cC, dD, eE, and fF. The measured results of mechanical parameters of surrounding rock are cohesion c=1.0 MPa, the internal friction angle
The model measures 60.0 m in length, 60.0 m in width, and 0.70 m in thickness. The cross-section of the tunnel is a straight wall semi-circular arch, and its dimensions are shown in Figure 1. The surrounding rock of the tunnel is mudstone. The original rock stress p = 14.0 MPa is applied to the upper part of the model, and fixed constraints are used on both sides and the bottom. The layout parameters of the bolts (cables) are shown in Figure 1, where cable elements are used to simulate the action of the bolts (cables). The elastic modulus of the prestressed bolts (cables) are E = 100 GPa and E = 200 GPa. The tensile strengths are δs = 0.49 GPa and δs = 1.86 GPa, respectively, and the Poisson’s ratio λ = 0.3. The cross-sectional areas were S = 3.8 × 10⁻⁴ m2 and S = 2.488 × 10⁻⁴ m2, and the preloads were F = 70.00 kN, F = 100.00 kN. In order to improve the accuracy of numerical simulation of borehole pressure relief, ABAQUS is used to assist modeling for grid division. According to the geometric size of pressure relief borehole, non-uniform grid is used to encrypt the surrounding rock near the borehole, and the .inp file is output. Then the model is imported through the import option in the FLAC3D toolbar, and then the .f3grid file is output. Finally, the .f3grid model file is called by the imp grid command in the command stream. Better grid division is used to improve the calculation accuracy.
3.2 Numerical simulation results and analysis
3.2.1 Numerical simulation results
The distributions of the cohesion and displacement of the surrounding rock of the roadway are shown in Figures 3A, B. A distribution cloud diagram of the maximum principal stress in the surrounding rock is shown in Figure 3C. The distributions of the cohesion and displacement of the corresponding typical parts at different positions on the surface of the roadway are shown in Figures 4A, B.
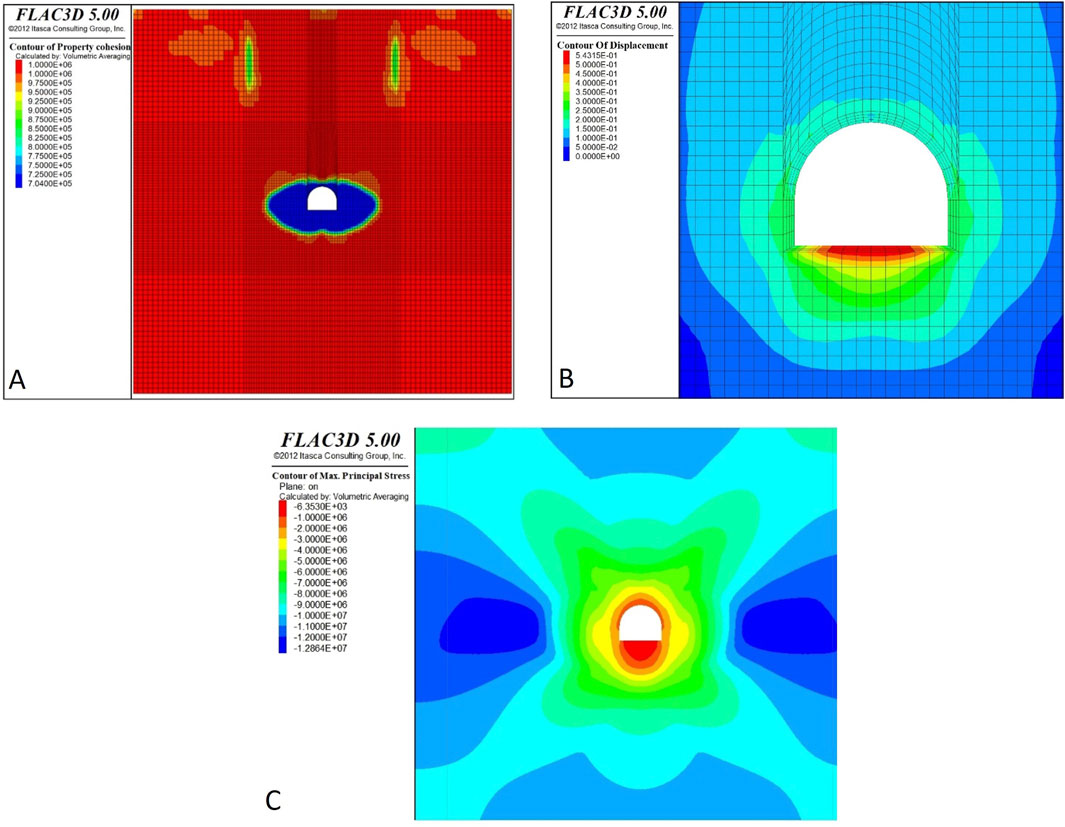
Figure 3. Roadway surrounding rock cohesion, displacement, and maximum principal stress distribution cloud diagram (A) Cohesion of surrounding rock (B) Displacement of surrounding rock (C) Maximum principal stress distribution cloud diagram.
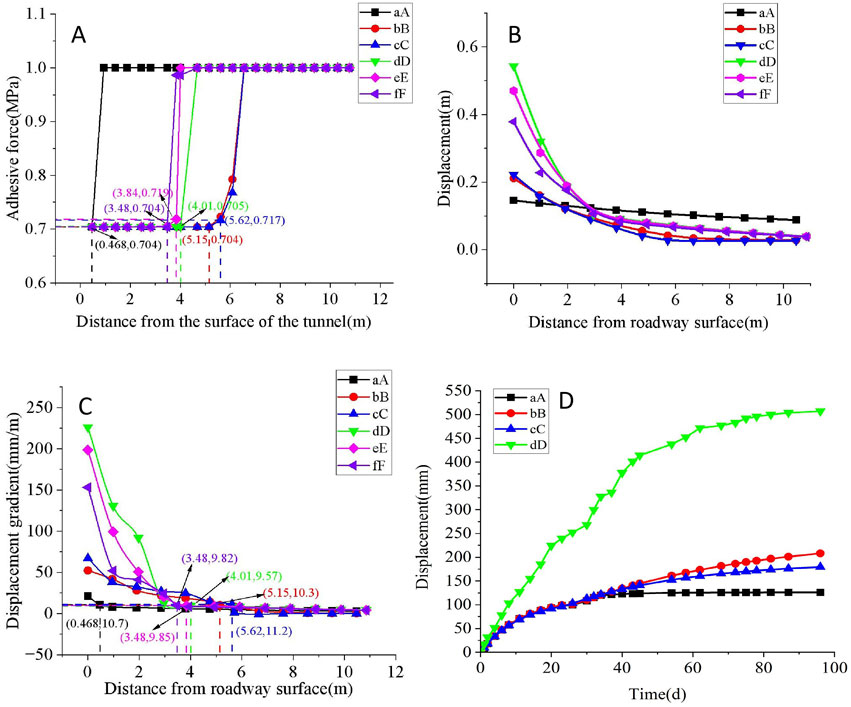
Figure 4. Variation of cohesion, displacement, and displacement gradient of surrounding rock in typical parts with distance from roadway surface (A) Cohesive distribution of surrounding rock (B) Displacement distribution of surrounding rock (C) Displacement gradient distribution of surrounding rock (D) Measured displacement of measuring points in typical parts.
3.2.2 Distribution of looseness and fragmentation in representative surrounding rock
3.2.2.1 Analysis of numerical simulation results
The change in the surrounding rock displacement with distance from the surface of the roadway can be shown as follows (Wu D. Y. et al., 2018):
where r is the distance from the surface of the roadway (m), u is the displacement of the surrounding rock at different distances from the surface of the roadway (m), k0 is the coefficient (mm), k1 is the coefficient (mm), and k2 is the coefficient (/m). The specific values of k0, k1, and k2 are shown in Table 1.

Table 1. Thickness, surface displacement, surface displacement gradient, and boundary displacement gradient of the loose circle in typical parts of a loose circle.
The displacement gradient of surrounding rock is defined as follows (Wu G. et al., 2018):
The displacement gradient at different distances from the roadway surface can be expressed as follows (Wu D. Y. et al., 2018):
According to Equation 10, the displacement gradient of the surrounding rock in representative parts of the roadway changes with change in distance from the surface of the roadway, as shown in Figure 4C. Taking the distribution range of the residual cohesion as the loose circle thickness of the surrounding rock (Wu G. et al., 2018); according to Formula 8, when r = 0, the roadway surface displacement u = k0 + k1; according to Equations 9, 10, when r = 0, the roadway surface displacement gradient η = k1 × k2; the residual strength range in Figure 4A is the thickness of the loose circle; the loose circle thickness, surface displacement, and surface displacement gradient of the surrounding rock in typical parts can be obtained, as shown in Table 1. The corresponding displacement gradient of the boundary of the loose circle thickness is shown in Table 1, and the value is approximately η ≈ 10.0 mm/m. The residual strength distribution range is used as the thickness of the loose circle, and the distribution range of the displacement gradient η ≥ 10.0 mm/m is used as the thickness of the loose circle. The two are consistent, indicating that the thickness of the loose circle can be determined by the critical value of the displacement gradient. The thickness of the surrounding rock loose circle, surface displacement, and surface displacement gradient distribution in the typical parts of the roadway are shown in Figures 5A–C.
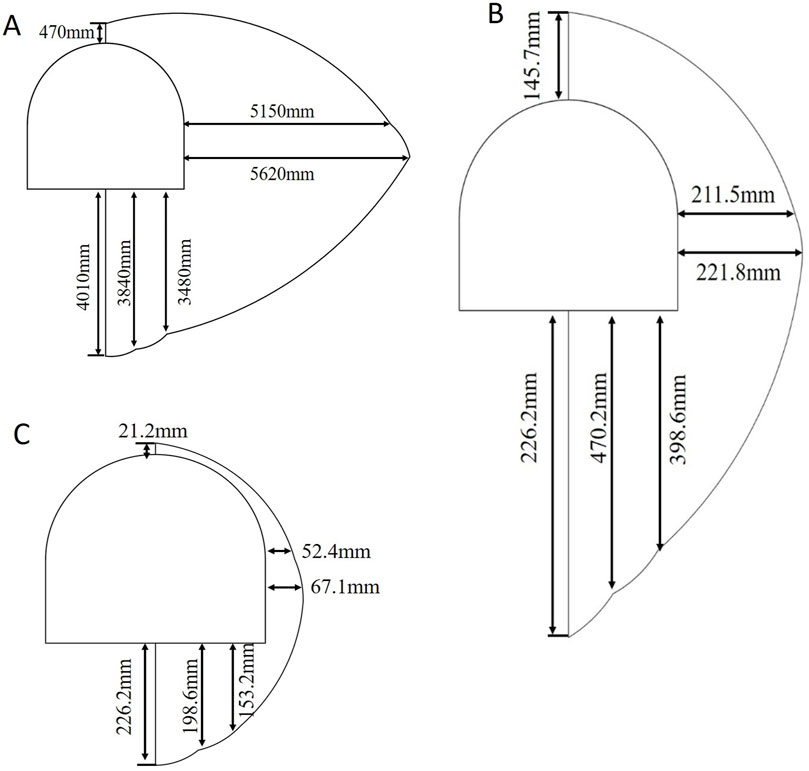
Figure 5. Thickness, surface displacement, and surface displacement gradient distribution of loose circle in typical parts of the roadway (A) Thickness of loosen zone (B) Surface displacement (C) Surface displacement gradient.
Characterization of rock fragmentation degree is represented by displacement gradient of surrounding rock. The surface displacement of aA part of the roadway roof is u = 145.7 mm, the thickness of the loose circle is L = 470 mm, the fragmentation degree is η = 21.2 mm/m, and the looseness and fragmentation of the roadway roof is not significant. The surface displacement of the arch baseline bB position and the cC part in the middle of the wall are u = 211.4 mm and u = 221.8 mm, respectively; the thicknesses of the loose circle are L = 5150 mm and L = 5620 mm, respectively; the degrees of surface fragmentation are η = 52.3 mm/m and η = 67.1 mm/m, respectively; and the looseness and fragmentation of surrounding rock in the upper half of the roadway side are significant. The surface displacements of dD, eE, and fF in the middle of the roadway floor are u = 542.9 mm, u = 470.2 mm, and u = 378.5 mm, respectively; the loose-circle thicknesses are L = 4010 mm, L = 3,840 mm, and L = 3,480 mm, respectively; the degrees of surface fragmentation are η = 226.1 mm/m, η = 198.5 mm/m, and η = 153.2 mm/m, respectively. Although the loose circle thickness on the roadway floor was lower than that on the roadway side, the surface displacement and degree of surface fragmentation increased significantly, and the looseness and fragmentation of the roadway floor, particularly the middle part, were highly significant.
3.2.2.2 Reliability verification of numerical simulation results
In order to confirm the reliability of the numerical simulation results, as shown in Figure 1, The cross-drawing method is used to measure the distance between point a on the surface of the roadway roof, point c on the surface of the middle part of the straight wall, point d on the surface of the middle part of the floor and point O of the cross intersection, and the surface displacement changes of point a, point c and point d on the surface of the roadway are obtained as shown in Figure 4D. The multi-point displacement meter is arranged at point b on the surface of the tunnel arch baseline. According to the measured results, the surface displacement of point b changes with time as shown in Figure 4D. The surface displacement of point a on the roof surface with u = 125.98 mm showed a stable development trend, and the surface displacement of point b on the arch baseline surface with u = 208.17 mm showed an unstable development trend. the surface displacement of point d on the roadway floor middle with u = 506.92 mm showed accelerated instability, and the surface displacement of point c on the roadway side middle with u = 179.33 mm showed an unstable development trend. The measured results verified the reliability of the numerical simulation.
3.2.3 Distribution of maximum principal stress of surrounding rock on roadway side
The maximum principal stress of the roadway side shown in Figure 3C increases from σ = −1.55 MPa to the maximum peak σmax = −12.78 MPa in the r = 0–13.2 m range from the surface of the straight wall of the roadway. An elliptical stress concentration zone formed at a distance of r = 13.2 m from the roadway surface. With an increase in distance, the maximum principal stress of the surrounding rock of the roadway decreases gradually, and the maximum principal stress is stable at σ = −11.96 MPa.
4 Comprehensive treatment scheme of surrounding rock stability
The surrounding rock in the upper half of the roadway side was significantly loose and fragmented, and the maximum principal stress peak concentration area with a large range of ellipses began to appear at a certain distance from the roadway surface. It is advisable to arrange pressure relief boreholes on the roadway side to effectively move the maximum principal stress peak and effectively reduce the maximum principal stress value. As a result, it reduces the looseness and fragmentation and controls surrounding rock stability in the roadway side. The looseness and fragmentation of surrounding rock in the roadway floor middle part was highly significant. Drilling, grouting, floor trenching, and supplementing bolts could significantly reduce the looseness and fragmentation and control the stability of the surrounding rock of the roadway floor.
4.1 Parameter selection for drilling pressure relief in surrounding rock on roadway side
As shown in Figures 6A–D, different numbers and row spacings of pressure relief boreholes with length L = 15.0 m and diameter d = 10.0 cm were arranged at the roadway side. The corresponding distribution of the maximum principal stress of the surrounding rock is shown in Figures 7A–E. The influence of maximum principal stress size and distribution of the middle cC part of the surrounding rock is shown in Figure 8. The maximum principal stress peak value of the undrilled pressure relief is in the r = 13.2 m position. As shown in Figures 6A–D, the maximum principal stress peaks are located at the distances r = 15.8 m, r =16.2 m, r = 17.1 m, and r = 17.1 m from the surface of the roadway, respectively; compared with the pressure relief without drilling, the maximum principal stress peak shifts are Δr = 2.6 m, Δr = 3.0 m, Δr = 3.94 m, and Δr = 3.94 m, respectively. As shown in Figure 6A, the maximum principal stress can be effectively moved by arranging three pressure relief boreholes with a row spacing of a × b = 1.0 m × 1.0 m on the roadway side. The maximum principal stress peak was r = 13.2 m without drilling pressure relief, and the maximum principal stresses were σ = −12.24 MPa, σ = −12.15 MPa, σ = −11.32 MPa, and σ = −7.99 MPa, when compared with that in the undrilled pressure relief; the maximum principal stresses were reduced by 0.54, 0.63, 1.46, and 4.79 MPa, respectively. As shown in Figure 6D, the maximum principal stresses of the four pressure relief boreholes with spacing a × b = 0.5 m × 0.5 m were reduced excessively. The bearing capacity of the surrounding rock was weakened greatly, and it was in a state of excessive pressure relief, as shown in Figure 6C. The maximum principal stress can be reduced by arranging three-row spacing a × b = 1.0 m × 1.0 m pressure relief boreholes on the roadway side. As shown in Figure 6B, with other conditions remained unchanged, the surrounding rock maximum principal stress distributions of different pressure relief borehole diameters with d = 50.0 mm, d = 80.0 mm, d = 100.0 mm, d = 150.0 mm, and d = 200.0 mm were analyzed. The pressure relief borehole diameter was d = 100.0 mm, which can effectively reduce and move the surrounding rock maximum principal stress. When other conditions remained unchanged, the maximum principal stress distributions of the rock surrounding the roadway with different pressure relief borehole lengths of L= 8.0 m, L = 12.0 m, L = 15.0 m, L = 18.0 m, and L = 20.0 m were analyzed. The length of the pressure relief borehole was L = 15.0 m, which effectively reduced and moved the maximum principal stress of the surrounding rock. The arrangement parameters of the pressure relief boreholes were as follows: length L = 15.0 m, diameter d = 10.0 cm, and row spacing a × b = 1.0 m × 1.0 m.
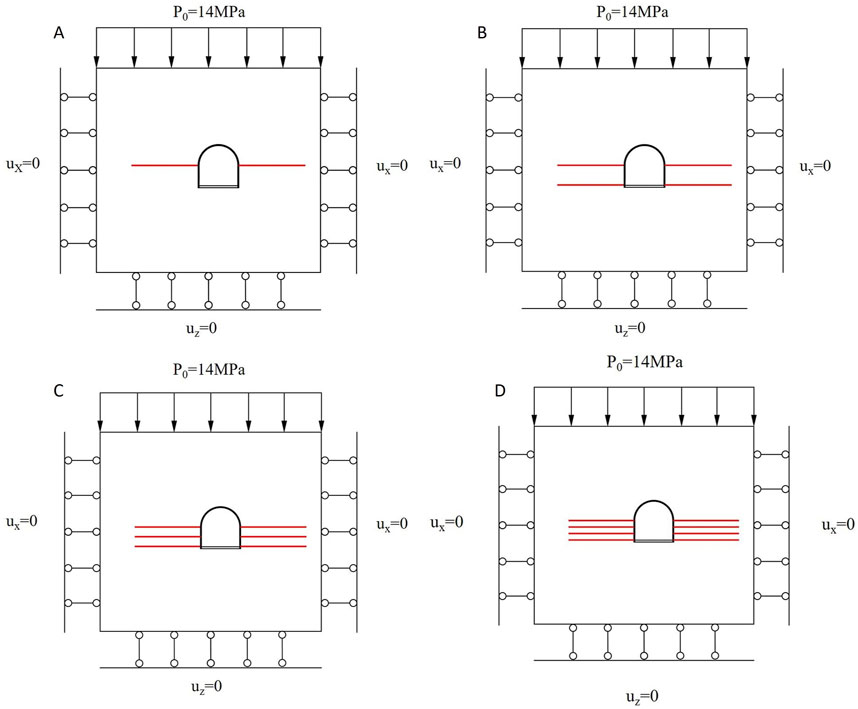
Figure 6. Numerical calculation model of borehole pressure relief with different number and row spacing of sidewalls (A) Single row (B) a × b = 0.5 m × 0.5 m (C) a × b = 1.0 m × 1.0 m (D) a × b = 2.0 m × 2.0 m.
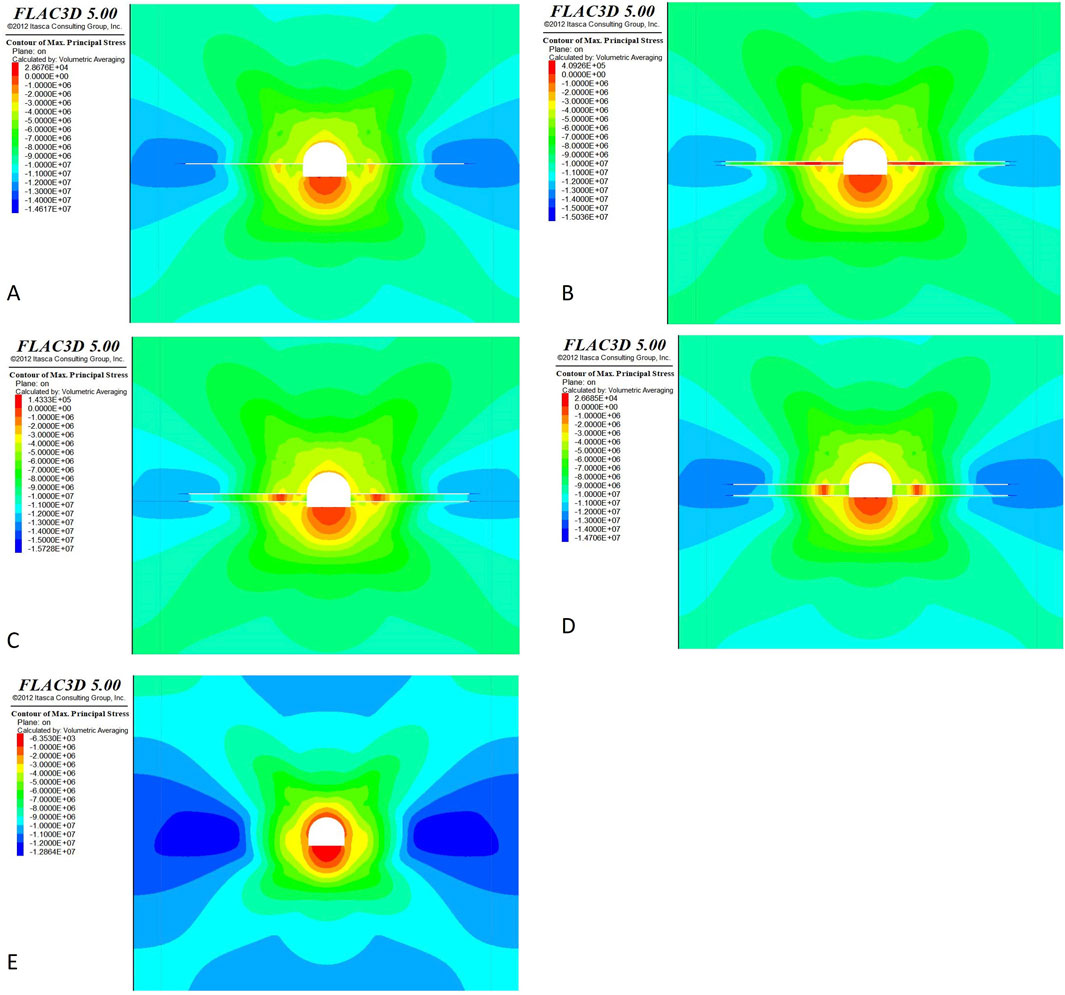
Figure 7. Maximum principal stress cloud diagram of surrounding rock with different row spacing a × b between pressure relief boreholes (A) Single row, (B) a × b = 0.5 m × 0.5 m, (C) a × b = 1.0 m × 1.0 m, (D) a × b = 2.0 m × 2.0 m (E) No pressure relief drilling hole.
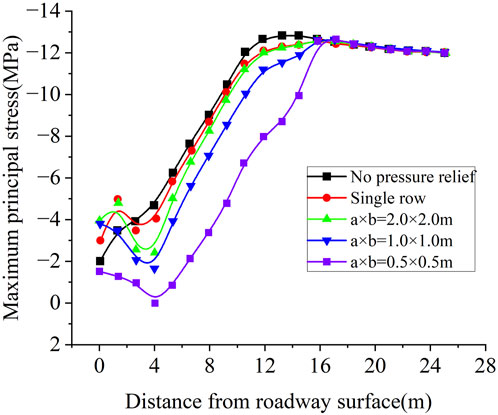
Figure 8. Distribution of the maximum principal stress of pressure relief in different numbers and spacing of boreholes in the side.
4.2 Arrangement of roadway floor grouting and pressure relief trenching
4.2.1 Roadway floor grouting
When the roadway floor was arranged with a grouting bolt with L = 3.0 m, the rock cohesion of the surrounding rock floor increased from c = 1.0 MPa to c = 1.5 MPa. The internal friction angle increased from φ = 22° to φ = 28°. The elastic modulus increased from E = 1.3 GPa to E = 1.5 GPa. The Poisson’s ratio decreased from λ = 0.35 to λ = 0.33. The displacement cloud diagrams of the surrounding rock before and after floor grouting obtained by the numerical simulation are illustrated in Figures 9A, B. After grouting, the surface displacement of the surrounding rock at the dD part of the middle floor of the roadway was reduced from u = 523.0 mm to u = 285.0 mm, which effectively reduces the looseness and fragmentation of the surrounding rock of the floor.
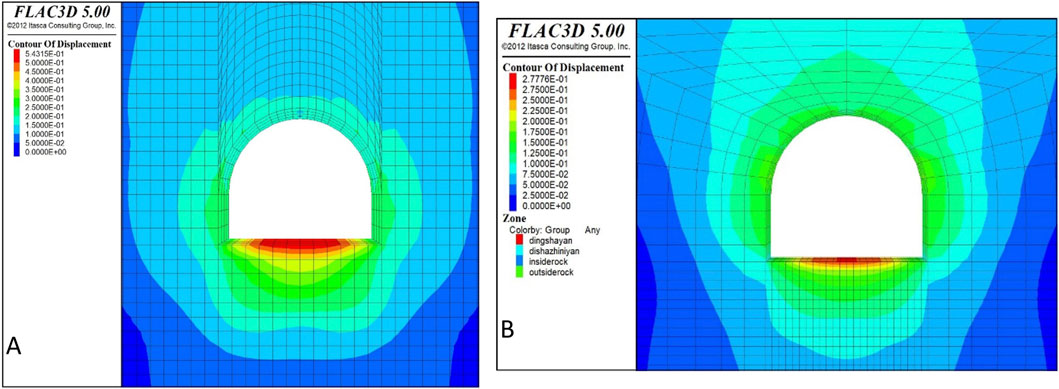
Figure 9. Displacement cloud diagram of surrounding rock before and after grouting of roadway floor (A) Before anchor grouting (B) After anchor grouting.
4.2.2 Layout of roadway floor trenching
The trenching was arranged in the middle of the floor. The displacement cloud diagrams of the roadway surrounding rock with a width of w = 1.0 m and a height of h = 0.4 m, and with a width of w = 2.0 m and a height of h = 0.4 m are shown in Figures 10A, B. The numerical simulation results showed that the width of the trenching increased from w = 1.0 m to w = 2.0 m. The surface displacement of the roadway floor decreased from u = 268.0 mm to u = 239.0 mm, and the width of the trenching continued to increase. The reduction of the surface displacement of the floor was less prominent, and the trenching width was w = 2.0 m.

Figure 10. Displacement cloud diagram of different excavation widths of roadway (A) w = 1.0 m, h = 0.4 m (B) w = 2.0 m, h = 0.4 m.
The influence of trenching depth was analyzed further. When the width of the trenching was w = 2.0 m, the trenching depth increased from h = 0.4 m to h = 0.75 m and 1.0 m. The surface displacement of the middle part of the roadway floor decreased from u = 239.0 mm to u = 171.0 mm and u = 179.7 mm. The trenching depth increased from h = 0.4 m to h = 0.75 m, and the surface displacement of the roadway floor decreased by 28.41%. Conversely, when the trenching depth increased from h = 0.75 m to h = 1.0 m, the surface displacement of the roadway floor increased. The suitable trenching width was w = 2.0 m and the depth was h = 0.75 m.
4.3 Parameters for secondary floor bolt support
As shown in Figures 3, 4 and Table 1, the middle part of the roadway floor was looser and more fragmented than the two ends. The floor was arranged with bolt secondary supports to control floor stability further. The layout is seven bolts with a length of L = 3.0 m and a spacing of a × b = 0.7 × 0.7 m are arranged in the full length of the roadway floor, and five bolts with a length of L = 3.0 m and a spacing of a × b = 0.7 × 0.7 m are arranged in the middle of the roadway floor. The displacement cloud diagrams of the surrounding rock with different floor bolt distributions are shown in Figures 11A, B, and the displacement of the surrounding rock of part dD in the middle of the roadway floor varies with variation the distance from the surface of the roadway. As shown in Figure 11C, the surface displacements of the dD part in the middle of the roadway floor were u = 116.0 mm and u = 108.0 mm, with a difference of 8.0 mm. In the two layout forms of dD, eE, and fF, the distance from the surface of the roadway was r > 1.5 m, the displacement of the surrounding rock was the same, and the arrangement of bolt in the middle of the roadway floor was more suitable.
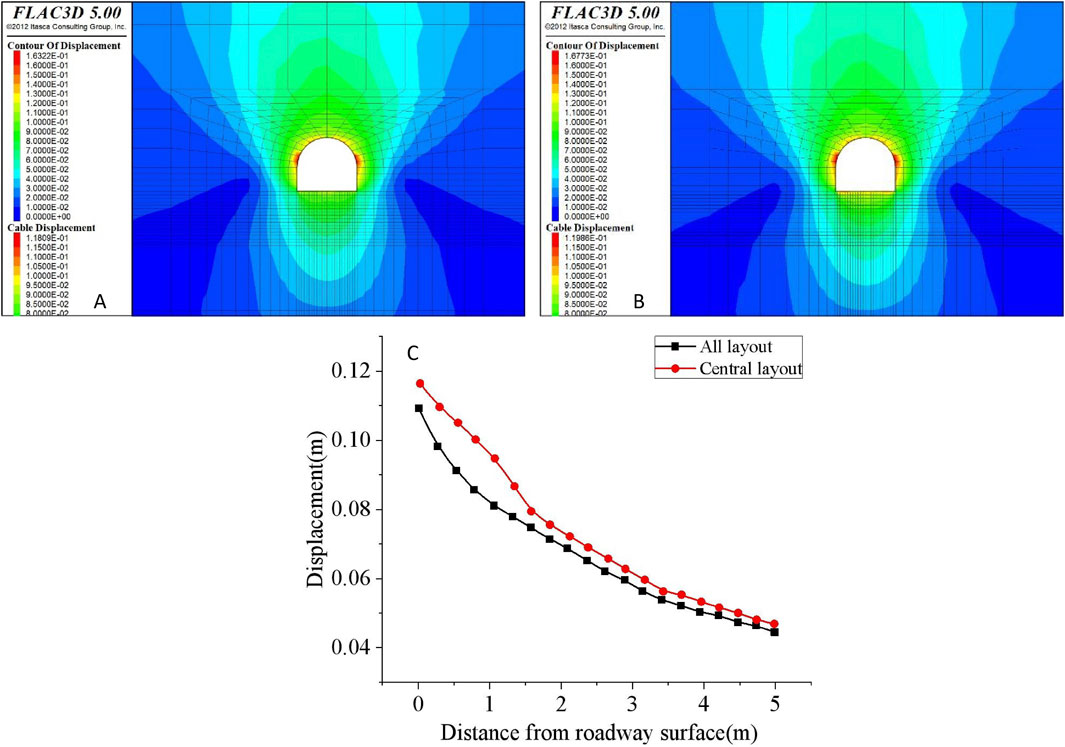
Figure 11. Displacement comparision of surrounding rock with different floor bolt distribution (A) Roadway floor fully arranged with bolts (B) Arrangement of bolts in the middle of the roadway floor (C) Displacement of the dD part with different bolt distribution.
Five bolts were arranged in the middle of the roadway floor to determine the bolt length with L = 0.5, L = 1.0, L = 2.0, and L = 3.0 m. The displacement cloud diagram of the surrounding rock with different floor bolt lengths are shown in Figures 12A–D. A comparison of surrounding rock displacement with distance in the middle dD part of the roadway floor with different bolt lengths is shown in Figure 12E. The surface displacement of the dD part in the middle of the roadway floor with different bolt lengths is u = 165.0 mm, u = 158.0 mm, 130.0 mm, and 116.0 mm, and the length of the bolt should be L = 2.0–3.0 m.
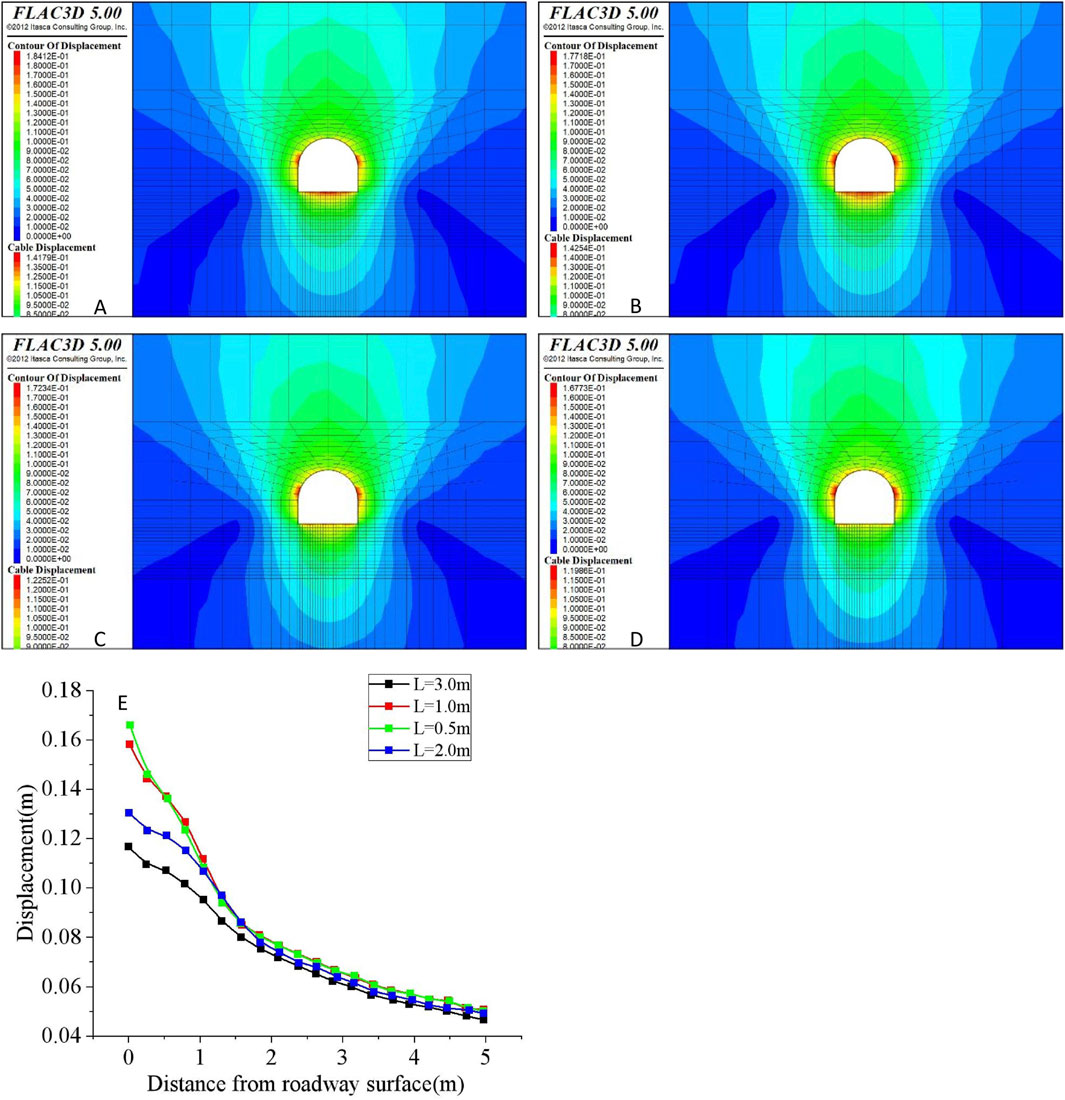
Figure 12. Displacement comparision of surrounding rock of roadway with different floor bolt length (A) L = 0.5 m (B) L = 1.0 m (C) L = 2.0 m (D) L = 3.0 m (E) Displacement of the dD part with different bolt length.
As shown in Figures 3, 4 and Table 1, the looseness and fragmentation of the surrounding rock in parts eE and fF of the roadway floor are weaker than those in part dD of the roadway floor. Considering the drilling efficiency of the floor decreases with an increase in the drilling depth, the length of the bolt in this part can be reduced appropriately. The lengths of the bolt in the dD, eE, and fF parts of the roadway floor are L = 3.0 m, L = 2.2 m, and L = 2.2 m. The displacement cloud diagram of the rock surrounding the roadway is shown in Figure 13A. Compared with the lengths of the bolt, L = 3.00 m, L = 3.0 m, and L = 3.0 m, respectively. The displacement of the surrounding rock in the dD part of the roadway floor changed with a change in the distance from the roadway surface, as shown in Figure 13B. The surface displacements of the dD part in the middle of the roadway floor were u = 116.0 mm and u = 121.0 mm, with a difference of only 5.0 mm. The length of the bolt in the dD part of the roadway floor was L = 3.0 m, and two bolts with L = 2.2 m and L = 2.2 m were arranged on each side. The a × b = 0.7 × 0.7 m bolt can effectively control floor displacement.
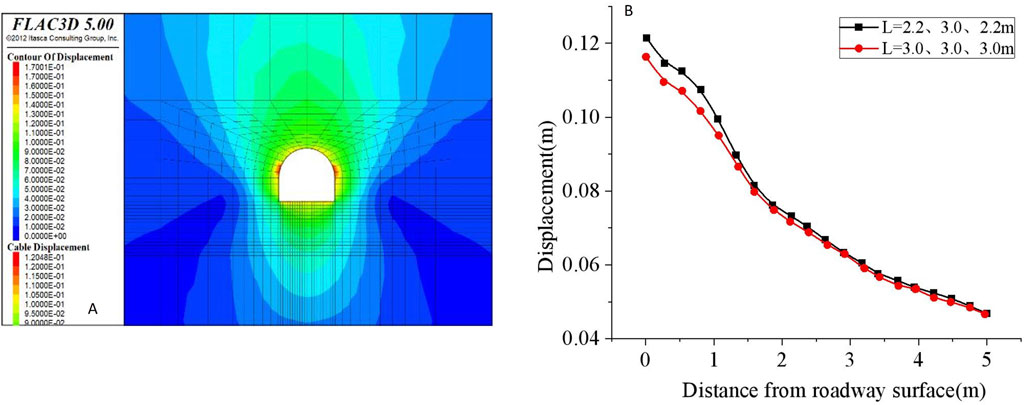
Figure 13. Displacement comparision of different bolt length arrangement in the middle of roadway floor (A) Bolt length L = 2.2 m, 3.0 m, 2.2 m Surrounding rock displacement cloud chart (B) Displacement comparison of surrounding rock with different bolt length arrangement.
5 Engineering application and verification
Based on the above analysis, a suitable treatment scheme for the stability and suitability of the rock surrounding the roadway is shown in Figure 14. Based on the original support scheme, three pressure relief boreholes with a diameter of d = 10.0 cm, a length of L = 15.0 m, and a row spacing of a × b = 1.0 × 1.0 m are added at the upper half of the roadway side. The roadway floor was arranged with a grouting bolt with length of L = 3.0 m, width w = 2.0 m, and a depth of h = 0.75 m, with trenching in the center of the floor. In addition, a bolt with length of L = 3.0 m was arranged at the dD position, and bolts with lengths of L = 2.2 m and L = 2.2 m were arranged on both sides. The row spacing was a × b = 0.7 × 0.7 m.
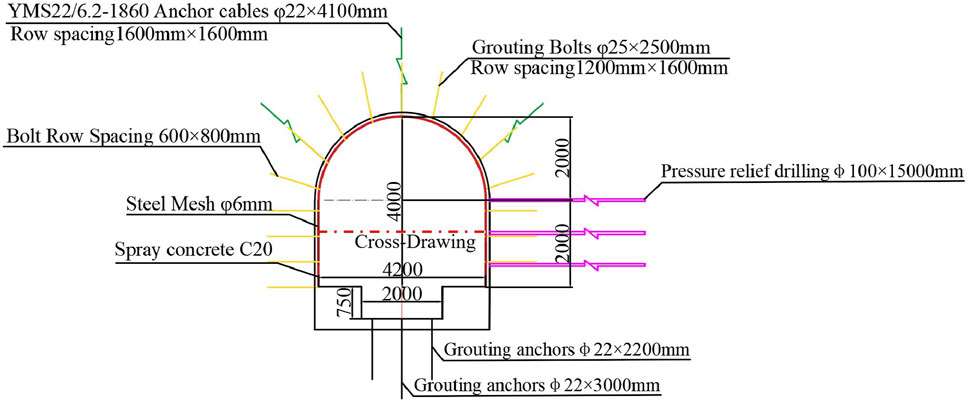
Figure 14. Layout diagram of comprehensive control of the surrounding rock stability of the roadway.
To verify the application effect of the treatment scheme, as shown in Figure 14, cross drawing method is adopted to measure the surface displacement of typical parts of roadway surrounding rock by engineering, and the results are the surface displacement of the roadway floor of the point d with u = 112.7 mm tended to be stable, and the surface displacement of the point c on the surface of the middle part of the straight wall side with u = 132.4 mm tended to be stable. It has been applied in engineering practice with positive results.
6 Discussion
(1) This research focuses on the deep soft rock roadway of the third-level water sump in Zhu Xianzhuang Mine in China. Despite the specific roadway feature (including a burial depth of 700 m, mudstone lithology, a straight wall semi-circular arch cross-section, and an approximate cross-sectional area of 15 square meters etc.), the research methods in this paper have extensive applicability in analyzing the stability of diverse tunnels. The key measures such as drilling pressure relief, floor grouting, floor trenching, and secondary bolt support can be extended to deep tunnels globally, especially those in soft rock under high stress.
(2) A FLAC 3D model tailored to specific engineering conditions is developed to analyze the loosening and fracturing of surrounding rock under diverse scenarios. Parameters for drilling pressure relief, floor grouting, floor trenching, and secondary bolt support are adjusted to accommodate varying geological conditions and engineering requirements. The application in this study can be further expanded, combined with existing research results (Alejano and Alonso, 2005; Salehnia et al., 2017), these findings can be applied to analyze the loosening and fracturing of surrounding rock in complex tunnel environments, such as cross tunnels and regions impacted by mining activities and to guide the selection of comprehensive treatment plans that effectively enhance rock stability in challenging environments.
(3) This study adopts a multi-faceted approach to stabilize the surrounding rock, integrating FLAC 3D simulation with techniques such as drilling pressure relief, floor grouting, floor trenching, and secondary bolt support. This comprehensive, multi-method approach stands in contrast to traditional support strategies that typically rely on a single technology. While the findings show promising applicability, variations in geological conditions in real-world projects may influence their effectiveness, necessitating field validation to ensure the global applicability of these methods.
7 Conclusion
(1) The surface displacement is 211.48–221.84 mm, the thickness of the loose circle is 5.15–5.62 m, and the surface expansion degree is 52.36–67.13 mm/m; the surrounding rock in the upper half of typical roadway side shows a large range of loosening and fragmentation, and relatively high fragmentation degree. The surface displacement is 378.58–542.99 mm, the thickness of the loose circle is 3.48–4.01 m, and the degree of surface expansion degree is 153.20–226.17 mm/m; the surrounding rock in the middle part of the tunnel floor exhibits a relatively large range of loosening and fragmentation, and significant fragmentation degree. Effective measures for controlling the stability of the surrounding rock in these locations should be selected.
(2) Drilling pressure relief can effectively maintain the stability of the surrounding rock on the roadway side. The borehole pressure relief layout and parameter selection are as follows: a pressure relief borehole length of L = 15.0 m, a pressure relief borehole spacing of a × b = 1.0 m × 1.0 m, and a pressure relief borehole diameter of d = 10.0 cm.
(3) The roadway floor grouting, floor trenching, and bolt secondary support can effectively maintain the stability of the surrounding rock on the roadway floor. Layout and parameter selection are as follows: grouting bolt L = 3.0 m, width w = 2.0 m, and height h = 0.75 m, and trenching is arranged in center of roadway floor. In addition, a bolt with L = 3.0 m is arranged at the dD position, and bolts with L = 2.2 m and L = 2.2 m are arranged on both sides, with a row spacing of a × b = 0.7 × 0.7 m.
Data availability statement
The original contributions presented in the study are included in the article/supplementary material, further inquiries can be directed to the corresponding author.
Author contributions
YL: Conceptualization, Data curation, Formal Analysis, Investigation, Methodology, Project administration, Resources, Software, Supervision, Validation, Visualization, Writing–original draft, Writing–review and editing. XY: Funding acquisition, Software, Validation, Visualization, Writing–original draft, Writing–review and editing.
Funding
The author(s) declare that financial support was received for the research, authorship, and/or publication of this article. National Natural Science Foundation: Research on basic theory and key technology of gob-side entry retention with controlled roof cutting in a fully mechanized caving mining group, U21A20107.
Conflict of interest
Author YL was employed by Anhui Jiangnan Chemical Industry Limited Liability Company, Anhui Jiangnan Blasting Engineering Co., Ltd.
The remaining author declares that the research was conducted in the absence of any commercial or financial relationships that could be construed as a potential conflict of interest.
Generative AI statement
The author(s) declare that no Generative AI was used in the creation of this manuscript.
Publisher’s note
All claims expressed in this article are solely those of the authors and do not necessarily represent those of their affiliated organizations, or those of the publisher, the editors and the reviewers. Any product that may be evaluated in this article, or claim that may be made by its manufacturer, is not guaranteed or endorsed by the publisher.
References
Alejano, L. R., and Alonso, E. (2005). Considerations of the dilatancy angle in rocks and rock masses. Int. J. Rock Mech. Min. Sci. 42, 481–507. doi:10.1016/j.ijrmms.2005.01.003
Arora, K., and Gutierrez, M. (2021). Viscous-elastic-plastic response of tunnels in squeezing ground conditions: analytical modeling and experimental validation. Int. J. Rock Mech. Min. Sci. 146, 104888. doi:10.1016/j.ijrmms.2021.104888
Bai, J. B., and Hou, C. J. (2006). Control principle of surrounding rocks in deep roadway and its application. J. China Univ. Min. Technol. 02, 145–148.
Chen, L., Fan, G. W., Zhang, D. S., Fan, Z. L., Wang, X. F., Zhang, W., et al. (2022). Numerical simulation of crack initiation and propagation evolution law of hydraulic fracturing holes in coal seams considering permeability anisotropy and damage. Minerals 12, 494. doi:10.3390/MIN12040494
Cui, F., Zhang, S., Chen, J., and Jia, C. (2022). Numerical study on the pressure relief characteristics of a large-diameter borehole. Appl. Sci. 12, 7967. doi:10.3390/app12167967
Gao, Y. C. (2021). Numerical simulation analysis of pressure relief in deep roadway floor by grooving. J. Luoyang Inst. Sci. Technol. Nat. Sci. Ed. . 31, 39–43.
Hebblewhite, B., and Galvin, J. (2017). A review of the geomechanics aspects of a double fatality coal burst at Austar Colliery in NSW, Australia in April 2014. Int. J. Min. Sci. Technol. 27, 3–7. doi:10.1016/j.ijmst.2016.10.002
Hu, S. R., Peng, J. C., Huang, C., Chen, P. K., and Li, M. (2011). The research status and progress of deep mine mining above kilometers. China Min. (07), 105–110.
Kang, H. P., Wang, G. F., Jiang, P. F., Wang, J. C., Zhang, N., Jing, H. W., et al. (2018). Conception for strata control and intelligent mining technology in deep coal mines with depth more than 1000 m. J. China Coal Soc. 43, 1789–1800. doi:10.13225/j.cnki.jccs.2018.0634
Kang, H. P., Yang, J. W., Jiang, P. F., Gao, F. Q., Li, W. Z., Li, J. F., et al. (2024). Theory, technology and application of grouted bolting in soft rock roadways of deep coal mines. Min. Metall. Mater. 31, 1463–1479. doi:10.1007/S12613-024-2906-8
Li, G., Ma, F., Guo, J., Zhao, H. J., and Liu, G. (2020). Study on deformation failure mechanism and support technology of deep soft rock roadway. Eng. Geol. 264, 105262. doi:10.1016/j.enggeo.2019.105262
Li, Z. X., Wang, F. Q., Tian, B., Wu, J., Jing, L. W., and Zhang, H. W. (2022). Numerical simulation study on support technology of soft rock roadway in Daliu Coal mine. China coal. 48, 20–26. doi:10.19880/j.cnki.ccm.2022.05.005
Liu, H. G., He, Y. N., Xu, J. H., and Han, L. J. (2007). Numerical simulation and industrial test of boreholes destressing technology in deep coal tunnel. J. China Coal Soc. 01, 33–37.
Liu, T. X. (2019). Study on borehole destressing mechanism and yielding support technology in high-stress roadway. Xuzhou: China University of Mining and Technology.
Lou, S. (2017). Engroove pressure relief of surrounding rock and parameter optimization in high stress soft rock roadway. Huai Nan: Anhui University of Science and Technology.
Ma, Q., Zhang, Y. D., Li, Z. X., Zheng, Y., Song, G. Y., and Hu, L. (2022). The optimized roadway layouts and surrounding rock control technology of the fully mechanized mining surface with large mining heights in high-gas mines. Processes 10, 2657. doi:10.3390/PR10122657
Mogi, K. (1967). Effect of the intermediate principal stress on rock failure. J. Geophys. Res. 72, 5117–5131. doi:10.1029/JZ072i020p05117
Ortlepp, W. D., and Stacey, T. R. (1994). Rockburst mechanisms in tunnels and shafts. Tunn. Undergr. Space Technol. 9, 59–65. doi:10.1016/0886-7798(94)90010-8
Prusek, S., and Masny, W. (2015). Analysis of damage to underground workings and their supports caused by dynamic phenomena. J. Min. Sci. 51, 63–72. doi:10.1134/S1062739115010093
Qiang, S., Pang, J. Y., and Wang, H. (2020). Simulation research on grouting spacing in soft rock roadway. Acad. J. Eng. Technol. Sci. 3.
Sakhno, I., and Sakhno, S. (2023). Numerical studies of floor heave mechanism and the effectiveness of grouting reinforcement of roadway in soft rock containing the mine water. Int. J. Rock Mech. Min. Sci. 170, 105484. doi:10.1016/j.ijrmms.2023.105484
Salehnia, F., Collin, F., and Charlier, R. (2017). On the variable dilatancy angle in rocks around underground galleries. Rock Mech. Rock Eng. 50, 587–601. doi:10.1007/s00603-016-1126-6
Shang, Z. J., Wang, Z. F., Cheng, Z. H., Wang, H. B., Chen, L., Li, L., et al. (2022). Permeability enhancement technology for soft and low-permeability coal seams combined with hydraulic perforation and hydraulic fracturing. Geofluids 2022, 1–13. doi:10.1155/2022/7958712
Shi, H., Chen, W., Zhang, H., Song, L., Li, M., Wang, M., et al. (2023). Dynamic strength characteristics of fractured rock mass. Eng. Fract. Mech. 292, 109678. doi:10.1016/J.ENGFRACMECH.2023.109678
Shi, H., Zhang, H., Chen, W., Song, L., and Li, M. (2024). Pull-out debonding characteristics of rockbolt with prefabricated cracks in rock: a numerical study based on particle flow code. Comput. Part. Mech. 11 (1), 29–53. doi:10.1007/S40571-023-00607-9
Shreedharan, S., and Kulatilake, P. H. S. W. (2016). Discontinuum–equivalent continuum analysis of the stability of tunnels in a deep coal mine using the distinct element method. Rock Mech. Rock Eng. 49, 1903–1922. doi:10.1007/s00603-015-0885-9
Staniek, A. (2012). Identification of discontinuities in resin layer of grouted rock bolts. Exp. Tech. 36, 12–23. doi:10.1111/j.1747-1567.2011.00706.x
Wang P, P., Jiang, Y., Li, P., Zhou, J., and Zhou, Z. (2023). Experimental analysis of pressure relief effect of surrounding rock in high-stress roadways under different drilling parameters. Appl. Sci. 13, 2511. doi:10.3390/app13042511
Wang, X. H., Zhang, H. H., Wu, Z., Li, X. L., Sui, Y., and Gao, R. Q. (2022). Selection and optimization mechanism of the lower return roadway layout in the near residual coal pillar area. Processes 10, 2471. doi:10.3390/PR10122471
Wang, X. Q., Wu, S. J., Tang, H. P., and Chen, B. (2023). Impact of pressure relief borehole on stability of deep roadway and determination of drillings parameters. Min. Metall. Eng. 43 (1-5 + 10).
Wu, D. Y., Fan, Z. F., and Cheng, J. X. (2018). Thickness estimation of deep soft coal rock loose zone based on displacement gradient. Min. Res. Dev. 38, 17–21. doi:10.13827/j.cnki.kyyk.2018.09.004
Wu, G., Fang, X. Q., Bai, H. L., Liang, M. F., and Hu, X. K. (2018). Optimization of roadway layout in ultra-close coal seams: a case study. PLOS ONE 13, e0207447. doi:10.1371/journal.pone.0207447
Wu, J., Jing, H., Gao, Y., Meng, Q., Yin, Q., and Du, Y. (2022). Effects of carbon nanotube dosage and aggregate size distribution on mechanical property and microstructure of cemented rockfill. Cem. Concr. Compos. 127, 104408. doi:10.1016/J.CEMCONCOMP.2022.104408
Wu, J., Jing, H., Yin, Q., Yu, L., Meng, B., and Li, S. (2020). Strength prediction model considering material, ultrasonic and stress of cemented waste rock backfill for recycling gangue. J. Clean. Prod. 276, 123189. doi:10.1016/j.jclepro.2020.123189
Wu, J., Wong, H. S., Zhang, H., Yin, Q., Jing, H., and Ma, D. (2024). Improvement of cemented rockfill by premixing low-alkalinity activator and fly ash for recycling gangue and partially replacing cement. Cem. Concr. Compos. 145, 105345. doi:10.1016/J.CEMCONCOMP.2023.105345
Xiang, Z., Zhang, N., Xie, Z. Z., Guo, F., and Zhang, C. H. (2021). Cooperative control mechanism of long flexible bolts and blasting pressure relief in hard roof roadways of extra-thick coal seams: a case study. Appl. Sci. 11, 4125. doi:10.3390/APP11094125
Xie, J., Li, G., and Jiang, A. Q. (2023). Simulation study on pressure relief parameters of variable-diameter pressure-relief drilling. Saf. Coal Mines. 54, 85–92. doi:10.13347/j.cnki.mkaq.2023.07.011
Xie, S. R., Jiang, Z. S., Chen, D. D., Wang, E., and Lv, F. (2023). A new pressure relief technology by internal Hole-Making to protect roadway in two sides of deep coal roadway: a case study. Rock Mech. Rock Eng. 56, 1537–1561. doi:10.1007/s00603-022-03135-9
Yang, T., Liu, J. Z., Luo, J. Q., Shen, Y. P., and Fu, P. (2023). Study on instability mechanism of soft rock roadway and pressure-relief bolt-grouting support technology. Sci. Rep. 13, 20667. doi:10.1038/S41598-023-47451-8
Yang, T., and Zhang, J. (2021). Research on the treatment technology of soft rock floor heave based on a model of pressure-relief slots. Arab. J. Geosci. 14, 1278. doi:10.1007/S12517-021-07673-4
Yue, X. Z., Tu, M., Li, Y. F., Chang, G. F., and Li, C. (2022). Stability and cementation of the surrounding rock in Roof-Cutting and pressure-relief entry under mining influence. Energies 15, 951. doi:10.3390/EN15030951
Zhang, L. (2022). Discussion on design of deep mining in huainan and Huaibei mining area. Coal Sci. Technol. Mag. 43. doi:10.19896/j.cnki.mtkj.2022.01.002
Zhao, L. (2024). Analysis of the influence of floor grouting reinforcement on the stability of roadway structure. Eng. Manag. Sci. 6. doi:10.12238/EMS.V6I4.7262
Keywords: deep soft rock roadway, numerical simulation, displacement stress distribution, drilling pressure relief, floor grouting, floor trenching, secondary support of floor bolts
Citation: Ling Y and Ying X (2024) Pressure relief for drilling (trenching) and support technology in deep soft rock tunnels. Front. Earth Sci. 12:1501420. doi: 10.3389/feart.2024.1501420
Received: 17 October 2024; Accepted: 28 November 2024;
Published: 18 December 2024.
Edited by:
Hao Shi, Anhui University of Science and Technology, ChinaReviewed by:
Sitao Zhu, University of Science and Technology Beijing, ChinaTao Zhang, Nantong University, China
Wenhua Zha, East China University of Technology, China
Copyright © 2024 Ling and Ying. This is an open-access article distributed under the terms of the Creative Commons Attribution License (CC BY). The use, distribution or reproduction in other forums is permitted, provided the original author(s) and the copyright owner(s) are credited and that the original publication in this journal is cited, in accordance with accepted academic practice. No use, distribution or reproduction is permitted which does not comply with these terms.
*Correspondence: Yang Ling, MTc3Mjk5MDUyNTNAMTYzLmNvbQ==
 Yang Ling
 Xu Ying