 Maria Luisa Sánchez Montes1,2*Erin L. McClymont1Hirofumi Asahi3Joseph Stoner4Christopher M. Moy5Sophie Gleghorn1Jerry M. Lloyd1
- 1Lower Mountjoy Laboratories, Geography Department, Durham University, Durham, United Kingdom
- 2INSTAAR—Institute of Arctic and Alpine Research, University of Colorado Boulder, Boulder, CO, United States
- 3Fukui Prefectural Satoyama-Satoumi Research Institute, Fukui, Japan
- 4College of Earth, Ocean, and Atmospheric Sciences, Oregon State University, Corvallis, OR, United States
- 5Department of Geology, Otago University, Dunedin, New Zealand
The Pacific Ocean is an important region for carbon storage, yet the past ocean–climate interactions are relatively underexplored in explaining glacial/interglacial climate variability during the late Pleistocene re-expansion of the Cordilleran Ice Sheet (CIS). We analysed marine sediment samples from IODP 341 Expedition Site U1418 in the Gulf of Alaska (GOA) using marine and terrestrial biomarkers to study the periodicity of glacial–interglacial cycles over the last 500 thousand years and reconstruct the North Pacific oceanography and marine productivity. Our sea surface temperature (SST) results show that marine isotope stages (MISs) 4 and 6 are the coldest and freshest glacials and MIS 5 and MIS 1 are the warmest and saltiest interglacials. The glacial–interglacials during the last 200 kyr are best observed due to increased sedimentation rates in the GOA during the expansion of the CIS, when coccolithophores increase relative to diatom productivity export. We observe lower %IRDs during cold MIS 6 than during warm MIS 5, and overall lower carbon and nitrogen accumulation rates (TOC and TN MAR) and stable isotope ratios (δ15N and δ13C). We conclude that during MIS 6, the stratification of the cold and fresh surface ocean helped the growth of the CIS, and coccolithophores did not fully exploit the nutrient availability in the ocean but contributed to deep carbon storage and climate cooling. During MIS 5, although SSTs were 6°C warmer, icebergs were more abundant. We infer that higher coccolithophore abundance with different alkenone configurations suggests a change in the dominant coccolithophore groups and changes in the available nutrients, probably as a result of higher influence of the more saline Alaska Current (AC) and lower influence of the Alaska Coastal Current (ACC) at Site U1418. This higher AC influence in the GOA contributed to sedimentary carbon storage and contributed to climate cooling despite the warm climate and higher iceberg discharge. As the last interglacial (MIS 5e) was a time period with similar than modern atmospheric CO2 concentrations, our results provide new understandings of the possible behaviours of CIS and GOA under the current changes in climate.
1 Introduction
During the last 500 Kyr, the record of global ice volume has a distinctive “saw-tooth” shape (Imbrie et al., 1992), characterised by abrupt warmings and gradual coolings (Lisiecki and Raymo, 2005). This saw-tooth shape is also recorded in ice-core atmospheric CO2 and CH4 records extending back to 650 ka (Petit et al., 1999; Barnola et al., 2003; Siegenthaler et al., 2005). Due to the length of the glacial–interglacial cycles of the global ice volume record, the late Pleistocene climate has been explained as being sensitive to eccentricity-related astronomical configurations, which exhibit 100 kyr and 400 kyr cyclicity. The 100-kyr and 400-kyr cycles are arguably driven by a combination of precession cycles and/or obliquity cycles, where climate feedback mechanisms must be involved (Abe-Ouchi et al., 2013).
The contribution of the Cordilleran Ice Sheet (CIS) to the global ice volume changes is still underexplored as the stacked records are largely based on data from the North Atlantic Ocean (Lisiecki and Raymo, 2005; Ahn et al., 2017), which is dominated by the links between the Atlantic Ocean and the Laurentide Ice Sheet and, to a lesser extent, the Scandinavian and Eurasian Ice Sheets. The contribution of the CIS to the climate records is expected to differ from the North Atlantic, and could greatly enhance our understanding of under-represented regional environments, their forcing mechanisms, and the role of the North Pacific in the global climate system (Bintanja and van der Wal, 2008). An example of this is the discovery of CIS-originating ice-rafted debris (IRD) peaks or “Siku events” in the Gulf of Alaska (GOA, Site U1419), which preclude Atlantic Heinrich events (Walczak et al., 2020). These findings highlight the importance of North Pacific meltwater during deglacial events (Praetorius et al., 2020). Despite the modern nutrient characteristics of the GOA being in place since the Pliocene (Sánchez-Montes et al., 2022), it is debated when the modern characteristics of ocean temperature dynamics in the wider subpolar North Pacific appeared (Sánchez-Montes et al., 2020). Specifically, the subarctic North Pacific underwent a shift at some point from colder surface temperatures, where the western subarctic Pacific cooled more than the GOA, to the modern pattern, characterised by colder conditions in the eastern subarctic Pacific than the west (Sánchez-Montes et al., 2020).
The subarctic Pacific, along with the Antarctic Ocean, is a region where the phytoplankton-driven carbon sequestration into the ocean (or “biological pump”) is not strong enough to balance the release of deep-ocean CO2 into the surface ocean through water mixing, and so, there is a net leakage of CO2 into the atmosphere (Jaccard et al., 2005). This atmospheric CO2 leakage is reduced by increased water stratification and increased phytoplankton blooms (Francois et al., 1997). Both mechanisms have been proposed to explain decreases in atmospheric CO2 during the Plio–Pleistocene transition (Sánchez-Montes et al., 2022) and the Last Glacial Maximum (LGM) (Sarmiento and Toggweiler, 1984; Siegenthaler and Wenk, 1984), underscoring the importance of studying the last 500 kyr in the GOA.
The understanding of the North Pacific circulation and its teleconnections improves for the LGM and Holocene compared to earlier parts of the geological record (CLIMAP Project Members, 1976). Despite some agreement between models and proxy data, e.g., wetter conditions in Alaska during the Last Interglacial period (de Wet et al., 2023), there are still some disagreements among different models and between models and proxy data (Otto-Bliesner et al., 2006; Rae et al., 2021; de Wet et al., 2023). For example, there are disagreements regarding sea surface temperatures (SSTs) across the North Atlantic and Pacific Oceans during abrupt deglacial periods and the ocean circulation patterns across glacial and interglacial cycles (Praetorius et al., 2020). A multi-proxy approach applied to a single core offers the potential to observe, in detail, the climate–ice sheet–ocean interactions during multiple glacial–interglacial cycles (Zhong et al., 2023). In this study, we assess the climate and productivity of the last 500 thousand years (Kyr) from new data generated from IODP Site U1418 in the Northeast Pacific (Gulf of Alaska). We utilise the higher sampling resolution available at Site U1418, which was drilled to constrain the timing of glacial events on the Pacific side of the northwestern CIS and investigate its relationship with global ice sheet dynamics (Jaeger et al., 2014). We use marine and terrestrial biomarkers and carbon and nitrogen proxies in order to understand the local glacial history of the CIS over Alaska and northwest Canada and its influence on surface ocean characteristics during the last 500 kyr. We increase the sampling resolution for the transition between marine isotope stages (MISs) 6 and 5 to discern ice sheet–ocean–climate interactions, in particular to test whether Siku events occurred during the last interglacial, an interval with atmospheric CO2 levels similar to modern levels, with implications for the current understanding of CIS and GOA future dynamics.
2 Research site
The GOA is in the North Pacific Ocean, offshore southwest Alaska (Figure 1). The oceanography is dominated by the offshore anticlockwise flow of the Alaska Current (AC), which converts into the Alaska Stream when exiting the GOA towards the northwest Pacific and Bering Sea, and the Alaska Coastal Current (ACC), which runs near the continent. The Alaska Current (over Site U1417) is sourced in the warm North Pacific Current that travels eastwards at approximately latitude 40°N, and the ACC (over Site U1418) is sourced in the terrestrial freshwater input from Alaskan rivers and glacier meltwater. The Aleutian Low (AL) is the atmospheric low pressure that, when centred in the GOA during winter, brings storms and ocean mixing. During summer, it is displayed further north, and its effects are less influential in the GOA.
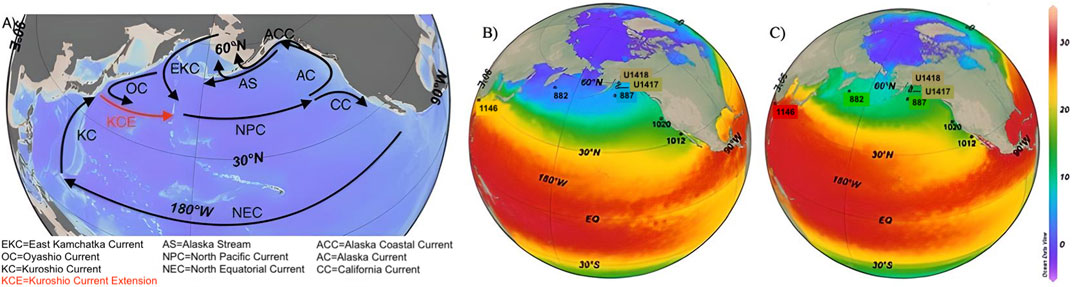
Figure 1. Map of modern ocean circulation and SSTs. (A) Modern North Pacific Ocean circulation and (B) December and (C) September 1955–2013 SST average centred in the North Pacific Ocean (NOAA WOA13; Locarnini et al., 2013), as well as core and sample sites discussed in this study. Map made using Ocean Data View (Schlitzer, 2016).
3 Materials and methods
3.1 Age model, sedimentation rates and oxygen isotopes
The major outline of the age model at U1418 was constructed from biostratigraphic events (Supplementary Table A1). U1418 lithostratigraphic Unit I mud has been interpreted as containing gravity flows (Jaeger et al., 2014). Samples collected for analysis in this study avoided sections in the core with evidence of gravity flows, making the samples obtained for this study suitable for investigating the glacial–interglacial palaeoceanographic variability. Due to different coring methods, the associated error between the gamma-ray attenuation dry bulk density and discrete wet bulk density is 0.0002–0.1 g cm−3 above 350 m CCSF-A and 0.1–0.17 g cm−3 below 350 m CCSF-A.
Orbital-scale oxygen isotope stratigraphy was constructed using δ18O of Neogloboquadrina pachyderma (sin) within a 150–250-μm size fraction. Sliced sediment samples were freeze-dried and then wet-sieved through a 63-μm mesh. Subject foraminifers were hand-picked from the dry-sieved 125–250 μm size fraction. The oxygen isotope measurements were conducted at Oregon State University’s Stable Isotope Laboratory. Alignment of the U1418 δ18O record to the global stack LR04 (Lisecki and Raymo, 2005) was made using the dynamic program “Match 2.3” (Lisecki and Lisecki, 2002) to minimise uncertainties made by hand-tuning. All age constraints made on board (Jaeger et al., 2014) were included within this alignment as reference age constraints. Sedimentation rates were calculated using our isotope stratigraphy and composite depth scale (CCSF-B; Jaeger et al., 2014).
3.2 Biomarkers
Sediments were freeze-dried, microwave assisted extracted and separated using column chromatography (see Sánchez-Montes et al., 2020; Sánchez-Montes et al., 2022). The polar fraction (sterols) was derivatised using a mixture of DCM (50 μL) and BSTFA (50 μL) and then capped and heated at 70°C for 1 h. The GC-FID and GC-CIMS configurations used in this study are detailed by Sánchez-Montes et al. (2020). Lipid biomarkers are quantified as detailed by Sánchez-Montes et al. (2020) and Sánchez-Montes et al. (2022). Alkenones are converted into SSTs using the UK37 and UK37′ indices, following the calibrations of Prahl et al. (1988) and Müller et al. (1998), respectively. The latter does not include C37:4 in the equation as it has been attributed to both temperature and salinity influences and of sea–ice origin (Bendle et al., 2005; Wang et al., 2021). The %C37:4 is the relative abundance of the C37:4 alkenone in relation to all C37:2, C37:3, and C37:4 alkenone configurations. The K37/K38 ratio compares C37 vs. C38 alkenones, where higher values have been observed in coccolithophores of the species Emiliania huxleyi (Prahl et al., 1988; Conte et al., 1998; Müller et al., 1997; McClymont et al., 2005) and lower values in Gephyrocapsa oceanica (Volkman et al., 1995) cultures. Brassicasterol has been identified in diatoms (Kanazawa et al., 1971) and haptophytes (Volkman, 1986). The terrestrial and aquatic n-alkanes, alkenones, and brassicasterol are normalised to the shipboard sedimentation rates, following the following calculations:
The terrestrial aquatic ratio (TAR, Cranwell, 1973) has been calculated to account for the relative contributions of terrestrial vs. aquatic n-alkanes (see Sánchez-Montes et al., 2020).
3.3 Ice rafted debris
Samples for ice rafted debris (IRD) analysis were taken at ∼20-cm intervals along a 13-m section of the piston core spanning late MIS 6 to early MIS 5d. Samples were not taken at regular intervals along the core due to the presence of sand layers, which may obscure the ice-rafting signal (Krissek, 1995; St. John and Krissek, 1999). The high temporal resolution record of 200–300 years was targeted for identifying short-term climatic fluctuations, such as Atlantic-type Heinrich events (Krissek, 1995). A measure of 0.5 g of sediment was sub-sampled from 94 randomly selected sediment samples. A volume of 20 mL of hydrogen peroxide was added to each sample in order to break down organic matter. The samples were placed into a boiling water bath to aid the oxidation of organic matter. Once the organic matter had been fully digested, the samples were centrifuged at 4,000 rpm for 4 min. The supernatant liquid was decanted, and distilled water was added to the samples. The centrifuge process was repeated. Subsequently, 20 mL of distilled water and 2 mL of sodium hexametaphosphate were added to each sample to aid deflocculation. The samples were then analysed using a Coulter laser granulometer. GRADISTAT was used to synthesise the results (Blott and Pye, 2011).
3.4 Carbon and nitrogen bulk and stable isotopes
Freeze-dried sediment was homogenised, weighed (70 mg) into silver capsules, and acidified with 5%–6% sulphurous acid to remove the carbonate phases (Gulick et al., 1990). Aliquots of acid were added, and then, samples were oven-dried at 40°C until no reaction was observed under a binocular microscope to ensure the removal of inorganic carbon. No method was implemented for inorganic nitrogen removal. Samples were then measured using a Varian elemental analyser coupled to a Europa Scientific Continuous-flow Isotope Ratio Mass Spectrometer, where 6 mg of tungsten VI oxide (WO3) was added to each sample to facilitate combustion. The average standard deviation of replicate samples is 0.58‰ for δ15N, 0.006% for total nitrogen (TN), 0.26‰ for δ13C, and 0.031% for total organic carbon (TOC) (n = 8 pairs). TOC and TN were normalised to the accumulation rates of the sediment analysed, where “material” refers to TOC and TN in the equations in Section 3.2.
4 Results
Our SSTs, C37:4 and δ18O records, identify glacial and interglacial cycles during the last 500 thousand years (thousand years ago (ka)) (SSTs between 3.8°C and 11.6°C) (Müller et al., 1998; Figure 2). The SST average slightly increase from 7.6°C to 8.1°C [using the calibration of Müller et al. (1998)], and the %C37:4 average increases from 12% to 17% before and after 200 ka, where MIS 6 and MIS 5 are the most prominent marine isotope stages in the last 500 kyr. The last 200 kyr have higher sample resolution due to higher sedimentation rates (average of 70.4 cm kyr−1 from 500 to 400 ka, average of 94.3 cm kyr−1 until 200 ka, with the highest sedimentation rates (175.1 cm kyr−1) occurring between 365.3 and 354.9 ka, and 134.8 cm kyr−1 until the present, with the highest sedimentation rates of 175.1 cm kyr−1 again between 100 ka and 22.1 ka; Figure 2). TAR values increase from 1.5 to 2.9 and alkenone MARs increase from 201 to 233 μg cm−2 kyr−1 during the last 200 kyr, both peaking during MIS 5e (TAR=20 at 104.95 ka; alkenone MAR=1,058 and 1,685 μg cm−2 kyr−1 at 104.95–106.4 ka, respectively; Figure 3). Terrigenous (from 87.43 to 193.81 μg cm−2 kyr−1) and aquatic n-alkanes (from 62.01 to 77.81 μg cm−2 kyr−1), TOC (from 137 to 143 mg cm−2 kyr−1), TN (from 8.29 to 12.17 mg cm−2 kyr−1), δ13C (from −24.6 to −24.2‰), and δ15N (from 3.8‰ to 4.0‰) also increase during the last 200 kyr (Figure 3) and peak at 104.94 ka (TAR) and 105.8 ka (TOC, TN, δ13C, and δ15N). Brassicasterol MAR, however, shows the opposite trend with higher values before 200 ka (7,185 μg cm−2 kyr−1) than after (1,928 μg cm−2 kyr−1) (Figure 3).
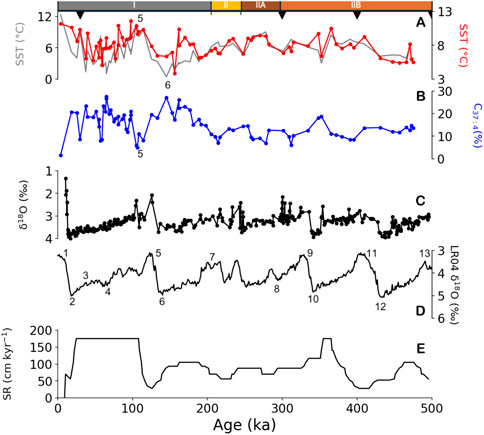
Figure 2. Glacial–interglacial cycles at Site U1418. (A) SST (UK37′) (Müller et al., 1998) (red) and SST (UK37) (Prahl et al., 1988), (°C) (grey), (B) %C37:4, (C) planktonic δ18O (‰) of N. pachyderma (sin) 150–250 μm, (D) LR04 benthic δ18O (‰) stack (Lisiecki and Raymo, 2005), and (E) sedimentation rates based on “Match 2.3” by Lisecki and Lisecki (2002) vs. age (ka). Please note that the y axis for (C, D) has been inverted. The top triangles note the biostratigraphy ages that constrain the age model, and colours differentiate lithostratigraphic units with simplified lithology: orange indicates diamicts (IIB: laminated mud interbedded with mud with dispersed clasts and clast-poor diamict; IIA: muddy clast-poor diamict with interbedded mud and mud with dispersed clasts; and II: muddy clast-poor diamict interbedded with mud including diatom-rich mud), and grey indicates interbedded silt with mud including diatom ooze and calcareous bearing intervals (I) (see Jaeger et al., 2014). Numbers indicate MISs identified by Lisiecki and Raymo (2005) and in U1418 records.
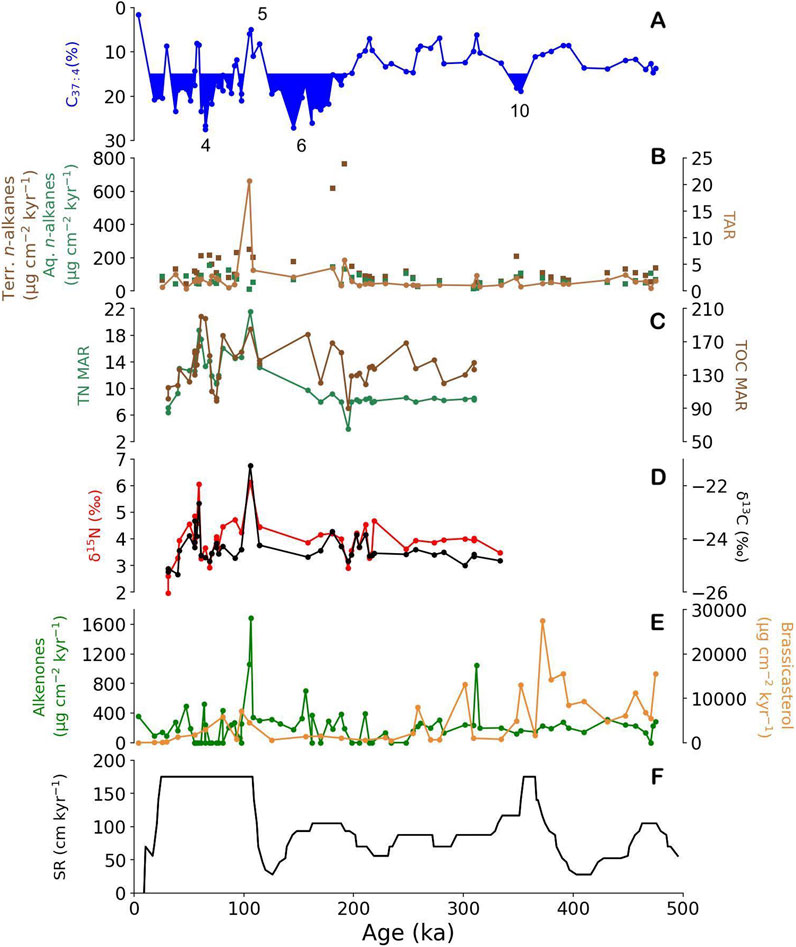
Figure 3. Terrigenous inputs and aquatic productivity at U1418. (A) C37:4 (%), (B) terrigenous (brown) and aquatic (turquoise) n-alkanes (left axis) (μg cm−2 kyr−1) and TAR (light brown line, right axis), (C) TN (MAR; mg cm−2 kyr−1) (turquoise, left axis) and TOC (MAR; mg cm−2 kyr−1) (brown, right axis), (D) δ15N (‰; red, left axis) and δ13C (‰; black, right axis), (E) alkenones (green, left axis) and brassicasterol (orange, right axis) (μg cm−2 kyr−1), and (F) sedimentation rates (cm kyr−1) vs. U1418 age (ka).
Higher-resolution studies of 133–111 ka allow for a closer observation at the coldest and warmest MISs of the last 500 kyr (Figure 4). MIS 6 (134–123 ka) shows SST averages of 6.1°C and %C37:4 of 12% (Figure 4). IRD average is 2% and the K37/K38 average is 1.27, with ranges that largely correspond to values observed in Emiliania huxleyi (1.18–1.71, Prahl et al., 1988; Conte et al., 1998; Müller et al., 1997; McClymont et al., 2005). The transition between MIS 6 and MIS 5 (121–122 ka) shows average K37/K38 values of 0.78, with a sample value of 0.66 found in cultures of Gephyrocapsa oceanica (0.59–0.81, average of 0.7, Volkman et al., 1995). The lower K37/K38 values occur immediately following the lowest %C37:4 concentrations (∼0.8%), between 120 and 122 ka. MIS 5 (133–127 ka) shows SST averages of 9.3°C and average %C37:4 of 5%. IRD counts are 2.5%, and the K37/K38 average value is 1.22, corresponding to values observed in Emiliania huxleyi (1.18–1.71, Prahl et al., 1988; Conte et al., 1998; Müller et al., 1997; McClymont et al., 2005).
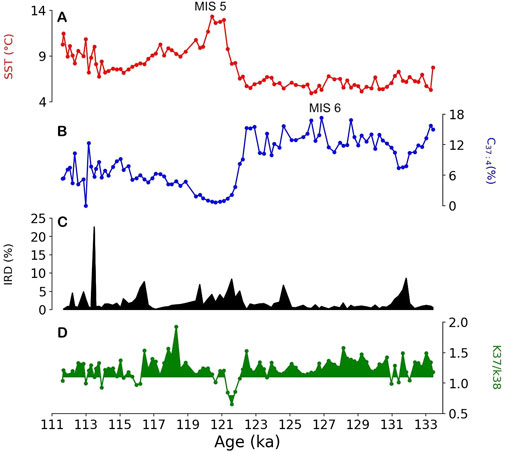
Figure 4. MIS 5e and MIS 6 at Site U1418. (A) SST (UK37′) (Müller et al., 1998), (°C), (B) %C37:4, (C) total IRD counts (%) depicting Siku events (Walczak et al., 2020), and (D) K37/K38 ratio, highlighted in green for different K37/K38 alkenone synthesisers: higher values indicating Emiliania huxleyi (Prahl et al., 1988; Conte et al., 1998; Müller et al., 1997; McClymont et al., 2005) and lower values indicating Gephyrocapsa oceanica (Volkman et al., 1995).
5 Discussion
5.1 MIS 6 (134–123 ka)
We interpret the GOA as a cold, glaciated landscape, with tidewater glaciers delivering small amounts of icebergs but large quantities of glacier meltwater to the ocean (Sánchez-Montes et al., 2020), sustaining a community of coccolithophores similar to the modern Emiliania huxleyi (Figure 4). Due to a similar K37/K38 during the cold MIS 6 and warm MIS 5, we do not interpret the high C37:4 as being of sea–ice origin (Wang et al., 2021) and, therefore, attribute it to different alkenone synthesiser groups. Instead, we continue interpreting this proxy as being of glacial meltwater origin in this setting (Sánchez-Montes et al., 2020), where the background alkenone concentrations are still high to consider sea–ice origin (Meheust et al., 2018).
Intervals of high alkenone productivity export in the Pacific Ocean at ODP 846 and ODP 1090 in the equatorial Pacific and south Atlantic (Figures 1, 6) have been attributed to the advection of cold water into the South Equatorial Current (Emeis et al., 1995) and higher inputs of iron from dust to sustain productivity (Martínez-Garcia et al., 2009). During MIS 6, CO2 and methane in EPICA Dome C are lower, IRD and iron inputs are higher, and dD is lower than that during MIS 5 (Shin et al., 2020). IRD have previously been identified as a source of nutrients for productivity in this area (Müller et al., 2018), with the capacity for atmospheric carbon drawdown during the CIS growth.
5.2 MIS 5e (123–111 ka)
We interpret the transition between MIS 6 and MIS 5 as a reduction in the cold meltwater influence at U1418 and an increased influence of a saline water mass, warming the GOA and creating the conditions for different coccolithophore species to thrive, more similar to the modern Gephyrocapsa oceanica (Figure 4). These findings, when combined with other recent findings in alkenone producers (Bendif et al., 2019; Bendif et al., 2023; Wang et al., 2021), suggest a switch in dominant species in response to an environmental change.
During MIS 5, the GOA was warm but onshore remained a glaciated landscape. At Site U1418, we observe that more icebergs were delivered into the ocean than during MIS 6, perhaps due to a higher melting capacity with warmer SSTs and reduced glacial meltwater inputs, which might have been advected elsewhere. This ocean configuration also sustained a community of coccolithophores similar to the modern Emiliania huxleyi. IRD fertilisation has been observed as a mechanism operating in the GOA that could explain our results (Müller et al., 2018).
Higher alkenone productivity export during MIS 5e has been recorded at all North Pacific sites (Figures 1, 6). The high alkenone records during MIS 5e in the North Pacific have been attributed to changes in denitrification (ODP 1012; Liu et al., 2005), changes in the halocline, the efficiency of the biological pump, and CO2 degassing from the ocean to the atmosphere (ODP 882, Haug et al., 2005). CO2 and methane in EPICA Dome C are higher during MIS 5 than during MIS 6, with lower IRD and iron inputs and higher dD values (Shin et al., 2020). MIS 5e was wetter than the Holocene in the Mississippi River Basin in North America (Suh et al., 2020). If these conditions extended to the GOA, it could indicate that the CIS was still expanding due to increasing orogenic precipitation, similar to what was observed during the MPWP (Sánchez-Montes et al., 2020).
5.3 Last 500 kyr in the Gulf of Alaska
5.3.1 Climate
MIS 6 and MIS 5 are the most extreme glacial and interglacials that are appreciable in our SST and %C37:4 records during the last 500 kyr at Site U1418 (Figure 4). The effects of sedimentation rates on sample resolution are evident from 200 ka (Figure 3), when the glacial/interglacial cycles are more easily identifiable in comparison with the benthic LR04 stack (Lisiecki and Raymo, 2005). We attribute this increase in sedimentation rates to the expansion of the CIS (Gulick et al., 2015), where the CIS reached its maximum extent during MISs 1–6. Perhaps surprisingly, the expansion of the CIS coincides with average 0.5°C warmer SSTs and 5% fresher GOA (%C37:4) than before 200 ka. The SST range is higher than the temperature range in the deep ocean across glacial and interglacial cycles (Land and Wolff, 2011), suggesting local/regional processes. A similarly warmer, fresher, and more glaciated GOA has been discussed during CIS glaciation across the Plio–Pleistocene transition at Site U1417 (Sánchez-Montes et al., 2020) and attributed, as previously described, to a more stratified North Pacific Ocean (Haug et al., 2005), which led to ice growth due to higher ocean evaporation and orogenic precipitation. %C37:4 and sedimentation rates show similar patterns at U1417 (Supplementary Figure A1).
5.3.2 Nutrient availability
After 200 kyr, TAR and terrigenous n-alkane MAR double, and TOC MAR increases four-fold (Figure 3). TAR peaks during MIS 5e, which reflects an increase in terrigenous n-alkanes (Figure 3). We interpret these records as an increase in nutrient delivery to the GOA during the CIS expansion. The land in SW Alaska might have been more vegetated due to the warmer conditions in the GOA (Zhong et al., 2024), and/or the wind might have brought more vegetation residues to the GOA. The latter hypothesis is also supported by the TAR peak during MIS 5e, where we suspect a higher influence of southerly ocean currents in the GOA. It is possible that the weather patterns brought more air from southern (more vegetated) landscapes (Yao et al., 2024). The higher stratified ocean under a more glaciated climate slightly increased carbon storage in the GOA (higher TOC MAR) (Yao et al., 2024) during the last 200 kyr.
5.3.3 Productivity export
All productivity markers (alkenone MARs, aquatic n-alkanes, and TN) increase after 200 kyr, except for brassicasterol MAR, which almost halves during the last 200 kyr (Figure 3). These productivity records depict a small overall increase in calcareous productivity synchronous to the increase in nutrient delivery to the GOA, compared to the higher siliceous productivity pre-200 kyr. Similar to our brassicasterol record, where brassicasterol increase with the increase of glacial conditions from MIS 11 to MIS 10, previous studies have shown that diatoms in the GOA increase during glacial stages (Yao et al., 2022). Peaks in sedimentation rates can be associated with peaks in productivity markers. It has been suggested that aeolian dust and icebergs could be a source of nutrients causing productivity increases in the GOA (Müller et al., 2018). Furthermore, in micronutrient-limited regions such as the GOA, iron fertilisation via meltwater (Addison et al., 2012; Cowan et al., 2020), aeolian input (Crusius et al., 2017), and a decreased upwelling due to a weaker AL during a larger CIS (Yao et al., 2022) might have also increased the organic carbon export of coccolithophores over diatoms after 200 kyr. Productivity export increased during larger terrigenous inputs, bringing probably micronutrients such as iron that favoured the marine productivity of coccolithophores over diatoms (brassicasterol). Similar mechanisms occurred during the Plio-Pleistocene CIS onset (Sánchez-Montes et al., 2020). An overall increase in δ13C and δ15N suggests nutrient depletion, perhaps due to the stratified ocean that locked macronutrients away from the surface, again suggesting micro-nutrient delivery that favoured coccolithophore productivity export. Peaks in δ13C and δ15N during MIS 5e suggest that nutrient depletion was especially occurring during the northward intrusion of southern ocean currents and increased the ACC, that could explain the change in coccolithophore dominant groups with lower K37/K38 (Figure 4). Deglacial sea-level changes have also been attributed to the strengthening of North Pacific currents into the Bering Sea (Sun et al., 2021). Coccolithophores and, perhaps, a small number of diatoms (brassicasterol) were able to profit from such nutrient conditions and increase the C and N storage in the GOA. We suggest that during MIS 5e, the ocean column was less stratified than during the rest of the last 200-kyr record, as indicated by the low %C37:4 (Figures 2, 4).
5.4 Climate of last 500 kyr in the North Pacific
Other sites in the North Pacific also indicate that MIS 5e was the warmest interglacial, although they also highlight the importance of MIS 9e and MIS 11c (Supplementary Table A2). None of the existing sites observe MIS 1 as one of the warmest interglacials. Site U1418 in the GOA shows SSTs higher than the modern average during MIS 1 and MIS 5, and, occasionally, during other interglacials, although it is challenging to confidently constrain the warming due to lower sample resolution and lower sedimentation rates (Jaeger et al., 2014). In contrast, Site 882 in the subarctic western Pacific shows almost continuously SSTs above the modern average (Figure 5). Other sites of the Pacific show only higher SST than modern during MIS 5 (ODP 1020, northeast Pacific and ODP 1146, northwest Pacific), MIS 9 (ODP 1146 and 1012, northeast Pacific), and MIS 11 (ODP 1020).
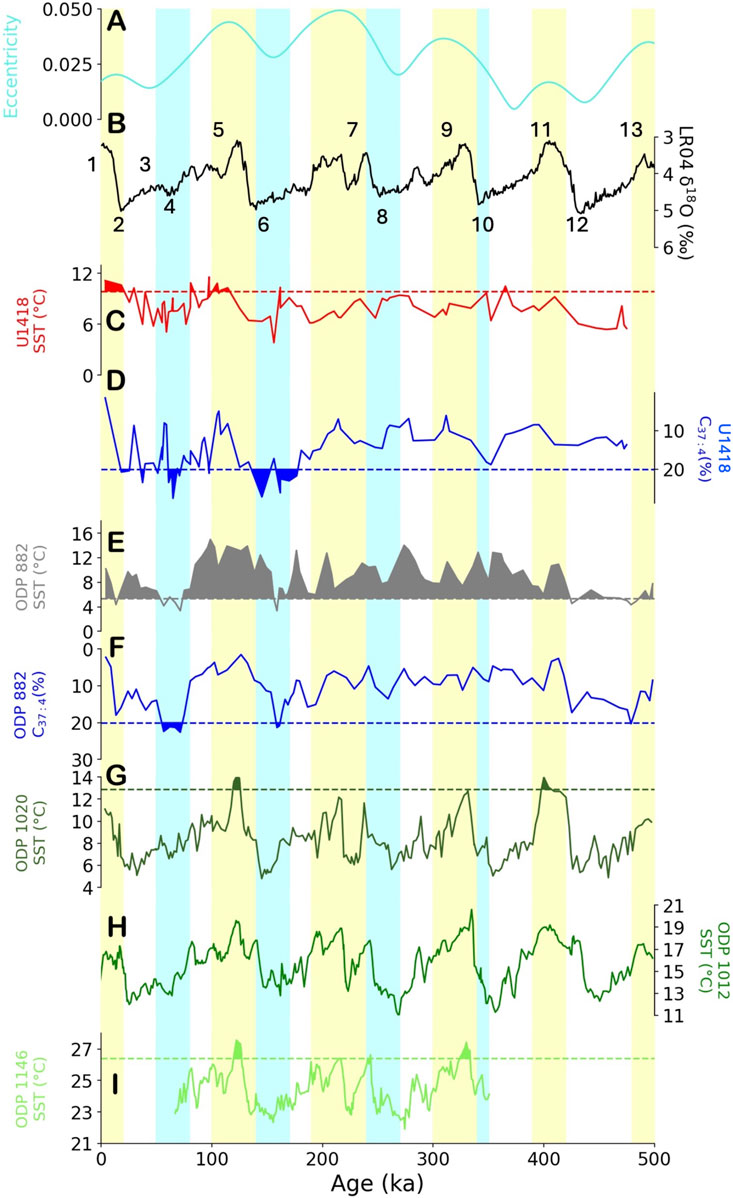
Figure 5. Glacial–interglacial surface temperature changes across the Northern Pacific. (A) Mid-month extra-terrestrial insolation 65°N for July reconstruction (Berger and Loutre, 1999) (W m−2), (B) LR04 δ18O benthic stack (‰; Lisiecki and Raymo, 2005), (C) U1418 SST (°C) from UK37′ using the calibration of Müller et al. (1998), (D) U1418 C37:4 (%), (E) ODP 882 alkenone SST in the subarctic western Pacific (Martínez-García et al., 2010a), (F) ODP 882 C37:4 (%) (Martínez-García et al., 2010b), (G) ODP 1020 alkenone SST (°C) in the northeast Pacific (Herbert, 2001), (H) ODP 1012 alkenone SST (°C) in the northeast Pacific, south of ODP 1020 (Liu et al., 2008), and (I) ODP 1146 alkenone SST (°C) in the northwest Pacific (Herbert et al., 2017) vs. age (ka). See Figure 1 for locations of the referenced data sites. Numbers in (B) indicate MISs. Dashed lines in (C, E, G, I) indicate the modern averaged decadal (1955–2012) annual statistical mean SST at 0 m water depth for each location (NOAA WOA13; Boyer et al., 2013), with filled colours indicating SSTs higher than the averaged decadal annual statistical mean. Dashed lines in (D, F) indicate modern averaged decadal (1955–2012) annual statistical mean salinity at 0 m water depth for each location (NOAA WOA13; Boyer et al., 2013) converted to C37:4 (%), following the association detailed by Wang et al. (2021). Blue-filled (D, F) lines delimit C37:4 above the modern average decadal annual statistical mean salinity (inverted axes).
These SST patterns suggest that the subarctic west Pacific was, anomalously, up to 10°C warmer than modern across the multiple glacial/interglacial cycles of the last 500 kyr, while the rest of the North Pacific Ocean remains generally colder than modern. The temperature difference between the east and west subarctic Pacific suggests a big reservoir of warm water in the west Pacific, with characteristics closer to the east Pacific mid-latitude sites (ODP 1020 and ODP1012). This suggests a closer connection between mid-latitudes and the subarctic west Pacific than the modern ocean currents that influence the area today. The warmer-than-modern ocean currents only reached the rest of the North Pacific sites during peak glacials, with heat distributed in different configurations across the 500-kyr period: MIS 9 further south, mostly stored in the west Pacific, and MIS 5, further northeast. This suggests again that higher winds affected the eastern Pacific, especially during MIS 5. These changes are attributed to a higher AL and North Pacific high (NPH) atmospheric circulations (Yao et al., 2022; Zhong et al., 2024).
%C37:4 values are higher than modern during MIS 6 and MIS 4 at both Site U1418 in the GOA and ODP 882 in the northwest Pacific [%C37:4 values have been converted into salinities following the study by Wang et al. (2021)]. %C37:4 data from other ODP sites shown in Figure 1 have not been successfully tracked down in publicly available data repositories or Supplementary Material. The SST at Site U1418 decreases to the lowest values at MIS 6; however, the fresher than modern ocean is comparable across MIS 6 and MIS 4. The continuously high SST of ODP 882 decreases below the modern average almost exclusively at MIS 6 and MIS 4, and salinities are slightly lower but comparable to the GOA, where more glacial meltwater is available during glacials. This suggests that although the subarctic west-Pacific (ODP 882) was disconnected from the ocean conditions of the subarctic east Pacific (Site U1418) during interglacials, they both reconnect during glacial cycles (e.g., MIS 6), possibly due to a higher presence of glacier influence of the CIS (as observed in Figure 4) in the wider North Pacific. It is possible that modern east–west subarctic Pacific temperature gradients, with warmer conditions in the east than in the west, started to be established during the CIS discharge of MIS 4 but were more clearly established during the LGM (24.3 Kyr aka MIS 2). MIS 6 has been identified as wetter than MIS 2 in the Tibetan Plateau due to an intensified Asian Monsoon (Chevalier et al., 2022), which could suggest a shift in moisture patterns and growth of the CIS. Reconstructed SSTs show a slightly warmer eastern subarctic Pacific than the western subarctic Pacific during peak MIS 6 glacial conditions. However, before and after, the western subarctic Pacific was warmer than the east (Figure 5). The same pattern is observed across MIS 4 (Figure 5). After this, the GOA becomes similarly warmer (MIS 1) or warmer (MIS 2) than the western subarctic Pacific. The LGM difference across the subarctic Pacific does not agree with ocean SST reconstructions from Otto-Bliesner et al. (2006), where models show a warmer western east subarctic Pacific than the east.
6 North Pacific C storage across glacial and interglacials
The productivity export similarities between the tropical (ODP 846) and South Atlantic (ODP 1090) and differences with the North Pacific sites (Site U1418, ODP 1012, and ODP 882) suggest a shift in the main carbon export region from the tropics and the southern hemisphere to higher North Pacific regions during interglacials (Figure 6). In particular, glacial stages without a big CIS glaciation (500–200 ka) seem to be characterised by higher productivity exports in the tropical and southern hemispheres (Figures 6F, G). In contrast, higher atmospheric CO2 and interglacials seem to increase marine productivity in the northeast Pacific during an expanded CIS glaciation (higher sedimentation rates between 200 and 0 ka, Figures 3, 6A–C). More heat delivery to the northeast Pacific during interglacials (Figure 5; Supplementary Figure A1) might suggest higher terrestrial influence in the GOA due to higher changes in the CIS extension (e.g., higher TAR, δ13C, and δ15N during MIS 5e, Figure 3; and MIS 7, Supplementary Figure A2), higher micronutrient delivery to fertilise the ocean (e.g., via increased IRDs (Figure 4, Müller et al., 2018), iron (Shin et al., 2020)) and higher marine productivity (Figure 6). During periods of higher ocean column mixing (as suggested by more saline waters in the GOA during MIS 5e; Figure 4), we might expect higher CO2 degassing into the atmosphere than today (Figure 6A), where CO2 drawdown through surface ocean productivity is not sufficient to counterbalance oceanic degassing into the atmosphere (Jaccard et al., 2005). However, atmospheric CO2 levels today are higher than those during MIS 5e. In contrast, in the Norwegian Sea, stronger stratification has been suggested during MIS 5e (Van Nieuwenhove and Bauch, 2008), which might suggest less North Atlantic contribution to the elevated global atmospheric CO2 concentrations than the North Pacific Ocean. The North Pacific Ocean could have become an extended region of carbon sink during glacials, due to higher water column stratification and sealing of the deeper ocean and atmosphere (Müller et al., 2018), and connection to the west subarctic Pacific. Within this increased stratification from higher glacial meltwater, during MIS 5e our results show peaks in carbon storage (TOC) from marine productivity (high TN, δ13C, and δ13N) which suggest increase mixing during a decrease in meltwater (low C37:4) during the northward migration of the AC. We suggest that iron inputs during glacials (Martínez-García et al., 2011; Müller et al., 2018) maintained similar levels of marine productivity through the exposure and inundation of rock flour from glacial sediments that during ice sheet retreat and sea level increase; in addition, deep sediment mixing serves as another important mechanism to transport iron to onshore sites (Crusius et al., 2011; Crusius et al., 2017). These results could also suggest that ocean currents more effectively connected regions with cold surface temperatures, delivering moisture and heat, whereas heat tended to accumulate in subarctic regions during interglacials. This mechanism might explain the pairing of warmest interglacial with the subsequent coldest glacial observed in Figure 5. This subarctic heat accumulation and delivery mechanisms during glacial and interglacial periods might also have allowed the CIS to continue expanding continuously across the last 500 kyr, similarly to the Plio-Pleistocene CIS onset (Sánchez-Montes et al., 2020).
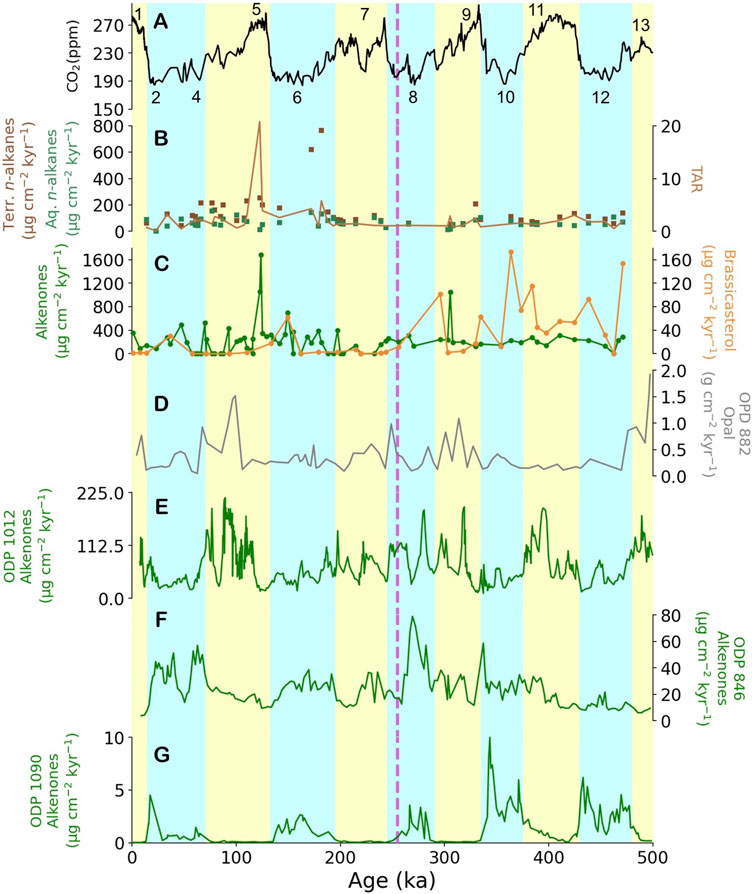
Figure 6. Glacial–interglacial terrigenous inputs and productivity changes across the North and Equatorial Pacific and South Atlantic Oceans. (A) Composite CO2 record EPICA Dome C (Bereiter et al., 2014), (B) terrigenous (brown) and aquatic (turquoise) n-alkanes (left) (μg cm−2 kyr−1) and TAR (right) in U1418, (C) alkenones (green, left) and brassicasterol (orange, right) (μg cm−2 kyr−1) in U1418, (D) ODP 882 opal (g cm−2 kyr−1) (Haug et al., 2005), (E) ODP 1012 alkenones (μg cm−2 kyr−1) (Liu et al., 2005), (F) ODP 846 alkenones (μg cm−2 kyr−1) (Lawrence et al., 2006; Liu and Herbert, 2004), and (G) ODP 1090 alkenones (μg cm−2 kyr−1) (Martínez-Garcia et al., 2009) vs. age (ka).
7 Conclusion
The glacial/interglacial cyclicity follows the timing of orbital configurations such as eccentricity, but their amplitude does not correlate with eccentricity insolation intensity. MIS 6 and MIS 4 are the coldest stages, and MIS 5 and MIS 1 are the warmest marine isotope stages at Site U1418 in the Gulf of Alaska (GOA). MIS 6 is characterised by colder and fresher sea surface temperatures and lower ice-rafted debris. MIS 5, on the contrary, is characterised by warmer and saltier sea surface temperatures and higher ice-rafted debris. We suggest that the water column was more stratified during MIS 6, with lower marine productivity that favoured carbon storage in the deep Gulf of Alaska. The transition between MIS 6 and MIS 5 depicts almost 0% freshwater biomarkers and a change in the K37/K38 ratio, which we attribute to a coccolithophore community change. We suggest that the water column was more mixed and that ocean currents from further south intruded into the GOA, but high marine productivity still favoured carbon sediment storage against carbon degassing into the atmosphere. We find that moisture accumulation during interglacials and heat re-distribution during glacials are key mechanisms for the growth of the CIS and changes in atmospheric carbon.
Data availability statement
The raw data supporting the conclusions of this article will be made available by the authors, without undue reservation.
Author contributions
MS: data curation, formal analysis, funding acquisition, investigation, methodology, project administration, software, visualization, and writing–original draft. EM: conceptualization, funding acquisition, investigation, methodology, project administration, resources, supervision, and writing–review and editing. HA: methodology and writing–review and editing. JS: methodology and writing–review and editing. CM: methodology and writing–review and editing. SG: writing–review and editing, investigation, and methodology. JL: writing–review and editing and supervision.
Funding
The author(s) declare that financial support was received for the research, authorship, and/or publication of this article. This work was funded by Van Mildert College and the Durham Doctorate Scholarship (MS) and the NERC-IODP (grant no. NE/L002426/1, EM).
Acknowledgments
The authors thank the International Ocean Discovery Program U.S. Implementing Organization (IODP-USIO) and the D/V Joides Resolution captain and crew. They also thank Martin West, Amanda Hayton, and Kathryn Melvin for their assistance with the GCMS analyses.
Conflict of interest
The authors declare that the research was conducted in the absence of any commercial or financial relationships that could be construed as a potential conflict of interest.
Publisher’s note
All claims expressed in this article are solely those of the authors and do not necessarily represent those of their affiliated organizations, or those of the publisher, the editors and the reviewers. Any product that may be evaluated in this article, or claim that may be made by its manufacturer, is not guaranteed or endorsed by the publisher.
Supplementary material
The Supplementary Material for this article can be found online at: https://www.frontiersin.org/articles/10.3389/feart.2024.1485521/full#supplementary-material
SUPPLEMENTARY FIGURE A1 | Glacial–interglacial cycles at Site U1417. (A) SST (UK37′) (Müller et al., 1998) (red) and SST (UK37) (Prahl et al., 1988), (°C) (grey), (B) %C37:4, (C) planktonic δ18O (‰) of N. pachyderma (sin) 150–250 µm, (D) LR04 benthic δ18O (‰) stack (Lisiecki and Raymo, 2005), and (E) shipboard sedimentation rates according to Jaeger et al. (2014) (red) and sedimentation rates based on “Match 2.3” by Lisecki and Lisecki (2002) vs. age (ka). Please note that the y axis for (C, D) has been inverted. The top triangles note the biostratigraphy ages that constrain the age model, and the colour bars at the top indicate the lithostratigraphic unit (IA: mud with ash) (see Jaeger et al., 2014). Numbers indicate the MISs identified by Lisiecki and Raymo (2005) and in U1417 records.
SUPPLEMENTARY FIGURE A2 | Surface water properties and terrigenous inputs and aquatic productivity at U1417. (A) C37:4 (%), (B) terrigenous (brown) and aquatic (turquoise) n-alkanes (left) (µg cm−2 kyr−1) and TAR (right), (C) TN (turquoise, left) and TOC (brown, right), (D) δ15N (‰; red, left) and δ13C (‰; black, right), (E) alkenones (green, left) and brassicasterol (orange, right) (µg cm−2 kyr−1), (F) K37/K38 and (G) sedimentation rates (cm kyr−1), (H) CPI U1417 and (I) shipboard sedimentation rates according to Jaeger et al. (2014) (red) and sedimentation rates based on “Match 2.3” by Lisecki and Lisecki (2002) at U1417 vs. U1417 shipboard age (ka; Jaeger et al., 2014).
References
Abe-Ouchi, A., Saito, F., Kawamura, K., Raymo, M. E., Okuno, J., Takahashi, K., et al. (2013). Insolation-driven 100,000-year glacial cycles and hysteresis of ice-sheet volume. Nature 500, 190–193. doi:10.1038/nature12374
Addison, J. A., Finney, B. P., Dean, W. E., Davies, M. H., Mix, A. C., Stoner, J. S., et al. (2012). Productivity and sedimentary d15N variability for the last 17,000 years along the northern Gulf of Alaska continental slope. Paleoceanography 27, PA 1206.
Ahn, S., Khider, D., Lisiecki, L. E., and Lawrence, C. E. (2017). A probabilistic Pliocene–Pleistocene stack of benthic δ18O using a profile hidden Markov model. Dyn. Statistics Clim. Syst. 2 (1), dzx002. doi:10.1093/climsys/dzx002
Barnola, J., Raynaud, D., Lorius, C., and Barkov, N. (2003). Historical carbon dioxide record from the vostok ice core (417,160 - 2,342 years BP). United States. doi:10.3334/CDIAC/ATG.009
Bendif, E. M., Nevado, B., Wong, E. L. Y., Hagino, K., Probert, I., Young, J. R., et al. (2019). Repeated species radiations in the recent evolution of the key marine phytoplankton lineage Gephyrocapsa. Nat. Commun. 10, 4234. doi:10.1038/s41467-019-12169-7
Bendif, E. M., Probert, I., Archontikis, O. A., Young, J. R., Beaufort, L., Rickaby, R. E., et al. (2023). Rapid diversification underlying the global dominance of a cosmopolitan phytoplankton. ISME J. 17, 630–640. doi:10.1038/s41396-023-01365-5
Bendle, J. A., Rosell-Melé, A., and Ziveri, P. (2005). Variability of unusual distributions of alkenones in the surface waters of the Nordic seas. Paleoceanography 20 (2), PA2001. doi:10.1029/2004PA001025
Bereiter, B., Eggleston, S., Schmitt, J., Nehrbass-Ahles, C., F. Stocker, T., Fischer, H., et al. (2014). Revision of the EPICA Dome C CO2 record from 800 to 600 kyr before present. Geophys. Res. Lett. 42, 542–549. doi:10.1002/2014GL061957
Berger, A., and Loutre, M.-F. (1999). Insolation values for the climate of the last 10 million of years. Quat. Sci. Rev. 10 (4), 297–317. doi:10.1016/0277-3791(91)90033-Q
Bintanja, R., and van de Wal, R. (2008). North American ice-sheet dynamics and the onset of 100,000-year glacial cycles. Nature 454, 869–872. doi:10.1038/nature07158
Blott, S. J., and Pye, K. (2012). Particle size scales and classification of sediment types based on particle size distributions: Review and recommended procedures. Sedimentology 59, 2071–2096. doi:10.1111/j.1365-3091.2012.01335.x
Boyer, T. P., Antonov, J. I., Baranova, O. K., Coleman, C., García, H. E., Grodsky, A., et al. (2013). World Ocean database. Editors S. Levitus, and A. Mishonov (Silver Spring, MD: NOAA Atlas NESDIS), 72, 209.
Chevalier, M.-L., Wang, S., Replumaz, A., and Li, H. (2022). Marine oxygen isotope stage (MIS)-6 glacial advances on the Tibetan plateau more extensive than during MIS-2 due to more abundant precipitation. Acta Geol. Sin. 96 (5), 1484–1494. doi:10.1111/1755-6724.15011
CLIMAP Project Members (1976). The surface of the Ice-Age Earth: quantitative geologic evidence is used to reconstruct boundary conditions for the climate 18,000 years ago. Earth.Sci. 191, 1131–1137. doi:10.1126/science.191.4232.1131
Conte, M. H., Thompson, A., Lesley, D., and Harris, R. P. (1998). Genetic and physiological influences on the alkenone/alkenoate versus growth temperature relationship in Emiliania huxleyi and Gephyrocapsa oceanica. Geochim. Cosmochim. Acta 62, 51–68. doi:10.1016/s0016-7037(97)00327-x
Cowan, E. A., Zellers, S. D., Müller, J., Walczak, M. H., Worthington, L. L., Caissie, B., et al. (2020). Sediment controls dynamic behavior of a Cordilleran Ice Stream at the Last Glacial Maximum. Nat. Comm. 11 (1). doi:10.1038/s41467-020-15579-0
Cranwell, P. A. (1973). Chain-length distribution of n-alkanes from lake sediments in relation to post-glacial environmental change. Freshw. Biol. 3, 259–265. doi:10.1111/j.1365-2427.1973.tb00921.x
Crusius, J., Schroth, A. W., Gassó, S., Moy, C. M., Levy, R. C., and Gatica, M. (2011). Glacial flour dust storms in the Gulf of Alaska: hydrologic and meteorological controls and their importance as a source of bioavailable iron. Geophys. Res. Lett. 38 (6), L06602. doi:10.1029/2010GL046573
Crusius, J., Schroth, A. W., Resing, J. A., Cullen, J., and Campbell, R. W. (2017). Seasonal and spatial variabilities in northern Gulf of Alaska surface water iron concentrations driven by shelf sediment resuspension, glacial meltwater, a Yakutat eddy, and dust. Glob. Biogeochem. Cycles 31 (6), 942–960. doi:10.1002/2016gb005493
de Wet, C. B., Ibarra, D. E., Belanger, B. K., and Oster, J. L. (2023). North American hydroclimate during past warms states: a proxy compilation-model comparison for the Last Interglacial and the mid-Holocene. Paleoceanogr. Paleoclimatology 38, e2022PA004528. doi:10.1029/2022PA004528
Emeis, K.-C., Doose, H., Mix, A., and Schulz-Bull, D. (1995). Alkenone sea-surface temperatures and carbon burial at Site 846 (eastern equatorial Pacific Ocean): the last 1.3 m.y. Proceedings of the Ocean Drilling Program, Scientific Results 138, 605–614. doi:10.2973/odp.proc.sr.138.131.1995
Francois, R., Altabet, M. A., Yu, E.-F., Sigman, D. M., Bacon, M., Frank, M., et al. (1997). Contribution of Southern Ocean surface- water stratification to low atmospheric CO2 concentrations during the last glacial period. Nature 389, 929–935.
Gulick, S. P. S., Jaeger, J. M., Mix, A. C., Asahi, H., Bahlburg, H., Belanger, C. L., et al. (2015). Mid-Pleistocene climate transition drives net mass loss from rapidly uplifting St. Elias Mountains, Alaska. Proc. Natl. Acad. Sci. U.S.A. 112 (49), 15042–15047. doi:10.1073/pnas.1512549112
Gulick, S. P. S., Jaeger, J. M., Mix, A. C., Asahi, H., Bahlburg, H., Belanger, C. L., et al. (1990). Determination of organic carbon and nitrogen in marine sediments using the Carlo Erba NA-1500 analyzer. Deep-Sea Res. Part I Oceanogr. Res. Pap. 37 (1), 157–165. doi:10.1016/0198-0149(90)90034-s
Haug, G. H., Ganopolski, A., Sigman, D. M., Rosell-Mele, A., Swann, G. E. A., Tiedemann, R., et al. (2005). North Pacific seasonality and the glaciation of North America 2.7 million years ago. Nature 433, 821–825. doi:10.1038/nature03332
Herbert, T. D. (2001). Age and alkenone-derived Holocene sea-surface temperature records of sediment core. PANGAEA, 167–1012B. doi:10.1594/PANGAEA.433071
Herbert, T. D., Peterson, L. C., Lawrence, K. T., and Liu, Z. (2017). Plio-Pleistocene tropical alkenone SST reconstructions for ODP Site 184-1146, [dataset]. PANGAEA. In supplement to: herbert, TD et al. (2010): tropical ocean temperatures over the past 3.5 million years. Science, 328(5985), 1530-1534. 10.1126/science.1185435. doi:10.1594/PANGAEA.874751
Herbert, T. D., Schuffert, J. D., Andreasen, D., Heusser, L., Lyle, M., Mix, A. C., et al. (2001). Collapse of the California current during glacial maxima linked to climate change on land. Science 293, 71–76. doi:10.1126/science.1059209
Imbrie, J., Boyle, E. A., Clemens, S. C., Duffy, A., Howard, W. R., Kukla, G., et al. (1992). On the structure and origin of major glaciation cycles 1. Linear responses to milankovitch forcing. Paleoceanography 7 (6), 701–738. doi:10.1029/92PA02253
Jaccard, S. L., Haug, G. H., Sigman, D. M., Pedersen, T. F., Thierstein, H. R., and Rohl, U. (2005). Glacial/interglacial changes in subarctic north pacific stratification. Science 308, 1003–1006.
Jaeger, J. M., Gulick, S. P. S., LeVay, L. J., Asahi, H., Bahlburg, H., Belanger, C. L., et al. (2014). “Site U1417,” in Proc. IODP, expedition 341 of the riserless drilling plat-form, victoria, British columbia, Canada, to valdez, Alaska, USA, sites U1417–U1421, 29 May–29 July 2013. The expedition 341 scientists. Editors J. M. Jaeger, S. P. S. Gulick, and L. J. LeVay (Integrated Ocean Drilling Program), 341. doi:10.2204/iodp.proc.341.103.2014
Kanazawa, A., Yoshioka, M., and Teshima, S. I. (1971). The occurrence of brassicasterol in the diatoms Cyclotella nana and Nitzschia Closterium. Bull. Jpn. Soc. Sci. Flsheries 37 (9), 899–903. doi:10.2331/suisan.37.899
Krissek, L. A. (1995). “Late cenozoic ice-rafting records from leg 145 sites in the North Pacific: late miocene onset, late pliocene intensification and pliocene-pleistocene events,” Proceedings of the Ocean Drilling Scientific Results. Editors D. K. Rea, L. A. Basov, D. W. Scholl, and J. F. Allan Vol. 145.
Land, N., and Wolff, E. W. (2011). Interglacial and glacial variability from the last 800 ka in marine, ice and terrestrial archives. Climate of the Past 7, 361–380. doi:10.5194/cp-7-361-2011
Lawrence, K. T., Liu, Z., and Herbert, T. D. (2006). Evolution of the eastern tropical Pacific through Plio-Pleistocene glaciation. Science 312, 79–83. doi:10.1126/science.1120395
Lisecki, L. E., and Lisecki, P. A. (2002). Application of dynamic programming to the correlation of paleoclimate records. Paleoceanography 17 (4), 1049. doi:10.1029/2001PA000733
Lisiecki, L. E., and Raymo, M. E. (2005). Pliocene-Pleistocene stack of globally distributed benthic stable oxygen isotope records. PANGAEA. doi:10.1594/PANGAEA.704257
Liu, Z., Cleaveland, L. C., and Herbert, T. D. (2008). Early onset and origin of 100-kyr cycles in Pleistocene tropical SST records. Earth Planet. Sci. Lett. 265 (3–4), 703–715. doi:10.1016/j.epsl.2007.11.016
Liu, Z., and Herbert, T. D. (2004). High-latitude influence on the eastern equatorial Pacific climate in the early Pleistocene epoch. Nature 427 (6976), 720–723. doi:10.1038/nature02338
Liu, Z. H., Altabet, M. A., and Herbert, T. D. (2005). Glacial-interglacial modulation of eastern tropical North Pacific denitrification over the last 1.8-Myr. Geophys. Res. Lett. 32, L23607. doi:10.1029/2005GL024439
Locarnini, R. A., Mishonov, A. V., Antonov, J. I., Boyer, T. P., Garcia, H. E., Baranova, O. K., et al. (2013). NOAA atlas. NESDIS 73. doi:10.7289/V55X26VD
Martínez-Garcia, A., Rosell-Melé, A., Geibert, W., Gersonde, R., Masqué, P., Gaspari, V., et al. (2009). Links between iron supply, marine productivity, sea surface temperature, and CO2 over the last 1.1 Ma. Paleoceanography 24, PA1207. doi:10.1029/2008PA001657
Martínez-García, A., Rosell-Mele, A., McClymont, E. L., Ger- sonde, R., and Haug, G. (2010a). Subpolar link to the emergence of the modern equatorial pacific cold tongue. Science 328 (5985), 1550–1553. doi:10.1126/Science.1184480
Martínez-García, A., Rosell-Melé, A., McClymont, E. L., Gersonde, R., and Haug, G. H. (2010b). Sea surface temperature estimates and alkenone C37:4 abundances in ODP Site 145-882 and. PANGAEA, 177–1090. doi:10.1594/PANGAEA.771708
Martínez-García, A., Rosell-Melé, A., Jaccard, S. L., Geibert, W., Sigman, D. M., and Haug, G. H. (2011). Southern Ocean dust–climate coupling over the past four million years. Nature 476 (7360), 312–316. doi:10.1038/nature10310
McClymont, E. L., Rosell-Melé, A., Giraudeau, J., Pierre, C., and Lloyd, J. M. (2005). Alkenone and coccolith records of the mid-Pleistocene in the south-east Atlantic: implications for the U37K′ index and South African climate. Quat. Sci. Rev. 24 (14–15), 1559–1572. doi:10.1016/j.quascirev.2004.06.024
Meheust, M., Stein, R., Fahl, K., and Gersonde, R. (2018). Sea-ice variability in the subarctic North Pacific and adjacent Bering Sea during the past 25 ka: new insights from IP25 and UK′37 proxy records. Arktos 4 (8), 1–19. doi:10.1007/s41063-018-0043-1
Müller, P. J., Čepek, M., Ruhland, G., and Schneider, R. R. (1997). Alkenone and coccolithophorid species changes in late Quaternary sediments from the Walvis Ridge: implications for the alkenone paleotemperature method. Palaeogeogr. Palaeoclimatol. Palaeoecol. 135 (1–4), 71–96. doi:10.1016/S0031-0182(97)00018-7
Müller, J., Romero, O., Cowan, E. A., McClymont, E. L., Forwick, M., Asahi, H., et al. (2018). Cordilleran ice-sheet growth fueled primary productivity in the Gulf of Alaska, northeast Pacific Ocean. Geology 46 (4), 307–310. doi:10.1130/g39904.1
Müller, P. J., Kirst, G., Ruhland, G., von Storch, I., and Rosell-Melé, A. (1998). Calibration of the alkenone paleotemperature index UK37’ based on core-tops from the eastern South Atlantic and the global ocean (60 N–60 S). Geochim. Cosmochim. Ac. 62, 1757–1772. doi:10.1016/S0016-7037(98)00097-0
Otto-Bliesner, B., Brandy, E. C., Clauzet, G., Tomas, R., Levis, S., and Kothavala, Z. (2006). Last glacial maximum and Holocene climate in CCSM3. J. Clim. 19, 2526–2544. doi:10.1175/jcli3748.1
Petit, J., Jouzel, J., Raynaud, D., Barkov, N. I., Barnola, J.-M., Basile, I., et al. (1999). Climate and atmospheric history of the past 420,000 years from the Vostok ice core, Antarctica. Nature 399, 429–436. doi:10.1038/20859
Praetorius, S. K., Condron, A., Mix, A. C., Walczak, M. H., Mckay, J. L., and Du, J. H. (2020). The role of Northeast Pacific meltwater events in deglacial climate change. Sci. Adv. 6 (9), eaay2915. doi:10.1126/sciadv.aay2915
Prahl, F. G., Muehlhausen, L. A., and Zahnle, D. L. (1998). Further evaluation of long-chain alkenones as indicators of paleoceanographic conditions. Geochim. Cosmochim. Ac. 52, 2303–2310. doi:10.1016/0016-7037(88)90132-9
Rae, J. W. B., Zhang, Y. G., Liu, X., Foster, G. L., Stoll, H. M., and Whiteford, R. D. M. (2021). Atmospheric CO2 over the past 66 million years from marine archives. Annu. Rev. Earth Planet. Sci. 49, 609–641. doi:10.1146/annurev-earth-082420-063026
Sánchez-Montes, M. L., McClymont, E. L., Lloyd, J. M., Müller, J., Cowan, E. A., and Zorzi, C. (2020). Late Pliocene Cordilleran Ice Sheet devel-opment with warm northeast Pacific sea surface temperatures. Clim. Past 16 (1), 299–313. doi:10.5194/cp-16-299-2020
Sánchez Montes, M. L., Romero, O. E., Cowan, E. A., Müller, J., Moy, C. M., Lloyd, J. M., et al. (2022). Plio-pleistocene ocean circulation changes in the Gulf of Alaska and its impacts on the carbon and nitrogen cycles and the Cordilleran Ice Sheet development. Paleoceanogr. Paleoclimatology 37, e2021PA004341. doi:10.1029/2021PA004341
Sarmiento, J., and Toggweiler, J. (1984). A new model for the role of the oceans in determining atmospheric P CO2. Nature 308, 621–624. doi:10.1038/308621a0
Schlitzer, R. (2016). Ocean data view. Available at: http://odv.awi.de.
Shin, J., Nehrbass-Ahles, C., Grilli, R., Chowdhry Beeman, J., Parrenin, F., Teste, G., et al. (2020). Millennial-scale atmospheric CO2 variations during the Marine Isotope Stage 6 period (190–135 ka). Clim. Past. 16, 2203–2219. doi:10.5194/cp-16-2203-2020
Siegenthaler, U., Stocker, T. F., Monnin, E., Lüthi, D., Schwander, J., Stauffer, B., et al. (2005). Supporting evidence from the EPICA Dronning Maud Land ice core for atmospheric CO2 changes during the past millennium. Tellus Ser. B-Chemical Phys. Meteorology 57 (1), 51–57. doi:10.1111/j.1600-0889.2005.00131.x
Siegenthaler, U., and Wenk, T. (1984). Rapid atmospheric CO2 variations and ocean circulation. Nature 308, 624–626. doi:10.1038/308624a0
St. John, K. E. K., and Krissek, L. A. (1999). Regional patterns of pleistocene ice-rafted debris flux in the north pacific. Paleoceanography 14 (5), 653–662. doi:10.1029/1999PA900030
Suh, Y. J., Diefendorf, A. F., Freimuth, E. J., and Hyun, S. (2020). Last interglacial (MIS 5e) and Holocene paleohydrology and paleovegetation of midcontinental North America from Gulf of Mexico sediments. Quat. Sci. Rev. 227, 106066. 0277-3791. doi:10.1016/j.quascirev.2019.106066
Sun, Y., Xiao, W., Wang, R., Wu, L., and Wu, Y. (2021). Changes in sediment provenance and ocean circulation on the northern slope of the Bering Sea since the last deglaciation. Mar. Geol. 436 (2021), 106492. 0025-3227. doi:10.1016/j.margeo.2021.106492
Van Nieuwenhove, N., and Bauch, H. A. (2008). Last interglacial (MIS 5e) surface water conditions at the Vøring Plateau (Norwegian Sea), based on dinoflagellate cysts. Polar Res. 27, 175–186. doi:10.3402/polar.v27i2.6175
Volkman, J. K. (1986). A review of sterol markers for marine and terrigenous organic matter. Org. Geochem. 9 (2), 83–99. doi:10.1016/0146-6380(86)90089-6
Volkman, J. K., Barrett, S. M., Blackburn, S. I., and Sikes, E. L. (1995). Alkenones, in Gephyrocapsa oceanica: Implications for studies of paleoclimate. Geochim. Cosmochim. Acta 59, 513–520. doi:10.1016/0016-7037(95)00325-t
Walczak, M. H., Mix, A. C., Fallon, S., Fifield, L. K., Alder, J. R., Du, J., et al. (2020). Phasing of millennial-scale climate variability in the pacific and atlantic oceans. Science 370, 716–720. doi:10.1126/science.aba7096
Wang, K. J., Huang, Y., Majaneva, M., Belt, S. T., Liao, S., Novak, J., et al. (2021). Group 2i Isochrysidales produce characteristic alkenones reflecting sea ice distribution. Nat. Commun. 12 (1), 15. doi:10.1038/s41467-020-20187-z
Yao, Z., Shi, X., Yin, Q., Jaccard, S., Liu, Y., Guo, Z., et al. (2024). Ice sheet and precession controlled subarctic Pacific productivity and upwelling over the last 550,000 years. Nat. Commun. 15, 3489. doi:10.1038/s41467-024-47871-8
Yao, Z. Q., Liu, Y. G., Shi, X. F., Gong, X., Gorbarenko, S. A., Bosin, A. A., et al. (2022). Paleoproductivity variations and implications in the subarctic northwestern Pacific since MIS 7: geochemical evidence. Glob. Planet. Change 209, 103730. doi:10.1016/j.gloplacha.2021.103730
Zhong, Y., Liu, Y., Yang, H., Yin, Q., Wilson, D. J., Lu, Z., et al. (2024). Orbital controls on North Pacific dust flux during the late quaternary. Geophys. Res. Lett. 51, e2023GL106631. doi:10.1029/2023GL106631
Keywords: glacial, interglacial, alkenones, temperatures, productivity
Citation: Sánchez Montes ML, McClymont EL, Asahi H, Stoner J, Moy CM, Gleghorn S and Lloyd JM (2025) Ocean warming, icebergs, and productivity in the Gulf of Alaska during the Last Interglacial. Front. Earth Sci. 12:1485521. doi: 10.3389/feart.2024.1485521
Received: 23 August 2024; Accepted: 17 December 2024;
Published: 07 February 2025.
Edited by:
Marta Rodrigo-Gámiz, University of Granada, SpainReviewed by:
Dongling Li, Ningbo University, ChinaIván Hernández-Almeida, University of Bern, Switzerland
Copyright © 2025 Sánchez Montes, McClymont, Asahi, Stoner, Moy, Gleghorn and Lloyd. This is an open-access article distributed under the terms of the Creative Commons Attribution License (CC BY). The use, distribution or reproduction in other forums is permitted, provided the original author(s) and the copyright owner(s) are credited and that the original publication in this journal is cited, in accordance with accepted academic practice. No use, distribution or reproduction is permitted which does not comply with these terms.
*Correspondence: Maria Luisa Sánchez Montes, marialuisa.sanchezmontes@colorado.edu