- 1Research Institute of Petroleum Exploration and Development, Xinjiang Oilfield Company of Petro China, Karamay, China
- 2School of Geosciences, China University of petroleum (East China), Qingdao, China
- 3College of Petroleum Engineering, China University of Petroleum, Beijing, China
Post-drilling wireline acoustic single-well imaging technology can now detect geological structures tens of meters away from boreholes. Further development of this single-well imaging technology in the logging-while-drilling (LWD) environment will have significant values in real-time applications such as geosteering and reservoir navigation. Based on the wireline imaging application, we propose a new method for the LWD application. In wireline imaging, the four-component (4C) dipole acoustic data are azimuthally rotated to scan the reflectors around the borehole. In LWD, azimuthal scanning is achieved by drilling rotation such that the 4C dipole system in the wireline is replaced by a one-dipole-source and two-receiver LWD system, where the two receivers are mounted on opposite sides of the drill collar. For the LWD application, we first developed the theory for LWD dipole shear-wave reflection imaging and validated the theory using 3D finite-difference waveform modeling. Using the analytical solution, we analyzed the far-field radiation directivity of an acoustic LWD dipole source and the effect of drilling rotation on the shear-wave reflection imaging using the LWD acoustic system. The LWD analysis results show that, for fast formations, the SH-wave is the dominant component for imaging, whereas for slow formations, the P-wave becomes important and can be used for imaging. Our results also indicate that the reflection data acquired by the system are affected by the speed of drilling rotation. The take-off azimuth at the wave radiation may be different from the incident azimuth at the wave reception. Knowing the rotation speed, this azimuth difference can be corrected. A further advantage of using the oppositely mounted receivers is that the reflected wave arrives earlier (later) at the front (back)-side receiver; thus, the arrival time difference between the receivers can be used to eliminate the 180°-azimuth ambiguity of dipole acoustic imaging. For reflection imaging, using the proposed LWD system configuration, we tested its azimuth sensitivity and validated its 180°-ambiguity solution using synthetic LWD and field wireline dipole data. The results of this work, therefore, provide a theoretical foundation for the development of the LWD acoustic reflection imaging system.
Introduction
For oil and gas exploration and development in high-angle wells, it is necessary to develop the drilling and logging technology for the complex wells, especially in unconventional oil and gas exploration. The successful development of these complex wells relies on accurate geosteering technology to effectively track reservoir boundaries in real time. In this regard, borehole acoustic reflection imaging offers a promising tool for the geosteering application. In recent years, extensive research on borehole acoustic remote sensing technology has been carried out. Researchers have made significant progress in theoretical modeling, experimental validation, tool development, and field data analyses (e.g., Hornby, 1989; Tang, 2004; Tang and Patterson, 2009; Wei and Tang, 2012; Tang et al., 2014; Gong et al., 2015; Gong et al., 2018; Hirabayashi et al., 2017; Li and Yue, 2017; Bennett, 2019; Xu et al., 2019; Ben et al., 2020; Li et al., 2021a; Li et al., 2021b; Li et al., 2021c; Li et al., 2022a; Kong et al., 2023a; Kong et al., 2023b). The technology has been widely applied in wireline logging to delineate near-borehole geological structures such as formation interfaces, fractures, dissolution cavities, and faults (Bradley et al., 2011; Tang et al., 2016; Lee et al., 2019; Gu et al., 2021).
The wireline acoustic single-well imaging technology can now detect geological structures several tens of meters away from boreholes into the formation. This detection range is what is needed for the logging-while-drilling (LWD) geosteering application. For this reason, numerous researchers have carried out studies on the LWD acoustic reflection imaging technology (Nakken et al., 1996; Tang et al., 2007; Cao et al., 2016; Tan et al., 2016). The latest works (Li et al., 2022b; Tan et al., 2022; Rao et al., 2023) analyzed the radiation, scattering, and reception responses of an acoustic LWD dipole source. These studies, however, did not include the effect of drill collar rotation in the LWD environment. For the distance considered in the acoustic reflection imaging, the wave travel time in the formation usually takes several to tens of milliseconds. The wireline tool takes at least a few seconds to make one revolution such that the azimuth change during wave propagation in formation is negligible. In contrast, the LWD tool rotates with the drill bit, and the rotation speed can reach tens or even hundreds of revolutions per minute. In the case of high-speed rotation, one must analyze the effect on the received wavefield.
In the following sections, we first derive the far-field asymptotic solution for the wavefield of a LWD acoustic dipole source and study its radiation characteristics. Using the virtual source analogy, we further analyze the received wavefield for an acoustic reflection model containing a rotating LWD tool in the fluid-filled borehole. By using the cylindrical-wave expansion and the steepest–descent methods, we obtain the asymptotic solution for the LWD problem and validate the solution result using 3D finite-difference waveform modeling. Based on the solution result, we propose a one-dipole-source and two-receiver LWD acoustic reflection imaging system. We validate the feasibility of the system for geosteering applications using synthetic LWD and field wireline acoustic data examples.
Theoretical analysis
Radiation from a LWD dipole source inside the borehole
Figure 1 shows single-well reflection imaging using a LWD dipole tool. Compared with the wireline logging scenario, the drill collar occupies a large portion of the borehole and has substantial influence on the wavefield characteristics. The LWD borehole model consists of the fluid inside the drill collar, the drill collar, the fluid ring between the drill collar and the formation, and the formation, whose outer radii are r1, r2, r3, and infinity, respectively. Assuming that the drill collar is in the center of the borehole, an annular dipole source is placed on the rim of the drill collar and pointed in the direction of the x-axis, with the radius of the source (modeled as a fluid ring) being the outer radius of the drill collar (i.e., r0 = r2), as shown in Figure 1B. The model shown in Figure 1 contains three fluid–solid boundaries at the inner and outer collar and the borehole–formation interfaces. The fluid–solid boundary condition requires the continuity of radial displacement and stress and vanishing of the azimuthal and axial shear stresses. The wave is actuated by assigning the radial displacement generated by the source to the drill collar at the source location. Combining the boundary conditions at the abovementioned interfaces yields a matrix equation with 12 unknown coefficients (Tang and Cheng, 2004):
where H is a 12 × 12 matrix and e is a 12 × 1 vector, the latter resulting from the direct contribution of the dipole source (the detailed expressions of matrix H and vector e are given in Supplementary Appendix A1). The superscripts fin, dc, and fout correspond to the fluid inside the drill collar, the drill collar, and the fluid ring, respectively, and the respective coefficients govern the strength of the guided waves inside the borehole. The amplitude coefficients with superscript fm are related to the radiated waves for imaging geological structures in the formation. For far-field radiation, the asymptotic solutions of the displacement potential function of the radiated P-, SH-, and SV-waves from the LWD dipole source are (Tang and Wei, 2012).
where
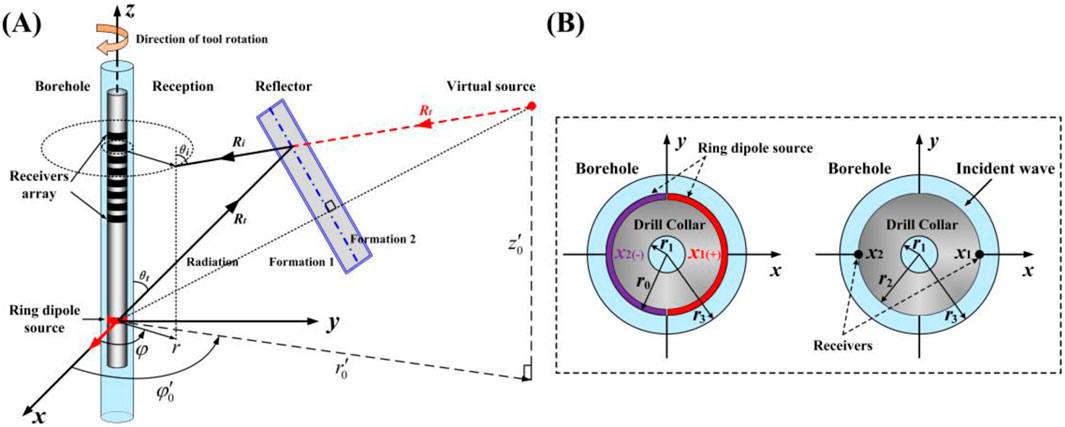
Figure 1. Configuration of LWD acoustic single-well reflection imaging (A) where the dipole source is oriented in the tool x-axis direction and (B) receivers are mounted at the opposite sides of the tool along the source orientation. The virtual source analogy is used to model the wave incidence to the borehole.
Equation 2 shows that the radiated far-field wave is the product of two terms, one of which controls the spatial distribution of the wavefield and is called the radiation function of the borehole source:
The common factor
Another term of the radiated wavefield is the typical spherical wave propagation factor
where
Reception response of a LWD tool inside the borehole
When the radiated waves represented by Equation 4 encounter a reflector in formation (assume that the reflector size is large compared to wavelength), they are reflected back and recorded by the receiver on the LWD tool (see Figure 1B). The received wave can generally be written as (Tang and Wei, 2012).
where Q is the quality factor of the formation for the S- or P-waves; S is the source function; RD is the far-field radiation function given by Equation 3; RF denotes the reflection coefficient of the wave at the reflector, which can be calculated using the Zoeppritz equation (Aki and Richards, 1980). The form of RD and RF depends on the type of the incident wave considered (i.e., P-, SH-, or SV-waves); and
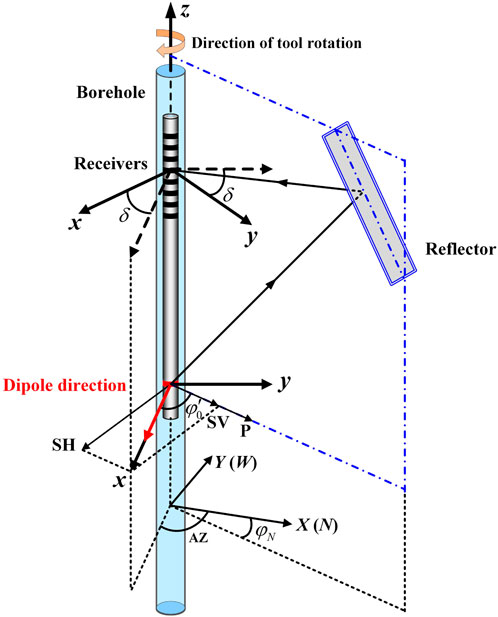
In the LWD measurement, however, it is important to note that the take-off azimuth at the wave radiation may be significantly different from the incident azimuth at the wave reception. For the model shown in Figure 1A, the azimuth of the reflector relative to the tool x-axis is
As a result, we can express the spherical wave propagation factor in Equation 6 as the summation of multipole cylindrical waves:
where
where the superscript i denotes the incident wave from the virtual source; the subscripts P, SH, and SV mean that the radiation function RD and reflection coefficient RF should correspond to the P-, SH-, and SV-waves, respectively. The common factor
The incident waves, in turn, will induce wave motions in and outside the borehole, and the induced wave displacement potential function of the P- and S-waves in the frequency–wavenumber domain has the same form as in Equation 8:
where
Combining Equations 9, 10 in conjunction with the boundary conditions for the three interfaces of the LWD model (see Figure 1), we obtain two matrix equations for the amplitude coefficients in the abovementioned equations
where the superscripts of the coefficient vectors have the same meaning as in Equation 1 and the matrix H is the same as in Equation 1. The vectors
The radial distance
For the reflected wave reception in LWD, the receivers are located on the rim of the drill collar, having the same radius
For fluid pressure (
For radial fluid displacement (
where
Result verification
To validate the result from the abovementioned analytical solution, we carried out 3D finite-difference modeling (Wei and Tang, 2012) for the model given in Figure 1 (see model parameters in Table 1). The reflector is an interface between formations 1 and 2. The reflector has an azimuth angle of 0° and an inclination angle of 45°. The borehole is surrounded by a fast formation (see Table 1), and the borehole-to-virtual source distance is 10 m. Inside the borehole, the receivers are at a 1-m distance above the source and azimuthally spaced at 45°, as shown in Figure 2A. Tan et al. (2016) indicated that the dominant frequency band of LWD dipole shear-wave remote detection is 1,800 Hz–2,500 Hz. Therefore, a 2,500-Hz Ricker wavelet is used for the source excitation here. For this numerical validation modeling, the tool is stationary, i.e., the
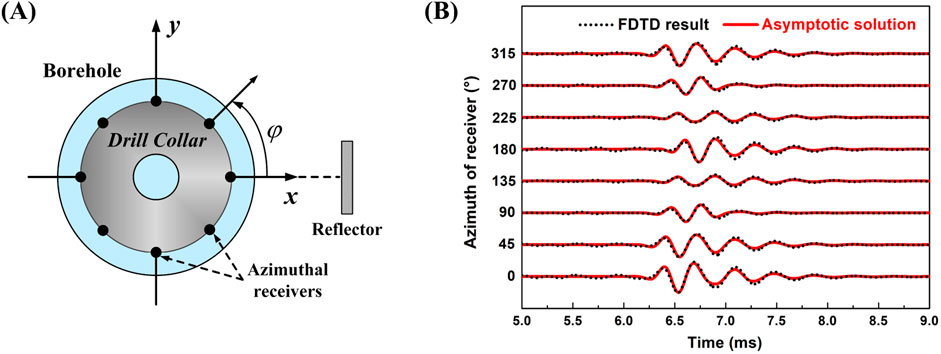
Figure 2. (A) Cross-section of LWD receiving configuration using azimuthally spaced receivers on the collar rim. (B) Comparison of the SV-wave reflection waves from the 3D finite-difference (dots) and the analytical solution (solid curves) calculations.
Figure 2B compares the numerical (dots) and analytical (curve) waveforms at the azimuthally distributed receivers for the dipole source pointing to the x-axis direction. The comparison is in the time range from 5 ms to 9 ms, so that the waves traveling along the borehole, as shown in finite-difference modeling, are skipped, and only the reflected waves from the surrounding formation are compared. For validation purposes, Figure 2B shows only the comparison for the SV-waves for the inclined reflector model. The numerical and analytical waves agree very well, validating our asymptotic solution result.
Far-field radiation directivity of a LWD dipole source
Equation 5 allows us to investigate the radiation characteristics of a LWD dipole source inside the borehole. For the dipole source pointing to the x-axis (see Figure 1A), Figure 3 shows the far-field radiation patterns of the formation SH-, SV-, and P-waves for the 2,500-Hz source frequency. The radial scales mark the relative amplitude of the radiated waves for a source of unit intensity for the radiation angle in the
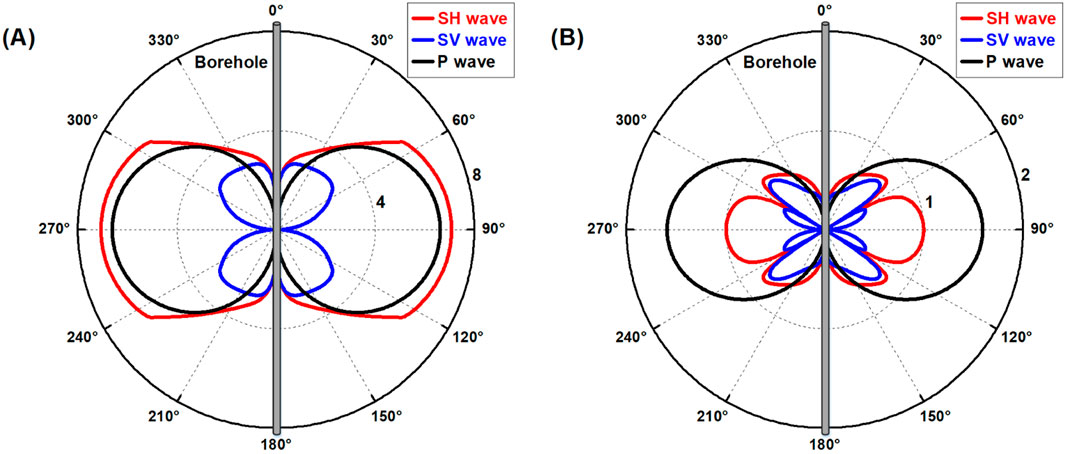
Figure 3. SH-, SV-, and P-wave radiation patterns of a 2,500-Hz LWD dipole source in (A) fast and (B) slow formations.
Figure 3 shows radiation patterns for both fast and slow formations (see Table 1). In the fast-formation case (Figure 3A), the P- and SH-wave patterns show the maximum strength in the horizontal direction, whereas the SV-wave pattern is null in this direction. This means that the P- and SH-waves, instead of the SV-wave, should be used to image reflectors that are inclined or parallel with the borehole. In the slow-formation case, the SH- and SV-wave patterns (Figure 3B) are more complex, and their radiation coverages decrease. In comparison, the P-wave radiation has the highest strength and coverage, meaning that the LWD dipole P-wave can be used for reflection imaging in slow formations.
The one-dipole-source and two-receiver LWD measurement system
The wireline dipole acoustic reflection measurement acquires a four-component (4C) dataset (xx, xy, yx, and yy). The 4C data are mathematically rotated to scan a formation reflector in 360°. In the LWD case, azimuthal scanning is achieved by the drilling rotation, which allows us to use a one-dipole-source and two-receiver LWD system for the reflection measurement.
The principle of rotation imaging
The source–receiver configuration for the LWD measurement system is shown in Figure 1B, where the wave signals radiated from the dipole source are recorded by two receivers that are oppositely mounted on the collar rim along the dipole source direction. These two receivers form a receiving station, and the tool consists of eight or more such receiving stations. The receivers record two signals
For a centered tool in the borehole, Equation 14 produces a dipole signal as the n = 1 term is dominant the sum of the series of Equations 12, 13. The far-field wavefield of the centered annular dipole source is equivalent to that generated by a single force source on the well axis, and this simplified view is shown in Figure 4.
Relative to the reflection azimuth, the dipole source vector can be projected onto two orthogonal directions perpendicular and parallel to the reflector, giving rise to the SV (and P) and SH components in the reflection data. We now record the data using the x-oriented receivers of the measurement system. Considering the tool rotation, the recorded data are as follows:
where
where
Equation 17 indicates that relative to the case of no tool rotation (i.e.,
Using the analytical solution of Equation 12, the operation of the proposed one-dipole-source and two-receiver LWD measurement system can be accurately modeled and analyzed. In this modeling, we assume a 60°-dip reflector facing the north direction (i.e.,

Figure 5. Azimuthal variation in the S-wave data from the LWD system. (A) Waveform versus azimuth for δ = 0°. (B) Waveform versus azimuth for δ = 20°. (C) Amplitude variation patterns of (A) and (B); note that the pattern of (B) is rotated δ/2 relative to that of (A).

Figure 6. Azimuthal variation in the P-wave data from the LWD system. (A) Waveform versus azimuth for δ = 0°. (B) Waveform versus azimuth for δ = 20°. (C) Amplitude variation patterns of (A) and (B); note that the pattern of (B) is rotated δ/2 relative to that of (A).
The results show the maximum of
For S-wave,
For P-wave,
where the symbol max denotes seeking the value of AZ to maximize the function
Elimination of azimuth ambiguity for the LWD system
The above mentioned analysis results also exhibit an inherent 180°-azimuth ambiguity of the dipole system, as apparent from Equations 16, 17 (and from Figures 5C, 6C). This ambiguity can be eliminated using the arrival time difference between the xx1 and xx2 data of the oppositely mounted receivers of the LWD system, as shown below.
For the case of
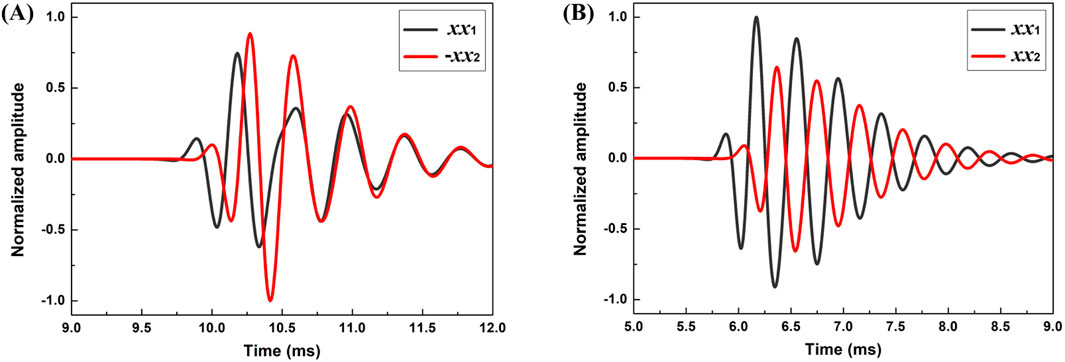
Figure 7. Comparison of xx1 and xx2 signals received at the opposite side of the tool (tool azimuth is 30° and δ = 0). (A) and (B) are for S- and P-waves, respectively.
Analysis of examples
Analysis of a synthetic LWD example
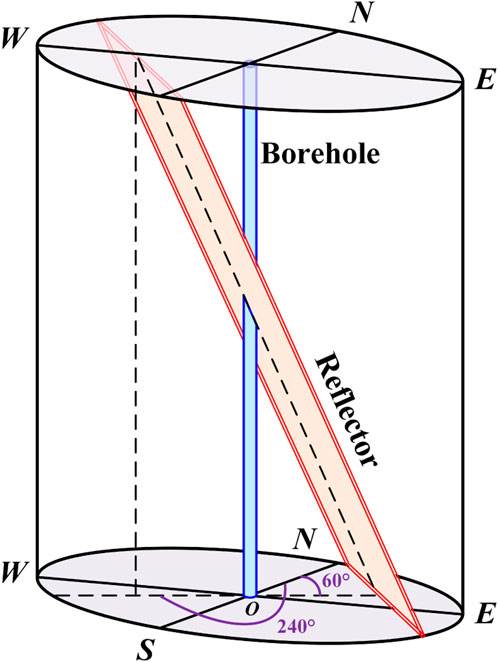
We now use the synthetic LWD dipole acoustic reflection data to test the applicability of the proposed LWD system and method for the drilling rotation condition. For the model shown in Figure 8, the reflector intersects the borehole with an angle of 30° in the middle of the 140-m-depth section, with the azimuth angles of the reflector in the lower and upper part of the intersection being 60° and 240°, respectively. The dipole S-wave detection method is used for data acquisition and processing, the results of which are given in Figure 9. It is assumed that the drilling has an RPM of 100 and an ROP of 10 m per hour. The time interval of the source excitation is 5 s. The time sampling interval and sampling points of the wavefield are 36 μs and 1,024, respectively. The dipole source is located 3 m below the receivers, and the source frequency is 2,500 Hz. The parameters of the borehole and formation and reflector are shown in Table 1, where fast formation 1 is used for the simulation.
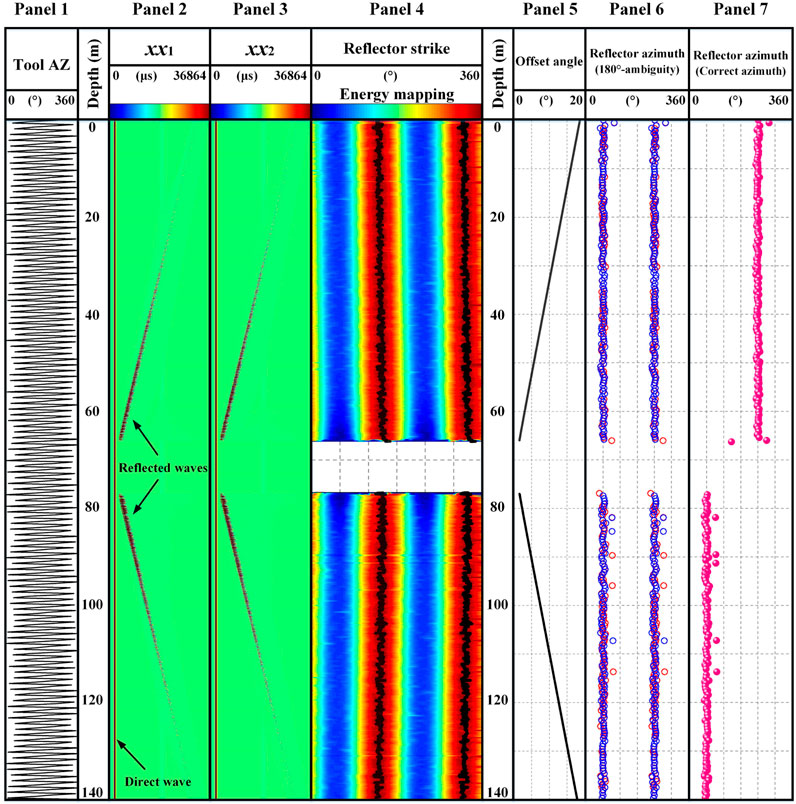
Figure 9. Synthetic data analysis example for delineating a formation reflector, simulating the drilling rotation of the LWD dipole system.
Panel 1 of Figure 9 shows the azimuthal curve of the tool relative to north, indicating that the tool rotates rapidly for this while drilling simulation. Note that for a clearer view, the results of panels 1, 6, and 7 are displayed at intervals of 20 depth points. The computed xx1 and xx2 waveform data are displayed as variable density images in panels 2 and 3, respectively. For comparison, we also computed the borehole flexural waves traveling directly along the borehole, as indicated in the panels. For the data analysis, we first separate the xx1 and xx2 waves from the direct waves in the data and then compute the dipole data xx using Equation 14. Next, taking a moving depth window (about 41 adjacent depths, enough to cover several rotation cycles), the energy (squared amplitude) of the xx data versus the azimuth was computed for each depth within the window. Moving the window along the entire depth zone yields an energy image map versus tool azimuth in panel 4. The trend of the maximum energy delineates the reflector azimuth, as shown by the black line in panel 4, which shows that the reflector strike is approximately 140° ∼ 150° or 320° ∼ 330°. Therefore, the reflector azimuth is approximately 50° ∼ 60° or 230° ∼ 240°. Note that the delineated azimuth trend shows a drift from the borehole–reflector intersection toward the top or bottom of the well. This drift is the result of the tool azimuth offset between wave radiation and reception, as discussed before. From the wave travel time and RMP of the simulation, the offset angle
To substantiate the abovementioned modeling and analysis results, we analyze the data at depths of 55.8464 m and 139.6063 m, which correspond to the up- and down-dip parts of the reflector, respectively. For the depth of 55.8464 m, 20 measurement points are selected above and below the depth, and the (normalized) amplitude of the wave
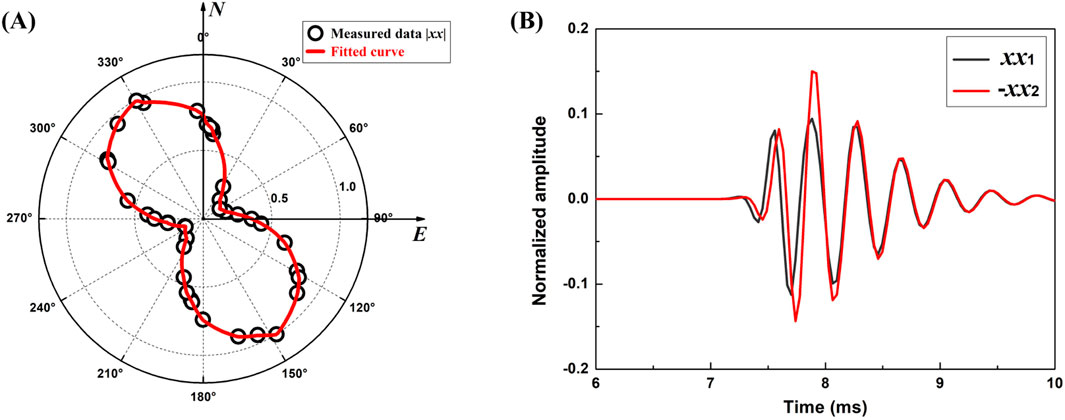
Figure 10. Reflector azimuth determination for the depth of 55.8464 m. (A) Data amplitude versus azimuth shows the 180° ambiguity. (B) Comparing the time difference of the opposite receivers resolves the ambiguity.
For the down-dip depth of 139.6063 m, Figure 11A shows that the amplitude data peak at approximately 140° or 320° and the reflector azimuth is approximately 50° or 230°. As shown in panel 5 of Figure 9, at this depth point, the tool rotation offset angle is 17.6°; after the rotation correction, the reflector azimuth is approximately 58.8° or 238.8°. The tool azimuth for this depth point is 173°. According to the rotation angle of the tool, the true tool azimuth at the data recording should be 190.6°. The waveforms measured at this depth show that xx2 is ahead of xx1 (Figure 11B), indicating that receiver x2 (x1) is at the same (opposite) side of the reflector. The true azimuth of the reflector is approximately 58.8°. We notice that the azimuth result at 55.8464 m is obtained without the tool rotation correction. This is because the reflector is close to the borehole at this depth, and the angle-offset value due to the rotation is small and can thus be ignored. This synthetic modeling example validates the concept of the LWD system and the analysis results.
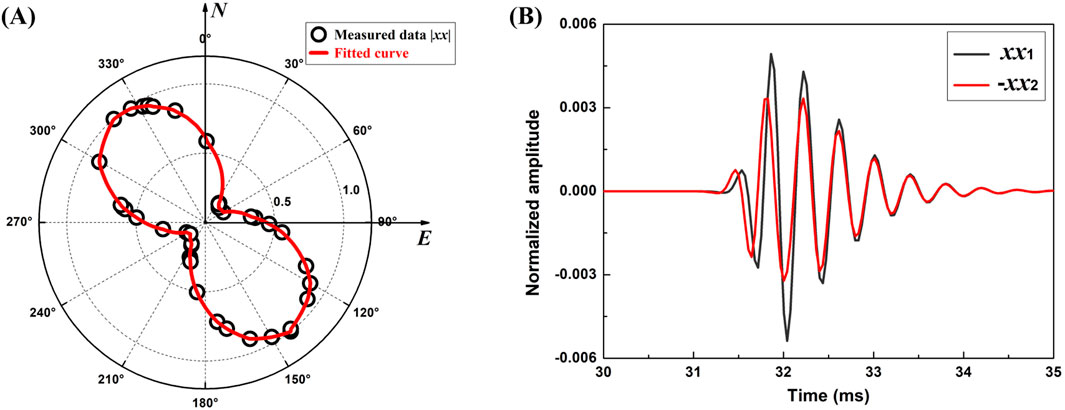
Figure 11. Reflector azimuth determination for the depth of 139.6063 m. (A) Data amplitude versus azimuth shows the 180° ambiguity. (B) Comparing the time difference of the opposite receivers resolves the ambiguity.
Analysis of a field wireline example
Encouraged by the success of the synthetic LWD datatest and results, we use a dipole dataset from wireline logging for a further test. Figure 12 shows the azimuthal imaging results of dipole shear-wave measurement data within a 20-m interval of a well. The azimuth curve in panel 1 shows that the tool rotates continuously in this well section. First, the acquired four-component dipole data (xx, xy, yx, and yy) are processed through filtering, wavefield separation, and migration imaging, which yields the reflection signal from the reflector outside the borehole. In addition, the four-component reflection data are rotated to obtain the imaging of the well section in the 0°–150° azimuth (relative to the North Pole), as shown in panels 2–7. It can be seen that there is a high inclination angle reflector approximately 15 m away from the well, and the reflector is most clearly imaged in the 60° azimuth, whereas it is not imaged in the 150° azimuth, which indicates that the reflector strike is approximately 60° north by east (or 60° south by west).
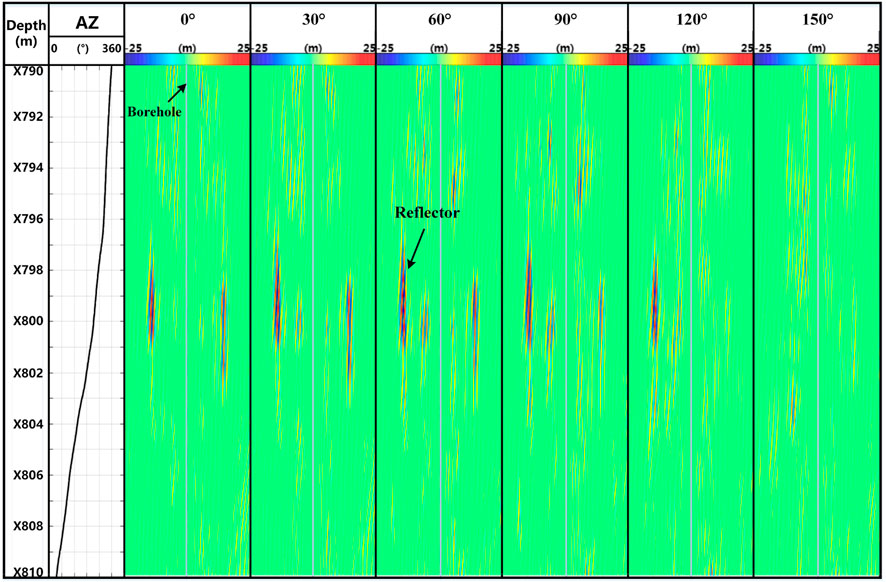
Figure 12. Azimuthal imaging result of wireline dipole shear-wave reflection data measured in an actual well.
Furthermore, only the xx component is used for azimuth recognition. For the depth of 799 m, 15 measurements are selected above and below the depth point, respectively. Figures 13A, B show the normalized azimuth amplitude results in the form of polar and Cartesian coordinate systems, respectively. The results show that at the depth range corresponding to these 31 measurement points, the tool rotated continuously by approximately 70°, and the signal amplitude reaches its maximum near 240°. Combined with the theoretical results shown in Figure 5, it is observed that the reflector strike is approximately 240° (i.e., 60° south by west), which is consistent with the orientation identification results obtained using the four-component rotation shown in Figure 12. The field example preliminarily confirms the practicability of the method proposed in this paper.
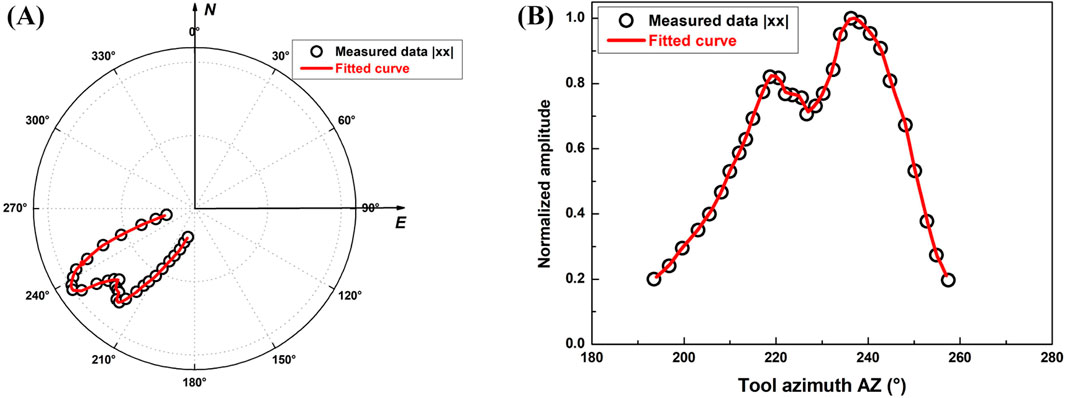
Figure 13. Azimuthal comparison result of wireline dipole shear-wave xx-component reflection data in the (A) polar and (B) Cartesian coordinate systems.
Discussion
The central result of this work is the analytical solutions of Equations 12, 13 for modeling the LWD tool reception responses in the borehole acoustic dipole reflection survey. The analytical solutions strictly consider the off-axis data acquisition configuration and the rotation effect of the drill collar, which has not been taken into account simultaneously in current studies. For example, Tan et al. (2016) and Tan et al. 2022 assumed an ideal on-axis data acquisition configuration and simulated the reception response for LWD dipole shear-wave reflection imaging using the elastic reciprocity theorem, while existing analyses (Tan et al., 2016; 2022; Li et al., 2022b; Rao et al., 2023) assumed that the drill collar is stationary, which is inconsistent with the actual situations. On this basis, a method for identifying the reflector azimuth using the LWD one-dipole-source and two-receiver measurement mode is proposed. Compared with the traditional wireline acoustic dipole remote sensing, the basic principles of the rotational imaging are the same. That is, the orientation of the maximum amplitude of the dipole S (P-)-waves recorded by the receivers located in different directions corresponds to the strike (azimuth) of the reflector, as shown by the blue curve with δ=0 in Figure 5C (Figure 6C). The difference is that the high-speed rotation of the drill collar will cause the above patterns to change, as shown by the red curves with δ=20° in Figures 5C, 6C. Therefore, the rotation effect of the tool should be considered when using LWD acoustic data for remote detection. In addition, in actual drilling, the drill collar often deviates from the well axis due to the weight and complex movement of the drill collar. The influence of drill collar eccentricity on the measurement mode proposed in this paper needs further study.
Conclusions
This paper developed a theoretical analysis to study the problem of borehole acoustic reflection imaging in the LWD environment. Particularly, we focused on determining the reflector azimuth in the presence of rapid drilling rotation. The drilling rotation has both benefits and a drawback in LWD reflector imaging. The major benefit is that the drilling rotation allows for using a one-dipole-source and two-receiver LWD dipole system to perform the azimuthal scanning of a formation reflector, whereas in wireline logging, four-component dipole data are required for the scanning. A further advantage is that, by mounting the two receivers on the opposite sides of the LWD tool, the reflection arrival time difference between the receivers can be used to eliminate the 180°-azimuth ambiguity of the dipole system. The drawback is that, due to the tool rotation, the take-off azimuth at wave radiation may be different from the incident azimuth at wave reception, thereby affecting the determination of reflector azimuth. Our analysis shows that this rotation-induced azimuth offset can be corrected using the wave reflection travel time and the RPM of the drilling operation. We tested the concept of the proposed LWD acoustic imaging system using synthetic LWD modeling and field wireline data. The theoretical analysis results, therefore, provide a foundation for the LWD system.
Data availability statement
The original contributions presented in the study are included in the article/Supplementary Material; further inquiries can be directed to the corresponding author.
Author contributions
YL: investigation, methodology, and writing–original draft. ZW: funding acquisition, investigation, and writing–original draft. YS: software, supervision, validation, and writing–review and editing. XT: methodology and writing–review and editing.
Funding
The author(s) declare that financial support was received for the research, authorship, and/or publication of this article. This work was supported by the National Natural Science Foundation of China (grant no. U21B2064), the Research and Application Projects of China National Petroleum Corporation (grant no. 2023ZZ15YJ02), and the Tianshan Talent Program of Xinjiang Autonomous Region (grant no. 2022TSYCJC0027).
Conflict of interest
Authors YL and ZW were employed by Xinjiang Oilfield Company of PetroChina.
The remaining authors declare that the research was conducted in the absence of any commercial or financial relationships that could be construed as a potential conflict of interest.
Publisher’s note
All claims expressed in this article are solely those of the authors and do not necessarily represent those of their affiliated organizations, or those of the publisher, the editors, and the reviewers. Any product that may be evaluated in this article, or claim that may be made by its manufacturer, is not guaranteed or endorsed by the publisher.
Supplementary material
The Supplementary Material for this article can be found online at: https://www.frontiersin.org/articles/10.3389/feart.2024.1483285/full#supplementary-material
References
Aki, K., and Richards, P. (1980). Quantitative seismology: theory and methods. San Francisco: W. H. Freeman & Co.
Ben, J. L., Qiao, W. X., Che, X. H., Ju, X. D., Liu, J. Q., and Men, B. (2020). Experimental simulation of obtaining the reflector azimuth using azimuthal acoustic reflection tool in the underwater environment. J. Petroleum Sci. Eng. 195, 107649. doi:10.1016/j.petrol.2020.107649
Bennett, N. N. (2019). 3D slowness time coherence for sonic imaging. Geophysics 84 (5), D179–D189. doi:10.1190/geo2018-0077.1
Bradley, T., Patterson, D., and Tang, X. M. (2011). Applying a through-casing acoustic imaging technique to identify gas migration paths in a salt body. First break 29 (7), 75–84. doi:10.3997/1365-2397.29.7.51916
Cao, J. J., Tang, X. M., Su, Y. D., Wei, Z. T., and Zhuang, C. X. (2016). Radiation characteristics of the single well imaging field in while-drilling logging using an acoustic dipole source. Chin. J. Geophys. (in Chinese) 59 (9), 3503–3513. doi:10.6038/cjg20160932
Gong, H., Chen, H., He, X., Chang, S., Wang, X. M., Wang, B. C., et al. (2018). Modeling and inversions of acoustic reflection logging imaging using the combined monopole-dipole measurement mode. Applied Geophysics 15 (3-4), 393–400. doi:10.1007/s11770-018-0700-y
Gong, H., Chen, H., He, X., and Wang, X. M. (2015). Eliminating the azimuth ambiguity in single-well imaging using 3C sonic data. Geophysics 80 (1), A13–A17. doi:10.1190/GEO2014-0337.1
Gu, X. H., Tang, X. M., and Su, Y. D. (2021). Delineating a cased borehole in unconsolidated formations using dipole acoustic data from a nearby well. Geophysics 86 (5), D139–D147. doi:10.1190/geo2020-0570.1
Hirabayashi, N., Sakiyama, N., and Ikegami, T. (2017). Characteristics of waveforms recorded by azimuthally spaced hydrophones of sonic logging tool for incident plane waves. Geophysics 82 (6), D353–D368. doi:10.1190/GEO2017-0201.1
Hornby, B. E. (1989). Imaging of near-borehole structure using full-waveform sonic data. Geophysics 54 (6), 747–757. doi:10.1190/1.1442702
Kong, F. T., Xu, H. C., Gu, X. H., Luo, C. M., and Li, S. Q. (2023a). Segmentation of borehole acoustic reflection image using feature pyramid network and transfer learning. Geoenergy Science and Engineering 229, 212088. doi:10.1016/j.geoen.2023.212088
Kong, F. T., Xu, H. C., Gu, X. H., Luo, C. M., and Li, S. Q. (2023b). Denoising method of borehole acoustic reflection image using convolutional neural network. Geoenergy Science and Engineering 226, 211761. doi:10.1016/j.geoen.2023.211761
Lee, S. Q., Tang, X. M., and Su, Y. D. (2019). Shear wave imaging to determine near-borehole faults for ocean drilling exploration. Geophysical Journal International 217 (1), 288–293. doi:10.1093/gji/ggz023
Li, C., Chen, H., He, X., and Wang, X. M. (2021a). Identifying reflector azimuth from borehole multicomponent cross-dipole acoustic measurement. Geophysics 86 (6), D201–D214. doi:10.1190/GEO2020-0460.1
Li, C., and Yue, W. Z. (2017). High-resolution Radon transforms for improved dipole acoustic imaging. Geophysical Prospecting 65, 467–484. doi:10.1111/1365-2478.12434
Li, D., Qiao, W. X., Che, X. H., Ju, X. D., Yang, S. B., Lu, J. Q., et al. (2021b). Eliminating the azimuth ambiguity in reflected S-wave imaging logging based on the azimuthal receiver mode. Journal of Petroleum Science and Engineering 199, 108295. doi:10.1016/j.petrol.2020.108295
Li, Y. H., Tang, X. M., Li, H. R., and Lee, S. Q. (2021c). Characterizing the borehole response for single-well shear-wave reflection imaging. Geophysics 86 (1), D15–D26. doi:10.1190/GEO2020-0212.1
Li, Y. H., Tang, X. M., and Su, Y. D. (2022a). Borehole radiation and reception responses for azimuthal shear-wave reflection imaging with an off-centred dipole acoustic tool. Journal of Geophysics and Engineering 19, 1180–1195. doi:10.1093/jge/gxac077
Li, Z., Qi, Q. M., Hei, C., Jiang, C., and Wang, X. J. (2022b). Elastic-wave radiation, scattering, and reception of a dipole acoustic logging-while-drilling source in unconsolidated formations. Frontiers in Earth Science 10, 879345. doi:10.3389/feart.2022.879345
Nakken, E. I., Mjaaland, S., and Solstad, A. (1996). A new MVVD concept for geological positioning of horizontal wells. Journal of Petroleum Technology 48, 239–240. doi:10.2118/30454-MS
Rao, B., Su, Y. D., Li, S. Q., and Tang, X. M. (2023). Effects of collar eccentricity on azimuthal response characteristics for acoustic reflection measurement while drilling. Geophysics 88 (5), D325–D337. doi:10.1190/geo2022-0756.1
Tan, B. H., Tang, X. M., Wei, Z. T., Cao, J. J., and Su, Y. D. (2016). Dominant frequency band and reflected wave field of LWD dipole shear wave remote detection. Acta petrolei Sincia 37 (9), 1152–1158. doi:10.7623/syxb201609009
Tan, B. H., Zhang, K., Su, Y. D., Li, S. Q., and Zhang, L. J. (2022). Research on acoustic logging while drilling transmitting technologies. Journal of Geophysics and Engineering 19, 511–520. doi:10.1093/jge/gxac034
Tang, X. M. (2004). Imaging near-borehole structure using directional acoustic-wave measurement. Geophysics 69 (6), 1378–1386. doi:10.1190/1.1836812
Tang, X. M., Cao, J. J., Li, Z., and Su, Y. D. (2016). Detecting a fluid-filled borehole using elastic waves from a remote borehole. The Journal of the Acoustical Society of America 140 (2), EL211–EL217. doi:10.1121/1.4960143
Tang, X. M., Cao, J. J., and Wei, Z. T. (2014). Shear-wave radiation, reception, and reciprocity of a borehole dipole source: with application to modeling of shear-wave reflection survey. Geophysics 79 (2), T43–T50. doi:10.1190/geo2013-0096.1
Tang, X. M., and Cheng, C. H. (2004). Quantitative borehole acoustic methods. Elsevier Science Publishing.
Tang, X. M., and Patterson, D. J. (2009). Single-well S-wave imaging using multicomponent dipole acoustic-log data. Geophysics 74 (6), WCA211–WCA223. doi:10.1190/1.3227150
Tang, X. M., and Wei, Z. T. (2012). Single-well acoustic reflection imaging using far-field radiation characteristics of a borehole dipole source. Chinese Journal of Geophysics (in Chinese) 55 (8), 2798–2807. doi:10.6038/j.issn.001-5733
Tang, X. M., Zheng, Y. B., and Patterson, D. (2007). Processing array acoustic-logging data to image near-borehole geologic structures. Geophysics 72 (2), E87–E97. doi:10.1190/1.2435083
Wei, Z. T., and Tang, X. M. (2012). Numerical simulation of radiation, reflection, and reception of elastic waves from a borehole dipole source. Geophysics 77 (6), 1–5. doi:10.1190/segam2012-0014.1
Keywords: borehole dipole reflection imaging, logging while drilling, azimuthal reception response, azimuth ambiguity, geosteering
Citation: Li Y, Wang Z, Su Y and Tang X (2024) A theoretical analysis of the logging-while-drilling dipole acoustic reflection measurement. Front. Earth Sci. 12:1483285. doi: 10.3389/feart.2024.1483285
Received: 19 August 2024; Accepted: 07 October 2024;
Published: 28 October 2024.
Edited by:
Huaimin Dong, Chang’an University, ChinaReviewed by:
Pan Zhang, China University of Petroleum Beijing, ChinaJiaqi Xu, Harbin Institute of Technology, China
Copyright © 2024 Li, Wang, Su and Tang. This is an open-access article distributed under the terms of the Creative Commons Attribution License (CC BY). The use, distribution or reproduction in other forums is permitted, provided the original author(s) and the copyright owner(s) are credited and that the original publication in this journal is cited, in accordance with accepted academic practice. No use, distribution or reproduction is permitted which does not comply with these terms.
*Correspondence: Xiaoming Tang, dGFuZ3hpYW1AYWxpeXVuLmNvbQ==
 Yanghu Li
 Zhenlin Wang1,3
 Xiaoming Tang
