- 1Shandong Energy Group Co., Ltd., Jinan, Shandong, China
- 2Institute of Deep Earth Sciences and Green Energy, College of Civil and Transportation Engineering, Shenzhen University, Shenzhen, Guangdong, China
- 3Yanzhou Coal Industry Co., Ltd., Jining, Shandong, China
- 4Shandong Energy Group Luxi Mining Co., Ltd., Heze, Shandong, China
- 5School of Mechanics and Civil Engineering, China University of Mining and Technology, Beijing, China
The tensile fracture of the overlying strata in coal mines significantly affects the stability of the surrounding rock and the working face. This study investigates the effects of rock mineral composition and mining speed on roof strata fracture behavior through three-point bending tests under various mineral compositions and loading rates, simulating tensile fractures under different mining conditions. Fracture processes were monitored using an acoustic emission (AE) system and high-speed camera, with multifractal analysis and digital image correlation (DIC) applied to assess AE signal characteristics and crack propagation. Results indicated that siliceous sandstone (SS) exhibited more rapid and penetrating fractures compared to argillaceous sandstone (AS). Before reaching peak load, AS showed a broader multifractal spectrum width (Δα) than SS, reflecting its more ductile fracture behavior, which also resulted in higher Δα values in the post-peak stage. Both Δα and multifractal spectrum difference (Δf(α)) decreased with increasing loading rates for AS, indicating a weakening of the multifractal characteristics of the AE signals and a progressively dominant presence of strong signals. The fracture behavior in both rock types was dominated by tensile microcracks, along with tensile-shear composite and shear microcracks. Higher loading rates increased the proportion of tensile-shear composite and shear microcracks components in the AE signals, with the rate being lower in AS than SS. These findings provide a basis for predicting the characteristics of the tensile fracture of overlying strata in mined-out areas.
1 Introduction
Coal mining is gradually shifting to deeper levels, with the mining depths exceeding 800 m. The complex deep geology environments lead to more severe dynamic disasters (Cui et al., 2022; Xie et al., 2023; Mahdi et al., 2022). As the working face advances, the periodic breaking of the overlying strata releases significant stored elastic energy in the mined-out area (Wang et al., 2021; Zhao et al., 2021), resulting in mining-induced seismicity (Zhu C. L. et al., 2022). Under the high static stress conditions of deep mining, these unpredictable seismic events easily induce the deformation of surrounding rocks, the ground vibration and the rockburst hazard (Guo et al., 2022; Ma et al., 2024). The tensile fracture behavior of overlying strata is significantly affected by the rock property and the mining speed. Studying the effects of the rock property and the mining speed on the fracture characteristics and patterns of the strata is of great significance for predicting and preventing disasters in deep resource extraction.
The tensile fracture of overlying strata, classified as type I fracture, is induced by the bending and subsidence of the goaf roof strata. Many studies have analyzed the energy release(Rakesh et al., 2022; Cheng et al., 2019; Li H. T. et al., 2022; Sun et al., 2019; Sun et al., 2020), fracture behavior, and breaking extent associated with the tensile fracture of overlying strata. Zhu J. B. et al. (2022) analyzed the damage characteristics and displacement changes of the overlying strata, and further investigated the influence of the strata tensile fracture on the stability of coal pillars. Yang et al. (2019) revealed the fracture mechanism of the goaf roof strata and analyzed the stress, deformation and stability of the roadway. Regarding the rock property effect, Zhang et al. (2020) studied the macroscopic crack propagation patterns and strength characteristics of mudstone, sandstone, and coal under three-point bending, demonstrating that the rock mesostructure significantly affects the macroscopic damage characteristics. Cai et al. (2022) analyzed the coupling evolution law of stress and energy in the overlying strata under mining activities using the methods of field experiments and fractal theory, revealing the breaking process of the roof strata and the disaster mechanisms. Moreover, the joint characteristics and anisotropy of rock significantly affect its mechanical behavior (Chen et al., 2022; Feng et al., 2023; Zhou et al., 2022; Zhu et al., 2024). Gong et al. (2024), based on simulations of the cross-scale failure processes in discontinuous rock masses, revealed the nonlinear mechanical behavior of rock. Qiu et al. (2023) and Yin et al. (2023) investigated the dynamic mechanical response of jointed rock masses under different strain rates and joint characteristics, highlighting their effects on strength and failure modes. These research results demonstrate that the tensile fracture of the overlying roof strata significantly affects the stability of the surrounding rock of roadways. However, few systematic studies have focused on the influence of the rock property and the mining speed on the fracture characteristics and patterns of the roof strata.
A great number of scholars have carried out three-point bending tests of rocks to simulate the tensile fracture of roof strata (Du et al., 2022; Li T. et al., 2018; Wei et al., 2021), with monitoring the damage process and acoustic emission signals using the acoustic emission (AE) system and the digital image correlation (DIC) techniques (Prikryl et al., 2003). Zhang et al. (2015) demonstrated that the AE system and DIC techniques can effectively monitor the initiation and propagation behavior of cracks in sandstone under three-point bending tests. Lin et al. (2019) investigated into the fracture process zone under three-point bending tests using AE and DIC techniques, validating that its energy changes conform to the linear softening law of the fracture process zone. Li X. L. et al. (2018) conducted three-point bending tests to reproduce the tensile fracture of roof strata and investigated the effect of mining speeds on the fracture characteristics of the overlying strata. It is found that the loading rate is exponentially positively correlated with the AE peak energy and peak load, and exponentially negatively correlated with the total AE count. Gao et al. (2021) studied the evolution processes of the surface deformation, crack propagation, and strain energy in coal samples under different stress paths using the AE system and DIC techniques.
The studies above demonstrate that the AE and DIC techniques effectively describe the damage characteristics of specimens under different rock properties and loading conditions. Some scholars have analyzed the AE signals associated with the damage processes of rock materials using fractal theory, which can describe irregular phenomena in nature and is widely used to study the damage characteristics of rock-like materials (Lei et al., 2023; Mao et al., 2020; Ghanbarian et al., 2019). Zhang et al. (2022) discovered that under three-point bending tests on granite at high temperatures, the multifractal spectrum width Δα gradually decreases and the ductile failure becomes dominant as the temperature of the rock samples increases. Lei et al. (2023) found that the decrease in Δf(α) indicates an increased proportion of large-scale shear fractures under uniaxial compression tests on sandstone with different crack distributions. Ou et al. (2023) applied the multifractal analysis method to the AE signals induced by rock brittle fracture, demonstrating that rock brittleness is positively correlated with the multifractal spectrum width Δα and negatively correlated with the difference between the two ends of the multifractal spectrum Δf(α). Sudden changes in these two parameters could serve as precursors to rock failure. These studies confirm that the fractal theory can effectively quantify the characteristics of AE signals induced by rock material damage. However, the AE signal characteristics for the tensile fracture of roof strata remain unclear, limiting early warning and prediction of the goaf roof strata breaking.
Based on the aforementioned research background and methods, a series of three-point bending tests were conducted under different rock properties and loading rates. The fracture strength, energy release, AE signals characteristics, and crack propagation associated with the tensile fracture of roof strata were obtained based on the AE monitoring systems, DIC technology, and high-speed cameras. Moreover, the fractal theory was applied to further analyze the fracture characteristics of roof strata under different rock properties and loading rates. The research findings will provide a basis for the early warning of the tensile fracture of overlying roof strata in mined-out areas.
2 Experimental Procedures
2.1 Specimens preparation
The sandstone layer dominates the overlying strata of underground coal resources, with its physical and mechanical properties influenced by various factors such as the size of clastic particles, composition, and types of cementing materials. Among these factors, the type of cementing material within the rock directly influences the bonding strength of the clastic particles, significantly affecting the overall mechanical performance of the sandstone (Gao and Kang, 2017). For sandstone materials, the most common types are argillaceous sandstone (AS) and siliceous sandstone (SS). Therefore, AS and SS were selected as test samples in this study, with the specimens sourced from a metal mine in Hunan and a coal mine in Shanxi. The primary mineral compositions of AS and SS are shown in Figures 1, 2, respectively. AS mainly comprises quartz lithic fragments, siliceous lithic fragments, argillaceous lithic fragments, and volcanic lithic fragments. The interstitial materials are primarily argillaceous, mica, chlorite, and carbonate minerals, with argillaceous materials mainly composed of clay mineral aggregates. In contrast, SS primarily consists of siliceous lithic fragments and quartz lithic fragments. The siliceous lithic fragments are composed of microcrystalline to cryptocrystalline siliceous aggregates, while the quartz lithic fragments are composed of granular quartz aggregates. The quartz particles exhibit serrated contacts. The interstitial materials in SS are mainly siliceous, carbonate minerals, and opaque minerals, with the siliceous materials mostly being secondary overgrowths of quartz surrounding the edges of the detrital particles.

Figure 1. Image of argillaceous cemented sandstone main mineral components identification: (A) Main mineral composition proportions; (B) Mineral identification under a polarizing microscope.
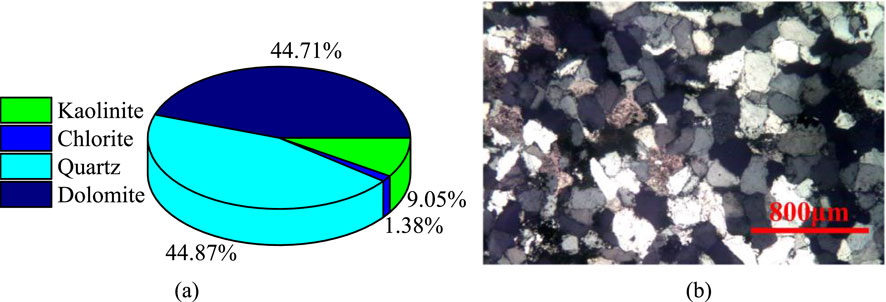
Figure 2. Image of siliceous cemented sandstone main mineral components identification: (A) Main mineral composition proportions; (B) Mineral identification under a polarizing microscope.
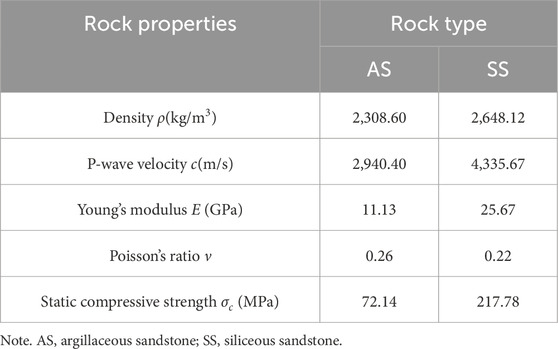
According to the recommended methods of the International Society for Rock Mechanics and Rock Engineering, the basic physical and mechanical parameters of the two types of rock samples were measured, as shown in Table 1. Regarding P-wave velocity, AS exhibits stronger heterogeneity, while SS, with its higher density, is more homogeneous. Due to differences in material composition, there are significant distinctions in the strength parameters between the two types of rock. When preparing rock beam samples, the dimensions were uniformly processed to 250×30×50 mm (length×width×height). The prepared sandstone samples were free of prefabricated cracks and obvious joints, with the flatness error of the end faces controlled within 0.01 mm.
2.2 Experimental methods
Using the AGX-V material testing machine, three-point bending tests were conducted on rectangular sandstone specimens. The contact between the specimen and the upper loading end was linear, with a span of 200 mm between the lower support points, and the bottom of the testing machine was equipped with cylindrical supports. The specimens loading and the schematic of the acoustic emission sensor arrangement are depicted in Figures 3A, B, respectively. Before the test, a preload of 10 N was applied. Loading tests were performed on both AS and SS specimens at loading rates of 0.05, 0.15, 0.5, 1.5, 5.0, and 15.0 mm/min, with each test group repeated five times.
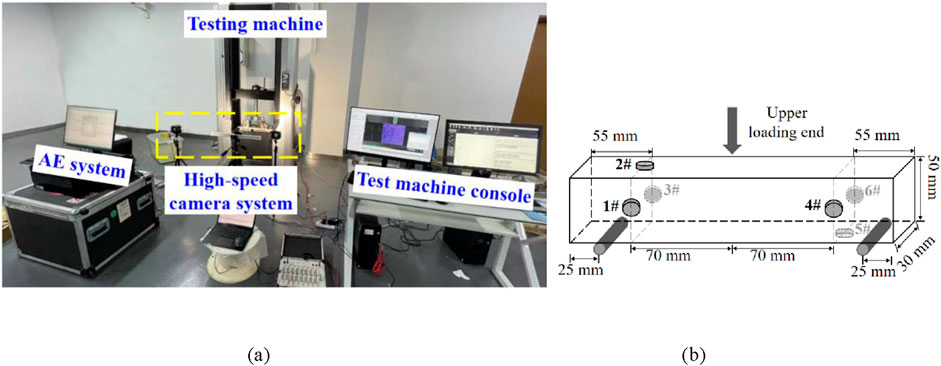
Figure 3. Schematic of test apparatus and set-up: (A) loading configuration of sample; (B) schematic of acoustic emission sensor arrangement.
During the tests, an acoustic emission (AE) monitoring system, digital image correlation (DIC) technology, and a high-speed camera were employed to capture real-time AE signals emanating from internal damage and failure of the specimens, as well as to monitor surface deformation. Simultaneously, the loading force and displacement at the loading end were recorded by the testing machine, with a data sampling frequency of 1 kHz. The tests were terminated when the loading force dropped below 0.3% of the peak value.
The experiment employed a PCI-2 Acoustic Emission (AE) system equipped with six Micro 30 sensors, which have a frequency response range of 150–400 kHz and a resonant frequency of 225 kHz. The system utilized preamplifiers with a gain of 40 dB, and all sensor signals were set with a trigger threshold of 45 dB. The sampling frequency was 5 MHz, with a sampling length of 2048.
To ensure accurate measurements, the surfaces of the rectangular sandstone specimens were polished, and the sensors were fixed in place with tape. High vacuum grease was applied to couple the sensors to the rock. As shown in Figure 3, sensors 1# to 3# were positioned on the left side of the specimen, while sensors 4# to 6# were on the right side. Each sensor was placed 70 mm from the specimen centre and equidistant from the top and bottom edges. Six sensors were chosen to ensure sufficient data collection and a balanced experimental setup. As shown in Figure 3, the experiment utilized a Phantom TMX 7510 high-speed camera along with two LED compensating light sources. The camera was strategically positioned in front of the specimen to monitor the deformation of the speckled area on the front surface and the failure process of the specimen. The speckle pattern, spanning a width of 50 mm, consisted of black spots on a white background, with spot sizes ranging from 0.1 to 1 mm. Just before the macroscopic fracture of the specimen, the high-speed camera was manually triggered to capture images at a frame rate of 20,000 fps.
3 Results and analysis
3.1 Load-displacement curves
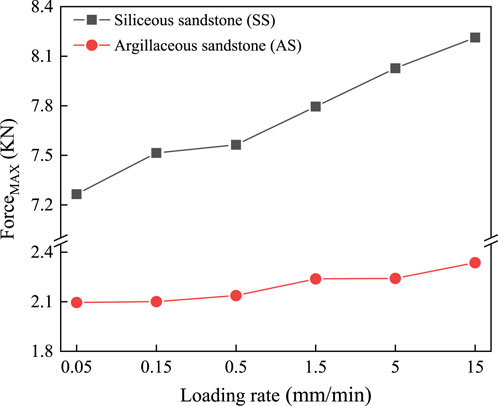
The load-displacement curves of typical specimens from two lithologies subjected to different loading rates are depicted in Figure 4. It can be observed that the mechanical response trends of both types of sandstone are similar under various loading rates. Both types exhibit a nearly linear increase in load before the peak, followed by a sudden fracture after the peak, demonstrating clear brittle characteristics. However, the post-peak stress of AS does not drop to zero and retains some load-bearing capacity. By extracting the peak load of each specimen, the variation of the peak load with loading rate can be obtained, as shown in Figure 5. Within the loading rate range of 0.05–15 mm/min, both AS and SS show an increasing trend in peak load and failure strain. The peak load increments for AS are 0.3%, 2.0%, 6.8%, 7.0%, and 11.5%, while for SS they are 3.4%, 4.1%, 7.3%, 10.5%, and 13.1%. Due to the higher mineral content and cementation strength of SS, it has a stronger overall load-bearing capacity, with a slightly higher increase in peak load compared to AS.
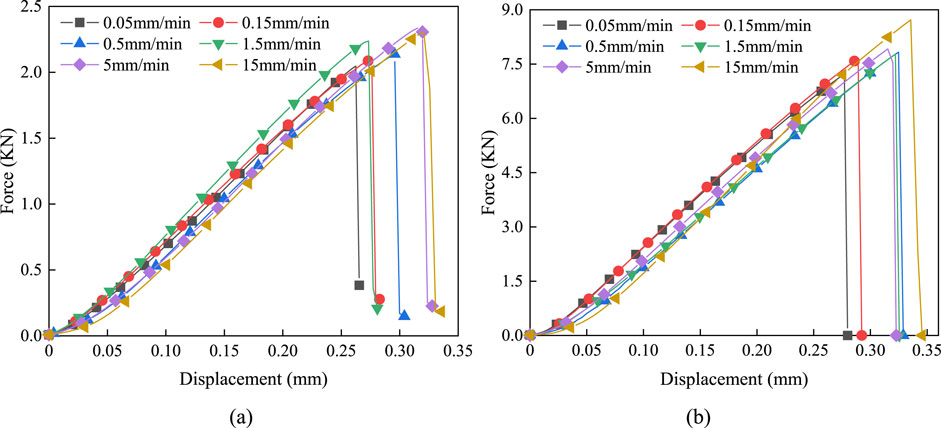
Figure 4. Force displacement diagram: (A) AS; (B) SS. AS= argillaceous sandstone; SS= siliceous sandstone. 0.05 mm/min denotes the experimental results for the specimen tested at a loading rate of 0.05 mm/min.
3.2 Acoustic emission characteristic parameters
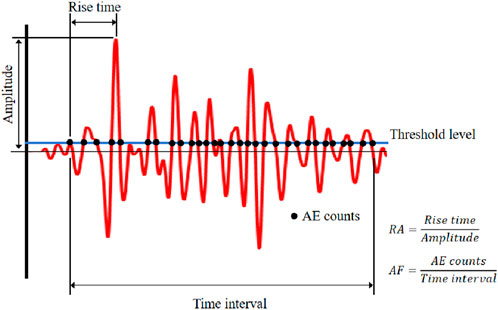
The complete waveform captured by the AE signal encapsulates a wealth of destructive information, enabling both direct and indirect assessments of the internal damage in the specimen (Zhang and Deng, 2020). AE parameters, such as AE counts and AE energy, play a pivotal role in elucidating the mechanisms of fracturing and damage in rock materials. AE counts measure the number of oscillations surpassing the threshold level of the signal, thereby indicating the rate of crack initiation and propagation. Concurrently, AE energy is calculated by integrating the waveforms recorded by the signal acquisition system, which facilitates an analysis of the energy dynamics associated with crack propagation and the overall severity of rock damage. Figure 6 illustrates the methods used to compute various AE characteristic parameters.
3.2.1 Time domain parameters
The failure process of rocks under load is essentially a process of energy transfer. This paper employs the AE energy parameters to characterize the failure features of sandstone. Under a three-point bending load, the typical time-domain images of sandstone at different loading rates are shown in Figure 7. To facilitate the quantitative analysis of the tensile fracture characteristics, the loading process is divided into three stages based on the load-time curves: Stage I. Tension and elastic stage (0<σ ≤0.9 σmax), Stage II. Plastic failure stage (0.9 σmax<σ ≤σmax), Stage III. Residual stage (After the peak load). Where σ and σmax represent the stress and the peak failure stress of the sandstone specimen, respectively.
Stage I: Both AS and SS enter a tension phase characterized by the activation of pre-existing internal defects at the onset of loading. Initially, the load-time curve exhibits a gradual increase in slope over a short period (the first 10% of loading time), which then transitions into a sustained linear growth for the majority of the period (covering 80% of the loading time), signalling the elastic stage. During this phase, the AE energy characteristics of the AS and SS exhibit similar patterns, characterized by sporadic microcrack formation and low-intensity AE signals. The limited increase in cumulative AE energy indicates minimal elastic energy release, which contributes to preserving structural integrity by preventing the formation of larger fractures.
Stage II: As the loading force increases, approaching the peak load, micro-cracks progressively propagate and grow in scale. During this stage, the slope of the load-time curve gradually decreases until the peak load is reached, where the coalescence of previously accumulated cracks is observed, causing a sudden macroscopic fracture in the specimen. At this stage, individual AE signal energy peaks achieve the highest levels of the entire process, with a sharp increase in cumulative AE energy. As the loading rate increases, the peak energy of individual AE signals gradually rises, and the number of signals with higher energy significantly increases. The increased loading rate accelerates crack propagation, leading to a more concentrated release of stored energy. Compared to the AS, the SS exhibits higher individual energy peaks, greater increases, and a larger rise in cumulative energy, indicating a more abrupt and brittle fracture process
Stage III: After the peak load, macroscopic cracks traverse the specimen, causing a sudden drop in load-bearing capacity. The AS retains a certain residual strength after the peak drop, whereas the SS completely loses its load-bearing capacity. The AS continues to fail under the external force during this stage, with a significant post-peak residual phase, still generating notable AE energy signals. This ongoing AE activity suggests that microcrack development and crack bridging are still active. Thus, the cumulative AE energy continues to rise until the specimen is fully damaged. In contrast, the SS exhibits few significant AE energy signals at this stage, indicating a rapid fracture process with limited energy dissipation, further emphasizing that the AS has a markedly stronger ductile response than the SS.
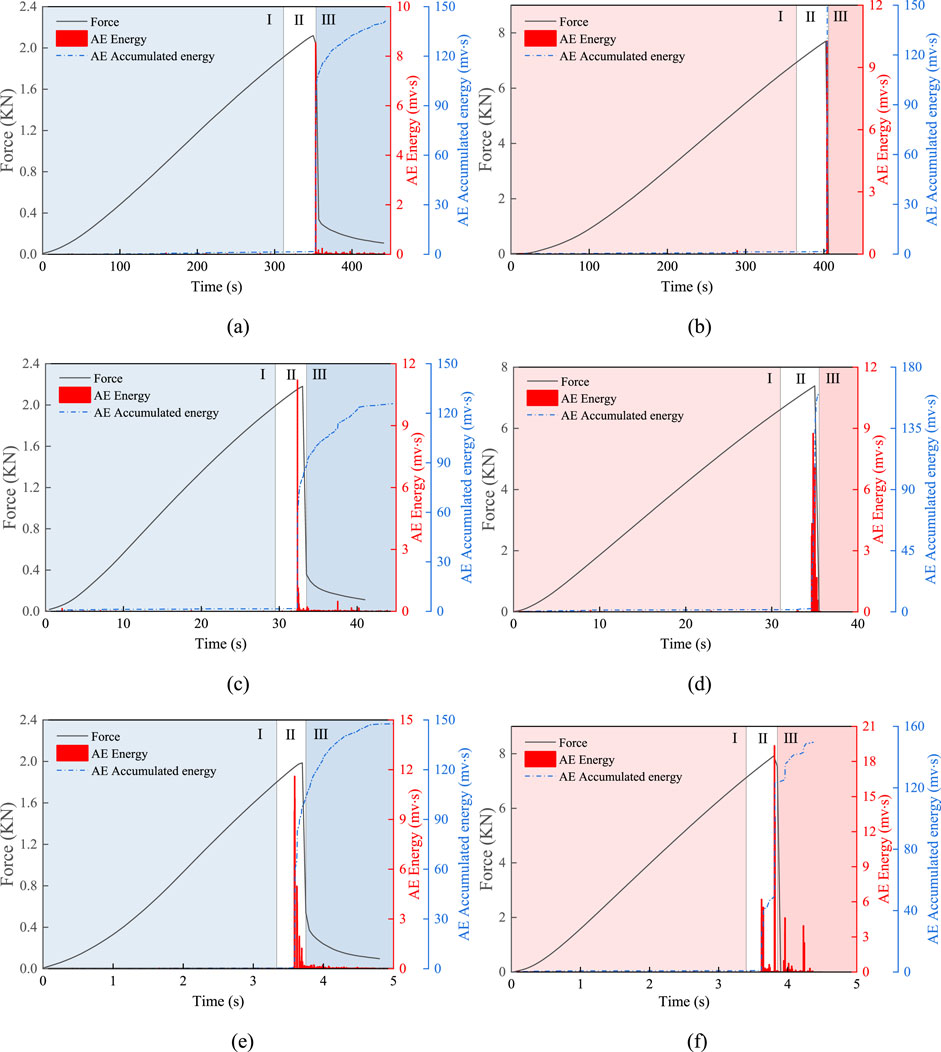
Figure 7. Typical sandstone time-domain image: (A) AS-0.05; (B) SS-0.05; (C) AS-0.5; (D) SS-0.5; (E) AS-5.0; (F) SS-5.0. AS= argillaceous sandstone; SS= siliceous sandstone; AS-0.05 denotes the experimental results for the AS specimen tested at a loading rate of 0.05 mm/min.
3.2.2 Frequency domain parameters
Acoustic emission frequency domain characteristics can reflect the stress state and mechanical properties of rocks and provide a good representation of the overall spectral features (Kong et al., 2017; Liang et al., 2020). This study utilizes the fast flourier transform (FFT) to convert time-domain signals into the frequency domain, analyzing the distribution of dominant frequencies and the frequency structure. The typical frequency distribution images of sandstone are illustrated in Figure 8.
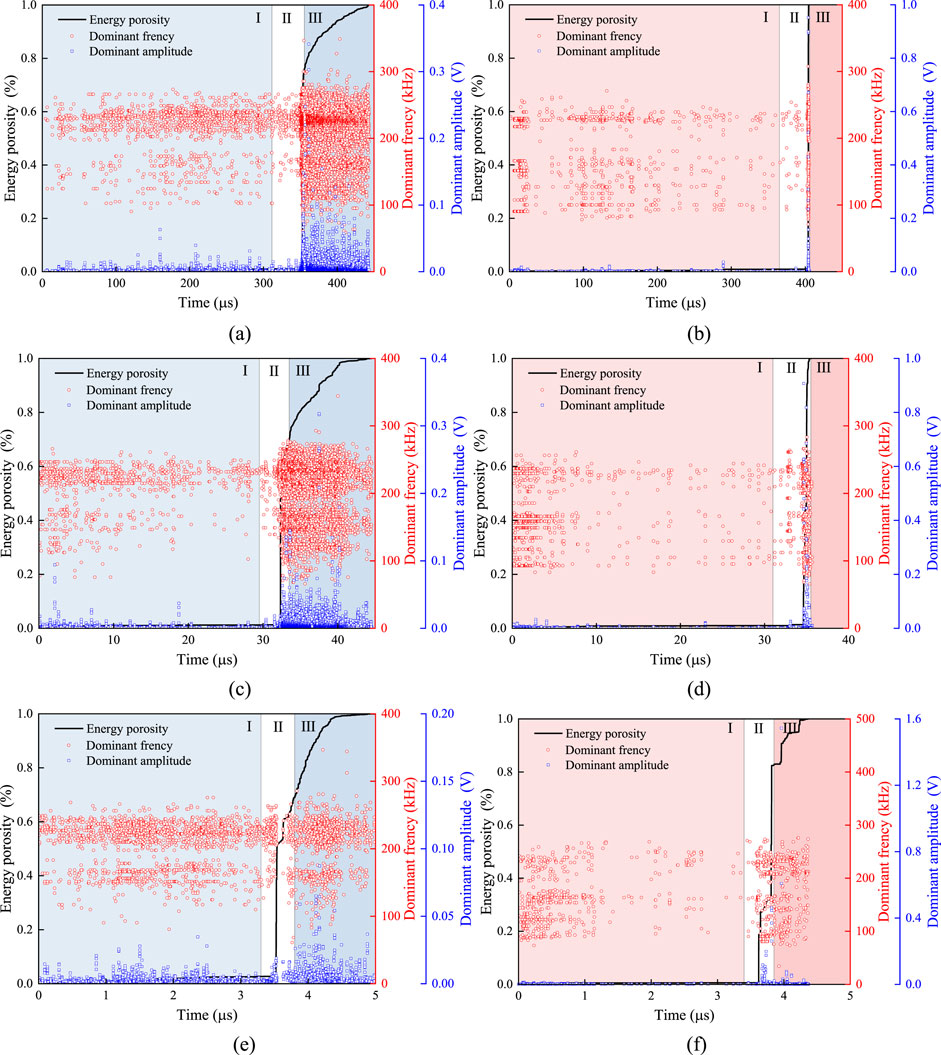
Figure 8. Typical sandstone dominant frequency distribution image: (A) AS-0.05; (B) SS-0.05; (C) AS-0.5; (D) SS-0.5; (E) AS-5.0; (F) SS-5.0. AS= argillaceous sandstone; SS= siliceous sandstone; AS-0.05 denotes the experimental results for the AS specimen tested at a loading rate of 0.05 mm/min.
From the graph, the dominant frequencies for AS and SS throughout the entire three-point bending failure process primarily range between 100 and 300 kHz. In Stage I, both types of samples exhibit a low density of AE signals; however, the signal density significantly increases in Stages II and III. Particularly in Stage III, the residual stage, the propagation of internal cracks leads to the macroscopic fracture of the specimens, markedly increasing both the signal density and the amplitude of energy. During the early tension phase of Stage I, the SS shows a higher number of AE signals, but fewer during the elastic phase. The lower frequency and energy amplitude of AE signals before the formation of penetrating fractures indicate the sample’s superior homogeneity and greater strength. Under varying loading rates, the AS consistently shows more AE signals in all loading stages compared to the SS, a phenomenon likely related to the lower strength and higher heterogeneity of the argillaceous sandstone samples, with each stage of continuous destruction accompanied by continuous AE signal release. The expansion of macroscopic cracks in AS and SS mainly occurs in Stage II, where there is a sudden increase in cumulative AE energy. As the loading rate increases, the onset of macroscopic cracks progressively advances. When the loading rate increases from 0.05 to 5 mm/min, the moments of a sharp increase in cumulative AE energy for the AS and SS respectively occur at 100, 97.8, 91.7% and 100, 98.5, 93.8% of the peak load.
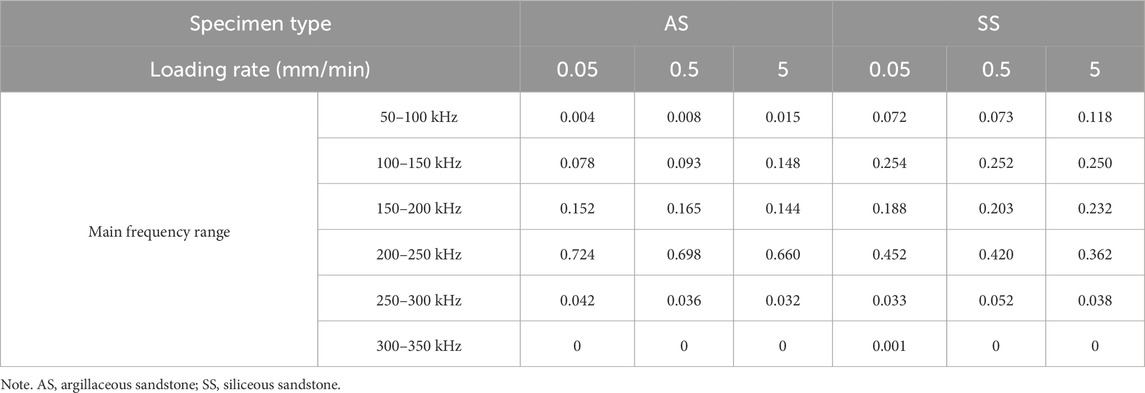
To quantitatively describe the frequency distribution and the amplitude of dominant frequencies throughout the loading process of the AS and the SS, statistics on the dominant frequency distribution intervals were collected for loading rates of 0.05, 0.5, and 5 mm/min, with results presented in Table 2. Additionally, spectral graphs for the SS at loading rates of 0.05 and 5 mm/min were plotted, as shown in Figure 9. According to Table 2, the primary frequency distribution intervals for both AS and SS predominantly range between 200 and 250 kHz, accounting for 60%–80% and 30%–50% respectively, with fewer dominant frequencies below 100 kHz and above 250 kHz. For the AS, as the loading rate increases, the proportion of dominant frequencies in the 50–150 kHz range gradually increases, while the proportion in the 200–300 kHz range decreases. For the SS, with increasing loading rates, the proportion of dominant frequencies in the 50–100 kHz range gradually increases, whereas the proportion in the 200–250 kHz range decreases. It is evident that for both types of sandstone, the proportion of events at lower dominant frequencies increases with rising loading rates, while the proportion of events at higher dominant frequencies decreases.
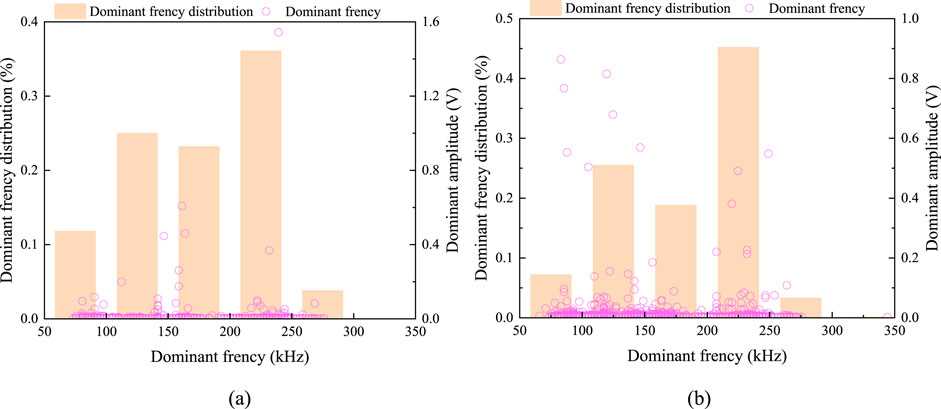
Figure 9. Typical sandstone spectral images: (A) SS-0.05; (B) SS-5.0. SS= siliceous sandstone; SS-0.05 denotes the experimental results for the SS specimen tested at a loading rate of 0.05 mm/min.
Large-scale fractures in sandstone typically occur only after the load reaches a critical threshold, associated with AE signal events that exhibit lower dominant frequencies. These events, although less frequent, often feature larger signal amplitudes and contain higher energy, representing a smaller proportion of total events. In contrast, higher frequency events, indicative of small-scale damage, are more prevalent. The lower dominant frequencies observed in large-scale fracture events can be attributed to the longer wavelength of stress waves generated by the release of significant amounts of energy over larger fracture surfaces. With increasing loading rates, the destruction of sandstone samples accelerates, markedly reducing the frequency of small-scale damage events, while the occurrence of large-scale fractures remains relatively stable or increases slightly. As a result, higher loading rates lead to a shift in the overall destruction pattern of the samples, increasing the proportion of low dominant frequency events and decreasing that of high dominant frequency events. Furthermore, the homogeneity of SS exceeds that of AS, leading to less variability in the proportion of dominant frequency ranges in SS compared to AS. As the loading rate increases, the spectral characteristics of both AS and SS transition from low to high frequencies while maintaining high amplitudes.
3.2.3 Multifractal characteristics of AE signals
Simple fractal dimensions sometimes fail to reflect local variations and the essential characteristics of signals. Therefore, this paper employs multifractal dimensions, which can describe the data structure across multiple scales (Li H. R. et al., 2022; Li X. L. et al., 2018), for processing and analyzing Acoustic Emission (AE) signals. The methodology involves constructing the fluctuation function
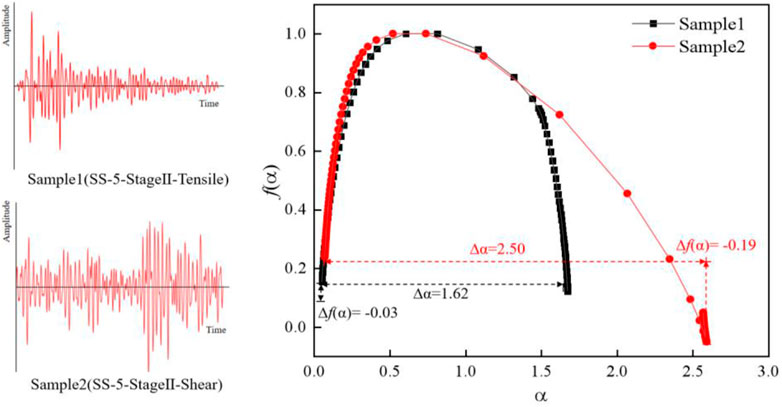
Figure 10. Multifractal spectrum and characteristic parameters. SS= siliceous sandstone; Δα denotes the width of the multifractal spectrum; Δf(α) denotes the difference between the extremes of the multifractal spectrum; Stage Ⅱ= Plastic failure stage (Please refer to section 3.2.1 for specific phase description).
The width of the multifractal spectrum, Δα=αmax - αmin, indicates the level of heterogeneity in the Acoustic Emission (AE) energy data, with larger values suggesting more pronounced multifractal characteristics. The difference between the extremes of the multifractal spectrum, Δf(α) = f(αmax)- f(αmin), elucidates the frequency relationship between high-energy signals (f(αmin)) and low-energy signals (f(αmax)) (Hu et al., 2014; Ou et al., 2023; Zhang et al., 2022). A smaller value of Δf(α) (i.e., f(αmax)- f(αmin) < 0) indicates that high-energy signals are more frequent and dominant. Conversely, if f(αmax)- f(αmin) > 0, low-energy signals predominate. This analysis integrates the characteristics of the three destruction stages of AS and SS samples to evaluate their multifractal features. Focusing on the critical damage signals of each stage, the five sets of data with the highest amplitudes from each stage are selected for multifractal calculations, and their averages are computed. Figure 11 displays the change laws in the characteristic parameters of AE signals for the AS and SS under various loading rates.
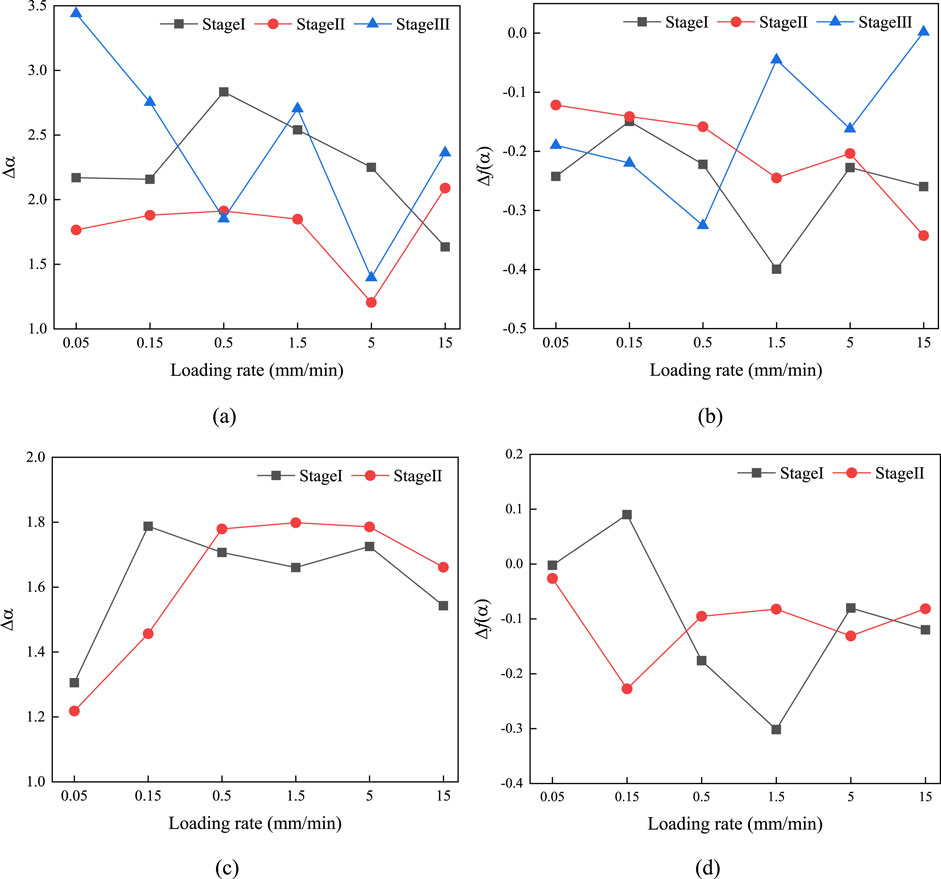
Figure 11. Change law of characteristic parameters for multifractal spectrum: (A) AS-Δα; (B) AS-Δf(α); (C) SS-Δα; (D) SS-Δf(α). AS= argillaceous sandstone; SS= siliceous sandstone; Δα denotes the width of the multifractal spectrum; Δf(α) denotes the difference between the extremes of the multifractal spectrum.
The graph indicates that the characteristic parameters of AE signals for AS and SS vary under different loading rates. In the initial loading stages I and II, the absolute values of the difference between the extremes of the multifractal spectrum, Δf(α), for the AS and SS fluctuate and increase with the loading rate. Consequently, if the loading rate increases, the frequency of high-energy signal occurrences for both types of samples also rises, enhancing the heterogeneity of the released energy signals, and the damage signals in the argillaceous sandstone are more complex at the same loading rate. Additionally, the multifractal spectrum width Δα for the AS, which shows more pronounced ductile characteristics, is greater than for the SS, indicating that the AE signal’s multifractal characteristics of post-load damage are more distinct in the AS. This could be linked to the stronger heterogeneity of its internal binders, with an increase in loading rate potentially leading to the expansion of more internal defects. For the SS, both Δα and the absolute value of Δf(α) fluctuate and increase with the loading rate. For this siliceous sandstone, the higher the loading rate, the more uneven the AE signal energy becomes in the first two stages, with the frequency of high-energy events increasing. In Stage III, both Δα and the absolute value of Δf(α) for the AS show a fluctuating downward trend with increasing loading rates. As the loading rate increases, the duration of the residual phase in AS shortens, and the frequency of high-energy signal release decreases. Additionally, an increased loading rate might cause high-energy damage to occur earlier.
3.3 Deformation and fracture characteristics
3.3.1 Fracture modes
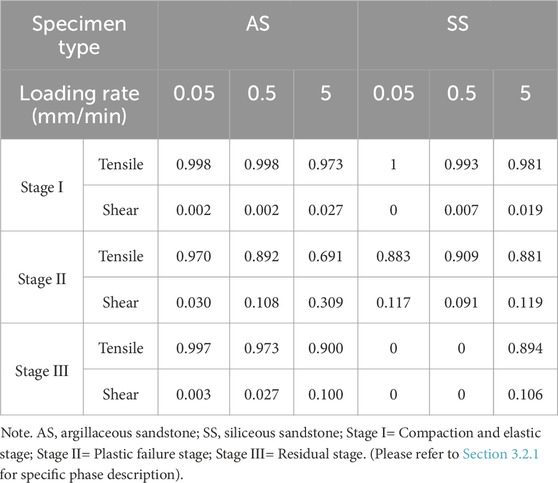
The average frequency (AF) and rise angle (RA) of AE signals are commonly used to discriminate between tensile failure and shear failure (or a mix of tensile and shear failure) (Niu et al., 2020; Zhang et al., 2020). The calculation formulas for the AF and RA are shown in Figure 6. The waveform of the tensile failure propagates as longitudinal waves, resulting in a smaller RA; while the shear failure waveforms propagate as shear waves, resulting in a larger RA. In this study, AF and RA were normalized (Zhao et al., 2022), and an AF/RA ratio greater than 1 was used to identify tensile failure, while a ratio of 1 or less indicated shear failure (or a mix of tensile and shear failure). This method was applied to analyze the failure modes of AS and SS at loading rates of 0.05, 0.5, and 5 mm/min. The calculation results are shown in Table 3, and the typical RA-AF distribution is shown in Figure 12.
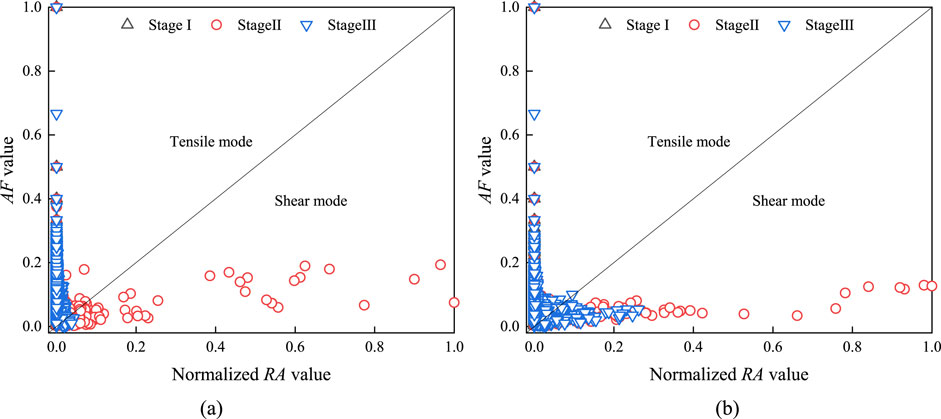
Figure 12. Distribution of the RA-AF values: (A) SS-0.05; (B) SS-5.0. SS= siliceous sandstone; SS-0.05 denotes the experimental results for the SS specimen tested at a loading rate of 0.05 mm/min.
As shown in Table 3, based on the AF/RA calculation results, the microcrack modes of both types of sandstone at different loading rates predominantly exhibit tensile fracture, with the AE signals of tensile fracture exceeding 60% at each stage. For various loading rates, the proportion of shear fracture in the plastic failure stage (Stage II) is higher than in the compaction and elastic stage (Stage I) and the residual stage (Stage III). The highest proportion of the tensile fracture occurs in Stage I for both types of sandstone, maintaining above 95%. The proportion of shear fracture in Stage I increases from 0.002% to 0.027% and from 0% to 0.019% for AS and SS as the loading rate increases. The highest proportion of the shear fractures occurs in Stage II. As the loading rate increases, the proportion increases for AS from 0.03% to 0.309%, whereas SS shows a relatively stable range of 9%–12%. The fracture mode variation in Stage III is similar to Stage I, with a slight increase in the proportion of shear fracture as the loading rate increases, while the proportion of tensile fracture remains above 85%. At lower loading rates, the amplitude of tensile fracture is higher, consuming more energy for small-scale fracture. The proportion of combined tensile and shear failures rises as the loading rate increases, indicating that the energy dissipated by the large-scale fracture is more than at lower loading rates.
The AS and SS exhibit predominantly tensile fracture under three points bending. In the initial loading stage, i.e., Stage I, the elastic energy is primarily stored as releasable energy, with a small amount of energy dissipated through the tensile micro-fracture. As the loading rate increases, the internal damage of rock accelerates and the structure becomes increasingly complex, with the tensile and shear mixed micro-fracture gradually increasing. The increased loading rate enhances the stress intensity around pre-existing micro-cracks, promoting their coalescence and leading to a more intricate fracture network. When the stored energy within the sample reaches its peak, the sample suddenly fails and the fracture mode largely exhibits the tensile fracture. In this stage, the mixed micro-fracture significantly increases and the proportion of it reaches a maximum in the whole loading process, indicating the complexity of the internal damage structure induced by the increased loading rate, as depicted in Figure 12. The sudden release of accumulated elastic energy contributes to the rapid propagation of tensile cracks, resulting in the dominant fracture mode being tensile. Numerous AE events are observed in the residual stage due to the ductility of the AS. However, the SS with poor ductility rapidly loses its load-bearing capacity after the peak load, leading to no significant residual stage. The SS exhibits a short residual stage at a high loading rate, with the predominantly dominant of tensile fracture.
3.3.2 Surface deformation
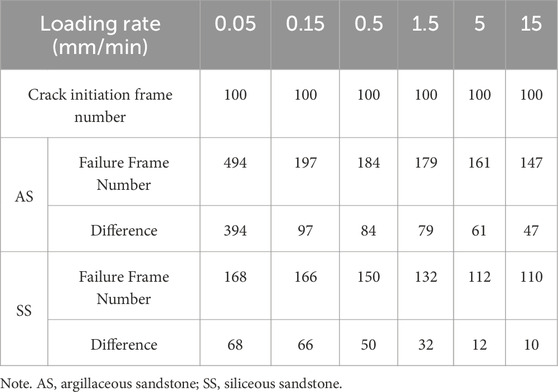
High-speed camera imaging combined with Digital Image Correlation (DIC) technology provides a precise capture of the evolution of surface cracks and strain fields in samples, thereby enhancing our understanding of AS and SS fracture characteristics. This study aims to facilitate the analysis of AS and SS fracture processes under various loading rates. To achieve this, the frame number when visible cracks first appear is defined as the crack initiation frame, and the frame when cracks penetrate the sample or result in a loss of load-bearing capacity is defined as the failure frame. The crack initiation and failure frames for AS and SS under different loading rates are summarized in Table 4, with the crack initiation frame designated as the 100th frame.
Table 4 demonstrates that as loading rates increase, the interval between crack initiation and failure frames decreases for both AS and SS, indicating accelerated fracture rates. However, at equivalent loading rates, AS exhibits slower fracture rates compared to SS. By employing DIC technology, we generated horizontal strain contour maps of the central surface area of samples, which are depicted in Figure 13. Due to space constraints, strain contour maps for loading rates of 0.05, 0.5, and 5 mm/min are presented in Figure 14.
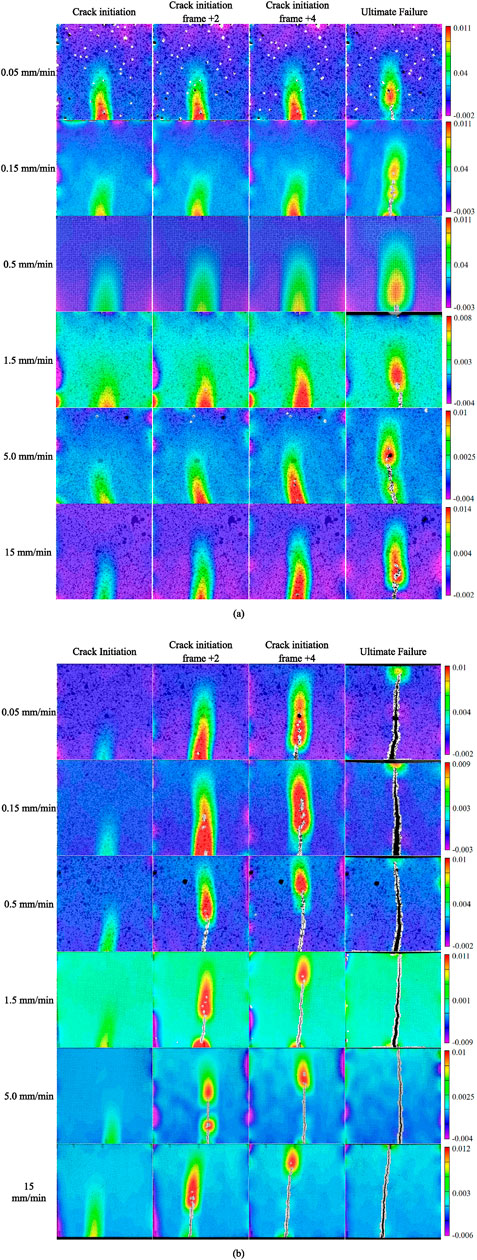
Figure 14. Horizontal strain cloud map of sandstone: (A) AS; (B) SS. AS= argillaceous sandstone; SS= siliceous sandstone; Crack Initiation denotes the moment when cracks appear in the specimen; Crack initiation frame +2 denotes the 0.1 m after the moment of crack initiation; Crack initiation frame +4 denotes the 0.2 m after the moment of crack initiation; 0.05 mm/min denotes that the specimen is subjected to a loading rate of 0.05 mm/min.
Figure 14 presents images of the crack initiation frame, the second and fourth frames post-initiation, and the failure frames for both AS and SS. The overall fracture patterns indicate that under three-point bending, high strain zones initially manifest at the lower central part of the samples, where damage is most severe. Subsequently, stress concentration evolves into macroscopic cracks that progressively extend upward. In AS samples, cracks extend only halfway up the sample height at failure without developing through cracks. In contrast, SS exhibits more severe damage, with a rapid loss of load-bearing capacity upon macroscopic crack penetration. This higher fracture rate in SS is attributed to its greater elastic modulus, strength, and homogeneity, which facilitate greater energy accumulation and release before failure.
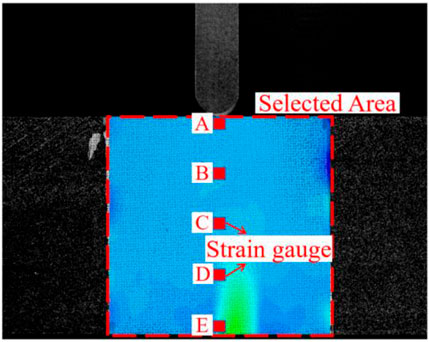
Analysis of strain data indicates higher horizontal strain increase rates near the lower sections of both AS and SS under various loading rates. In AS, the midline consistently exhibits higher horizontal strain peaks in the lower section. SS shows a similar trend at loading rates below 5 mm/min; however, above this threshold, the horizontal strain peaks reverse (E < D < C < B < A), indicating lower strain in the lower tensile zone due to rapid crack penetration (less than 0.6 m), which limits pre-failure deformation.
Increasing loading rates accelerate crack propagation and intensify crack development, resulting in larger expansions upon loss of load-bearing capacity. Different sandstone types exhibit varying sensitivities to loading rates. As depicted in Table 4, as loading rates increase from 0.05 to 15 mm/min, AS and SS show significant increases in fracture rates by 75.1%, 78.7%, 79.9%, 84.5%, and 88.1% (with fracture duration decreasing from 19.7 m to 2.4 m) and 2.9%, 26.5%, 52.9%, 82.4%, and 85.3% (from 3.4 m to 0.5 m), respectively. For AS samples, fracture rate acceleration stabilizes when the loading rate exceeds 0.15 mm/min, whereas for SS samples, this stabilization occurs only when the loading rate exceeds 5 mm/min.
Considering factors such as crack deviation and strain variation intensity, this study placed five equidistant strain monitoring points along the central vertical line of AS and SS samples at loading rates of 0.05, 0.15, and 5 mm/min, as depicted in Figure 13. Surface strain data were extracted from 400 (50) frames before and 500 (100) frames after crack initiation for AS (SS), totalling 900 (100) frames. Due to the greater ductility of AS, 1,000 frames were extracted for AS-0.05, plotting horizontal strain variations in Figure 15.
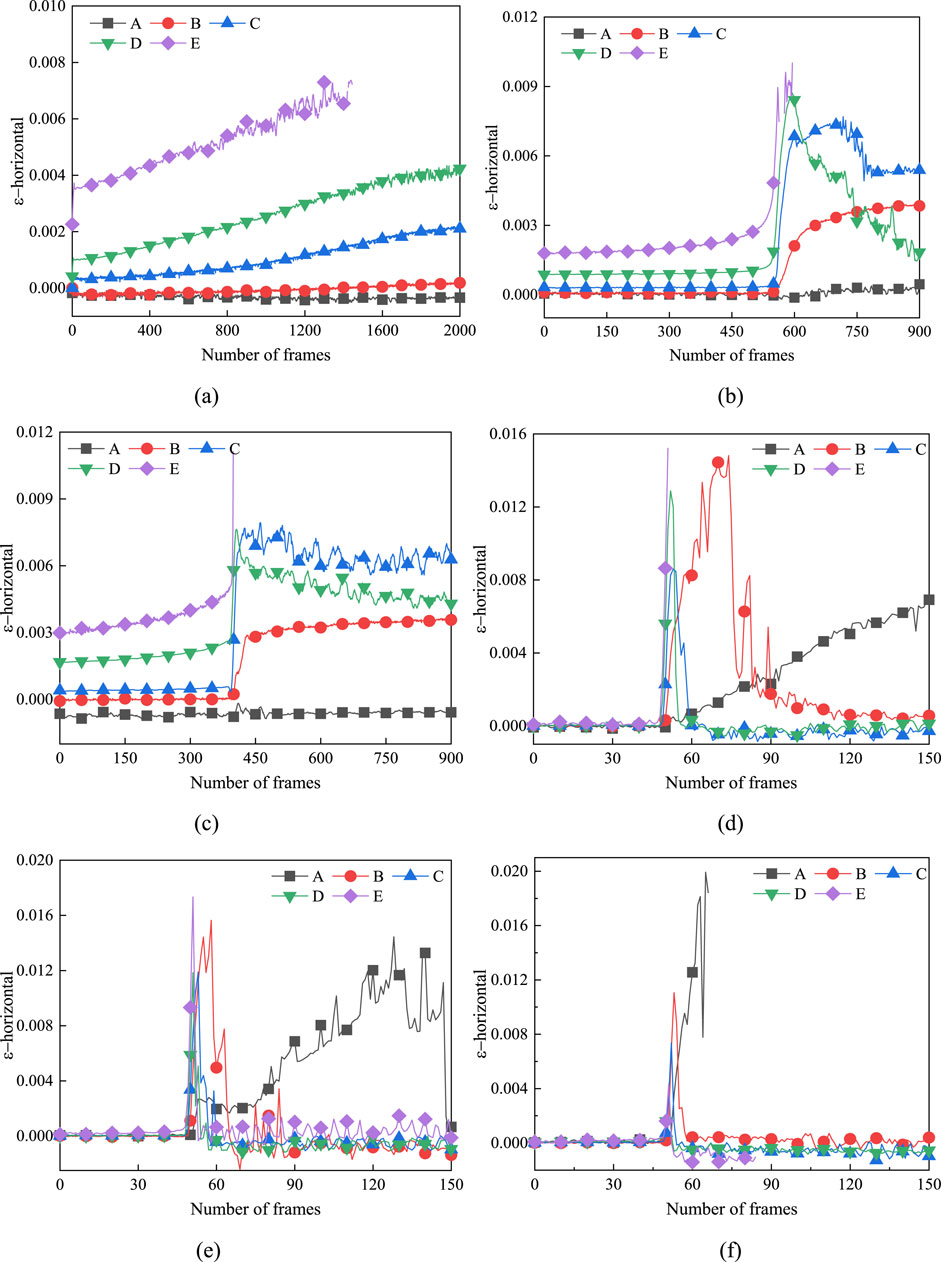
Figure 15. Strain gauge recording data: (A) AS-0.05; (B) AS-0.15; (C) AS-5.0; (D) SS-0.05; (E) SS-0.15; (F) SS-5.0. AS= argillaceous sandstone; SS= siliceous sandstone; AS-0.05 denotes the experimental results for the AS specimen tested at a loading rate of 0.05 mm/min.
Figure 15 illustrates that the horizontal strain slope at midline points of AS and SS increases as they approach the lower tensile zone, particularly at higher loading rates. Under bending loads, high-strain zones initially appear in the lower central part of the samples, releasing stored elastic energy as cracks propagate upward. Consequently, both AS and SS exhibit higher strain rates in the lower section under varying loading rates. For AS, the midline exhibits a pattern of E > D > C > B > A, indicating higher strain nearer the lower tensile zone. SS shows a similar pattern at loading rates below 5 mm/min; however, at higher rates, the pattern reverses (E < D < C < B < A), reflecting lower strain in the lower tensile zone due to rapid fracture rates. The rapid fracture rate of SS at higher loading rates results in crack penetration within 12 frames, limiting pre-failure deformation and explaining the lower strain in the lower tensile zone. AS’s ductility prevents this reversal even at loading rates up to 15 mm/min. Surface crack area increases with loading rate for both AS and SS, with AS exhibiting a decelerated increase due to differing fracture modes, while SS shows a continuously rising trend due to higher energy release at higher loading rates and faster-moving fracture fragments.
4 Discussion
The results and analysis presented reveal that the rock cement and loading rate play a significant role in the tensile fracture strength, energy release, and failure modes of rocks. Previous studies have shown that the rock cement can influence the failure characteristics of rock masses (Sergio et al., 2023; Shkuratnik et al., 2014). It can be found that the Acoustic Emission (AE) evolution law exhibits a clear correlation with the fracture stages and strength characteristics of rocks. This finding contributes to analyze the effects of rock property and mining speed on the tensile fracture of overlying rock layer in coal mines. Furthermore, this study demonstrates that the multifractal theory is an effective approach for identifying the micro-fracture characteristics of rocks. The real-time monitoring data, such as the amplitude, energy, event counts of AE, can be utilized to approximate the type and failure velocity of overlying rock layers. The stress level and fracture behavior of the overlying strata could be assessed, facilitating real-time adjustments to mining parameters. In comparison to argillaceous sandstone (AS), siliceous sandstone (SS) displayed more rapid and penetrative crack propagation, accompanied by a sharper elastic energy release and a higher disaster risk. Future research should be conducted to explore the variations of energy release associated with the rock type and mining speed under coal mining.
5 Conclusion
This study analyzes the influence of rock mineral composition and loading rate on the tensile fracture characteristics through the examination of Acoustic Emission (AE) signals and Digital Image Correlation (DIC) images. The main conclusions are as follows:
The tensile fracture of sandstone under three-point bending is categorized into the tension and elastic stage, the plastic failure stage, and the residual stage. The argillaceous rock shows a lower fracture strength than the siliceous rock. The tensile fracture of the argillaceous sandstone obviously displays the ductile characteristics. The tensile cracks of the siliceous sandstone rapidly propagate and through the specimen under varying loading rates, while no penetrating cracks are observed in the argillaceous rock.
The multifractal parameter Δα increases and fluctuates with the loading rate in both types of sandstone during Stages I and II. The argillaceous rock exhibits more distinct multifractal characteristics of AE signals. With an increase in loading rate, the proportion of tensile-shear mixed microcracks and large-scale shear microcracks increase, and small-scale tensile microcracks decrease.
The macroscopic crack propagation rate is slower in the argillaceous rock than that of the siliceous rock. The horizontal strain at the bottom center shows higher slope and peak values compared to the top. The peak strains in the bottom and top remain consistent at the loading rates below 5 mm/min, while the strain in the bottom is less than in the top at the loading rates above 5 mm/min.
Data availability statement
The original contributions presented in the study are included in the article/supplementary material, further inquiries can be directed to the corresponding author.
Author contributions
XZ: Writing–original draft. JS: Writing–original draft. YC: Writing–review and editing. CuW: Writing–review and editing. ChW: Writing–review and editing. WR: Writing–review and editing. BM: Methodology, Writing–original draft, Writing–review and editing.
Funding
The author(s) declare that financial support was received for the research, authorship, and/or publication of this article. This work is supported by the Taishan Industrial Experts Program (No. TSCX202408130), the Shandong Energy Group (No. SNKJ2022A01-R26), and the Open Fund of State Key Laboratory for Fine Exploration and Intelligent Development of Coal Resources (No. SKLCRSM21KFA01).
Conflict of interest
Authors XZ, YC, CuW, and ChW were employed by Shandong Energy Group Co., Ltd. Author ChW was employed by Yanzhou Coal Industry Co. Author WR was employed by Shandong Energy Group Luxi Mining Co.
The remaining authors declare that the research was conducted in the absence of any commercial or financial relationships that could be construed as a potential conflict of interest.
Publisher’s note
All claims expressed in this article are solely those of the authors and do not necessarily represent those of their affiliated organizations, or those of the publisher, the editors and the reviewers. Any product that may be evaluated in this article, or claim that may be made by its manufacturer, is not guaranteed or endorsed by the publisher.
References
Cai, J. J., Li, X. J., Guo, L. X., Xue, H. T., and Xu, B. Z. (2022). Fracture development and multifield coupling evolution law of soft overburden rock in a medium-thick coal seam mine. Geofluids 2022, 1–14. doi:10.1155/2022/6371887
Chen, B. P., Gong, B., Wang, S. Y., and Tang, C. A. (2022). Research on zonal disintegration characteristics and failure mechanisms of deep tunnel in jointed rock mass with strength reduction method. Mathematics-Basel 10, 922. doi:10.3390/math10060922
Cheng, Z. B., Pan, W. D., Li, X. Y., and Sun, W. B. (2019). Numerical simulation on strata behaviours of TCCWF influenced by coal-rock combined body. Geomech. Eng. 19, 269–282. doi:10.12989/gae.2019.19.3.255
Cui, J. F., Wang, W. J., and Yuan, C. (2022). Application of stability analysis in surrounding rock control and support model of deep roadway. Int. J. Oil Gas. Coal T 29, 1–192. doi:10.1504/ijogct.2021.10041466
Du, K., Sun, Y., Zhou, J., Khandelwal, M., and Gong, F. Q. (2022). Mineral composition and grain size effects on the fracture and acoustic emission (AE) characteristics of rocks under compressive and tensile stress. Rock Mech. Rock Eng. 55, 6445–6474. doi:10.1007/s00603-022-02980-y
Feng, X. H., Gong, B., Liang, Z. Z., Wang, S. Y., Tang, C. A., Li, H., et al. (2023). Study of the dynamic failure characteristics of anisotropic shales under impact Brazilian splitting. Rock Mech. Rock Eng. 57, 2213–2230. doi:10.1007/s00603-023-03673-w
Gao, F. Q., and Kang, H. P. (2017). Grain-based discrete-element modeling study on the effects of cementation on the mechanical behavior of low-porosity brittle rocks. Int. J. Geomech. 17, 04017061. doi:10.1061/(asce)gm.1943-5622.0000957
Gao, M. Z., Xie, J., Gao, Y. A., Wang, W. Y., Li, C., Yang, B. G., et al. (2021). Mechanical behavior of coal under different mining rates: a case study from laboratory experiments to field testing. Int. J. Min. Sci. Techno 31, 825–841. doi:10.1016/j.ijmst.2021.06.007
Ghanbarian, B., Perfect, E., and Liu, H. H. (2019). A Geometrical aperture-width relationship for rock fractures. Fractals 27, 1940002. doi:10.1142/s0218348x19400024
Gong, B., Zhao, T., Thusyanthan, I., and Tang, C. A. (2024). Modelling rock fracturing by a novel implicit continuous to discontinuous method. Comput. Geotech. 166, 106035. doi:10.1016/j.compgeo.2023.106035
Guo, Y., Lu, C. P., He, Z. L., and Song, J. F. (2022). Numerical and field investigations of tremors induced by thick-hard strata fracture. Appl. Sci. 12, 11151. doi:10.3390/app122111151
Hu, S. B., Wang, E. Y., Li, Z. H., Shen, R. X., and Liu, J. (2014). Time-varying multifractal characteristics and formation mechanism of loaded coal electromagnetic radiation. Rock Mech. Rock Eng. 47, 1821–1838. doi:10.1007/s00603-013-0501-9
Kong, B., Wang, E. Y., Li, Z. H., Wang, X. R., Niu, Y., and Kong, X. G. (2017). Acoustic emission signals frequency-amplitude characteristics of sandstone after thermal treated under uniaxial compression. J. Appl. Geophys 136, 190–197. doi:10.1016/j.jappgeo.2016.11.008
Lei, R. D., Tan, Y. L., Berto, F., Hu, C., and Qi, X. (2023). Temporal-frequency distribution and multi-fractal characterization of acoustic emission of rock materials containing two parallel pre-existing flaws. Fatigue Fract. Eng. M. 46, 2139–2155. doi:10.1111/ffe.13988
Li, H. R., Qiao, Y. F., Shen, R. X., and He, M. C. (2022a). Electromagnetic radiation signal monitoring and multi-fractal analysis during uniaxial compression of water-bearing sandstone. Measurement 196, 111245. doi:10.1016/j.measurement.2022.111245
Li, H. T., Qi, Q. X., Du, W. S., and Li, X. P. (2022b). A criterion of rockburst in coal mines considering the influence of working face mining velocity. Geomech. Geophys Geo 8, 37. doi:10.1007/s40948-021-00338-2
Li, T., Li, K. X., Pi, X. Y., and Fang, C. (2018a). Time-dependent behavior of acoustic emission feature parameters of sandstone under bending load. J. China Coal Soc. 43, 3115–3121. doi:10.13225/j.cnki.jccs.2018.0055
Li, X. L., Li, Z. H., Wang, E. Y., Liang, Y. P., Li, B. L., Chen, P., et al. (2018b). Pattern recognition of mine microseismic and blasting events based on wave fractal features. Fractals 26, 1850029. doi:10.1142/s0218348x18500299
Liang, Z. Z., Xue, R. X., Xu, N. W., and Li, W. R. (2020). Characterizing rockbursts and analysis on frequency-spectrum evolutionary law of rockburst precursor based on microseismic monitoring. Tunn. Undergr. Sp. Tech. 105 105, 103564. doi:10.1016/j.tust.2020.103564
Lin, Q., Wan, B., Wang, Y., Lu, Y. H., and Labuz, J. F. (2019). Unifying acoustic emission and digital imaging observations of quasi-brittle fracture. Theor. Appl. Fract. Mec. 103, 102301. doi:10.1016/j.tafmec.2019.102301
Ma, B. W., Xie, H. P., Zhou, C. T., Zhou, H. W., Gao, F., Cao, P. W., et al. (2024). Experimental investigation into influence of surrounding rock on strainburst: insight from failure process and energy partition. Int. J. Rock Mech. Min. Sci. 175, 105685. doi:10.1016/j.ijrmms.2024.105685
Mahdi, A., Ali, S., Alain, R., and Patrick, M. (2022). Rockburst in underground excavations: a review of mechanism, classification, and prediction methods. Undergr. Space 36, 255–270. doi:10.1016/j.undsp.2021.11.008
Mao, H. Y., Zhang, M., Jiang, R. C., Li, B., Xu, J., and Xu, N. W. (2020). Study on deformation pre-warning of rock slopes based on multi-fractal characteristics of microseismic signals. Chin. J Rock Mech Eng 39, 560–571. doi:10.13722/j.cnki.jrme.2019.1021
Miao, B., Wang, X. Y., and Li, H. R. (2022). Quantitative analysis of infrared thermal images in rock fractures based on multi-fractal theory. Sustainability-Basel 14, 6543. doi:10.3390/su14116543
Niu, Y., Li, Z. H., Wang, E. Y., Gao, F., Wang, F. C., Zhang, Z. Z., et al. (2022). An experimental study on precursor identification for gas-bearing coal failure from electric potential responses in the loading process. Measurement 196, 111229. doi:10.1016/j.measurement.2022.111229
Niu, Y., Zhou, X. P., and Berto, F. (2020). Evaluation of fracture mode classification in flawed red sandstone under uniaxial compression. Theor. Appl. Fract. Mec. 107, 102528. doi:10.1016/j.tafmec.2020.102528
Ou, J. C., Wang, E. Y., and Wang, X. Y. (2023). Time-frequency response of acoustic emission and its multi-fractal analysis for rocks with different brittleness under uniaxial compression. Mathematics-Basel 11, 4746. doi:10.3390/math11234746
Prikryl, R., Lokajicek, T., Li, C., and Rudajev, V. (2003). Acoustic emission characteristics and failure of uniaxially stressed granitic rocks: the effect of rock fabric. Rock Mech. Rock Eng. 36, 255–270. doi:10.1007/s00603-003-0051-7
Qiu, J. D., Zhou, C. T., Wang, Z. H., and Feng, F. (2023). Dynamic responses and failure behavior of jointed rock masses considering pre-existing joints using a hybrid BPM-DFN approach. Comput. Geotech. 155, 105237. doi:10.1016/j.compgeo.2022.105237
Rakesh, K., Arvind, K., Ashok, K., Arun, K., Sahendra, R., Amit, K., et al. (2022). Importance of fracturing hard and massive overlying strata for complete extraction of thick coal seam – case studies. J. Geol. Soc. India 98, 203–210. doi:10.1007/s12594-022-1960-y
Sergio, C., Annalisa, G., Alessandro, P., Andrea, R., and Constantino, T. (2023). Acoustic emissions in rock deformation and failure: new insights from Q-statistical analysis. Entropy 25, 701. doi:10.3390/e25040701
Shkuratnik, V. L., Novikov, E. A., and Oshkin, R. O. (2014). Experimental analysis of thermally stimulated acoustic emission in various-genotype rock specimens under uniaxial compression. J. Min. Sci. 50, 249–255. doi:10.1134/s1062739114020069
Sun, Y. J., Zuo, J. P., Karakus, M., and Wang, J. T. (2019). Investigation of movement and damage of integral overburden during shallow coal seam mining. J. Rock Mech. Min. Sci. 117, 63–75. doi:10.1016/j.ijrmms.2019.03.019
Sun, Y. J., Zuo, J. P., Karakus, M., and Wen, J. H. (2020). A novel method for predicting movement and damage of overburden caused by shallow coal mining. Rock Mech. Rock Eng. 53, 1545–1563. doi:10.1007/s00603-019-01988-1
Wang, Z. K., Li, W. P., Wang, Q. Q., Hu, Y. B., and Du, J. F. (2021). Monitoring the dynamic response of the overlying rock-soil composite structure to underground mining using BOTDR and FBG sensing technologies. Rock Mech. Rock Eng. 54, 5095–5116. doi:10.1007/s00603-021-02530-y
Wei, M. D., Dai, F., Liu, Y., Li, A., and Yan, Z. L. (2021). Influences of loading method and notch type on rock fracture toughness measurements: from the perspectives of T-stress and fracture process zone. Rock Mech. Rock Eng. 54, 4965–4986. doi:10.1007/s00603-021-02541-9
Xie, H. P., Zhang, R., Zhang, Z. T., Gao, M. Z., Li, C. B., He, Z. Q., et al. (2023). Reflections and explorations on deep earth science and deep earth engineering technology. J. China Coal Soc. 48, 3959–3978. doi:10.13225/j.cnki.jccs.2023.0989
Yang, H. Q., Han, C. L., Zhang, N., Sun, C. L., Pan, D. J., and Dong, M. H. (2019). Stability control of a goaf-side roadway under the mining disturbance of an adjacent coal working face in an underground mine. Sustainability-Basel 11, 6398. doi:10.3390/su11226398
Yin, X. H., Zhou, T., Zhou, C. T., Xie, H. P., and Zhu, J. B. (2023). Rate- and normal stress-dependent mechanical behavior of rock under direct shear loading based on a bonded-particle model (BPM). Rock Mech. Rock Eng. 56, 7959–7979. doi:10.1007/s00603-023-03486-x
Zhang, H., Fu, D. H., Song, H. P., Kang, Y. L., Huang, G. Y., Qi, G., et al. (2015). Damage and fracture investigation of three-point bending notched sandstone beams by DIC and AE techniques. Rock Mech. Rock Eng. 48, 1297–1303. doi:10.1007/s00603-014-0635-4
Zhang, N. B., Shan, R. L., Zhao, S. K., Sun, Z. X., Dong, Y. J., and Wang, Y. (2020). Investigation on cracking features of different rock under the bending load. J. China Coal Soc. 45, 671–681. doi:10.13225/j.cnki.jccs.2020.0580
Zhang, X., Li, Z. H., Wang, X. R., Wang, H., Li, B. L., and Niu, Y. (2022). Thermal effect on the fracture behavior of granite using acoustic emission and digital image correlation: an experimental investigation. Theor. Appl. Fract. Mec. 121, 103540. doi:10.1016/j.tafmec.2022.103540
Zhang, Z. H., and Deng, J. H. (2020). A new method for determining the crack classification criterion in acoustic emission parameter analysis. J. Rock Mech. Min. Sci. 130, 104323. doi:10.1016/j.ijrmms.2020.104323
Zhao, K., Ma, H. L., Yang, C. H., and Daemen, J. J. K. (2022). The role of prior creep duration on the acoustic emission characteristics of rock salt under cyclic loading. J. Rock Mech. Min. Sci. 157, 105166. doi:10.1016/j.ijrmms.2022.105166
Zhao, S. K., Sui, Q. R., Cao, C., Wang, X. C., Wang, C. L., Zhao, D. M., et al. (2021). Mechanical model of lateral fracture for the overlying hard rock strata along coal mine goaf. Geomech. Eng. 27, 75–85. doi:10.12989/gae.2021.27.1.077
Zhou, C. T., Xie, H. P., Zhu, J. B., Wang, Z. H., Li, C. B., and Wang, F. (2022). Mechanical and fracture behaviors of brittle material with a circular inclusion: insight from infilling composition. Rock Mech. Rock Eng. 55, 3331–3352. doi:10.1007/s00603-022-02799-7
Zhu, C. L., Zhang, J. X., He, Z. W., Wang, Y. Y., and Lan, Y. W. (2022). Effect mechanism of strata breakage evolution on stope deformation in extra-thick coal seams. Alex Eng. J. 61, 5003–5020. doi:10.1016/j.aej.2021.10.040
Zhu, J. B., Kong, J., Huang, Z. T., Sun, J. X., Lv, A. L., Zhang, K., et al. (2024). Experimental investigation of dynamic response of liquid-filled rock joints with horizontal inclination under stress wave loading. J. China Coal Soc. 49, 1873–1881. doi:10.13225/j.cnki.jccs.2023.1525
Zhu, J. B., Ma, B. W., Xie, H. P., Gao, F., Zhou, H. W., Zhou, C. T., et al. (2022). Differences and connections between mining seismicity and coal bursts in coal mines and preliminary study on coal bursts induced by mining seismicity. J. China Coal Soc. 47, 3396–3409. doi:10.13225/j.cnki.jccs.2021.1714
Keywords: overlying roof strata, tensile fracture, acoustic emission monitoring, fracture characteristics, multiple fractals
Citation: Zhang X, Sun J, Chen Y, Wang C, Wang C, Ren W and Ma B (2024) Experimental study on the effects of rock mineral composition and loading rates on the acoustic emission and fracture characteristics in roof strata tensile fracture. Front. Earth Sci. 12:1476891. doi: 10.3389/feart.2024.1476891
Received: 06 August 2024; Accepted: 25 November 2024;
Published: 20 December 2024.
Edited by:
Jeroen van Hunen, Durham University, United KingdomReviewed by:
Bin Gong, Brunel University London, United KingdomChangtai Zhou, City University of Hong Kong, Hong Kong SAR, China
Copyright © 2024 Zhang, Sun, Chen, Wang, Wang, Ren and Ma. This is an open-access article distributed under the terms of the Creative Commons Attribution License (CC BY). The use, distribution or reproduction in other forums is permitted, provided the original author(s) and the copyright owner(s) are credited and that the original publication in this journal is cited, in accordance with accepted academic practice. No use, distribution or reproduction is permitted which does not comply with these terms.
*Correspondence: Binwen Ma, Qmlud2VuLm1hQG91dGxvb2suY29t
 Xiufeng Zhang1
 Binwen Ma