
95% of researchers rate our articles as excellent or good
Learn more about the work of our research integrity team to safeguard the quality of each article we publish.
Find out more
ORIGINAL RESEARCH article
Front. Earth Sci. , 14 October 2024
Sec. Georeservoirs
Volume 12 - 2024 | https://doi.org/10.3389/feart.2024.1475316
Significant progress has recently been made in deep and ultra-deep oil and gas exploration globally, demonstrating enormous exploration potential of the deep and ultra-deep strata. However, the accumulation and preservation pattern of deep and ultra-deep oil and gas remains poorly understood, greatly impeding further petroleum exploration and development in the deep and ultra-deep strata. By taking the Bozi deep and ultra-deep condensate gas reservoirs in the Kuqa Depression, western China as an example, we attempt to reconstruct the hydrocarbon charge history in such deep reservoirs via an integrated investigation involving quantitative grain fluorescence, fluid inclusion petrography and microthermometry, micro-fluorescence spectroscopy, laser Raman spectroscopy, PVTx modelling, and basin modelling. The results show that: (1) The Bozi deep and ultra-deep reservoirs contain one group of gas inclusion assemblage, and two groups of oil inclusion assemblages, with one being characterized by near yellowish-whitish and blue-whitish diphasic or triphasic oil inclusions, and the other being featured by bright blue diphasic oil inclusions; (2) The first oil charge occurred during the Early Neogene (6.5–5.5 Ma), and the second oil charge occurred during the Late Neogene (4.4–3.5 Ma), under normal hydrostatic pressure or slightly weak overpressure; and (3) The gas charge occurred during the Pleistocene (∼1.6 Ma), with a corresponding reservoir pressure coefficient of approximately 1.7, transforming the reservoir fluid phase state from black oil or volatile oil to condensate gas. Our findings highlight that aside from the present burial depth, a favorable burial history model is crucial for the preservation of liquid hydrocarbons in deep and ultra-deep reservoirs. The occurrence of liquid hydrocarbons in the Bozi deep and ultra-deep condensate gas reservoirs with depths over 7,000 m is benefited from a prolonged period (>100 Ma) of shallow burial and a late-stage (since 10 Ma) rapid subsidence.
Deep strata commonly refer to the strata with a burial depth of 4,500–6,000 m, while the strata with a depth exceeding 6,000 m are defined as ultra-deep strata (Dyman et al., 2002; Dutton and Loucks, 2010). Significant progress has been made in global deep and ultra-deep oil and gas exploration in recent years. For example, condensate gas pools were discovered in the subsea Jurassic sandstone reservoirs of the Elgin and Franklin oil fields at depths of 5,100–5,600 m in the North Sea Basin (Lasocki et al., 1999). Light oil was discovered in the Ordovician carbonate reservoirs with depths of more than 7,000 m in the Shunbei Oilfield of the Shuntuoguole Low Uplift in the Tarim Basin (Yang et al., 2021). The Luntan-1 well in the Tarim Basin recovered light oil from the Lower Cambrian Wusonggeer Formation dolomite reservoirs with a depth of 8,203–8,260 m (Yang et al., 2020). These discoveries show that the deep and ultra-deep strata have significant exploration potential and that hydrocarbons can be well preserved under high temperature and high pressure (HTHP) conditions.
The Kelasu Thrust Belt is located in the northern part of the Kuqa Depression in the Tarim Basin, with an exploration area of 5,500 km2 (Jia et al., 2000). It is characterized by thick Triassic and Jurassic mudstone source rocks, excellent Cretaceous sandstone reservoir rocks, and Paleogene gypsum salt cap rocks, forming a complete “source-reservoir-cap” assemblage (Zhu et al., 2015). Since the breakthrough of the Keshen-2 well in the eastern part of the Kelasu Thrust Belt in 2008, a series of large gas fields, such as the Keshen, Dabei and Bozi accumulations, have been discovered through a decade-long exploration (Zou et al., 2006; Zhang et al., 2011). The discovery of the Bozi-9 (BZ9) well in 2020 marks the birth of another ultra-deep and large-scale condensate gas reservoir in the Kelasu Thrust Belt (Tian et al., 2020). The high-yield gas flow obtained from the BZ9 well also confirms the enormous exploration potential of the ultra-deep domain in the Kelasu Thrust Belt. To date, tremendous efforts have been made to understand the tectonic evolution (Wang et al., 2024b), fracture characterization and stress analysis (Xu et al., 2022; Tang et al., 2024), diagenetic history and reservoir quality (Zeng et al., 2020; Lai et al., 2023) of the Bozi deep and ultra-deep condensate gas reservoirs. However, considering the complicated petroleum geology conditions in the deep and ultra-deep strata, including multiple sets of source rocks with high maturity (Zhang et al., 2011; Wang et al., 2024a), and multi-episodic tectonism (Zhu et al., 2015; Wang et al., 2024b), the charge and preservation pattern of oil and gas accumulations in the Bozi deep and ultra-deep condensate gas reservoirs remains poorly understood (Tian et al., 2020). This greatly impedes further petroleum exploration and development in this area.
Hydrocarbon-bearing fluid inclusions are small aliquots of hydrocarbons entrapped in rock-forming minerals, such as quartz, feldspar, and calcite (Goldstein and Reynolds, 1994; Munz, 2001), and record the essential information on the temperature, pressure and compositions of hydrocarbons emplaced in reservoirs or during the entrapment of fluid inclusions (Aplin et al., 2000; Thiéry et al., 2000) and the timing of hydrocarbon migration and accumulation (Karlsen et al., 1993; Bhullar et al., 1999). Detailed hydrocarbon-bearing fluid inclusion analysis could contribute to reveal the unknown of charge and preservation pattern of oil and gas accumulations in deep and ultra-deep strata (Volk and George, 2019). In this study, the hydrocarbon charge history of the Bozi condensate gas reservoirs was investigated through basin modelling in combination with a suite of analyses including quantitative grain fluorescence (QGF) and QGF on extracts (QGF-E), and fluid inclusion petrography and microthermometry, micro-fluorescence spectroscopy, laser Raman spectroscopy, and PVTx modelling. The aims of this study are to (1) delineate the timing of hydrocarbon charge events, (2) reconstruct the hydrocarbon charge history of the Bozi condensate gas reservoirs, and (3) elucidate the pattern of oil and gas preservation in the deep and ultra-deep clastic reservoirs.
The Kuqa Depression is a Mesozoic to Cenozoic foreland depression situated in the northern margin of the Tarim Basin, with an estimated area of approximately 3.7 × 10⁴ km2 (Figure 1A), and is one of the deepest and most significant petroleum exploration areas in China (Jia et al., 2000). It has experienced three stages of tectonic movement: a peripheral foreland basin stage (Late Permian to Middle Triassic), an extensional rift basin stage (Late Triassic to Middle Jurassic) and a rejuvenated foreland basin stage (since the Neogene) (Graham et al., 1993; Jia et al., 2000). Since the Miocene, the Kuqa Depression has formed a series of large-scale thrust fold belts from north to south and fault-related folds under strong compression. It can be divided into three thrust belts (Kelasu, Yiqikelike, and Qiulitage), three sags (Wushi, Baicheng, and Yangxia), one monocline belt (northern), and one slope belt (southern) (Liang et al., 2003; Zhu et al., 2015). The dominant source rocks in the Kuqa Depression consist of the Triassic-Jurassic coal bearing formations, including the Upper Triassic Huangshanjie (T3h) and Taliqike (T3t) formations, the Lower Jurassic Yangxia Formation (J1y), and the Middle Jurassic Kezilenuer (J2k) and Qiakemake (J2q) formations (Wang et al., 2024a). The Paleogene Kumugeliemu Group (E1-2km) and Suweiyi Formation, and the Neogene Jidike Formation thick-layer gypsum salt rock (Figure 2), gypsum mudstone, and mudstone act as the regional cap rocks in the Kuqa depression. The reservoirs are mainly developed in the Jurassic, Cretaceous, Paleogene, and Neogene clastic strata.
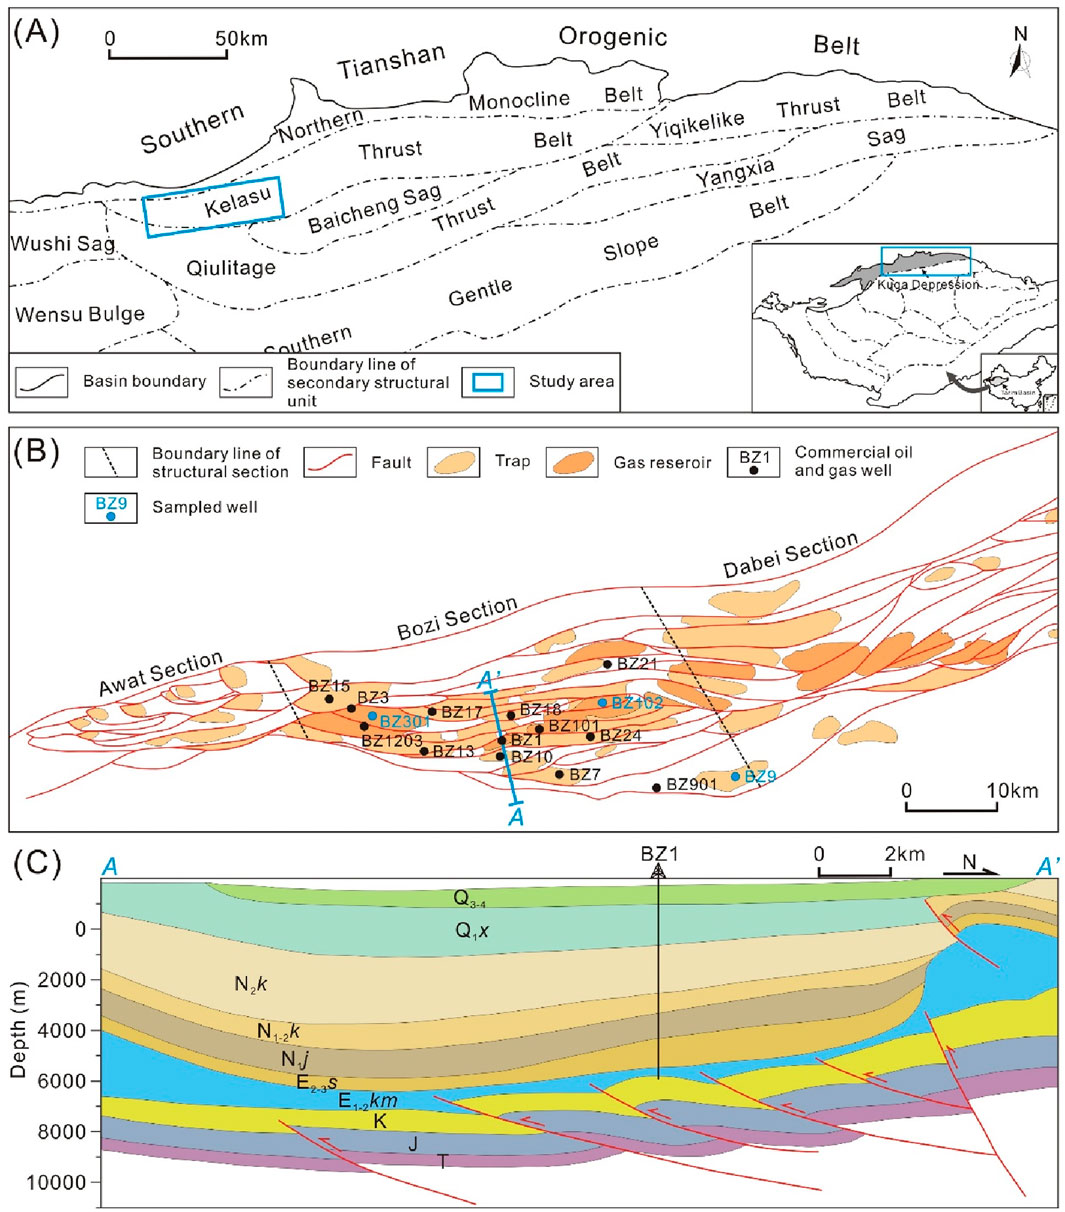
Figure 1. (A) Structural unit division of the Kuqa Depression in the Tarim Basin and location of the study area. Inset shows the geographic location of the Tarim Basin, west China. (B) Regional map of the Bozi area showing hydrocarbon distribution in the Bozi sandstone reservoirs (modified form Jiang et al., 2024) and sampled wells for QGF, QGF-E, fluid inclusion, and basin modelling analyses. The blue solid line AA’ shows the location of the cross-section profile presented in (C). (C) Stratigraphic and structural cross section along AA’, showing the “source - reservoir-cap rock” assemblage in the Bozi area (modified from Zhu et al., 2015).
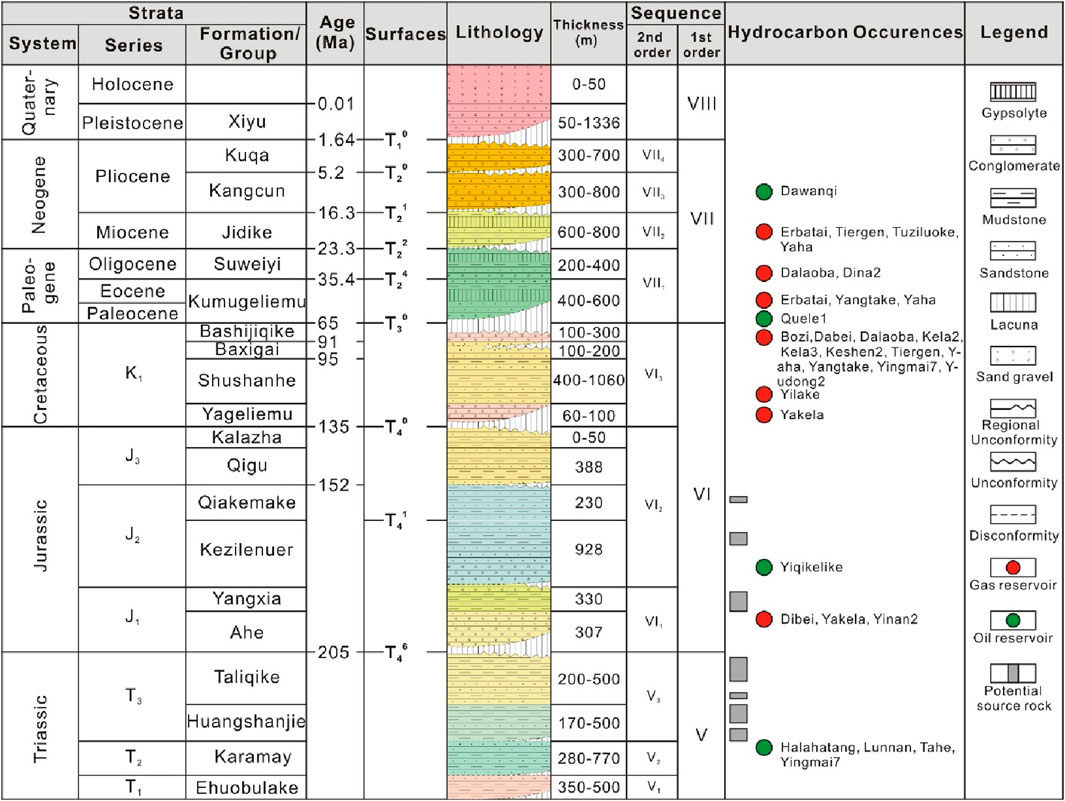
Figure 2. Generalized chart showing stratigraphic column, major unconformities, key seismic reflection surfaces (Txy), and petroleum system elements of the Kuche Depression (modified from Lin et al., 2012).
The Kelasu Thrust Belt is located in the northern part of the Kuqa Depression, with an exploration area of 5,500 km2 (Figure 1A), and is the first row of thrust belts adjacent to the Southern Tianshan Orogenic Belt (Jia et al., 2000). Based on the difference in its salt thickness and fault characteristics, the Kelasu Thrust Belt can be subdivided into five trap concentration zones from west to east, i.e., Awate, Bozi, Dabei, Keshen, and Kela sections (Zhu et al., 2015). The Bozi condensate gas field is located in the western part of the Kelasu Thrust Belt (Figure 1B). The Lower Cretaceous Bashijiqike (K1bs) and Baxigai (K1b) formations sandstone and the overlying Kumugeliemu Group (E1-2km) gypsum salt rock constitute a complete reservoir-cap assemblage (Figure 1C). Geochemical evidence shows that the oil in the Bozi area mainly originated from the source rocks of the Middle Jurassic Qiakemake Formation, and the natural gas was dominantly derived from the Jurassic coal or coaly shale (Zhang et al., 2011; Tian et al., 2020). In 2020, the newly discovered BZ9 condensate gas pool had a gas bearing area of 41 km2, with predicted geological reserves of 1,153 × 108 m3 of natural gas, and 2,166 × 104 t of condensate oil (Tian et al., 2020).
A total of 55 core samples in the Bashijiqike (K1bs) and Baixigai (K1b) formations were collected from the BZ9, Bozi-102 (BZ102) and Bozi-301 (BZ301) wells (Figure 1B), with burial depths ranging from 5,836.30 to 7,795.50 m.
Quantitative grain fluorescence (QGF) and quantitative grain fluorescence on extract (QGF-E) can realize the rapid delineation of palaeo-oil zones and current residual oil zones in petroleum reservoirs by detecting the fluorescence attributes of reservoir grains and their extracts after a robust pre-cleaning procedure (Liu and Eadington, 2005). For the purpose of QGF and QGF-E measurement, a Varian Cary-Eclipse fluorescence spectrophotometer from Agilent Technologies was used, which is fitted with a customized sampling stage that allows multiple aliquots to be analyzed automatically.
The core samples were prepared as doubly polished wafers with 80–100 μm in thickness for fluid inclusion analysis. Petrographic observation of fluid inclusions was conducted using a Zeiss Axio Imager A2m microscope. In order to avoid human interference in fluorescence color recognition, fluorescence spectral characteristics of oil inclusions (OIs) and crude oil samples were measured using a Horiba iHR320 imaging spectrometer by coupling with a Zeiss Axio Imager A2m microscope with a UV light source unit. Fluid inclusion microthermometry was conducted using a Linkam THMSG600 heating-freezing stage combined with the cycling technique proposed by Goldstein and Reynolds (1994). The measurement precision is ±1°C for the homogenization temperature (Th) and ±0.1°C for the final ice melting temperature (Tm), respectively. The heating-freezing stage was calibrated using synthetic CO2-H2O inclusion (Tm = −56.6°C) and pure H2O aqueous inclusion (Tm = 0°C) at low temperature. The NaCl-equivalent salinities of aqueous fluid inclusions were calculated based on an equation proposed by Bodnar (1993).
Vapor volume fractions (φvap) of oil inclusions at 20°C were measured using a Zeiss LSM 5 Pascal confocal laser scanning microscopy (CLSM) after three-dimensional volumetric reconstruction. The CLSM delivers a stack of focused, two-dimensional (x–y) fluorescence image slices down through the inclusion (z series). The bright fluorescence of oil within the inclusions with the excitation of 488 nm argon laser light (25 mW), can effectively distinguish it from non-fluorescent gas in the inclusion and the host mineral. Zeiss 3D for LSM image processing software was applied to assist construction of three-dimensional images and volume calculation of oil inclusions.
A LabRAM HR Evolution spectrometer (Horiba Jobin Yvon) equipped with 600 and 1800 g mm–1 grating was utilized to analyze the compositions of monophasic gas inclusions and diphasic aqueous fluid inclusions. The confocal aperture and slit aperture were set to 1,000 μm and 200 μm, respectively. The excitation wavelength was ∼532 nm (air-cooled, frequency doubled Nd:YAG) with an output power of 300 mW. Before each measurement, the spectrometer was calibrated with the 520.7 cm–1 Raman peak for silicon. During experiments, the Raman spectra were collected from 100 to 4,000 cm–1 for 20 s with 10 accumulations. Considering the dominance of CH4 in the vapor phase of the investigated fluid inclusions, the wavenumber of the stretching vibration band of CH4 was used to determine the internal pressure of both the monophasic gas inclusions and the vapor bubble of the diphasic aqueous fluid inclusions at room temperature (Lu et al., 2007) after calibration by simultaneously collected Neon lamp signal.
The trapping temperature (Tt) and pressure (Pt) of coexisting petroleum and aqueous inclusions were determined by the double isochore technique (Pironon, 2021). Following the procedure proposed by Aplin et al. (2000), petroleum inclusions were modelled using PVTsim (Calsep, Inc.) software based on the Soave-Redilich-Kwong equation with Peneloux volume correction (Péneloux et al., 1982). The present hydrocarbon compositions in the Tarim Basin were selected as the initial compositions for oil inclusion PVT modelling, which have not been affected by biodegradation, and an iterative analysis was adopted until the calculated vapor volume fraction of an inclusion is consistent with that measured from CLSM at 20°C (Aplin et al., 2000; Munz et al., 2004). The phase envelope and isochore of the petroleum inclusion were then reconstructed.
For monophasic gas inclusions, the Pt can be calculated by combining the internal pressure of the monophasic gas inclusion and the Tt (equal to the Th of coeval aqueous fluid inclusion in the case of heterogeneous trapping) and equation of state (EOS) for pure CH4 (Duan et al., 1992). For diphasic aqueous fluid inclusions, combined with the internal pressure of the vapor bubble of the diphasic aqueous fluid inclusions at room temperature, salinity and Th results and EOS for pure CH4 (Duan et al., 1992) and CH4–NaCl–H2O (Duan and Mao, 2006), the homogenization pressure can be calculated following an iterative approach proposed by Becker et al. (2010). Due to the tiny size of the aqueous fluid inclusions or low CH4 concentration in the aqueous fluid inclusions, however, the stretching vibration band of CH4 cannot be detected in most of the aqueous fluid inclusions investigated in the present study. In this case, we assumed the aqueous fluid inclusions as a NaCl-H2O system and reconstructed the corresponding isochores using the model proposed by Steele-MacInnis et al. (2012).
One dimensional (1D) basin modeling was applied to reconstruct the thermal and burial histories of the BZ9, BZ102 and BZ301 wells using PetroMod 1D software. The input parameters were mainly composed of stratigraphy, burial depth, thickness, lithology, age and erosion. The denudation thicknesses at different tectonic stages in the Bozi area were estimated based on Liu et al. (2018). The boundary conditions were paleo water depth (PWD), sediment water interface temperature (SWIT) and heat flow (HF). The paleo-heat flows were determined according to Lu et al. (2014) and Qiu et al. (2015). The thermal history was calibrated using the present-day measured formation (borehole) temperature data.
The QGF index values obtained at the depths of 7,676.05–7,795.50 m in the BZ9 well range from 3.7 to 11.6, while the QGF-E intensities range from 7.0 to 19.5 photometer counts, with spectral peaks in the range of 356–367 nm (Figure 3). The QGF index values obtained at the depths of 6,758.80–6,866.70 m in the BZ102 well span from 0.4 to 12.9, while the QGF-E intensities are in the range of 6.9–24.4 photometer counts with spectral peaks ranging between 357 and 370 nm (Figure 4). The QGF index values obtained at the depths of 5,836.30–5,930.90 m in the BZ301 well range from 3.4 to 12.3 (Figure 5), which are comparable with that for the BZ9 and BZ102 wells, while the QGF-E intensities fall in the range of 8.1–99.7 photometer counts, with spectral peaks occurring in the ranges of 368–383 nm and 451–460 nm, respectively.
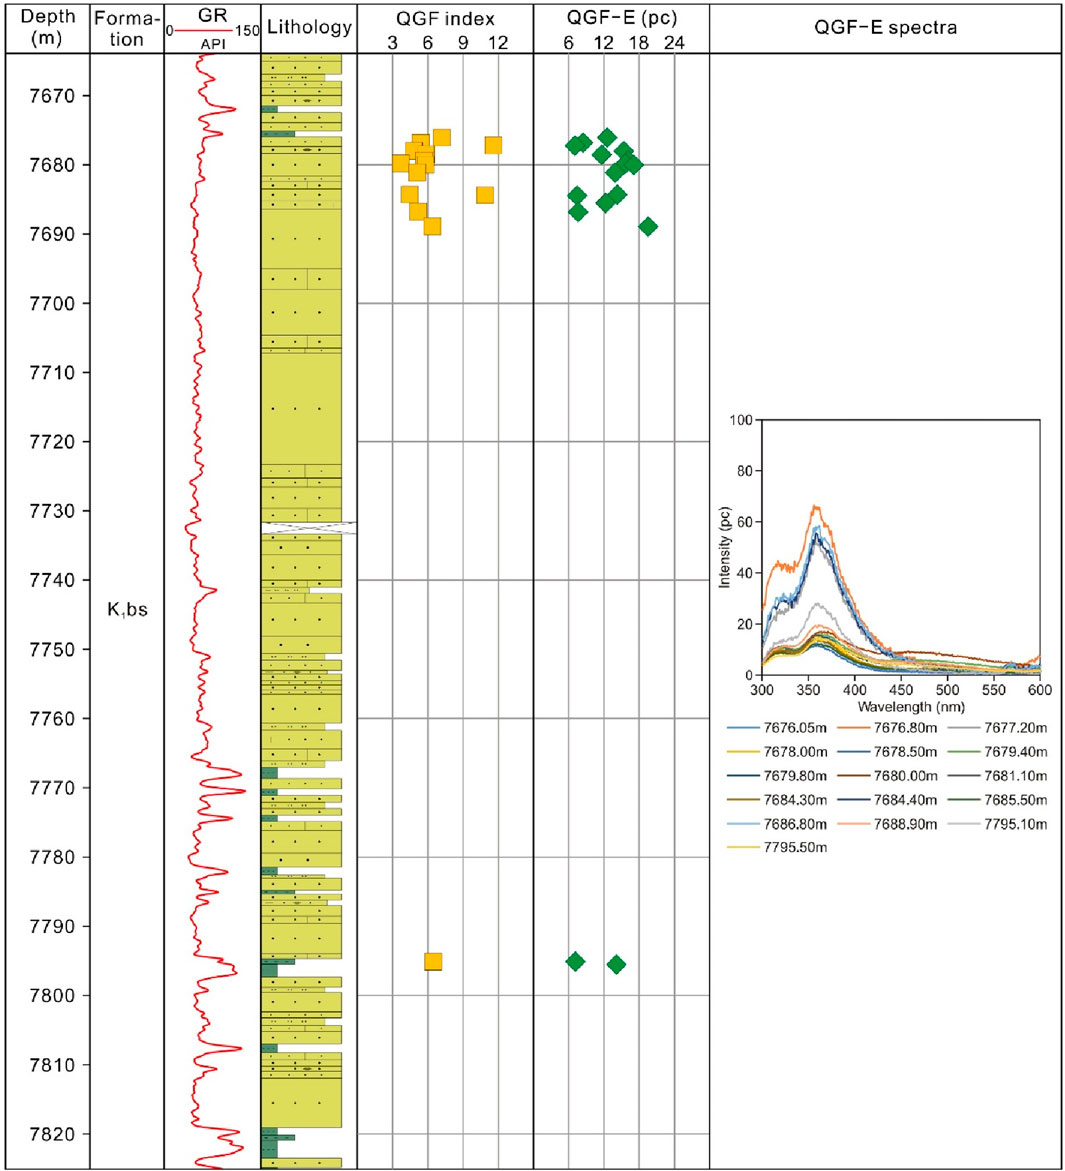
Figure 3. Quantitative fluorescence profile and spectra of K1bs reservoir sandstone samples from the BZ9 well, Kuqa Depression.
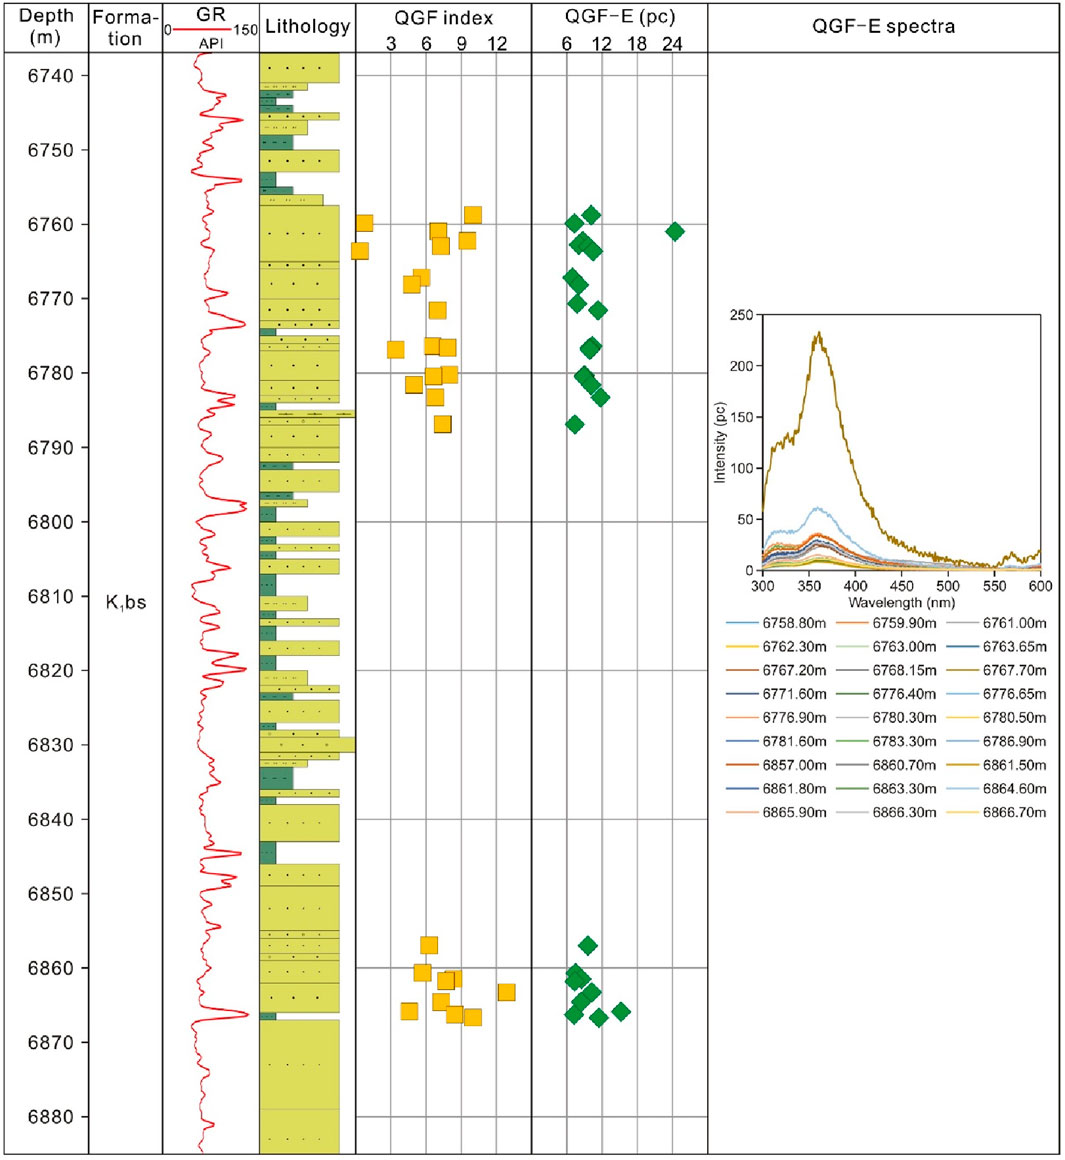
Figure 4. Quantitative fluorescence profile and spectra of K1bs reservoir sandstone samples from the BZ102 well, Kuqa Depression.
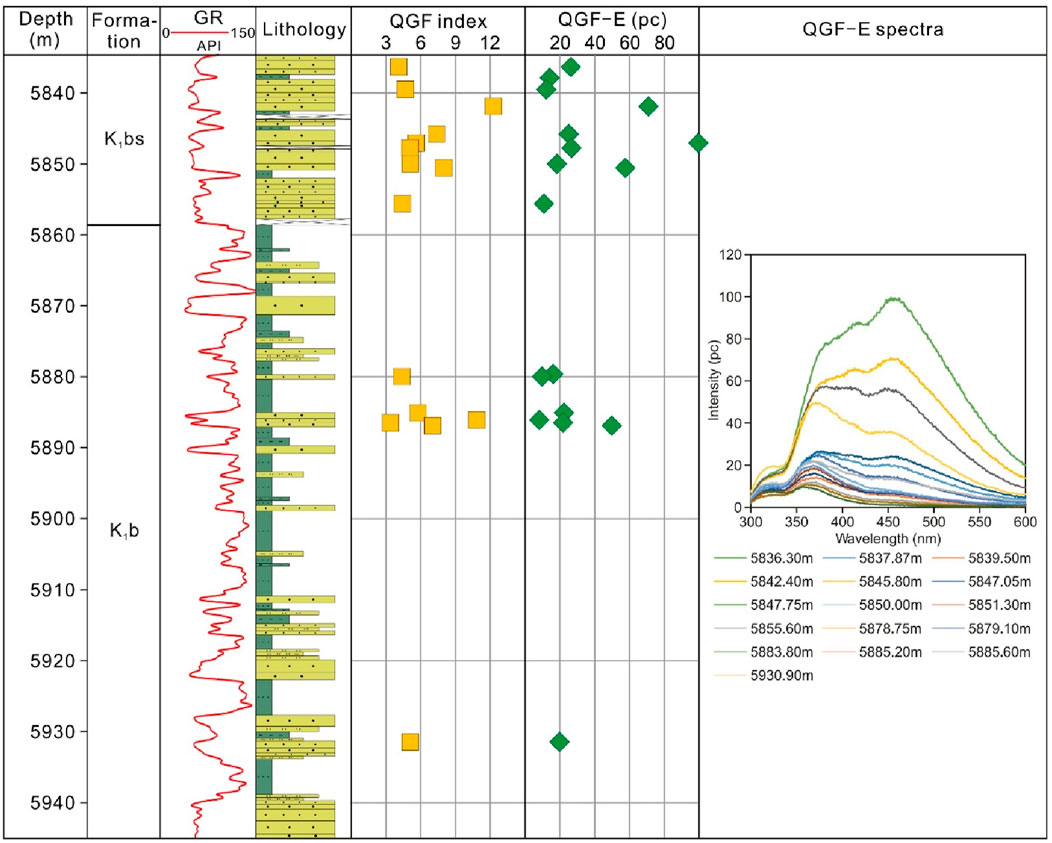
Figure 5. Quantitative fluorescence profile and spectra of K1bs and K1b reservoir sandstone samples from the BZ301 well, Kuqa Depression.
Oil inclusions assemblages (OIAs) in the three wells occur mainly in healed micro-fractures within detrital quartz grains (Figures 6A, B). They are commonly colorless or yellowish under plane-polarized light. Under the UV illumination they show near yellowish-whitish, blue-whitish and bright blue fluorescence colors (Figures 6C, D). OIAs are composed predominantly of diphasic (Loil-V) and triphasic (Sbit-Loil-V) oil inclusions with bitumen component occurring along inclusion walls. Oil inclusions primarily have elliptic, elongated or irregular shapes with diameters of 5–10 μm. Two groups of OIAs were recognized based on fluorescence color and bitumen content. The first group (Group I OIAs) are characterized by near yellowish-white and blue-white fluorescing, diphasic (Loil-V) or triphasic (Sbit-Loil-V) oil inclusions (Figures 6E, F), with vapor volume fractions (φvap) ranging from 2.3% to 7.5% (Figure 7). The second group (Group II OIAs) are typical of bright blue fluorescing, diphasic (Loil-V) oil inclusions (Figures 6G, H), with φvap in the range of 8.2%–11.6% (Figure 7).
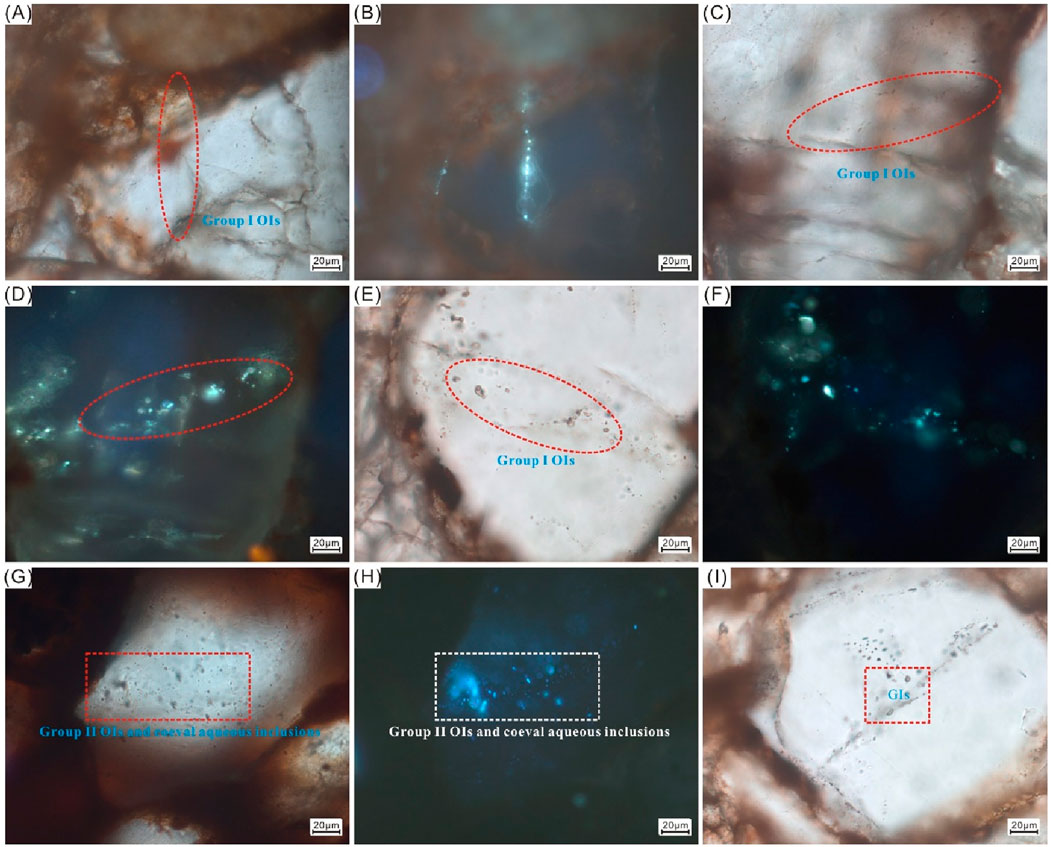
Figure 6. Paired photomicrographs of fluid inclusions under plain transmitted light and ultraviolet illumination from core samples in the Bozi sandstone reservoirs. (A, B) Near yellowish-whitish fluorescing Group I OIAs occurring along fracture trails, BZ9, K1bs, 7,677.20 m; (C–D) Near yellowish-whitish fluorescing Group I OIAs occurring along fracture trails, BZ102, K1bs, 6,861.50 m; (E–F) Near blue-whitish fluorescing, diphasic or triphasic Group I OIAs, BZ301, K1b, 5,884.80 m; (G–H) Near bright blue fluorescing, diphasic Group II OIAs, BZ102, K1bs, 6,770.70 m; (I) Monophasic gas inclusions occurring mainly in micro-fractures within detrital quartz grains, BZ301, K1b, 5,930.90 m.
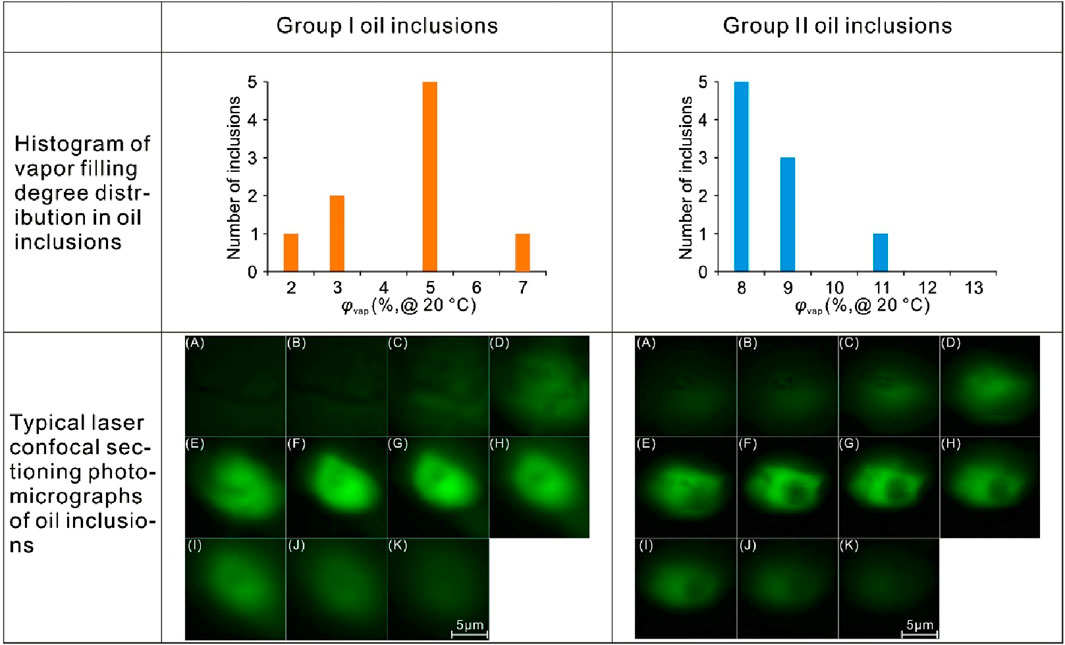
Figure 7. Vapor volume fraction (φvap) (20°C) and scanning confocal microscopic images of oil inclusions of different OIAs in the Bozi sandstone reservoirs.
Gas inclusion assemblages (GIAs) were also observed in some core samples, occurring mainly in micro-fractures within detrital quartz grains. The GIAs are composed of monophasic gas inclusions with the absence of bitumen component (Figure 6I). Gas inclusions have elongated or irregular shape with 3–5 μm length, and are commonly opaque to semitransparent under plane-polarized light. The gaseous components in the gas inclusions are composed of CH4 and subordinately CO2 (Figure 8), with a measured CH4 Raman spectra shift being approximately 2,910.31 cm–1.

Figure 8. Laser Raman spectra of typical gas inclusions in the Bozi sandstone reservoirs (BZ301, K1b, 5,930.90 m), showing the dominance of CH4 in the gas inclusions (A) and calibration by simultaneously collected Neon lamp signal (B).
The micro-fluorescence spectral characteristics of oil inclusions are shown in Figure 9 and Table 1. The wavelength of the maximum intensity (λmax) of the fluorescence spectra and the ratio of the fluorescence spectral intensity at 650 nm over that at 500 nm (Q650/500) for Group I OIAs are in the range of 538–552 nm and 0.61–1.37 (average: 0.86), respectively. The λmax and Q650/500 values for Group II OIAs fall in the range of 523–532 nm and 0.23–0.72 (average: 0.46), respectively. Three condensate samples collected from the Kuqa Depression have λmax and Q650/500 values in the range of 504–511 nm and 0.19–0.27 (average: 0.22), respectively.
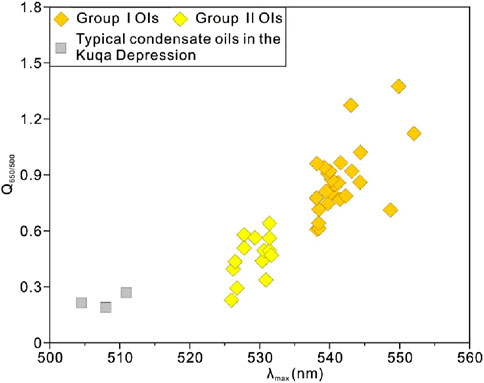
Figure 9. Cross plot of fluorescence spectral parameters of oil inclusions in the Bozi sandstone reservoirs and condensate oil samples in the Kuqa Depression.
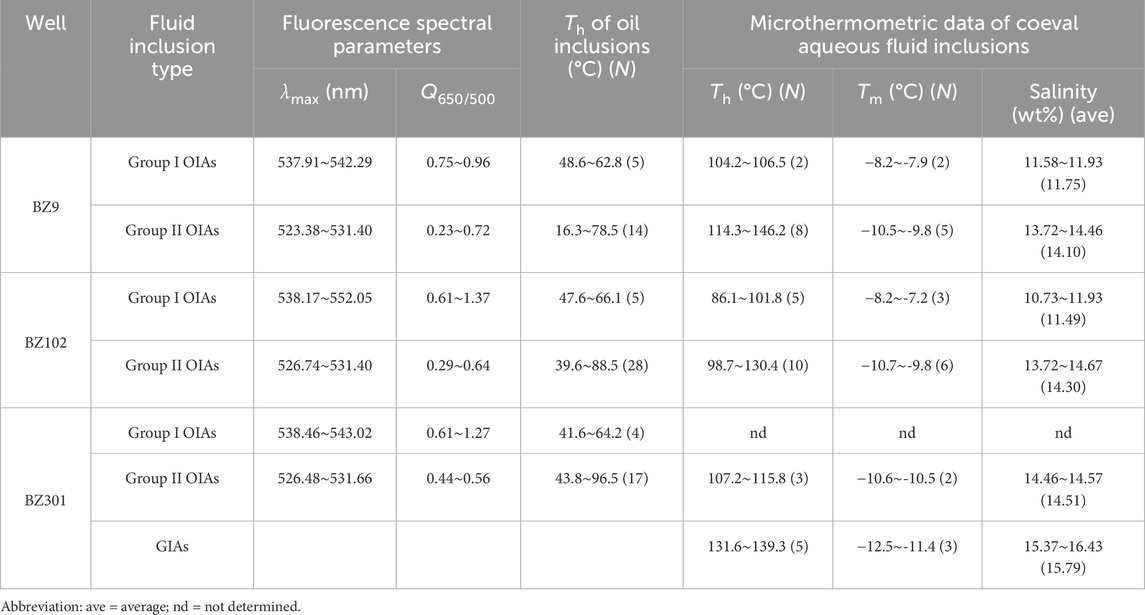
Table 1. Summary of microthermometric and fluorescence spectral characteristics of fluid inclusions investigated in the Bozi sandstone reservoirs.
A total of 107 fluid inclusions investigated were selected for microthermometric measurements (Figure 10; Table 1). Detailed microthermometric results for the three wells are summarized as follows:
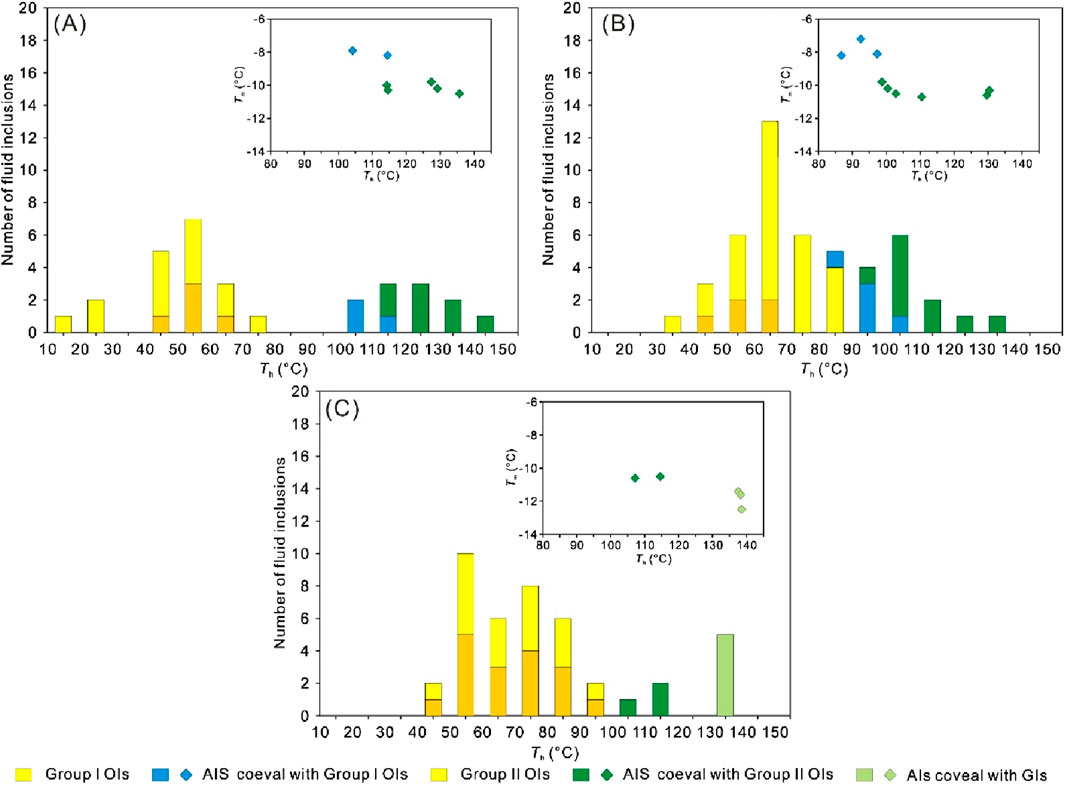
Figure 10. Histograms of fluid inclusion homogenization temperature (Th) in the Bozi sandstone reservoirs for the BZ9 (A), BZ102 (B) and BZ301 (C) wells. Insets show cross plots of homogenization temperature (Th) versus final ice melting temperature (Tm) of coeval aqueous fluid inclusions.
In the BZ9 core samples, a total of 19 oil inclusions and 10 coeval aqueous fluid inclusions were measured for microthermometry (Figure 10A). The Th values of Group I oil inclusions vary from 48.6°C to 62.8°C, while the coeval aqueous fluid inclusions have Th values of 104.2ºC–106.5°C. The corresponding Tm values for the aqueous inclusions are in the range from −8.2°C to −7.9°C, with calculated NaCl-equivalent salinities of 15.6–11.9 wt% (average: 11.8 wt%). Group II oil inclusions have Th values ranging from 16.3°C to 78.5°C, while the coeval aqueous fluid inclusions have Th values in the range of 114.3ºC–146.2°C. The corresponding Tm values for the aqueous inclusions are in the range from −10.5°C to −9.8°C, with calculated NaCl-equivalent salinity in the range of 13.7–14.5 wt% (average: 14.1 wt%).
In the BZ102 core samples, a total of 33 oil inclusions and 15 coeval aqueous fluid inclusions were measured for microthermometry (Figure 10B). Group I oil inclusions have Th values ranging from 47.6°C to 66.1°C, while the coeval aqueous fluid inclusions have Th values in the range of 86.8ºC–101.8°C. The corresponding Tm values vary from −8.2°C to −7.2°C, with calculated NaCl-equivalent salinities of 10.7–11.9 wt% (average: 11.5 wt%). For Group II OIAs, the oil inclusions have Th values ranging from 39.6°C to 88.5°C, while the coeval aqueous fluid inclusions have Th values varying between 98.7°C and 130.4°C. The corresponding Tm values range between −10.7°C and −9.8°C, with calculated NaCl-equivalent salinities in the range of 13.7–14.7 wt% (average: 14.3 wt%).
In the BZ301 core samples, a total of 21 oil inclusions and 8 aqueous fluid inclusions were measured for microthermometry (Figure 10C). Group I oil inclusions have Th values ranging from 41.6°C to 64.2°C, but no microthermometric measurement on the coeval aqueous inclusions was obtained. The bright blue fluorescing Group II oil inclusions have Th values ranging from 43.8°C to 96.5°C, while the Th values of coeval aqueous fluid inclusions fall in the range of 107.2ºC–115.8°C. The corresponding Tm values vary from −10.6°C to −10.5°C, with calculated NaCl-equivalent salinities in the range of 14.5–14.6 wt% (average: 14.5 wt%). For the GIAs, the coeval aqueous fluid inclusions have Th values of 131.6ºC–138.3°C. The corresponding Tm values vary from −12.5°C to −11.4°C, with calculated NaCl-equivalent salinities in the range of 15.4–16.4 wt% (average: 15.8 wt%).
The key input parameters for 1D basin modelling of the BZ9, BZ102 and BZ301 wells are shown in Table 2. Based on the 1D basin modelling results, taking the BZ102 well as an example (Figure 11), it can be seen that from the Late Cretaceous to the Early Paleogene, the strata in the Bozi area underwent a prolonged period of slow subsidence. Since the Late Paleogene, the sedimentation rate of strata has accelerated greatly, especially during the Miocene, and the formation temperature of strata has also increased significantly with depth. There were two important uplifting and denudation events in the study area, one occurred in the Late Cretaceous to Early Eocene (96–65 Ma), resulting in an estimated erosion thickness of 1,100–1,300 m, and the other occurred in the Late Pliocene (3.0–1.8 Ma), causing an estimated erosion thickness of 300–500 m.
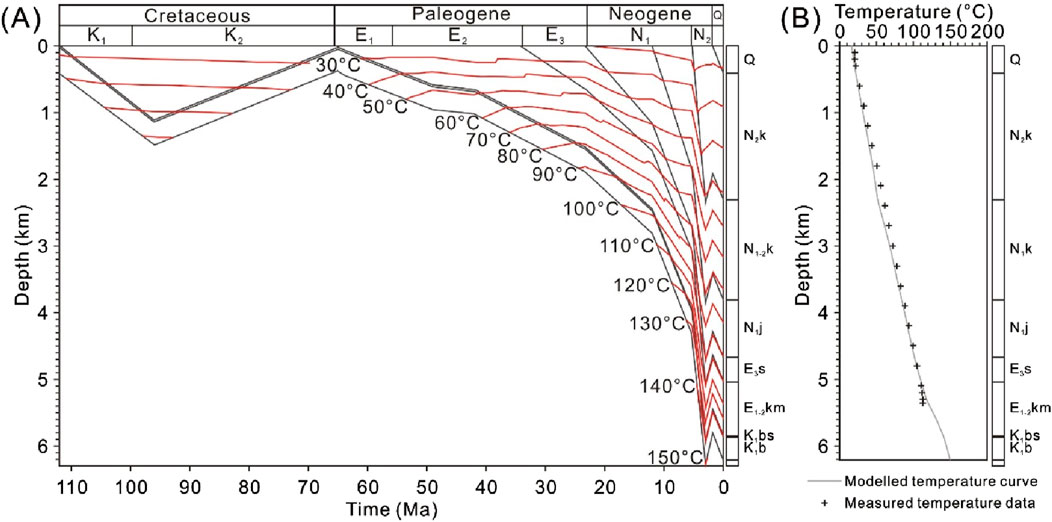
Figure 11. (A) Burial and thermal evolution history diagram of the BZ102 well; (B) Thermal history calibration of the BZ102 well based on measured formation temperature data.
The Th−φvap relationship shows that the modelled oils in Group I oil inclusions consist mainly of black oil or volatile oil, whilst those in Group II oil inclusions are primarily composed predominantly of volatile oil (Figure 12). The Tt and Pt of Group I OIAs in the BZ9 well are 128.5°C and 58.3 MPa, and those of Group II OIAs are 141.1°C and 65.0 MPa (Figure 13A; Table 3). The Tt and Pt of Group I and II OIAs in the BZ102 well are 105.6°C and 47.9 MPa and 121.9°C and 58.8 MPa, respectively (Figure 13B). The Tt and Pt of Group II OIAs in the BZ301 well are 131.7°C and 61.3 MPa (Figure 13C). Based on the wavenumber of the stretching vibration band of CH4 (Figure 8), the internal pressure of the monophasic gas inclusions is 49.2 MPa at room temperature, and the calculated Pt of GIAs in the BZ301 well is 93.0 MPa at 139.1°C (Figure 13C).
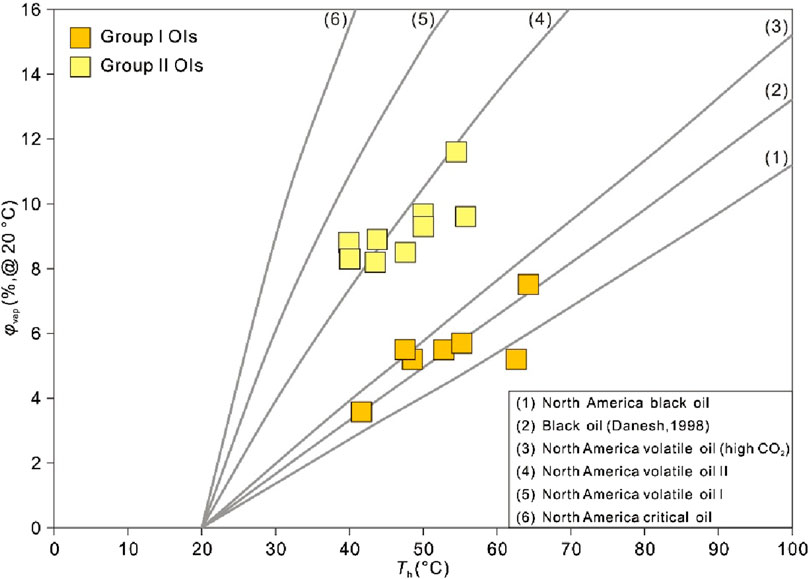
Figure 12. Cross plot of homogenization temperature (Th) versus vapor volume fraction (φvap) (20°C) of oil inclusions in the Bozi sandstone reservoirs. Reference curves with different petroleum compositions are derived from Bourdet et al. (2008).
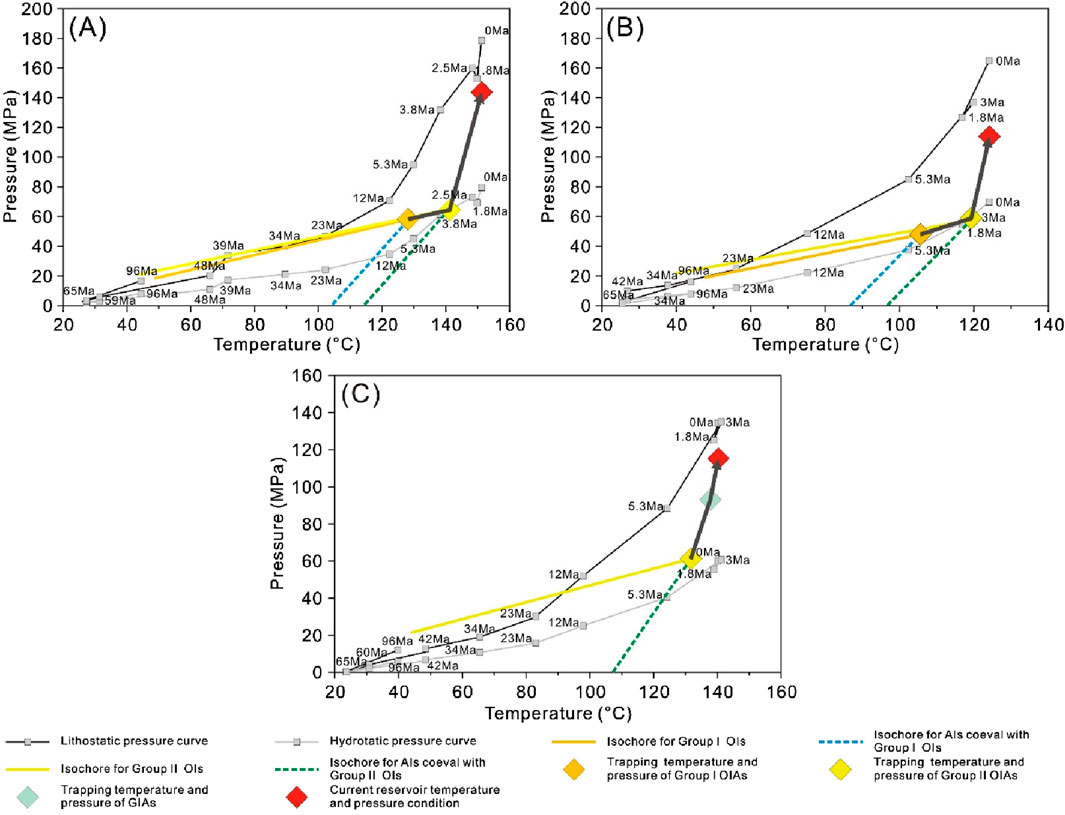
Figure 13. Pressure-temperature evolution path in the BZ9 (A), BZ102 (B) and BZ301 (C) sandstone reservoirs. Also shown are calculated isochores after PVT reconstruction of oil and aqueous fluid inclusions, hydrostatic and lithostatic pressure evolution curves with time.
Fluorescence color has been commonly used as a thermal maturity indicator for oil trapped in inclusions (Guilhaumou et al., 1990; Stasiuk and Snowdon, 1997; Volk and George, 2019; Ping et al., 2020). With increasing maturity, fluorescence colors would change from yellow to blue (McLimans, 1987). The variations in fluorescence color and fluorescence spectral parameters of oil inclusions in our study indicate an obvious maturity difference of oils charged at these two stages. The near yellowish-white and blue-white fluorescing Group I OIAs represent a relatively “low-maturity” oil compared with that for the bright blue fluorescing Group II OIAs. By combining the fluid inclusion PVT modelling and 1D basin modelling results, the timing of hydrocarbon charge can be determined (Figure 14). The first oil charge event, indicated by Group I OIAs, occurred during the Early Neogene (∼6.5 Ma) in the BZ9 well, while the second oil charge event, as evidenced by Group II OIAs, occurred during the Late Neogene (∼3.5 Ma) (Figure 14A). In the BZ102 well, the first and second oil charge events occurred during the Early Neogene (∼5.5 Ma) and Late Neogene (∼3.0 Ma), respectively (Figure 14B). In the BZ301 well, the timing of the first oil charge event cannot be determined, due to the lack of aqueous fluid inclusions coeval with Group I OIs, and the second oil charge event occurred during the Late Neogene (∼4.4 Ma) (Figure 14C). The timing of gas charge event, as evidenced by GIAs in Figure 6I, is approximately 1.6 Ma. It is worth noting that the reservoir pressure coefficients (ratio of oil inclusion trapping pressure to hydrostatic pressure) were in the range of 1.0–1.3 during the first and second oil charge events (Figure 13), equivalent to normal hydrostatic (formation) pressure or weak overpressure. However, the reservoir pressure reached 93 MPa during the gas charge event, with a calculated pressure coefficient of 1.7 in the BZ301 well (Figure 13C).
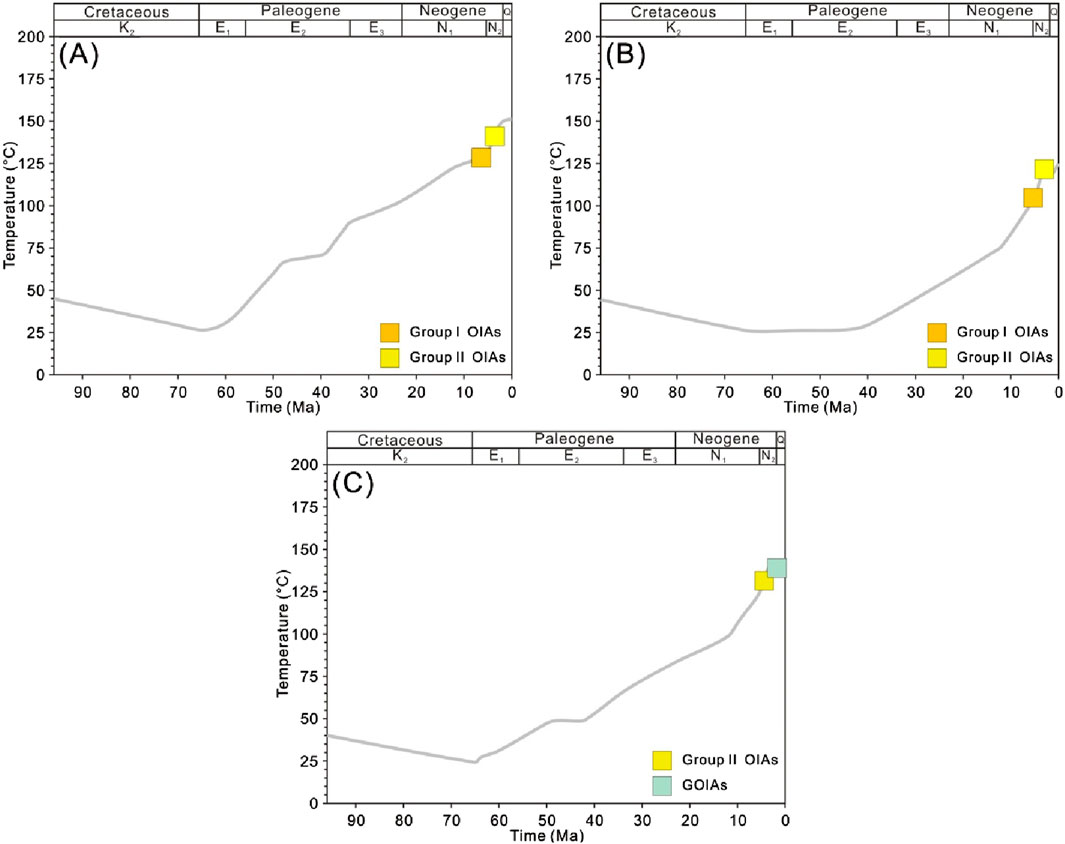
Figure 14. Plots showing the timing of hydrocarbon charge events in the BZ9 (A), BZ102 (B) and BZ301 (C) wells. Grey solid line denotes the reservoir temperature evolution curves.
During the Late Cretaceous to Early Neogene, the Bozi area experienced a period of stable subsidence (Figure 11A), accompanied by local structural deformation and fault development. With the sedimentation of the Paleogene Kumugeliemu Group thick gypsum salt unit, a complete source-reservoir-cap rock assemblage and overburden strata were in place in the Bozi area (Zhu et al., 2015). During the deposition of the Plicene Kangcun and Kuqa formations, the Bozi area underwent strong compression and structural deformation, causing plastic flow of the Paleogene gypsum salt unit and substantial variations in the thickness of the gypsum salt unit and the Kuqa Formation. Large-scale thrust faults developed simultaneously, even breaching through some thinner sections of the gypsum salt unit (Zhang et al., 2011). This rapid subsidence promoted the Middle Jurassic Qiakemake Formation source rocks to become mature and generate hydrocarbons. These hydrocarbons migrated upward along the thrust faults and charged into the Early Cretaceous traps to form oil pools. A total of two oil charge events have been recorded by OIAs, with the first characterized by near yellowish-white and blue-white fluorescing OIAs, while the second characterized by bright blue fluorescing OIAs (Figure 6). In addition, abnormally high QGF index and QGF-E values were observed at 5,830–5,850 m in the BZ301 well (Figure 5), indicating the accumulation of paleo-oil or residual oil. It is hypothesized that oil was once charged into this sandstone interval with relatively good reservoir petrophysical properties, but the scale of the oil pool was relatively limited, with oil column height of only ∼10 m. The first oil charge occurred during the Early Neogene (6.5–5.5 Ma), while the second oil charge occurred during the Late Neogene (4.4–3.5 Ma) (Figure 14). At this time, the reservoir pressure coefficients were in the range of 1.0–1.3 (Figure 13), indicating the occurrence of a normal hydrostatic (formation) pressure or a weak overpressure in the reservoirs.
Since the Quaternary, large-scale thrust faults in the Bozi area continued to develop and gradually formed the current tectonic configuration (Zhang et al., 2011). This had caused the Jurassic coal or coaly shales to become mature rapidly, entering the stage of dry gas generation (Zhang et al., 2011; Tian et al., 2020). This gas charge event occurred during the Pleistocene (∼1.6 Ma) (Figure 14), and was recorded by the GIAs, which are composed of CH4 and subordinately CO2 (Figure 8). The dry gas migrated upward to the Cretaceous traps through faults, and altered the reservoir hydrocarbons via gas flushing, causing the hydrocarbon fluid phase state in the sandstone reservoirs changing from black oil or volatile oil to condensate gas (Figure 15). This is also supported by the changes in fluorescence spectral parameters from oil inclusions to condensate oil samples (Figure 9). The QGF-E spectra peaks in the range of 451–460 nm are indicative of the presence of asphaltene in the reservoirs (Liu and Eadington, 2005), as QGF-E measures adsorbed hydrocarbons extracted from the reservoir grains (Figure 5). This suggests the occurrence of gas-flushing-oil within the reservoirs, which may have caused the exsolution and precipitation of asphaltene from the reservoir oil (Hammami et al., 2000). In addition, the negative deviation of light n-alkanes in the crude oil away from the normal n-alkane profile for normal oil further supports the occurrence of gas flushing in the Kuqa Depression (Zhang et al., 2011). During rapid gas injection, the formation pressure reached 93 MPa with a calculated pressure coefficient of 1.7 in the BZ301 well. Due to the continuous tectonic compression, the formation pressure in the Bozi area continued to increase and eventually became the current ultra-high-pressure condensate gas reservoirs, with the present-day pressure coefficients in the range of 1.8–2.0 (Figure 13).
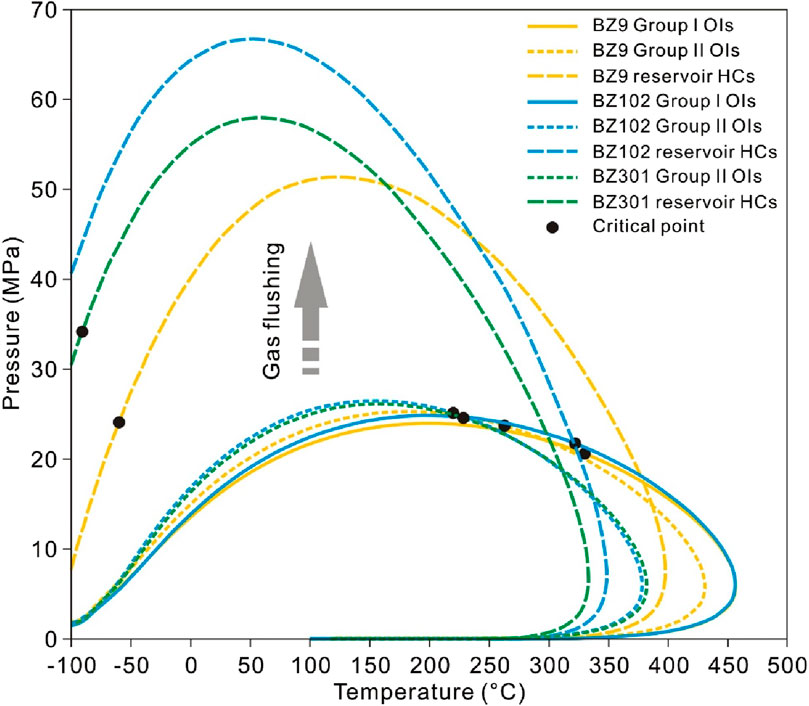
Figure 15. Phase diagrams of reservoir fluids and oil inclusions, showing that reservoir hydrocarbons (HCs) changing from black oil or volatile oil into condensate gas via gas flushing.
It can thus be concluded that the presence of excellent sandstone reservoirs, abundant oil and gas sources, efficient cap rocks, and suitable fault activities promoted the formation of Bozi deep and ultra-deep condensate gas reservoirs.
The burial evolution history in the Bozi area is characterized by a prolonged (>100 Ma) shallow burial and a late-stage rapid subsidence (10 Ma-present) (Figure 11). The strata experienced a prolonged period of slow subsidence during the Late Cretaceous to Early Paleogene, which is crucial for maintaining porosity in the sandstone reservoirs. Since the Late Paleogene, the subsidence rate has accelerated abruptly, with an incremental burial depth reaching 2000–3,000 m over a short time span, and consequently a sharp increase of the formation temperature. This unique burial evolution history had promoted the maturation of source rocks and caused an intense hydrocarbon generation, migration, and accumulation (Zhu et al., 2015). In addition, the current geothermal gradient in the Bozi area is approximately 20°C/km, and the formation temperature of the Cretaceous sandstone reservoirs is mostly less than 160°C, lower than the threshold temperature for oil cracking (Waples, 2000; Tian et al., 2006). Under this circumstance, a large quantity of condensate gas can be well preserved. The unique burial history model in the Bozi area is primarily responsible for the stable preservation of liquid hydrocarbons (including condensate gas) in the ultra-deep reservoirs.
Our study used QGF and QGF-E, fluid inclusion petrography and microthermometry, micro-fluorescence spectroscopy, laser Raman spectroscopy, PVTx modelling, and 1D basin modelling to investigate the hydrocarbon charge history of the deeply buried clastic reservoirs in the Bozi area of the Kuqa Depression, western China. The results show:
(1) The Bozi area experienced two oil charges at the Early Neogene (6.5–5.5 Ma) and the Late Neogene (4.4–3.5 Ma), and a gas charge in the Pleistocene (∼1.6 Ma). The oils were charged into the Bozi ultra-deep reservoirs under a normal hydrostatic (formation) pressure or weak overpressure, whereas the gas dominated by CH4 was charged at an ultra-deep (>6,000 m) depth under overpressure with a corresponding reservoir pressure coefficient of approximately 1.7.
(2) The unique burial-thermal evolution history model in the Bozi area shows that a prolonged shallow burial and a late-stage rapid subsidence, are crucial for liquid hydrocarbon preservation in the ultra-deep strata.
The original contributions presented in the study are included in the article/supplementary material, further inquiries can be directed to the corresponding author.
PY: Conceptualization, Data curation, Methodology, Writing–original draft, Writing–review and editing. YS: Data curation, Formal Analysis, Investigation, Writing–original draft. KL: Resources, Supervision, Writing–review and editing. SW: Formal Analysis, Investigation, Visualization, Writing–review and editing. XW: Formal Analysis, Visualization, Writing–review and editing. JL: Formal Analysis, Visualization, Writing–review and editing.
The author(s) declare that financial support was received for the research, authorship, and/or publication of this article. The research received the financial support provided by the National Natural Science Foundation of China (Grant Nos 92055204 and 41821002), the Shandong Provincial Natural Science Foundation (Grant No. ZR2023QD006), and the China Postdoctoral Science Foundation (Grant No. 2023M733876).
The authors gratefully appreciate editors and reviewers for their comments and helpful suggestions.
Author YS was employed by PetroChina Changqing Oilfield Company.
The remaining authors declare that the research was conducted in the absence of any commercial or financial relationships that could be construed as a potential conflict of interest.
All claims expressed in this article are solely those of the authors and do not necessarily represent those of their affiliated organizations, or those of the publisher, the editors and the reviewers. Any product that may be evaluated in this article, or claim that may be made by its manufacturer, is not guaranteed or endorsed by the publisher.
Aplin, A. C., Larter, S. R., Bigge, M. A., Macleoda, G., Swarbrickb, R. E., and Grunbergerb, D. (2000). PVTX history of the North Sea’s Judy oilfield. J. Geochem. Explor. 69–70, 641–644. doi:10.1016/S0375-6742(00)00066-2
Becker, S. P., Eichhubl, P., Laubach, S. E., Reed, R. M., Lander, R. H., and Bodnar, R. J. (2010). A 48 m.y. history of fracture opening, temperature, and fluid pressure: Cretaceous Travis Peak Formation, East Texas basin. Geol. Soc. Am. Bull. 122 (7–8), 1081–1093. doi:10.1130/B30067.1
Bhullar, A. G., Karlsen, D. A., Backer-Owe, K., Seland, R. T., and Le Tran, K. (1999). Dating reservoir filling—a case history from the North Sea. Mar. Petrol. Geol. 16 (7), 581–603. doi:10.1016/S0264-8172(99)00028-8
Bodnar, R. J. (1993). Revised equation and table for determining the freezing point depression of H2O-NaCl solutions. Geochim. Cosmochim. Ac 57 (3), 683–684. doi:10.1016/0016-7037(93)90378-A
Bourdet, J., Pironon, J., Levresse, G., and Tritlla, J. (2008). Petroleum type determination through homogenization temperature and vapour volume fraction measurements in fluid inclusions. Geofluids 8 (1), 46–59. doi:10.1111/j.1468-8123.2007.00204.x
Buller, A. T., Bjøkum, P. A., Nadeau, P. H., and Walderhaug, O. (2005). Distribution of hydrocarbons in sedimentary basins: the importance of temperature. Research and Technology Memoir No. 7. Stavanger: Statoil ASA, 15.
Duan, Z., and Mao, S. (2006). A thermodynamic model for calculating methane solubility, density and gas phase composition of methane-bearing aqueous fluids from 273 to 523 K and from 1 to 2000 bar. Geochim. Cosmochim. Ac 70 (13), 3369–3386. doi:10.1016/j.gca.2006.03.018
Duan, Z., Møller, N., and Weare, J. H. (1992). An equation of state for the CH4-CO2-H2O system: I. Pure systems from 0 to 1000 °C and 0 to 8000 bar. Geochim. Cosmochim. Ac 56 (7), 2605–2617. doi:10.1016/0016-7037(92)90347-L
Dutton, S. P., and Loucks, R. G. (2010). Diagenetic controls on evolution of porosity and permeability in Lower Tertiary Wilcox sandstones from shallow to ultradeep (200-6700m) burial, Gulf of Mexico Basin, U.S.A. Mar. Petrol. Geol. 27 (1), 69–81. doi:10.1016/j.marpetgeo.2009.08.008
Dyman, T. S., Crovelli, R. A., Bartberger, C. E., and Takahashi, K. I. (2002). Worldwide estimates of deep natural gas resources based on the U.S. Geological Survey World Petroleum Assessment 2000. Nat. Resour. Res. 11, 207–218. doi:10.1023/A:1019860722244
Goldstein, R. H., and Reynolds, T. J. (1994). Systematics of fluid inclusions in diagenetic minerals. SEPM Soc. Sediment. Geol. 31, 199. doi:10.2110/scn.94.31
Graham, S. A., Hendrix, M. S., Wang, L. B., and Homewood, P. (1993). Collisional successor basins of western China: Impact of tectonic inheritance on sand composition. Geol. Soc. Am. Bull. 105 (3), 323–344. doi:10.1130/0016-7606(1993)105<0323:CSBOWC>2.3.CO;2
Guilhaumou, N., Szydlowskii, N., and Pradier, B. (1990). Characterization of hydrocarbon fluid inclusions by infra-red and fluorescence microspectrometry. Mineral. Mag. 54 (375), 311–324. doi:10.1180/minmag.1990.054.375.17
Hammami, A., Phelps, C. H., Monger-Mcclure, T., and Little, T. M. (2000). Asphaltene precipitation from live oils: An experimental investigation of onset conditions and reversibility. Energy Fuels. 14 (1), 14–18. doi:10.1021/ef990104z
Jia, C., He, D., Lei, Z., Zhou, L., Jia, J., and Wang, G. (2000). Oil and gas exploration in the foreland thrust belt. Beijing: Petroleum Industry Press. (in Chinese).
Jiang, X., Shi, L., Mo, T., Yang, H., Du, H., Shi, W., et al. (2024). Characteristics and causes of difference of physical properties of deep and ultra deep tight sandstone reservoirs: A case study of the Bashijiqike Formation in Bozi area of Kuqa Depression (in Chinese with English abstract). Bull. Geol. Sci. Technol. doi:10.19509/j.cnki.dzkq.tb20230567
Karlsen, D. A., Nedkvitne, T., Larter, S. R., and Bjørlykke, K. (1993). Hydrocarbon composition of authigenic inclusions: Application to elucidation of petroleum reservoir filling history. Geochim. Cosmochim. Ac 57 (15), 3641–3659. doi:10.1016/0016-7037(93)90146-N
Lai, J., Li, D., Bai, T., Zhao, F., Ai, Y., Liu, H., et al. (2023). Reservoir quality evaluation and prediction in ultra-deep tight sandstones in the Kuqa depression, China. J. Struct. Geol. 170, 104850. doi:10.1016/j.jsg.2023.104850
Lasocki, J., Guemene, J. M., Hedayati, A., Legorjus, C., and Page, W. M. (1999). The Elgin and Franklin fields: UK Blocks 22/30c, 22/30b and 29/5b. Geol. Soc. Lond. Pet. Geol. Conf. Ser. 5 (1), 1007–1020. doi:10.1144/0051007
Liang, D., Zhang, S., Chen, J., Wang, F., and Wang, P. (2003). Organic geochemistry of oil and gas in the Kuqa depression, Tarim Basin, NW China. Org. Geochem. 34 (7), 873–888. doi:10.1016/S0146-6380(03)00029-9
Lin, C., Yang, H., Liu, J., Rui, Z., Cai, Z., and Zhu, Y. (2012). Distribution and erosion of the Paleozoic tectonic unconformities in the Tarim Basin, Northwest China: Significance for the evolution of paleo-uplifts and tectonic geography during deformation. J. Asian Earth Sci. 46, 1–19. doi:10.1016/j.jseaes.2011.10.004
Liu, J., Liu, K., Jiang, Z., Gui, L., and Li, F. (2018). Hydrocarbon accumulation processes in the Yangtake Foldbelt, Kuqa Foreland Basin, NW China: Insights from intergated basin modelling and fluid inclusion analysis. J. Petrol. Geol. 41 (4), 447–466. doi:10.1111/jpg.12716
Liu, K., and Eadington, P. (2005). Quantitative fluorescence techniques for detecting residual oils and reconstructing hydrocarbon charge history. Org. Geochem. 36 (7), 1023–1036. doi:10.1016/j.orggeochem.2005.02.008
Lu, W., Chou, I. M., Burruss, R. C., and Song, Y. (2007). A unified equation for calculating methane vapor pressure in the CH4-H2O system with measured Raman shifts. Geochim. Cosmochim. Ac 71 (16), 3969–3978. doi:10.1016/j.gca.2007.06.004
Lu, X., Song, Y., Zhao, M., Li, Y., Zhuo, Q., and Wang, Y. (2014). Thermal history modelling of complicated extrusional section and source rock maturation characteristics in Kuqa Foreland Basin. Nat. Gas. Geosci. 25 (10), 1547–1557. (in Chinese with English abstract). doi:10.11764/i.issn.1672-1926.2014.10.1547
McLimans, R. K. (1987). The application of fluid inclusions to migration of oil and diagenesis in petroleum reservoirs. Appl. Geochem. 2 (5–6), 585–603. doi:10.1016/0883-2927(87)90011-4
Munz, I. A. (2001). Petroleum inclusions in sedimentary basins: systematics, analytical methods and applications. Lithos 55, 195–212. doi:10.1016/S0024-4937(00)00045-1
Munz, I. A., Wangen, M., Girard, J., Lacharpagne, J., and Johansen, H. (2004). Pressure-temperature-time-composition (P-T-t-X) constraints of multiple petroleum charges in the Hild field, Norwegian North Sea. Mar. Petrol. Geol. 21 (8), 1043–1060. doi:10.1016/j.marpetgeo.2004.05.006
Péneloux, A., Rauzy, E., and Fréze, R. (1982). A consistent correction for Redlich-Kwong-Soave volumes. Fluid Phase Equilibr 8 (1), 7–23. doi:10.1016/0378-3812(82)80002-2
Ping, H., Chen, H., and George, S. C. (2020). Quantitatively predicting the thermal maturity of oil trapped in fluid inclusions based on fluorescence and molecular geochemical data of oil inclusions in the Dongying depression, Bohai Bay Basin, China. AAPG Bull. 104 (8), 1751–1791. doi:10.1306/09271919096
Pironon, J. (2021). “Constraining fluid and diagenetic events in sedimentary basins by combining fluid inclusion data with burial models: discussions and recommendations,” in Fluid and melt inclusions. Applications to geologic processes. Editors P. Lecumberri-Sanchez, M. Steele-MacInnis, and D. Kontak (London, Ontario: Mineralogical Association of Canada), 1–16. doi:10.3749/9780921294719.ch01
Qiu, N., Zuo, Y., Chang, J., Xu, W., and Zhu, C. (2015). Characteristics of Meso-Cenozoic thermal regimes in typical eastern and western sedimentary basins of China. Earth Sci. Front. 22 (1), 157–168. (in Chinese with English abstract). doi:10.13745/j.esf.2015.01.013
Stasiuk, L. D., and Snowdon, L. R. (1997). Fluorescence micro-spectrometry of synthetic and natural hydrocarbon fluid inclusions: crude oil chemistry, density and application to petroleum migration. Appl. Geochem. 12 (3), 229–241. doi:10.1016/S0883-2927(96)00047-9
Steele-MacInnis, M., Lecumberri-Sanchez, P., and Bodnar, R. J. (2012). HokieFlincs_H2O-NaCl: A Microsoft Excel spreadsheet for interpreting microthermometric data from fluid inclusions based on the PVTX properties of H2O-NaCl. Comput. Geosci. 49, 334–337. doi:10.1016/j.cageo.2012.01.022j.cageo.2012.01.022
Tang, Y., Chen, D., Deng, H., Yang, F., Ding, H., Yang, Y., et al. (2024). Deep-learning-based natural fracture identification method through seismic multi-attribute data: a case study from the Bozi-Dabei area of the Kuqa Basin, China. Front. Earth Sci. 12, 1468997. doi:10.3389/feart.2024.1468997
Thiéry, R., Pironon, J., Walgenwitz, F., and Montel, F. (2000). PIT (Petroleum Inclusion Thermodynamic): a new modeling tool for the characterization of hydrocarbon fluid inclusions from volumetric and microthermometric measurements. J. Geochem. Explor. 69–70, 701–704. doi:10.1016/S0375-6742(00)00085-6
Tian, H., Wang, Z., Xiao, Z., Li, X., and Xiao, X. (2006). Oil cracking to gases: Kinetic modeling and geological significance. Chin. Sci. Bull. 51 (22), 2763–2770. doi:10.1007/s11434-006-2188-8
Tian, J., Yang, H., Wu, C., Mo, T., Zhu, W., and Shi, L. (2020). Discovery of Well Bozi 9 and ultra-deep natural gas exploration potential in the Kelasu tectonic zone of the Tarim Basin. Nat. Gas. Ind. 40 (1), 11–19. (in Chinese with English abstract). doi:10.3787/j.issn.1000-0976.2020.01.002
Volk, H., and George, S. C. (2019). Using petroleum inclusions to trace petroleum systems – A review. Org. Geochem. 129, 99–123. doi:10.1016/j.orggeochem.2019.01.012
Wang, Q., Deng, H., Mo, T., Zhang, H., Cheng, B., Wang, Y., et al. (2024a). Carbon and hydrogen isotopic compositions of C7 hydrocarbons and their geochemical significance in light oils/condensates from the Kuqa Depression, Tarim Basin, NW China. Org. Geochem. 192, 104783. doi:10.1016/j.orggeochem.2024.104783
Wang, Q., Wang, W., Wu, C., Yin, H., Jin, J., He, W., et al. (2024b). Fault slip distribution and its implication on hydrocarbon accumulation in the Bozi-Dabei region: Insights from earthquake and numerical simulations. Geotecton. Metallog. 48 (4), 677–689. (in Chinese with English abstract). doi:10.16539/j.ddgzyckx.2024.04.001
Waples, D. W. (2000). The kinetics of in-reservoir oil destruction and gas formation: constraints from experimental and empirical data, and from thermodynamics. Org. Geochem. 31 (6), 553–575. doi:10.1016/S0146-6380(00)00023-1
Xu, K., Zhang, H., Dong, R., Ju, W., Xie, Y., Cui, D., et al. (2022). In situ stress distribution in Cretaceous ultra-deep gas field from 1D mechanical earth model and 3D heterogeneous geomechanical model, Kuqa Depression, Tarim Basin, NW China. Front. Earth Sci. 10, 937393. doi:10.3389/feart.2022.937393
Yang, H., Chen, Y., Tian, J., Du, J., Zhu, Y., Li, H., et al. (2020). Great discovery and its significance of ultra-deep oil and gas exploration in well Luntan-1 of the Tarim Basin. China Pet. Explor 25 (2), 62–72. (in Chinese with English abstract). doi:10.3969/j.issn.1672-7703.2020.02.007
Yang, P., Liu, K., Liu, J., Yu, S., Yu, B., Hou, M., et al. (2021). Petroleum charge history of deeply buried carbonate reservoirs in the Shuntuoguole Low Uplift, Tarim Basin, west China. Mar. Petrol Geol. 128, 105063. doi:10.1016/j.marpetgeo.2021.105063
Zeng, Q., Mo, T., Zhao, J., Tang, Y., Zhang, R., Xia, J., et al. (2020). Characteristics, genetic mechanism and oil and gas exploration significance of high-quality sandstone reservoirs deeper than 7000m: A case study of the Bashijiqike Formation of Lower Cretaceous in the Kuqa Depression, NW China. Nat. Gas. Ind. 40 (1), 38–47. (in Chinese with English abstract). doi:10.3787/j.issn.1000-0976.2020.01.005
Zhang, B., Huang, L., Wu, Y., Wang, H., and Cui, J. (2010). Quantitative evaluation of crude oil composition changes caused by strong gas washing: A case study of natural gas pool in Kuga Depression. Earth Sci. Front. 17 (4), 270–279. (in Chinese with English abstract).
Zhang, S., Zhang, B., Zhu, G., Wang, H., and Li, Z. (2011). Geochemical evidence for coal-derived hydrocarbons and their charge history in the Dabei Gasfield, Kuqa Thrust Belt, Tarim Basin, NW China. Mar. Petrol. Geol. 28 (7), 1364–1375. doi:10.1016/j.marpetgeo.2011.02.006
Zhu, G., Wang, H., Weng, N., Yang, H., Zhang, K., Liao, F., et al. (2015). Geochemistry, origin and accumulation of continental condensate in the ultra-deep-buried Cretaceous sandstone reservoir, Kuqa Depression, Tarim Basin, China. Mar. Petrol. Geol. 65, 103–113. doi:10.1016/j.marpetgeo.2015.03.025
Keywords: hydrocarbon charge history, fluid inclusion, deep and ultra-deep strata, Bozi condensate gas field, Kuqa Depression
Citation: Yang P, Song Y, Liu K, Wang S, Wei X and Liu J (2024) Hydrocarbon charge history of deeply buried clastic reservoirs in the Bozi area of the Kuqa Depression, western China: implications for deep and ultra-deep petroleum exploration. Front. Earth Sci. 12:1475316. doi: 10.3389/feart.2024.1475316
Received: 03 August 2024; Accepted: 30 September 2024;
Published: 14 October 2024.
Edited by:
Leibo Bian, Aarhus University, DenmarkReviewed by:
Zhenzhu Zhou, Shandong University of Science and Technology, ChinaCopyright © 2024 Yang, Song, Liu, Wang, Wei and Liu. This is an open-access article distributed under the terms of the Creative Commons Attribution License (CC BY). The use, distribution or reproduction in other forums is permitted, provided the original author(s) and the copyright owner(s) are credited and that the original publication in this journal is cited, in accordance with accepted academic practice. No use, distribution or reproduction is permitted which does not comply with these terms.
*Correspondence: Keyu Liu, bGl1a2V5dUB1cGMuZWR1LmNu
Disclaimer: All claims expressed in this article are solely those of the authors and do not necessarily represent those of their affiliated organizations, or those of the publisher, the editors and the reviewers. Any product that may be evaluated in this article or claim that may be made by its manufacturer is not guaranteed or endorsed by the publisher.
Research integrity at Frontiers

Learn more about the work of our research integrity team to safeguard the quality of each article we publish.