- School of Mining and Geomatics Engineering, Hebei University of Engineering, Handan, China
In particular, the secondary development of overlying strata fractures can easily lead to the upper goaf, resulting in gas and water gathered in the goaf entering the working face of the lower coal seam through the overlying strata fractures, threatening the safety of coal mine production. Security risks may arise. To further understand the caving and evolution law of overlying strata during repeated mining in extremely close distance coal seam down mining, 9# coal and 10# coal in the Nanyaotou Coal Industry were used as the engineering background. The caving characteristics and fracture evolution law of overlying strata during single and repeated mining were analyzed through similar material simulation tests. Based on fractal geometry theory, the relationship between the advancing distance of the working face and the fractal dimension of the overlying strata fracture is established to reflect the changing trend of fracture development. The calculation formula is derived from the tensile rate of rock strata to predict the development height of water-conducting fractures. The results show that the overlying strata failure structure is mainly a “hinged structure” and a “step structure,” which respectively promotes and inhibits the development of overlying strata fractures. Repeated mining causes mining-induced fractures in the lower coal seam to pass through the goaf of the upper coal seam and develop more vigorously in the upper coal seam, and the fractal dimension can effectively reflect the development of overlying strata fractures. The height of the water-conducting fracture zone increases in four stages: incubation, gradual increase, further gradual increase, and stability, eventually stopping development under the influence of the key layer (thick mudstone) bearing the load above. The development height of water-conducting fractures predicted by on-site water injection measurement is similar to that predicted by simulation experiments and theoretical calculations, verifying the feasibility of predicting the development height of water-conducting fractures through simulation tests and theoretical analysis. This study provides a reference for coal seam mining under similar conditions.
1 Introduction
In order to meet the demand for domestic coal resources, the mining of close-distance coal seams is becoming increasingly common, especially since the mining of extremely close distance coal seams faces many difficulties. Repeated mining of extremely close coal seams is more complicated than single coal seam mining. Overburden rock undergoes multiple pressure relief failures, resulting in the secondary development of cracks and even leading to the upper goaf. If the water-conducting fractured zone develops into the aquifer, it not only causes the waste of groundwater resources, endangers the ecology, but also brings safety hazards to mine production. Therefore, the prediction of the development height of water-flowing fracture and the study of the evolution law of overburden fracture will have to guide significance for the prevention and control of roof water and the improvement of the upper limit of coal seam mining (Tian et al., 2021; Qiao et al., 2021; Yin et al., 2021).
Related scholars have conducted extensive research on the failure characteristics and fracture evolution law of overlying strata in single-seam mining and close-seam group mining. Based on numerical simulation results, it is revealed that the fracture field of a single coal seam presents a “double arch” shape under the mining action, and the repeated mining action of multiple coal seams in close proximity is the root cause of fracture penetration and expansion in the overlying strata. Combining key strata theory and using statistical analysis software, the empirical calculation formula for the height of the water-conducting fracture zone is fitted and modified (Pan et al., 2018; Lai et al., 2021; Li et al., 2013). Similar material simulation tests were used to simulate coal seam mining, and the failure characteristics and migration laws of overlying strata at different advancing distances were analyzed. It was found that under the action of double depressurization mining, the overlying strata fractures undergo a complex process of formation, expansion, compaction, tension, and compaction (Liu et al., 2024; Xun and Lyu, 2021). Some scholars also established a prediction model for the development height of water-conducting fractures based on the results of similar simulation tests (Wang et al., 2022a; Wang et al., 2022b; Zhao et al., 2023). Based on key strata theory, the overlying strata structure is classified, the instability mechanism of the key strata is studied, the motion characteristics of the overlying strata are analyzed, and various control and preventive measures for the instability of the key strata structure are proposed (Xu et al., 2009; Zhu, 2010). By combining the probability integral method, linear regression, fractal geometry, rock tensile rate, et al., with overlying strata failure and fracture evolution, a prediction model for water-conducting fracture height was established (Xu et al., 2012; Qiu et al., 2023; Xia and Huang, 2014; Cul and Cul, 2021). Some scholars applied intelligent models to the prediction of water-conducting fracture height, such as neural network algorithms and support vector algorithms, which provided new approaches for predicting water-conducting fracture height (Fan et al., 2023; Song et al., 2020). In field measurements, surface drilling and underground upward boreholes are often used to determine the loss of drilling fluid to assess the height of overlying strata failure, and the borehole television method is used to observe rock mass failure and separation (Yang et al., 2019).
To sum up, more in-depth studies have been conducted on overlying strata movement failure and the development law of water-conducting fractures caused by single coal seam mining and repeated mining in most double coal seams. However, few studies have been conducted on overlying strata failure and fracture evolution caused by repeated mining under special geological conditions, such as extremely close coal seams, and the existing studies are mostly related to numerical simulation and theoretical analysis. Direct studies use different material simulation tests. Based on this, this paper takes the mining of Nanyaotou 9# coal and 10# coal as the engineering background and studies the caving characteristics and fracture evolution law of overlying strata under repeated mining in extremely close coal seams through similar material simulation tests. At the same time, the theoretical calculation results and field-measured data were used to assist in verifying the simulation experiment results, and the development height of water-conducting fractures was finally determined, providing a theoretical basis for safe mining, efficient production, and sustainable development of coal mines.
2 Geology
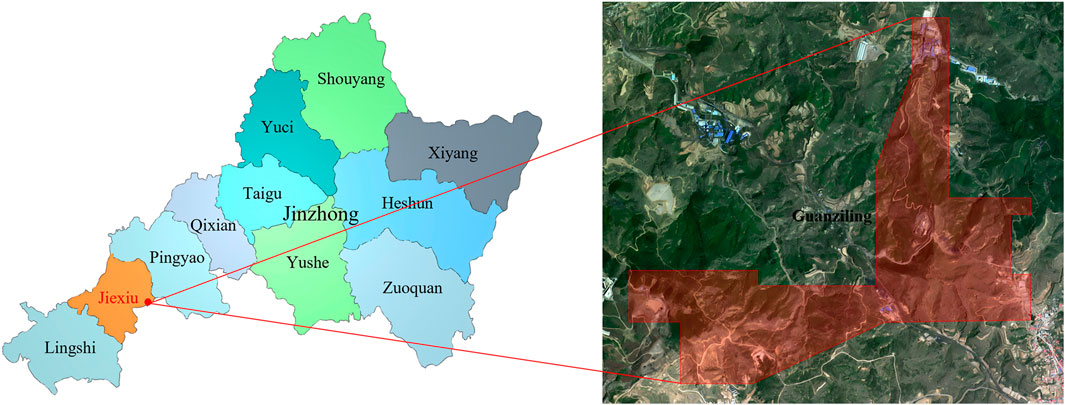
The Nanyaotou Coal Mine, operated by Shanxi Jiexiu Dafosi Nanyaotou Coal Industry, is situated in the western sector of Nanyaotou Village, Zhanglan Town, approximately 35 km northeast of Jiexiu City (Figure 1). This area is characterized by a temperate continental climate featuring mild weather conditions. The topography of the mining region exhibits a general elevation gradient that descends from south to north, presenting a complex terrain with significant erosion. The landscape is marked by well-developed gullies and is classified as a low-to-medium mountain landform.
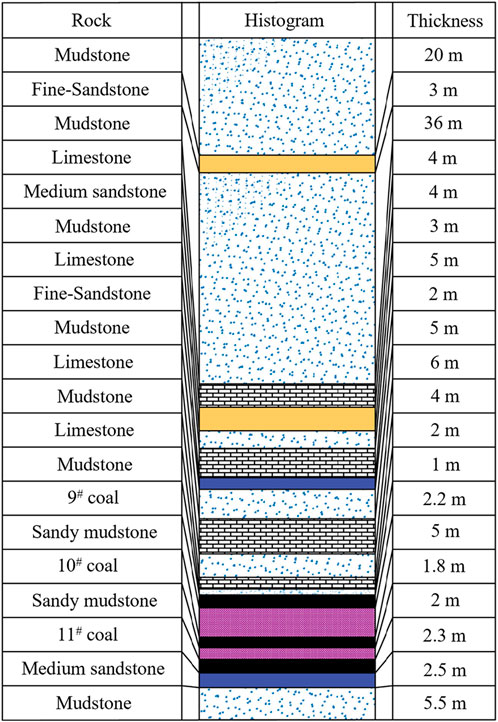
The Nanyaotou Coal Mine extracts coal from seams 9#, 10#, and 11#. The 9# seam has a thickness ranging from 1.3 to 4.20 m, with an average thickness of 2.27 m. It contains 0 to one waste rock layers and has a simple structure, making it a stable seam mineable throughout the field. The 10# seam has a thickness between 0.80 and 3.40 m, averaging 1.93 m. It similarly contains 0 to one waste rock layers and features a simple structure. This seam is situated 1.35–15.55 m from the 9# seam, with an average distance of 9.04 m, and is also stable and mineable across the entire field. The 11# seam is 1.15 to 4.75 m thick, with an average thickness of 2.74 m. It contains 0 to two waste rock layers and has a simple structure. Positioned between 0.90 and 5.10 m away from the 10# seam, this seam averages a distance of 2.70 m and remains consistently mineable across the entire area. All coal seams utilize the longwall one-time mining full-height, fully mechanized coal mining method. The 100,501 worksite is situated in the southern section of the fifth mining zone. The inclination of the coal seam varies between 3° and 14°, and the coal layer has an average thickness of 1.80 m. The working face strike extends 651 m, with an incline length of 170 m. The 100,501 working face overlays the 9# coal seam, which has a thickness of 2.20 m and has been completely extracted. The distance between the 10# and 9# seams is approximately 5.0 m. A comprehensive geologic column is presented in Figure 2.
3 Law of movement and fracture development in overlying strata during repeated mining
3.1 Experimental design of equivalent material
3.1.1 Equivalent material model
The detailed stratigraphic column (Figure 2) and the table of rock physical and mechanical properties (Table 1) depict the significant coal seam thicknesses and physical characteristics (Zhu et al., 2024). The test frame measures 2.5 m long, 0.18 m wide, and 1.2 m high. Based on the similarity principle and the mechanical properties of the rock layers, a geometric similarity ratio of 1:100, bulk density similarity ratio of 1:1.5, stress similarity ratio of 1:150, and time similarity ratio of 1:10 were established.
3.1.2 Model construction and measuring point arrangement
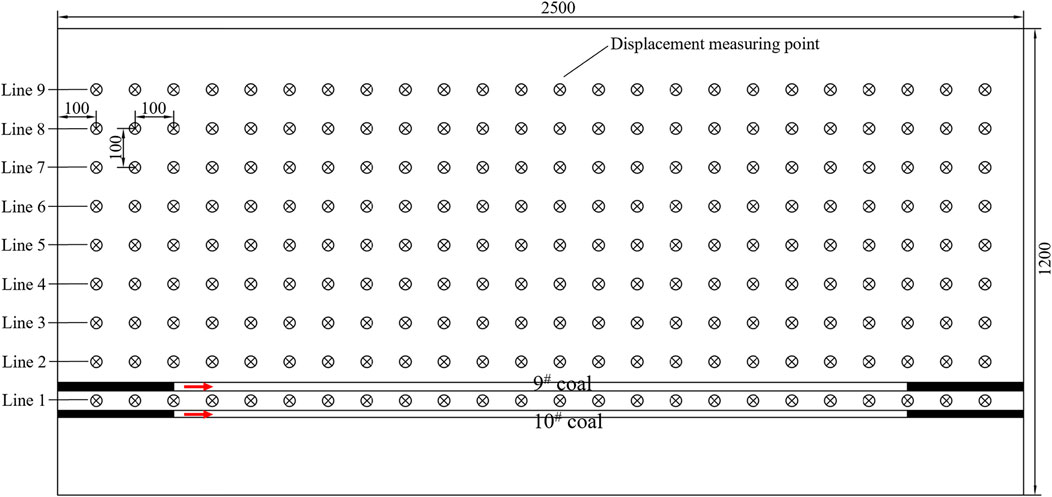
Fine river sand, gypsum, and putty powder were selected as cementing materials. These three cementing materials simulate rock strata with different strengths through varying ratios, and the model was created using a ramming method. The thickness of each layer did not exceed 2 cm. To better reflect the actual engineering geology, mica flakes were spread on top of the rock layer as the separating material for the bedding surface. Due to the size of the model and the thickness of the coal seam, the model was not extended to the surface, and an equivalent load was applied to the top of the model to represent the upper unlaid rock strata. After the model dried, reference lines and displacement measurement points were placed on the surface (Figure 3), and the characteristics of overlying strata migration were recorded by cameras before and after excavation.
3.1.3 Model excavation scheme
To reduce the influence of boundary effects, a 30 cm coal pillar was left on both sides of the 9# coal and 10# coal seams in the model. During the excavation process, the upper 9# coal seam was first mined, with the excavation beginning 30 cm away from the left boundary of the model, and each excavation step was 10 cm. After the overlying strata stabilized, excavation continued until the working face advanced to 220 cm away from the left boundary, at which point excavation stopped. This process represents the initial mining of the extremely close-distance coal seams. When the excavation of the upper 9# coal face ended, and the overlying strata reached a stable state, the excavation of the 10# coal face began with the same mining speed and starting position. This phase represents the repeated mining of extremely close coal seams. Throughout the test, the displacement and fracture evolution of the overlying strata during the advancement of both working faces were monitored and recorded, and the roof caving, overlying strata failure, and fracture evolution were photographed and documented.
3.2 Development of fractures in the overlying strata of a single coal seam
3.2.1 Characteristics of failure in the overlying strata of a single coal seam
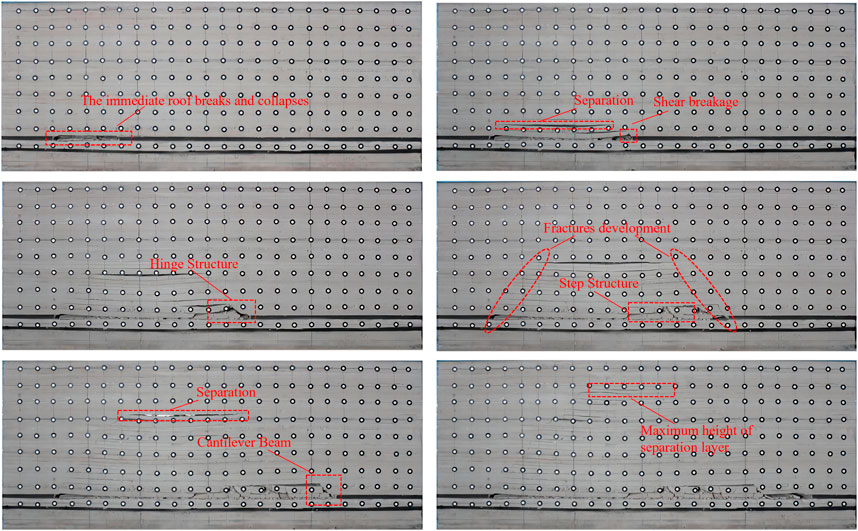
A similar material simulation test investigated the phenomena of overlying strata caving and breaking during coal seam mining. As the mining front progresses (Figure 4), the uncovered section of the roof over the goaf expands. As exposure increases, the tensile strength of the roof layers reaches its maximum, leading to tensile failure. Afterwards, the immediate roof undergoes its initial collapse, succeeded by the first pressure from the main roof and recurring pressure occurrences (Zhao et al., 2021).
As the 9# coal working face advances to 38 m, the immediate roof reaches its maximum tensile strength, leading to a roof fracture and collapse, which was uniformly spread across the floor. At this stage, the fracture development height was 1 m. When the working face progressed to 84 m, the suspended main roof reached the crucial collapse point, leading to tensile failure due to its weight and the pressure from the overlying material. The shear failure occurred above both sides of the goaf, leading to a noticeable bed separation of the overlying rock, with a fracture development height of 9.8 m.
Upon reaching 114 m, the fractures at the center of the goaf experienced compression, resulting in a collapse pattern that closely resembled the initial cave-in. Substantial layers of strata intervals developed at the upper section of the rock above the working face. In the direction of the working face’s advance, a hinge formation developed between the coal wall and the immediate roof, with fractures extending up to 29.6 m in height. At an advance of 141 m, the working face’s roof exhibited notable fractures, increased compression of the central goaf fissures, and upward propagation of cracks on either side of the goaf. The overlying rock continued to sink, and bed separation cracks increased, forming a Step Structure above the goaf, with fractures developing up to 31.3 m.
Upon advancing to 163 m, the bed separation layer at the top of the overlying rock continued to develop upward. Towards the working face, the immediate roof’s Cantilever Beam near the coal wall, along with the collapsed rock in the goaf, resulted in the formation of extra hinge structures, with a fracture height reaching 45.5 m. At 190 m into the working face, the bed separation height reached its maximum, and the roof showed notable cracks. Extensive longitudinal fissures were observed on either side of the goaf, with the tallest overburden fracture measuring up to 55.8 m.
3.2.2 Dynamics of overburden layers in individual coal seams
As the 9# coal seam excavation progresses, the vertical movement of the roof steadily increases, leading to an incremental enlargement of the collapse zone. The overlying rock farther from the roof subsidence zone tends to compress towards the middle (Figure 5).
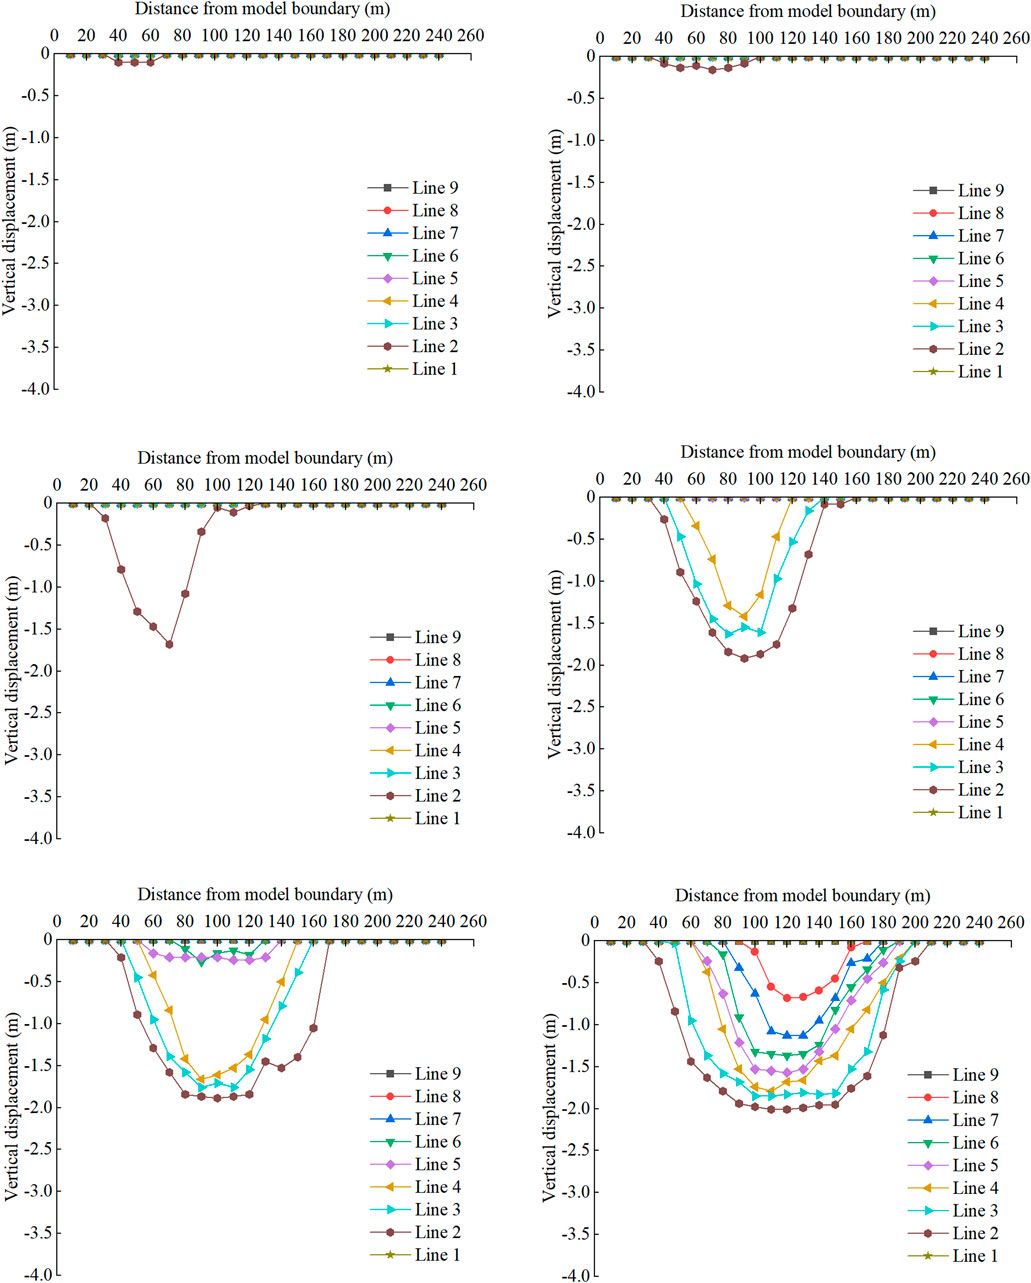
Figure 5. The vertical displacement curve of overburdened rock during the advancing process of 9# coal working face.
Upon advancing the working face to 40 m, displacement was noted solely at survey line 2, which measured the survey line within the immediate roof area. In contrast, no displacement was recorded at other measurement points. This suggests that the collapse of the immediate roof during mining led to the movement of the overlying layers. Based on the vertical displacement distribution graph, a bed separation was observed between survey line two and survey line three when the working face progressed to 100 m. As the work area progressed, the sinking of survey lines further from the roof steadily grew. Upon the working face extending to 190 m, the displacement graphs for each measurement point showed different levels of smooth segments, with the subsidence along the survey lines peaking. Survey line two experienced maximum subsidence of 2.01 m, with the 9# coal seam having a mining height of 2.2 m, suggesting significant compaction of the rock with fractured blocks in the area.
As the mining front progresses, the layers of rock above the abandoned area behind it consistently crumble, settle, and shift laterally due to their weight and the disruptions caused by mining activities. This process gradually fills the goaf, and the rock is compacted under the pressure exerted by the overburden. The form of the subsidence curve across various survey lines transitions from an upside-down triangle to an inverted trapezoid, displaying a roughly symmetrical configuration.
3.3 Fracture evolution of repeated mining overlying strata
3.3.1 Failure characteristics of repeated mining overlying strata
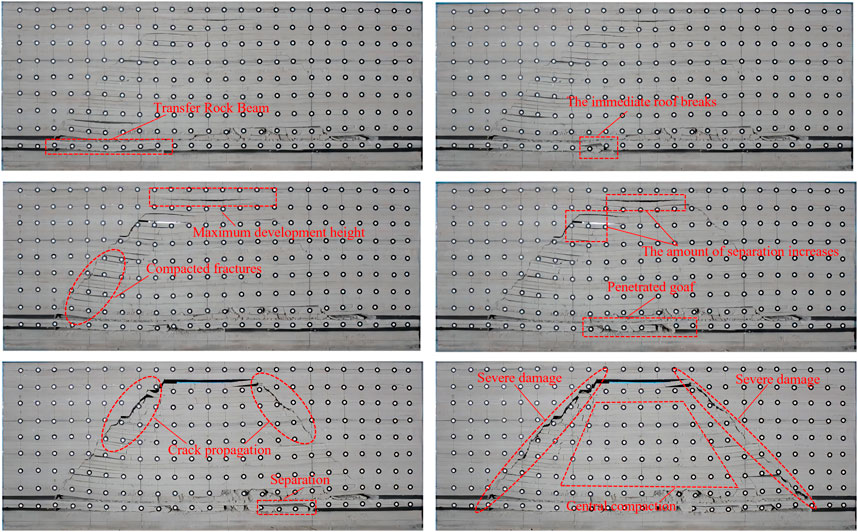
Since the commencement of advancing the 10# coal working face, there have been no new cracks or changes in the overlying strata on the working face. The fractures caused by mining in the overlying layers remain unchanged in the goaf of the upper 9# coal seam. The roof has a total advancement of 190 m and displays a concave shape with no clear periodic pressure (Figure 6). At a 62m of the working face, the immediate roof of the 10# coal seam collapsed entirely, creating a Transfer Rock Beam failure structure. As a result of mining activities, the overlying strata in the upper coal seam de-formed simultaneously.
When progress reached 73 m, the roof at the working face underwent bed separation and fracturing, causing the fragmented rock mass to rotate and become unstable, leading to roof subsidence. As the working face progressed, the roof experienced regular fracturing and compression, with the cracks extending upwards to a height of 78.1 m. When the roof reached 100 m, it developed fissures and sagged, progressively compressing the upper coal seam’s overlying layers through the cracks in the left coal pillar, leading to the upward formation of the bed separation layer.
As the working face progressed to 110 m, the mining operations caused an increase in the separation of the overburden layer above the upper coal seam’s roof. During this phase, the interval rock layer between the 9# and 10# coal seams was affected by mining, resulting in more mining-induced cracks, which also penetrated the goaf of the 9# coal seam. With continuous mining, the fractures in the overlying strata within the goaf of the upper coal seam expanded further.
As the mining operations to 150 m, the overburden layer above the upper coal seam’s roof experienced increased separation. These mining-induced failure and bed separation cracks continued to expand under the influence of repeated mining of the 10# coal seam. At 190 m of advancement, the bed separation cracks and mining failure further developed, with the longitudinal crack width at the goaf boundary reaching its maximum. The upper layers are typically fractured into a trapezoidal zone, showing significant development on the sides of the mined-out area and compression in the center.
Mining activities in the lower coal seam caused the previously settled layers in the stable goaf of the upper coal seam to subside once more, resulting in a rise in the height of the water-conducting fractures. The final development height reached 78.1 m.
3.3.2 Movement law of repeated mining overburden rock
Since the commencement of mining the 10# coal seam, the collapse of the immediate roof has caused the first changes in survey line one of the coal seam roof. As the working face advanced, the shape of the change evolved from an inverted triangle to an inverted trapezoid. Due to the disruption caused by mining the 10# coal seam, the previously stable overlying layers started to crack. The extent of the damage progressively increased from the base upwards, leading to a sequential sinking and shifting of the roof inspection line (Figure 7).
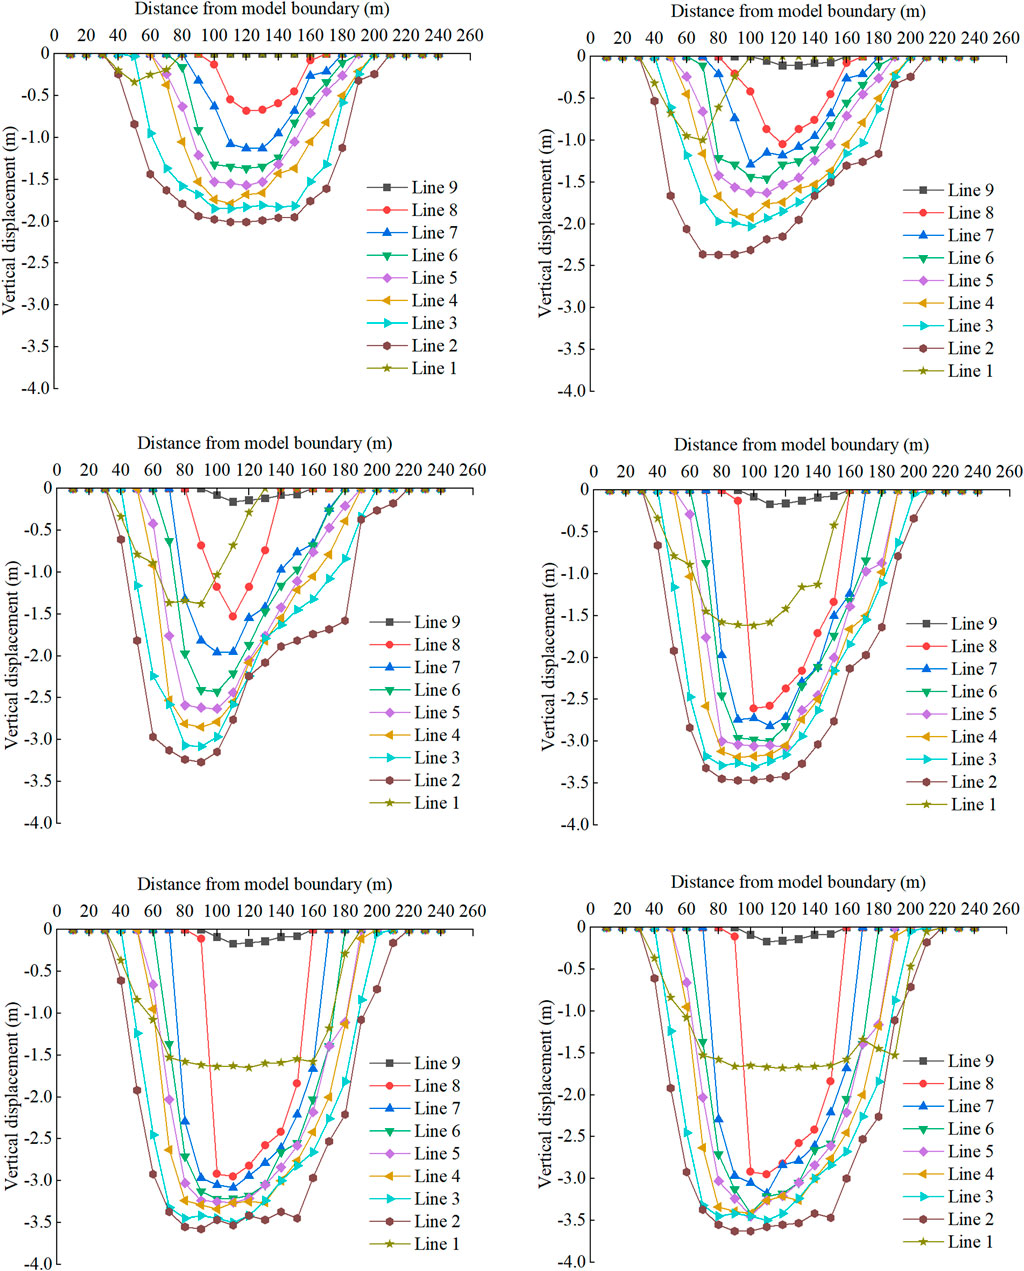
Figure 7. The vertical displacement curve of overburdened rock during the advancing process of 10# coal working face.
As the working face progressed to 70 m, the shift in the position of survey line 1. above the roof grew, and survey line two experienced significant impact due to roof subsidence. When the working face reached 100 m, the subsidence along each survey line surged, suggesting significant activity in the overlying strata in this area. At 130 m of advancement, the subsidence value of the measuring point 100 m from the model boundary on line eight changed abruptly due to the breakage of the rock and its separation from the upper overburden. As the working face progressed to 190 m, the subsidence along each measurement line steadily rose, suggesting that the fractured rock mass was becoming increasingly compacted. Survey line one experienced its greatest subsidence of 1.68 m at a point 120 m away from the model’s edge. The maximum subsidence value of survey line two was 3.63 m at 100 m from the model boundary.
The failure traits and movement patterns of the overburden were analyzed following the extraction of both upper and lower coal layers. Following the extraction of the upper coal layer, the extent of disruption to the overlying strata was minimal. Nevertheless, due to continuous mining activities, the interlayer fractures and the abandoned upper coal seam were further compromised and connected. This intensified the growth of fissures in the upper coal seam goaf, causing new mining cracks and greater instability and collapse of the overlying layers. As a result, the height of the fracture in the lower coal seam after mining exceeded that of the upper coal seam.
The collapse pattern of the overlying layers generally appears as a Hinged Formation or a Stepped Formation. The continuous support provided by the Hinged Structure within the overlying strata prevents the formation and spread of cracks. It is primarily located in the upper part of the goaf. Conversely, the Step Structure offers discontinuous support, promoting the evolution of cracks, and is often found at the upper boundary of the goaf.
While extracting the upper coal layer, the subsidence profile is fairly even, showing a nearly symmetrical form in the mined-out area. Nevertheless, extracting the lower coal seam disturbs the stress equilibrium of the layers above, causing substantial roof collapse and a recurring pattern of fissures in the overlying strata opening and closing. The characteristics of the subsidence curve change from an inverted triangle to an inverted trapezoid. Due to the Hinged Structure and Step Structure, near-straight lines and inclined segments appear in the middle of the curve.
3.4 Fractal geometry analysis of repeated mining fracture network
3.4.1 Calculate fractal dimension
Fractal dimension is an index that characterizes a fractal pattern or set by quantifying its complexity as the ratio of detail change to scale change. It plays a crucial role in the study of fractals. In studying the evolution characteristics of rock fracture networks, fractal geometry theory is frequently employed to describe the process. This method enables a thorough quantitative assessment of fracture evolution traits (Sun et al., 2020). For fractures caused by mining in subterranean rock formations, the box-counting dimension method is commonly used for calculating the fractal dimension of the fracture network. Equation 1 is used for performing this calculation:
In this Equation, D represents the fractal dimension, N(r) denotes the count of grids with cracks, and r signifies the side length of the subdivided grids.
The fractal dimension was calculated using MATLAB according to the experiment’s fracture development images obtained at different advancing distances. The initial images were converted to binary format using MATLAB, and the generated binary numerical matrix was then brought into the FracLab toolbox to determine the fractal dimension of the fracture visuals.
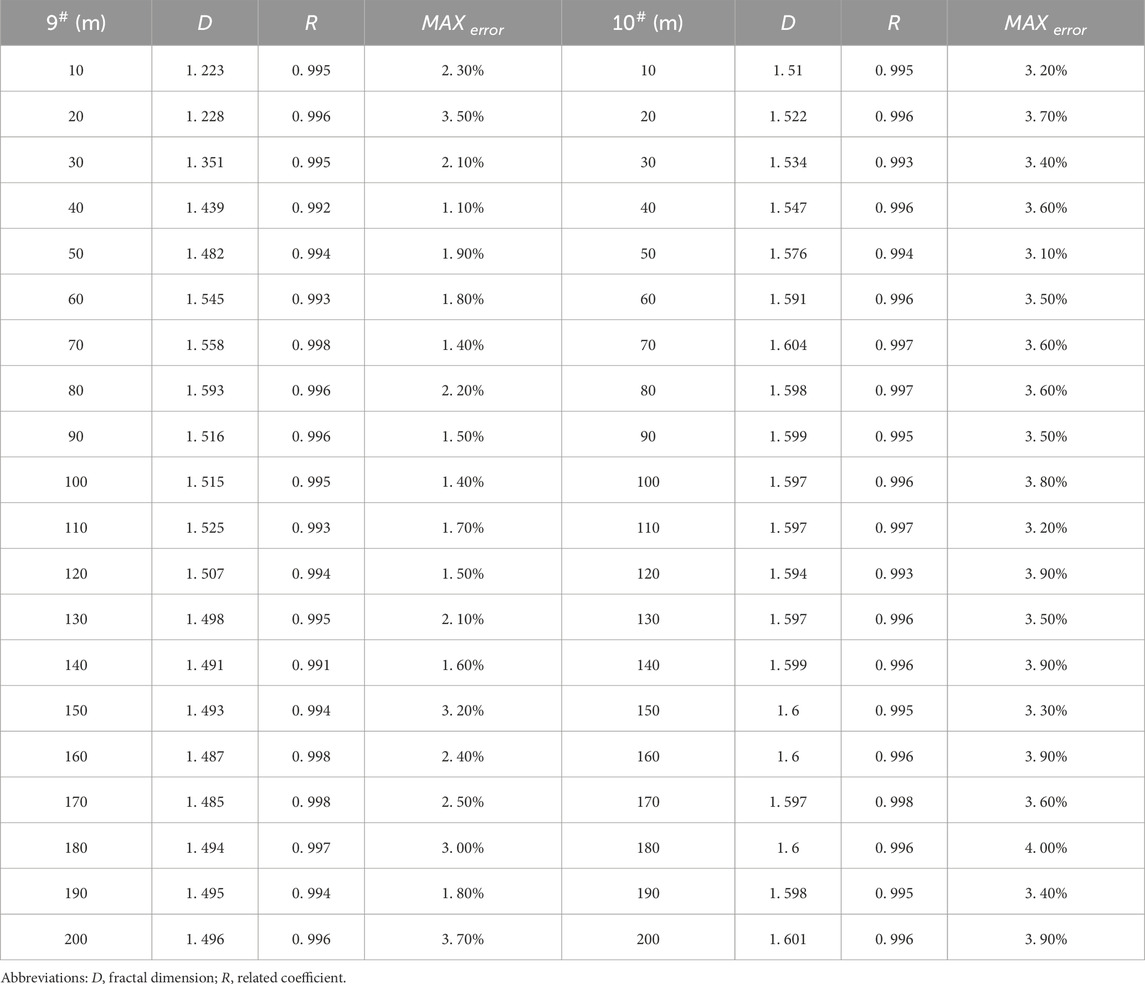
Table 2 presents data on the fractal dimension and related details regarding the development of fractures in the overlying layers at various distances from the advancing mining face.
Table 2 shows that as the working face advances in the extraction of 9# and 10# coal, the correlation coefficient for the fractal dimension of the overburden fractures exceeds 99%, suggesting strong self-similarity in the fracture evolution at various distances. The fractal dimension D is between 1.223 and 1.604.
3.4.2 Fractal development traits of fractures in the overlying rock
As the working face progresses, the fractal dimension of fractures in the overlying rock generally increases (Figure 8). Throughout the experiment, the upper and lower coal layers were mined 19 times, with each dig progressing 10 m.
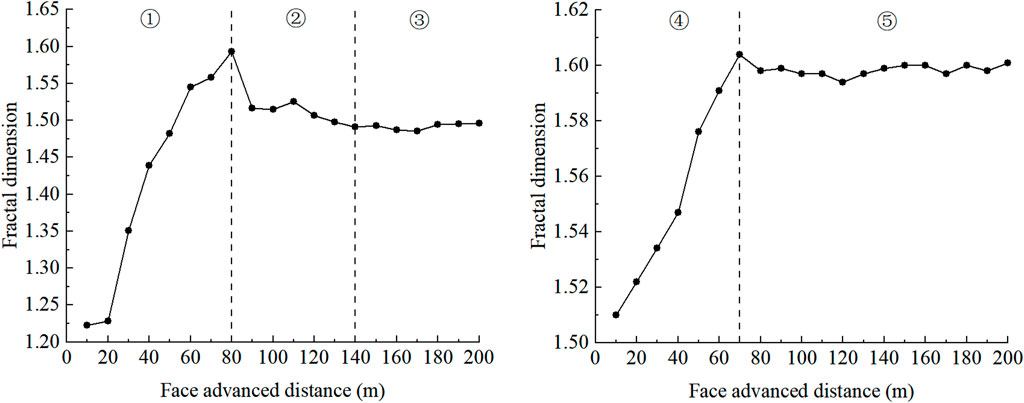
Figure 8. Illustrates the correlation between the progression distance of the working face and the fractal dimension.
By examining Table 2 and Figure 8, the progression of fractures in the overlying strata can be categorized into five distinct phases.
(1) During the initial phase of mining a single coal seam, with an advance of up to 80 m, the fractal dimension rapidly rises from 1.223 to 1.593. At this phase of extracting the 9# coal seam, the ongoing progress of the work front leads to the collapse of the immediate roof. As the mining front progresses, the primary roof fractures and falls. At this time, the full mining state is not reached; new fissures are continuously generated, and old fissures remain open, resulting in a complex fracture network and rapid growth of the fractal dimension.
(2) Decline Stage of Fractal Dimension during Single Coal Seam Mining (Advancing Distance 80–140 m): The fractal dimension decreases from 1.593 to 1.491. As the work front progresses, certain cracked zones are slowly compressed by recurring pressure, which hinders the formation of additional fractures. In the central region of the goaf, the majority of transverse breaks in the upper layers become compacted and sealed, which decreases the total fracture volume and leads to a decline in the fractal dimension.
(3) Steady Phase of Fractal Dimension in Single Coal Seam Extraction (Progression Distance 140–190 m): The upper coal seam is fully mined, leading to a stable fractal dimension ranging from 1.487 to 1.495. At this phase, the layers above the 9# coal seam have entirely crumbled and been compressed. Fresh fissures appear on the working face’s side, while the overall progression of cracks in the overlying strata begins to stabilize.
(4) Slow Growth Stage of Fractal Dimension during Repeated Mining (Advancing Distance 10–70 m): The increase in mining distance causes the immediate roof to collapse. The previously stable overlying strata were affected by secondary disturbances from repeated mining, resulting in structural damage. Some previously closed cracks reopen, and fresh fractures form in the overburden, slowly causing the fractal dimension to rise from 1.510 to 1.604.
(5) Consistent Fractal Dimension Change during Repeated Mining (Advancement Distance 70–190 m) As the mining face progresses, the rock layers periodically break, the overlying strata become active and expand, and interlayer fractures close under pressure from the layers above. The fractal dimension fluctuates between 1.594 and 1.604 as fractures periodically develop and close.
To conclude, linking the variations in fractal dimension from the beginning to the conclusion of coal seam extraction with the fundamental fracture development process in the overlying layers demonstrates that the fractal dimension is a reliable indicator of fracture progression in the overlying strata.
3.5 Development law of overlying strata failure height
Figure 9 illustrates how the distance the working face progresses directly impacts the height of fractures resulting from the collapse of the overlying layers. By examining the process, the progression of fracture height during coal seam extraction and the failure of overlying layers can be categorized into four phases: the incubation phase, the gradual increase phase, the rapid increase phase, and the stabilization phase.
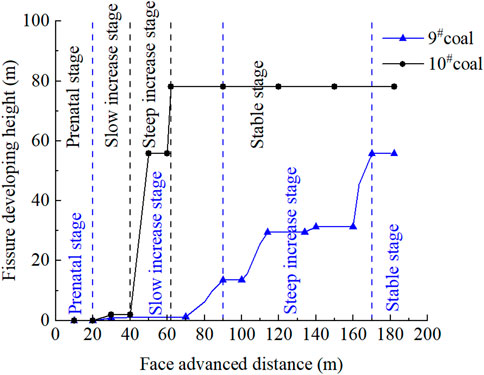
Figure 9. The development height of overburden rock fracture in the process of working face advancing.
As the upper coal seam’s working face progressed to 30 m, the overlying strata began to fail, leading to the development of fractures in the mudstone located 0.8 m above the roof. When the working face progressed to 90 m, the fracture height gradually increased, eventually attaining 13.6 m. Between 70 and 90 m, the fracture height briefly increased due to the failure of limestone in the bearing strata 13 m above the roof. Beyond 90 m of advancement, the thick and hard rock strata composed of granular sandstone and limestone in the overlying strata inhibited crack development to a certain extent. However, with increased advancement, the hanging span of the thick and hard rock strata expanded and eventually fractured, leading to rapid crack development. Upon reaching a depth of 170 m, the mining operation was fully completed, with the fracture height peaking at 55.8 m. Subsequently, the caving rock mass filled the goaf further and was compacted with the continued advancement of the working face.
Due to continuous mining, the overlying layers remained unchanged when the working face progressed to 20 m. When the distance increased to 30 m, small fissures emerged 2 m into the interval rock layers, and the fracture height in the lower coal seam extended to 2 m. As the working face progressed past 40 m, the roof of the lower coal seam linked with the goaf and caving zone of the upper coal seam, leading to fluctuations in the gap within the upper coal seam goaf. The rock layer above the original goaf boundary was completely fractured under repeated mining, resulting in a clear overburden bed separation structure and severe subsidence. The highest point of the overburden failure crack extended 78.1 m above the roof of the lower coal seam. As the working face progressed to 62 m, the fracture height stayed constant at 78.1 m above the coal seam roof. As the roof collapsed, fracture bed separation increased due to a 36-m-thick mudstone layer, forming a key stratum bearing the load above.
In the downward mining of extremely close coal seams, the overlying strata failure and fracture development are more severe in mining lower coal seams than upper coal seams. The primary reason is that repeated mining disturbs the broken rock blocks that have caved and compacted stably in the upper part. This disturbance causes the formed rock beam structure to reach its bearing limit, resulting in more severe rock breaking.
4 Prediction of development height of water-conducting fracture in overlying strata based on rock tensile rate
4.1 Analysis of rock tensile rate
Mining the coal seam results in an open area, causing the roof rock layer to be uncovered and left hanging. As the working face progresses, the roof rock layer ultimately reaches its maximum caving distance and then fractures or falls. Due to rock fragmentation and expansion characteristics, the goaf accumulates fallen rocks, gradually reducing the free space. Under self-weight and the pressure from the upper overlying strata, the conditions for further collapse of the rock strata in the limited free space are not met. However, this can cause the fractured, broken, and interlocking rock strata above the caving zone to undergo bending and stretching.
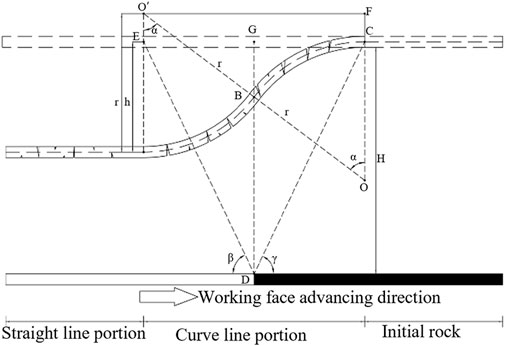
When the rock strata’s tensile rate exceeds the limit of tensile deformation, cracks develop. The magnitude of the tensile change in the rock strata reflects the degree of bending deformation and fracture development. Figure 10 displays the computational model that demonstrates this procedure.
The variation in the tensile strength of the rock layer can be represented by its tensile rate, determined using Equation 2:
In the formula: l0 is the length before the rock failure, m; l1 is the arc length after the rock failure, m. For the calculation of l1 and l0, see Equations 3, 4.
In the Equation, H represents the height from the coal seam’s roof, h0 denotes the rock layer’s thickness, hi indicates the thickness of the underlying rock layer, m; β stands for the full mining angle, γ signifies the boundary angle; hl is the measure of rock subsidence, m.
As the mining front progresses, the void left behind is packed with fragmented rock, leading to the bending, subsidence, and fracturing of the layers above. After mining reaches equilibrium, the maximum height of the fracture zone is established by the final point of fracture progression. The ability of the rock strata to move freely is a critical factor influencing the generation, development, and penetration of rock fissures. The greatest sinking of the central layer in a rock formation can be determined by utilizing the remaining expansion coefficient and the height of the roof for each rock layer.
As the overlying strata move further away from the goaf, the fragmentation of the fractured rock blocks increases, and the expansion coefficient decreases. Once mining stabilizes, the residual bulking coefficient directly affects the subsidence height of the rock strata within the fracture zone. Because the residual bulking coefficient of the rock mass varies across different layers in the fracture zone and cannot be directly measured, the average bulking coefficient of these layers is used instead. According to the study (Guo et al., 2002), the residual bulking coefficient decreases gradually as a logarithmic function. Equation 5 is used to determine the typical bulking coefficient of the rock layers.
In the Equation, KP represents the mean expansion coefficient, KZ denotes the bulking coefficient of the lower immediate roof, and hm is the separation between the rock layer and the coal seam being mined, m.
Hence, the greatest sinking of a rock layer is determined using Equation 6 (Huang et al., 2010):
In this Equation, hli represents the subsidence height of the i layer within the water-conducting fractured zone, m; M denotes the mining height of the coal seam, m; KPz and KPj are the average expansion coefficients for the lower layers z and j, respectively; hz indicates the thickness of the immediate roof of the lower z layer, m; and hj indicates the thickness of the immediate roof of the lower j layer, m.
4.2 Prediction results and analysis
Considering the engineering context of the 9# and 10# coal seams at Nanyaotou Coal Industry, with a mere 5.0-m gap between them, the water-conducting fracture zone height for the 10# seam is determined as though it were a single seam. The overburden roofs of the 9# and 10# coal seams are classified as hard strata, with a cumulative mining thickness of 4.0 m.
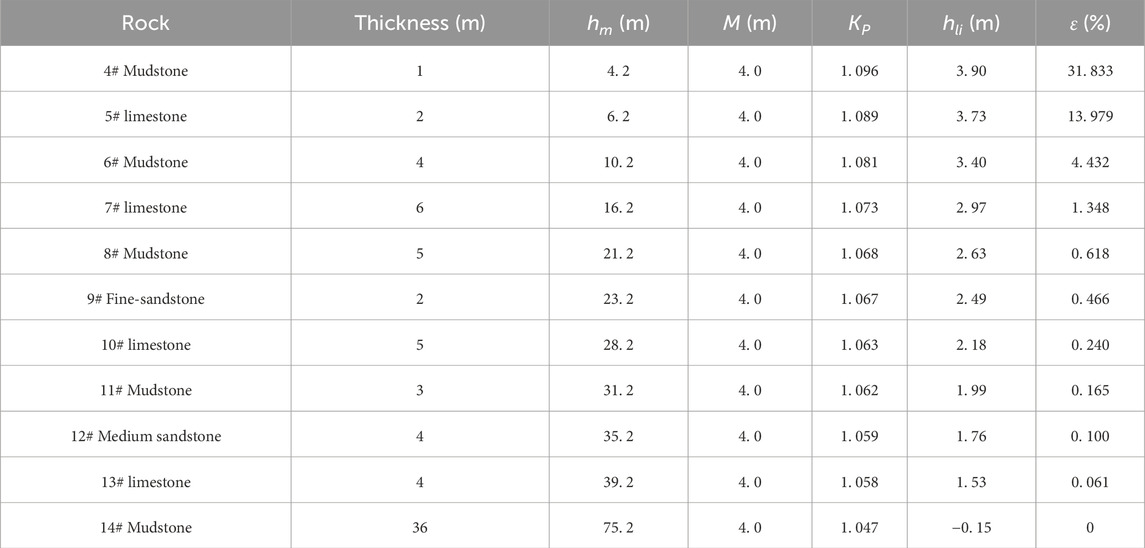
According to the Code for Designing Pillars for Buildings, Water Bodies, Railways and Main Roadways and Mining under Protected Pillars (National Coal Industry Bureau, 2017), the values for hard layers are cotβ = cotγ = 0.643, and the direct roof expansion factor for the 10# coal seam is KZ = 1.12. Using these conditions, the maximum subsidence value and rock tension rate of different rock strata are calculated and presented in Table 3.
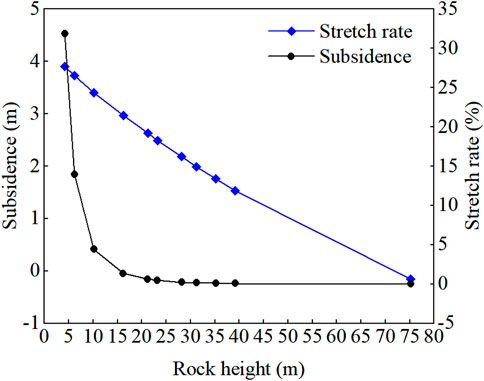
According to Table 3, through statistical analysis of the biggest sinking value of each rock layer and the rock tension rate, the curve relationship between the height of the rock layer and the biggest sinking value and the tensile rate of the rock layer is obtained (Figure 11).
The rock tensile rate calculation parameters indicate the fracture’s location and distribution. From Table 3, it can be observed that the subsidence of 14# mudstone is −0.15 m. The above phenomenon shows that after coal seam mining, the goaf is filled with collapsed rock strata, which does not provide sufficient free space for the subsidence of the rock strata above 14# mudstone.
The graph indicates that as the rock layer becomes thicker, the inverse relationship between its maximum subsidence and tensile rate weakens. The formation of the water-conducting fracture zone advances upward from the base to the top of the work area. Between 7# mudstone and 14# mudstone, the tensile rate of the rock layer decreases from 1.348% to 0%, with the decline curve in this rock layer range tending to be gentle. The variation in the tensile rate of the upper rock layer is minimal and tends to zero as the height of the rock layer rises. This indicates that the bending degree of the rock layer is relatively consistent and almost linear. As a result, the top section of the rock stratum has largely detached from the area where the water-conducting fractures develop.
Studies indicate a correlation between rock type and the critical tensile rate of rock layers (Gao et al., 2012): for hard rock, it is below 0.04%; for medium-hard rock, it falls between 0.10% and 0.24%; and for weak rock, it exceeds 0.40%. Based on the above analysis, it is considered that part of the 14# mudstone area and the strata below it is classified as a water-conducting fracture zone, with a development height of 71.99 m.
The results of the simulation test and theoretical model prediction are influenced by experimental conditions, parameter selection, and the interaction between rock strata, leading to differences in the fracture development height observed in the experiment compared to theoretical predictions. The maximum development height of overlying strata fractures obtained by the theoretical calculation model and simulation test is 71.99 m and 78.1 m, respectively, with a relatively small difference between them. In the simulation test, as the working face advances, the goaf is gradually filled with broken rock, and the overlying strata bend and sink under the action of self-weight and pressure, which is consistent with the hypothesis of strata subsidence and fracture development in the theoretical model. Additionally, the increasing trend in the development height of water-conducting fractures observed in the simulated test is similar to that predicted by the theoretical model. Although there are some differences in the results, the consistency in the overall trend strongly confirms the correlation between the two. It provides reliable support for predicting the development height of water-conducting fractures using theoretical models.
5 In-situ measurement
5.1 Construction parameter
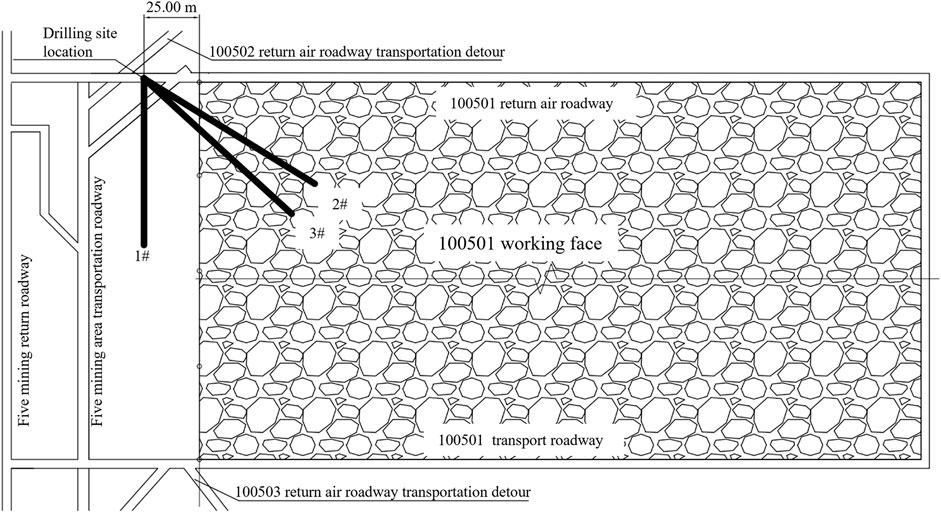
A system for detecting leaks and plugging both ends was utilized to measure the height of water-flow fractures in the layers above. A borehole field of three boreholes was established approximately 25 m from the stop line of the 100,501-working face. Boreholes 2# and 3# were employed for post-extraction monitoring to examine the progression of fractures caused by mining, whereas borehole 1# acted as a control to monitor the natural rock fractures. The extent of water-conducting fractures in the overlying layers was established by analyzing the data collected from boreholes 1#, 2#, and 3#.
The borehole parameters, detailed in Table 4, were established by considering the anticipated height of the water-conducting fracture zone, the chosen borehole site, the boreholes' observation range, and factors such as construction ease and other relevant conditions. The location of the bore-holes is depicted in Figure 12.
5.2 Borehole leakage observation
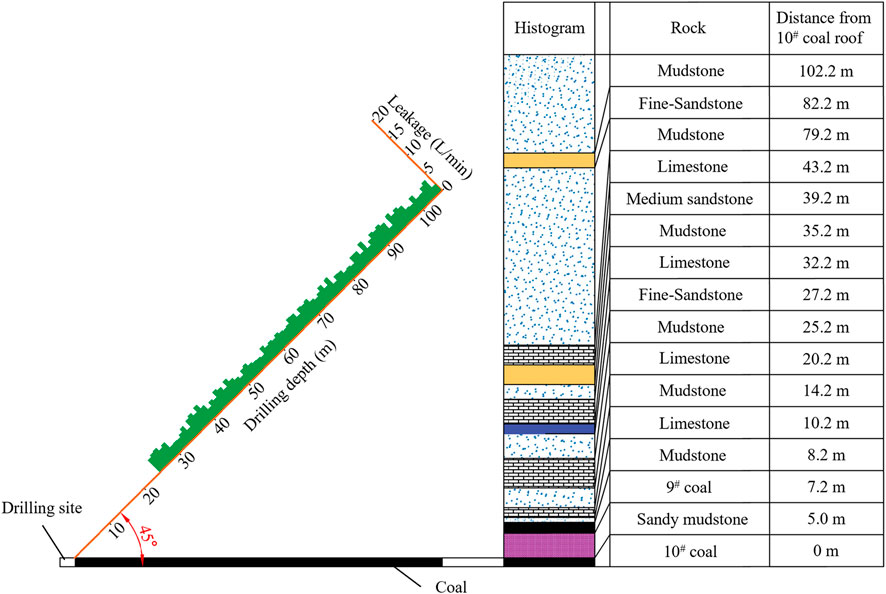
The 1# control borehole is situated above a solid coal pillar, where the overlying strata are relatively stable with no observed collapse. The injection rates of borehole water in each segment of this borehole remain consistent, varying between 1.9 and 4.7L per minute, and never exceeding 5 L per minute. This indicates that the rock strata surrounding the control borehole remain intact, which provides a comparison and guidance for the observations from boreholes 2# and 3# (Figure 13).
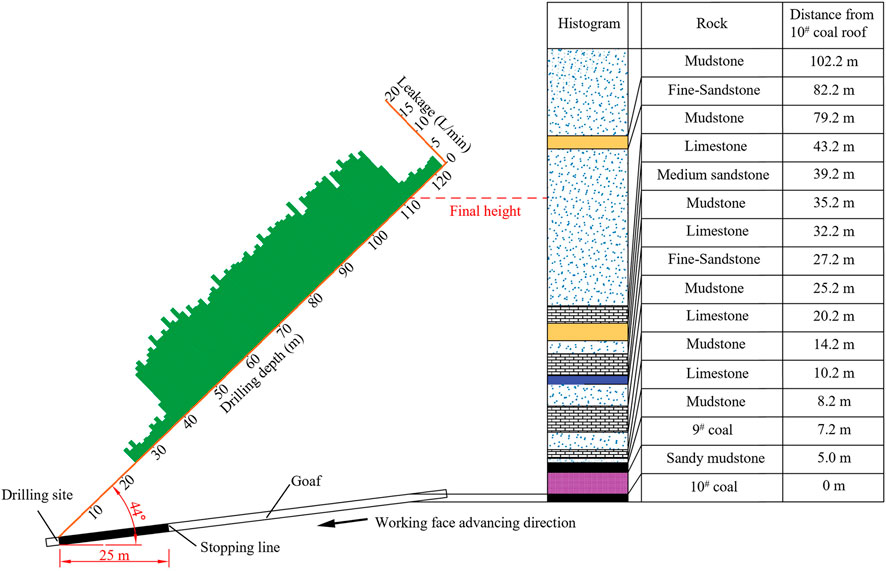
In borehole 2#, the water injection leakage varies between 2.2 and 4.5 L per minute at depths spanning 25–37 m (15.16–22.43 m above the coal seam roof), showing a mostly steady pattern with occasional slight surges caused by primary fractures. This indicates that this section is not within the development area of water-conducting fractures. Between 38 and 112 m deep (23.04–67.88 m above the coal seam roof), the leakage rate rises sharply from 4.5 L/min to 19.7 L/min, suggesting that this portion of the rock layers is within the zone of water-conducting fractures. The seepage diminishes swiftly at depths ranging from 113 to 122 m (68.49–73.49 m below the coal seam roof), and the rate of leakage per unit also drops significantly. Ranging from 2.2 to 4.5 L/min, this suggests that the area lies beyond the development zone of the water-bearing fractures. Analyzing the changes in leakage and the position of significant inflection points, the highest position of water-conducting fracture development observed by borehole one# is at a depth of 112 m, corresponding to a development height of 67.88 m (Figure 14).
In borehole 3#, the water injection leakage varies between 2.1 and 4.3 L/min at depths of 25–39 m (15.16–23.64 m above the coal seam roof), suggesting that this segment lies beyond the zone where water-conducting fractures are present. When situated 40–110 m below the sur-face (24.51–66.67 m from the top of the coal seam), the leakage rate rises markedly to between 6.7 and 19.5 L per minute, suggesting that this area lies within the zone of water-conducting fractures. The rate of leakage diminishes quickly at depths ranging from 111 to 122 m (67.27–73.49 m below the coal seam roof). Ranging from 2.2 to 4.5 L/min, this suggests that the area lies be-yond the scope of water-bearing fractures. Analyzing the location of significant inflection points in leakage changes, the highest position of water-conducting fracture development observed by borehole two# is at a depth of 110 m, with the corresponding rock layer being mudstone, resulting in a maxi-mum development height of 66.67 m (Figure 15).
To sum up, mining coal seams causes extensive harm and the formation of fractures that con-duct water. The significant leakage and large changes observed in boreholes 2# and 3# are compared with the small, stable leakage rates in the undamaged 1# control borehole. This analysis helps identify the height range of water-conducting fractures, which spans from 66.67 to 67.88 m.
6 Conclusion
(1) Under the condition of extremely close-distance coal seam mining, when the upper coal seam is mined, the failure structure of the overlying strata is mainly hinged structure and step structure; during the mining of the lower coal seam, due to the thin interval rock layer between the two layers of coal, the thickness of the lower coal seam is small, and the first breaking and sinking of the interval layer is presented in the form of transfer rock beam. Due to the existence of hinged structure and step structure, the subsidence curve of overlying strata presents a nearly linear section in the middle of the goaf, with inclined sections on both sides.
(2) In the process of mining, the breaking of the bearing strata one by one causes the height of the fractured water-conducting fracture zone to rise in four stages: gestation, slow increase, excessive in-crease, and stability. Under the action of repeated mining, the stable rock beam structure reaches the bearing limit, causing the rock stratum to break and sink more violently, and making the development of the separation layer more obvious. Finally, the water-conducting fracture stops developing under the influence of the key stratum (thick mudstone).
(3) Through the comparative analysis of similar material simulation, theoretical analysis results, and measured height of water-conducting fracture zone, the errors are 16.09% and 7.0% respectively, which verifies the accuracy and applicability of the simulation test and theoretical calculation for the development of water-conducting fractures in very close coal seams, and provides a reference for other mines with similar conditions to prevent water disaster threats and ensure efficient mining.
Data availability statement
The raw data supporting the conclusions of this article will be made available by the authors, without undue reservation.
Author contributions
DY: Funding acquisition, Project administration, Writing–original draft, Writing–review and editing, Methodology. YS: Conceptualization, Investigation, Software, Writing–original draft, Writing–review and editing, Methodology. JX: Conceptualization, Validation, Writing–review and editing. LZ: Supervision, Writing–review and editing.
Funding
The author(s) declare that financial support was received for the research, authorship, and/or publication of this article. The authors declare financial support was received for the research, authorship, and publication of this article. The research received the financial support provided by the National Natural Science Foundation of China (Grant No. 52104081), and the Funded by Science and Technology Project of Hebei Education Department (Grant No. BJK2023080), and the Hebei Natural Science Foundation (E2022402031).
Acknowledgments
Many thanks are due to the National Natural Science Foundation of China (52104081), the Funded by Science and Technology Project of Hebei Education Department (BJK2023080), and the Hebei Natural Science Foundation (E2022402031).
Conflict of interest
The authors declare that the research was conducted in the absence of any commercial or financial relationships that could be construed as a potential conflict of interest.
Publisher’s note
All claims expressed in this article are solely those of the authors and do not necessarily represent those of their affiliated organizations, or those of the publisher, the editors and the reviewers. Any product that may be evaluated in this article, or claim that may be made by its manufacturer, is not guaranteed or endorsed by the publisher.
References
Cul, Z. Z., and Cul, S. B. (2021). Development characteristics of “two zones” of overburden in Yili mining area and its influence on water inrush of working face. Coal Eng. 53 (07), 102–107.
Fan, K. F., Wang, Q. Q., Li, W. P., and Chen, Y. Y. (2023). Development process and height of the mining-induced water fractured zone over the longwall goaf. Water Supply 23 (2), 779–795. doi:10.2166/ws.2023.010
Gao, Y. F., Huang, W. P., Liu, G. L., Zhang, S. F., Zhu, Q. M., and Deng, Z. Y. (2012). The relationship between permeable fractured zone and rock stratum tensile deformation. J. Min. Saf. Eng. 29 (3), 301–306.
Guo, G. L., Miao, X. X., and Zhang, Z. N. (2002). Research on ruptured rock mass deformation characteristics of longwall goafs. Sci. Technol. Eng. 2 (5), 44–47.
Huang, B. X., Liu, C. Y., and Xu, J. L. (2010). Research on through degree of overlying strata fracture fissure induced by mining. J. China Univ. Min. and Technol. 39 (1), 45–49.
Lai, X. P., Zhang, X. D., Shan, P. F., Cui, F., Liu, B. W., and Bai, R. (2021). Study on development law of water-conducting fractures in overlying strata of three soft coal seam mining under thick loose layers. Chin. J. Rock Mech. Eng. 40 (09), 1739–1750. doi:10.13722/j.cnki.jrme.2021.0210
Li, S. Q., He, X. Q., Li, S. Q., Zhang, S. J., Yan, Z., Xie, Q. X., et al. (2013). Experimental research on strata movement and fracture dynamic evolution of double pressure-relief mining in coal seams group. J. China Coal Soc. 38 (12), 2146–2152. doi:10.13225/j.cnki.jccs.2013.12.019
Liu, J. X., Zhang, S. C., Shen, B. T., Xiao, Y., Li, Y. Y., and Zhang, Y. C. (2024). Study on fractal characteristics of fracture network in overlying strata mining under different breaking distances. J. Shandong Univ. Sci. Technol. Nat. Sci. 43 (01), 11–21. doi:10.16452/j.cnki.sdkjzk.2024.01.002
National Coal Industry Bureau (2017). Code for Designing pillars for Buildings, water Bodies, Rail-ways and main Roadways and mining under Protected pillars. Beijing: Coal Industry Press.
Pan, R. K., Cao, S. G., Li, Y., and Li, G. D. (2018). Development of overburden fractures for shallow double thick seams mining. J. China Coal Soc. 43 (08), 2261–2268. doi:10.13225/j.cnki.jccs.2017.1337
Qiao, W., Wang, Z. W., Li, W. P., Lyu, Y. G., Li, L. G., Huang, Y., et al. (2021). Formation mechanism, disaster-causing mechanism and prevention technology of roof bed separation water disaster in coal mines. J. China Coal Soc. 46 (02), 507–522. doi:10.13225/j.cnki.jccs.XR20.1972
Qiu, M., Xu, G. R., Song, G. Y., and Shi, L. Q. (2023). Research on application of PCA-WNN model in predicting the development height of water-flowing fractured zones. J. Henan Poly-technic Univ. Nat. Sci. 42 (06), 27–36. doi:10.16186/j.cnki.1673-9787.2022070055
Song, D., Han, B., Liu, S. L., Li, N. B., Geng, F., and Hou, X. Z. (2020). Neural network–based prediction methods for height of water-flowing fractured zone caused by underground coal mining. Arabian J. Geosciences 13, 1–11. doi:10.1007/s12517-020-05505-5
Sun, Y. N., Zhang, P. S., Yan, W., Zhao, Y. P., Yan, F. Q., and Wu, J. D. (2020). Experimental study on overburden movement and stress variation of coal seam mining with Associated step Faults. Saf. Coal Mines 51 (07), 48–54+60. doi:10.13347/j.cnki.mkaq.2020.07.010
Tian, H., Yang, J. Y., Han, Q. Q., Li, J. F., and Xin, T. (2021). Prediction of impact of coal mining on groundwater. Coal Technol. 40 (12), 110–114. doi:10.13301/j.cnki.ct.2021.12.026
Wang, H. B., Zhang, Y., Pang, Y. H., and Jia, Y. (2022b). Prediction model of the height of fractured zone in abandoned goaf and its application. Rock Soil Mech. 43 (04), 1073–1082. doi:10.16285/j.rsm.2021.1183
Wang, H. B., Zhang, Y., Pang, Y. H., and Zhang, C. L. (2022a). Evolution of the height of overburden fractured zone based on stage characteristics of surface subsidence. J. China Univ. Min. and Technol. 51 (01), 24–34. doi:10.13247/j.cnki.jcumt.001361
Xia, X. G., and Huang, Q. X. (2014). Study on the dynamic height of caved zone based on porosity. J. Min. and Saf. Eng. 31 (1), 102–107. doi:10.13545/j.issn1673-3363.2014.01.017
Xu, J. L., Zhu, W. B., and Wang, X. Z. (2012). New method to predict the height of fractured water-conducting zone by location of key strata. J. China Coal Soc. 37 (5), 762–769. doi:10.13225/j.cnki.jccs.2012.05.002
Xu, J. L., Zhu, W. B., Wang, X. Z., and Yin, M. S. (2009). Classification of key strata structure of overlying strata in shallow coal seam. J. China Coal Soc. 34 (07), 865–870.
Xun, B. H., and Lyu, Y. Q. (2021). Research on evolution law of overburden cracks in shallow and Gently inclined coal seams under repeated mining conditions. Coal Technol. 40 (12), 15–19. doi:10.13301/j.cnki.ct.2021.12.004
Yang, D. M., Guo, W. B., Zhao, G. B., Tan, Y., and Yang, W. Q. (2019). Height of water-conducting zone in longwall top-coal caving mining under thick alluvium and soft overburden. J. China Coal Soc. 44 (11), 3308–3316. doi:10.13225/j.cnki.jccs.2018.8043
Yin, S. X., Wang, Y. G., and Li, W. S. (2021). Coal. Cause, countermeasures and solutions of water hazards in coal mines in China. Coal Geol. and Explor. 51 (01), 214–221.
Zhao, B. C., Feng, J., Zhao, Y., Ma, Y. X., Hou, E. K., Sun, H., et al. (2023). Prediction on development height of water flowing fractured zone based on curvature deformation of rock. Coal Eng. 55 (04), 107–112.
Zhao, Y. X., Ling, C. W., Liu, B., and He, X. (2021). Fracture evolution and energy dissipation of overlying strata in shallow-buried underground mining with ultra-high working face. J. Min. and Saf. Eng. 38 (01), 9–18+30. doi:10.13545/j.cnki.jmse.2020.0212
Zhu, D. F., Yu, B. B., Wang, D. Y., and Zhang, Y. J. (2024). Fusion of finite element and machine learning methods to predict rock shear strength parameters. J. Geophys. Eng. 21, 1183–1193. doi:10.1093/jge/gxae064
Keywords: extremely close distance coal seam, fracture evolution, repeated mining, fractal dimension, similar materials, field measurement
Citation: Yang D, Sun Y, Xu J and Zhao L (2024) Study on the evolution of fractures in overlying strata during repeated mining of coal seams at extremely close distances. Front. Earth Sci. 12:1472939. doi: 10.3389/feart.2024.1472939
Received: 30 July 2024; Accepted: 09 September 2024;
Published: 19 September 2024.
Edited by:
Tianshou Ma, Southwest Petroleum University, ChinaReviewed by:
Yan Peng, China University of Petroleum, Beijing, ChinaLiuke Huang, Southwest Petroleum University, China
Copyright © 2024 Yang, Sun, Xu and Zhao. This is an open-access article distributed under the terms of the Creative Commons Attribution License (CC BY). The use, distribution or reproduction in other forums is permitted, provided the original author(s) and the copyright owner(s) are credited and that the original publication in this journal is cited, in accordance with accepted academic practice. No use, distribution or reproduction is permitted which does not comply with these terms.
*Correspondence: Yun Sun, c3kxNjIzMzBAb3V0bG9vay5jb20=
 Daming Yang
 Yun Sun
 Jiabo Xu